13-1 Chapter 13 Sampling: Final and Initial Sample-Size Determination.
24
13-1 Chapter 13 Sampling: Final and Initial Sample-Size Determination
Transcript of 13-1 Chapter 13 Sampling: Final and Initial Sample-Size Determination.

13-1
Chapter 13
Sampling: Final and Initial
Sample-Size Determination

Copyright © 2011 Pearson Education, Inc.
Figure 13.1 Relationship of Sample Size Determination to the Previous Chapters and the Marketing Research Process
Chapter 13 - 2
Focus of this Chapter
Relationship toPrevious Chapters
• Statistical Approach to Determining Sample Size
• Adjusting the Statistically Determined Sample Size
• Research Design Components (Chapter 3)
• Sampling Design Process (Chapter 12)
Approach to Problem
Field Work
Data Preparation and Analysis
Report Preparationand Presentation
Research Design
Problem Definition
Relationship to MarketingResearch Process

Copyright © 2011 Pearson Education, Inc.
Figure 13.2 Final and Initial Sample Size Determination: An Overview

Copyright © 2011 Pearson Education, Inc.
Be
a D
M!
Be
an M
R!
Exp
erie
nti
al L
earn
ing
Wh
at Wo
uld
Yo
u D
o?
Opening Vignette
Application to Contemporary Issues (Fig 13.5)
International Social Media Ethics
Definitions and Symbols (Table 13.1)
The Sampling Distribution(Figs 13a.1-13a.3) (Appendix 13a)
Statistical Approach to Determining Sample Size (Fig 13.3)
Confidence Interval Approach(Fig 13.4) (Table 13.2)
Adjusting the Statistically Determined Sample Size
Means Proportions
Chapter 13 - 4

Copyright © 2011 Pearson Education, Inc.
Parameter: A parameter is a summary description of a fixed characteristic or measure of the target population.A parameter denotes the true value which would be obtained if a census rather than a sample was undertaken.
Statistic: A statistic is a summary description of a characteristic or measure of the sample. The sample statistic is used as an estimate of the population parameter.
Random sampling error: The error when the sample selected is an imperfect representation of the population of interest.
Definitions and Symbols
Chapter 13 - 5

Copyright © 2011 Pearson Education, Inc.
Precision level: When estimating a population parameter by using a sample statistic, the precision level is the desired size of the estimating interval. This is the maximum permissible difference between the sample statistic and the population parameter.
Confidence interval: The confidence interval is the range into which the true population parameter will fall, assuming a given level of confidence.
Confidence level: The confidence level is the probability that a confidence interval will include the population parameter.
Definitions and Symbols (Cont.)
Chapter 13 - 6

Chapter 13 -7
Table 13.1Symbols for Population and Sample Variables
Variable Population Sample
Mean μ
Proportion π p
Variance
Standard deviation σ s
Size N n
Standard error of the mean
Standard error of the proportion
Standardized variate (z)
Copyright © 2011 Pearson Education, Inc.

Copyright © 2011 Pearson Education, Inc.
Figure 13.3 The Confidence Interval Approach and Determining Sample Size
Confidence IntervalApproach
Means Proportions
Chapter 13 - 8

.
The Confidence Interval Approach
Chapter 13 - 9
z
Copyright © 2011 Pearson Education, Inc.

Copyright © 2011 Pearson Education, Inc.
The Confidence Interval Approach (Cont.)
Chapter 13 - 10

Copyright © 2011 Pearson Education, Inc.
The Confidence Interval Approach (Cont.)
Chapter 13 - 11
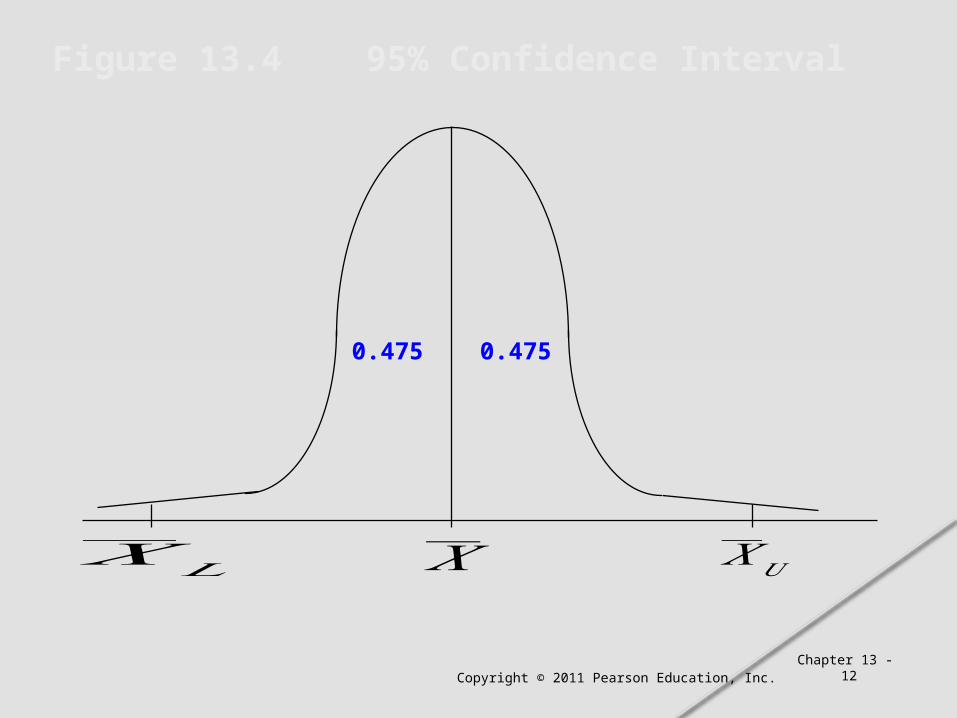
The confidence interval is given by
We can now set a 95% confidence interval around the sample mean of $182.
The 95% confidence interval is given by
= 182.00 + 1.96(3.18) = 182.00 + 6.23
Thus the 95% confidence interval ranges from $175.77 to $188.23.
Copyright © 2011 Pearson Education, Inc.
Figure 13.4 95% Confidence Interval
0.475 0.475
Chapter 13 - 12
𝑋 𝑋𝑈𝑋𝐿
Chapter 13 - 13Copyright © 2011 Pearson Education, Inc.
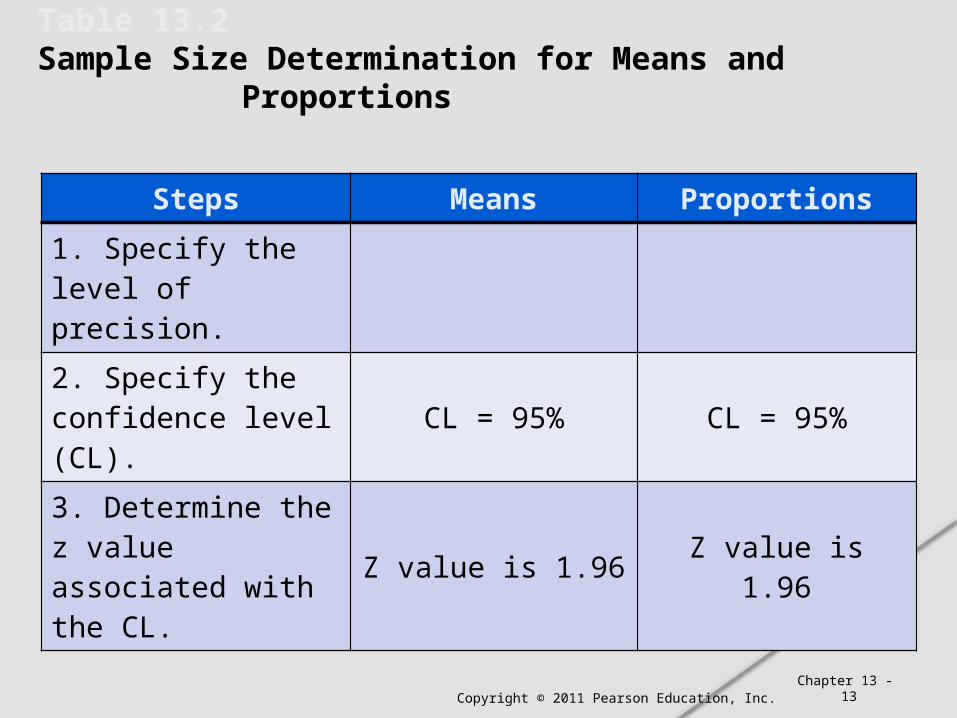
Table 13.2Sample Size Determination for Means and Proportions
Steps Means Proportions
1. Specify the level of precision.
2. Specify the confidence level (CL).
CL = 95% CL = 95%
3. Determine the z value associated with the CL.
Z value is 1.96 Z value is 1.96

Chapter 13 -14Copyright © 2011 Pearson Education, Inc.
Table 13.2 (Cont.)Sample Size Determination for Means and Proportions
Steps Means Proportions
4. Determine the standard deviation of the population
Estimate σσ = 55
Estimate ππ = 0.64
5. Determine the sample size using the formula for the standard error
6. If necessary, reestimate the confidence interval by employing s to estimate σ

4-15
A sample size of 400 is enough to represent China’s more than 1.3 billion people or the more than 300 million American people.
The sample size is independent of the population size for large populations.

Copyright © 2011 Pearson Education, Inc.
Adjusting the Statistically Determined Sample Size
Incidence rate refers to the rate of occurrence or the percentage of persons eligible to participate in the study.
In general, if there are c qualifying factors with an incidence of Q1, Q2, Q3, ...QC, each expressed as a proportion,
Incidence rate = Q1 x Q2 x Q3....x QC
Initial sample size = Final sample size
Incidence rate x Completion rate
Chapter 13 - 16

Chapter 13-17Copyright © 2011 Pearson Education, Inc.

Copyright © 2011 Pearson Education, Inc.
International Marketing Research
When conducting marketing research in foreign countries, statistical estimation of sample size can be difficult, because estimates of the population variance might be unavailable.
When statistical estimation of sample size is attempted, the differences in estimates of population variance should be recognized and factored in, if possible.
When the goal is to examine differences across countries or international markets, it is desirable to have the same sample size across countries.
Chapter 13 - 18

Copyright © 2011 Pearson Education, Inc.
Marketing Research & Social Media
It is feasible to have large, even very large, sample sizes when conducting marketing research in social media.
In many social media projects, the sample size can far exceed that required by statistical considerations.
It is important to address the issues of the appropriateness and representativeness of social media as outlined in Chapter 12.
Chapter 13 - 19

Copyright © 2011 Pearson Education, Inc.
Ethics in Marketing Research
The researcher has the ethical responsibility to not use large estimates of the population variance simply to increase the cost of the project by inflating the sample size.
When the sample standard deviation varies widely from that which is assumed, the researcher should disclose the larger confidence interval to the client and jointly arrive at a corrective action.
Incorrectly reporting the confidence intervals of survey estimates based on statistical samples is unethical.
Chapter 13 - 20

Copyright © 2011 Pearson Education, Inc.
Acronym: Size
The statistical considerations involved in determining the sample size can be summarized by the acronym SIZE:
S ampling distribution
I nterval (confidence)
Z value
E stimation of population standard deviation
Chapter 11 - 21

Copyright © 2011 Pearson Education, Inc.
Figure 13A.1 Finding Probabilities Corresponding to Known Values
Area is 0.3413Area between µ and µ + 1 s = 0.3413Area between µ and µ + 2 s = 0.4772Area between µ and µ + 3 s = 0.4986
Chapter 13 - 22
X Scale μ-3σ μ-2σ μ-1σ μ μ+1σ μ+2σ μ+3σ
(μ=50,σ=5) 35 40 45 50 55 60 65
Z Scale -3 -2 -1 0 +1 +2 +3

Copyright © 2011 Pearson Education, Inc.
Figure 13A.2 Finding Values Corresponding to Known Probabilities
Area is 0.500Area is 0.450
Area is 0.050
X 50X Scale
Z = -1.645 0Z Scale
Chapter 13 - 23

Copyright © 2011 Pearson Education, Inc.
Figure 13A.3 Finding Values Corresponding to Known Probabilities:Confidence Interval
Area is 0.475Area is 0.475
X 50X Scale
Z = -1.96 0Z Scale
Area is 0.025Area is 0.025
Z = 1.96
Chapter 13 - 24