12th Regional Workshop on Forest Monitoring GEO ... - GFOI · 12th Regional Workshop on Forest...
46
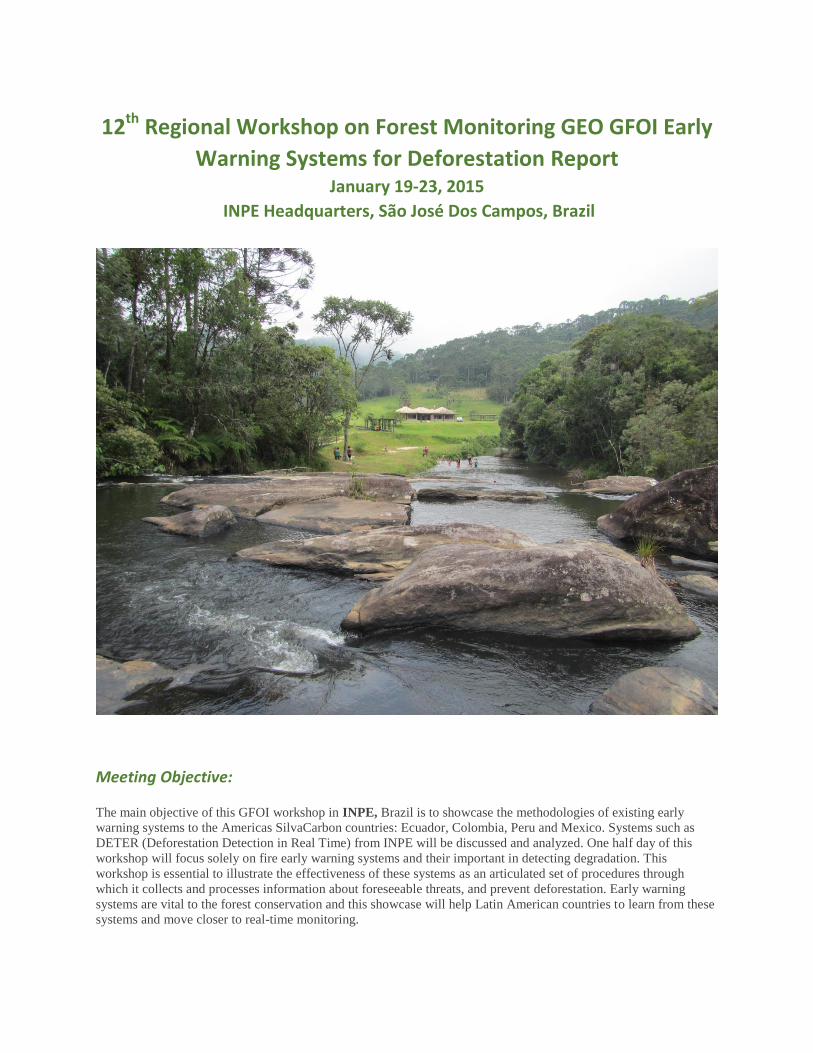
12 th Regional Workshop on Forest Monitoring GEO GFOI Early Warning Systems for Deforestation Report January 19-23, 2015 INPE Headquarters, São José Dos Campos, Brazil Meeting Objective: The main objective of this GFOI workshop in INPE, Brazil is to showcase the methodologies of existing early warning systems to the Americas SilvaCarbon countries: Ecuador, Colombia, Peru and Mexico. Systems such as DETER (Deforestation Detection in Real Time) from INPE will be discussed and analyzed. One half day of this workshop will focus solely on fire early warning systems and their important in detecting degradation. This workshop is essential to illustrate the effectiveness of these systems as an articulated set of procedures through which it collects and processes information about foreseeable threats, and prevent deforestation. Early warning systems are vital to the forest conservation and this showcase will help Latin American countries to learn from these systems and move closer to real-time monitoring.
Transcript of 12th Regional Workshop on Forest Monitoring GEO ... - GFOI · 12th Regional Workshop on Forest...
12th Regional Workshop on Forest Monitoring GEO GFOI Early
Warning Systems for Deforestation Report January 19-23, 2015
INPE Headquarters, São José Dos Campos, Brazil
Meeting Objective:
The main objective of this GFOI workshop in INPE, Brazil is to showcase the methodologies of existing early
warning systems to the Americas SilvaCarbon countries: Ecuador, Colombia, Peru and Mexico. Systems such as
DETER (Deforestation Detection in Real Time) from INPE will be discussed and analyzed. One half day of this
workshop will focus solely on fire early warning systems and their important in detecting degradation. This
workshop is essential to illustrate the effectiveness of these systems as an articulated set of procedures through
which it collects and processes information about foreseeable threats, and prevent deforestation. Early warning
systems are vital to the forest conservation and this showcase will help Latin American countries to learn from these
systems and move closer to real-time monitoring.
2
Contents
Welcome and Introductions .......................................................................................................................................... 3
SilvaCarbon Program and Global Forest Observation Initiative .................................................................................... 3
INPE’s Brazilian Amazon Forest Monitoring Program ................................................................................................... 4
INPE Assessment of Forest Degradation – DEGRAD and DETEX .................................................................................... 5
Operation Applications of Early Warning Systems- DETER-B ........................................................................................ 6
DETER-B Field Data .................................................................................................................................................... 7
Country Presentations ................................................................................................................................................... 8
Status of the MRV System and the Integration of Early Warning Systems for Deforestation in Peru ...................... 8
Status and Plans for Implementation of an Early Warning System – Colombia...................................................... 11
Early Warning Systems – Mexico ............................................................................................................................ 12
Status and Plans for Implementation of an Early Warning System – Ecuador ........................................................ 14
EWS Methodologies ..................................................................................................................................................... 17
Near Real-Time Mapping of Forest Disturbances ................................................................................................... 17
Two MODIS-Based Approaches for Monitoring Forest Change in Near Real-Time ................................................ 19
Continuous Monitoring of Forest Change in Near Real-Time with Data from the MODIS Sensors .................... 20
Near Real-Time Monitoring of Land Cover Disturbance by Fusion of MODIS and Landsat Data ....................... 21
ForWARN: A Cross-Cutting Forest Resource Management and Decision-Support System .................................... 22
Forest Change Assessment Viewer ......................................................................................................................... 24
Terra-i, A Near-Real Time Monitoring of Habitat Change ....................................................................................... 27
INDICAR ................................................................................................................................................................... 28
Early warning capacity by Synthetic Aperture Radar (SAR) .................................................................................... 29
Early Warning Systems for Fires .................................................................................................................................. 31
Firecast- Fire & Forest Monitoring & Forecasting System ...................................................................................... 31
The Global Early Warning System for Wildland Fire ............................................................................................... 32
Global Observation on Forest and Land Cover Dynamics GOFC-GOLD ................................................................... 32
Use of Active Fire Data Sets in Support of Fire Monitoring, Management and Planning ....................................... 33
Working Groups ........................................................................................................................................................... 34
Capacity Building Initiatives ......................................................................................................................................... 39
INPE Capacity Building ............................................................................................................................................ 39
Capacity building efforts FAO .................................................................................................................................. 40
ALOS PALSAR 25m Global Mosaic Data ....................................................................................................................... 42
Panel Discussion .......................................................................................................................................................... 42
Closing ......................................................................................................................................................................... 45
3
Day 1: January 19, 2015 Welcome and Introductions
The 12th Regional Workshop began with a welcome and introduction from Dalton Valeriano, the Director
of the Amazonia Program in INPE and Thelma Krug from the Office of International Cooperation in INPE.
Dalton Valeriano and Thelma Krug expressed their thanks to all for attending. Thelma Krug described the
INPE headquarters and Brazil’s approach to monitoring deforestation. Brazil uses large amounts of
Landsat imagery as a tool for monitoring and producing annual wall-to-wall assessment of deforestation.
Capacity building is highly important to reduce deforestation within the country. Brazil has been
performing capacity building with other countries and through many partnerships such as with the U.S.
and FAO to make this a reality. Thelma Krug expressed how interested the Brazilians are in seeing what
other countries are doing through this workshop.
The Consul General Dennis Hankins from the U.S. then explained the importance of having good science
behind policy. Both policy and science are essential to working towards change. Diplomats of all
countries are aware of issues and threats such as climate change and they are looking ahead to see what
can be done. Science is important to formulating the appropriate policy, and each country will decide
what is important to them.
Dennis Hankins went on to discuss Brazil and the benefits of this workshop. Brazil is currently tackling
multiple issues, and the hope is for this workshop to bring light to these difficult situations and provides
the scientific foundation necessary for moving forward.
SilvaCarbon Program and Global Forest Observation Initiative
Presenter: Doug Muchoney - SilvaCarbon, U.S.
Doug Muchoney presented on the SilvaCarbon program and the Global Forest Observation Initiative
(GFOI). Doug explained how the U.S. and Brazil have a long history of working together on many issues
including deforestation and degradation. The GFOI is a part of the Group on Earth Observations (GEO),
which is a voluntary association of governments and international organizations to leverage remote
sensing and spatial analysis for societal benefit. The goal of GEO before 2015 is to enhance the
coordination of efforts to strengthen individual, institutional and infrastructure capacities, particularly in
developing countries, to produce and use Earth observations and derived information.
GFOI has five components:
1. The coordination of satellite data supply through CEOS
a. This is fundamental to all of the GFOI objectives and CEOS supports participation from
all countries in reporting.
2. Capacity Building (U.S.)
a. This is implemented through the SilvaCarbon program, which conducts regional GFOI
workshops with the aim to showcase operational methodologies for different aspects of
forest monitoring, discuss new cutting edge research methodologies, and provide a
space for testing and demonstrating field methods using the new technologies.

4
3. Methods and Guidance Documentation (Australia)
a. The Spanish version of this document will be available in February 2015.
4. Research and Development Plan (Norway)
5. Admin and Coordination (Programme Office)
The U.S. contribution to GFOI, SilvaCarbon, works to partner with countries to improve monitoring of
forest and terrestrial carbon as well as to improve understanding of methodologies, collection, and
dissemination of data. SilvaCarbon develops regional GFOI workshops in Latin America, South East Asia,
and Central Africa. SilvaCarbon is a multi-agency program including USAID, State Department, USGS,
USFS, NASA, EPA, NOAA, Smithsonian Institute, and Universities.
The objectives of capacity building are to enhance the capacity of countries to initiate forest and
terrestrial carbon assessment and monitoring and to use management methodologies and technologies,
as well as to strengthen the community of forest and terrestrial carbon technical experts. In the future,
SilvaCarbon will work to coordinate among GEO and GFOI partners and others on the development of a
comprehensive, yet flexible capacity building strategy.
Questions/Comments:
Thelma Krug (INPE) commented that it is very nice to see a capacity building program from GFOI
that is working on each country on an individual level and then coordinating between other
countries to discuss tools and current developments. It is important to note that what may work
for one country may or may not work for another country based on the individual needs.
Ake Rosenqvist (soloEO) added that GFOI very early on decided not to focus solely on REDD+.
GFOI is focused on the data sources which are available free of charge to the countries such as
Sentinel and Landsat.
INPE’s Brazilian Amazon Forest Monitoring Program
Presenter: Dalton Valeriano - INPE, Brazil
Presently, 81% of the Amazon forest in Brazil is still intact. Deforestation has been an ongoing issue for a
very long time, and there is a need for integrative policies in order to control it. In 1965, a Brazilian
Forest Code was developed establishing a protection area of 30 meters of natural vegetation along
either side of rivers. This is a very strict code and there have been issues enforcing it. In 2012, this code
was revised, which relaxed some of the strict rules. The best thing to come from this revision was adding
a need for rural areas to register the location of the protected forest areas.
INPE’s role is to be the information provider. The organization has several programs including PRODES
for primary forest deforestation, DEGRAD for degraded forest area, and DETEX for selective logged
areas.
For PRODES, the aim of the project between 1988 and 2002 was to produce yearly gross primary forest
degradation statistics at the regional and state levels using visual image interpretation of Landsat
imagery. From 1997 to 2003, INPE developed a SPRING based system using Landsat imagery, which
involved processing steps, database preparation, image processing, editing, rate calculation, and data
5
dissemination. However, it involved multiple databases of imagery for each location which became
unmanageable. Then from 2004 to present a TerraAmazon system has been used, which is a more
manageable system involving a single unified geo-database.
There were a multitude of issues which lead to the development of TerraAmazon including the
instability of rate estimation due to clouds and image acquisition date, the compromise between
restriction of image acquisition date and availability of cloud free imagery, and the need for multi-date
capability, smaller cells and an integrated database. For the issues with clouds, TerraAmazon masks out
clouds from the imagery and then replaces the missing data for the area with another cloud free image
of a similar date.
INPE Assessment of Forest Degradation – DEGRAD and DETEX Presenter: Dalton Valeriano - INPE, Brazil
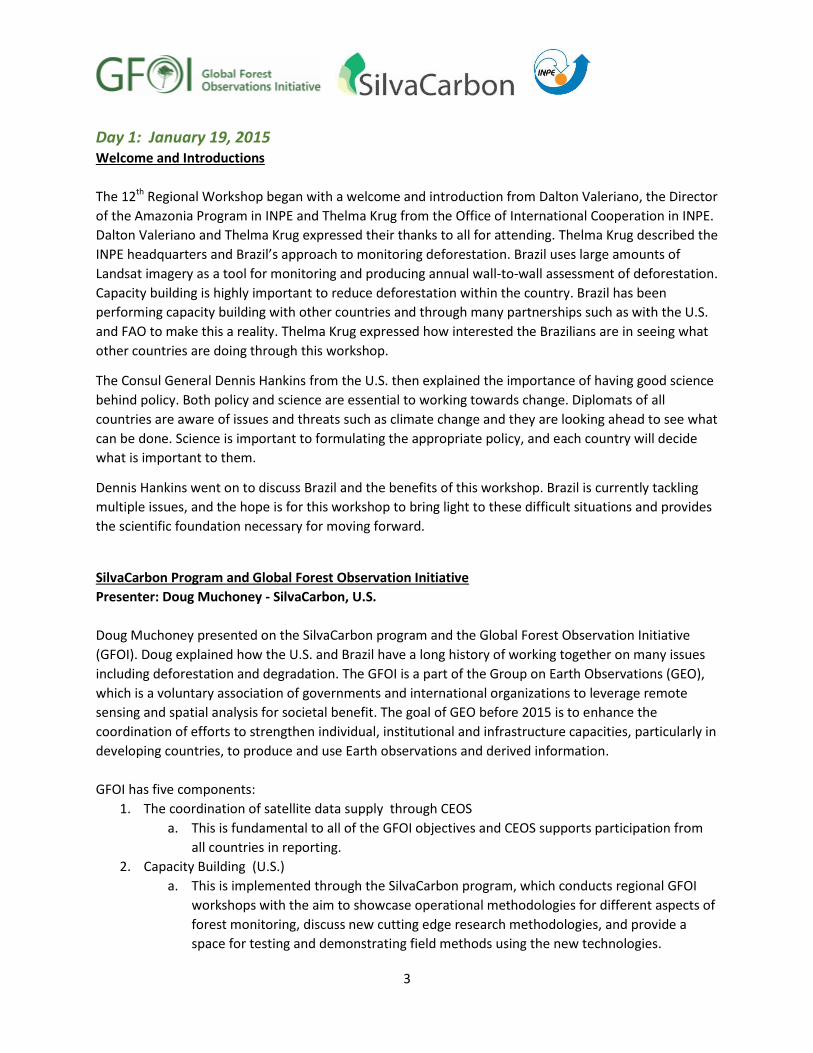
Dalton Valeriano explained the process of forest degradation to deforestation from traditional selective
logging (such as for roads), uncontrolled logging and fire (such as deliberate slash and burn), further fires
and finally to deforestation, where only dead logs remain and secondary growth is coming in behind it.
This process is shown below.
All of the INPE systems complement each other. For example, PRODES can be used to map
deforestation, while DEGRAD can map area of degradation for areas affected by uncontrolled logging
and fire and further fires. Finally, DETEX can be used to detect areas with selective logging. Though a
combination of DETER and PRODES early warning maps can be developed by analyzing time series with
DETER detecting the process of degradation and PRODES measuring the final result.
The results of DEGRAD shows hot spots, calculates the degradation areas, and analyzes the trajectories,
while DETER has the same concept, only using different data with higher frequencies. DETER exploits the
temporal resolution of MODIS, and uses the best set of MODIS True-Color Rapid Response Products.
Visual interpretation is used and is supported by PRODES and a cumulative DETER mask. The results are
then delivered to IBAMA (Brazilian environmental law enforcement authority at the federal level) within
5 days of the acquisition period.
6
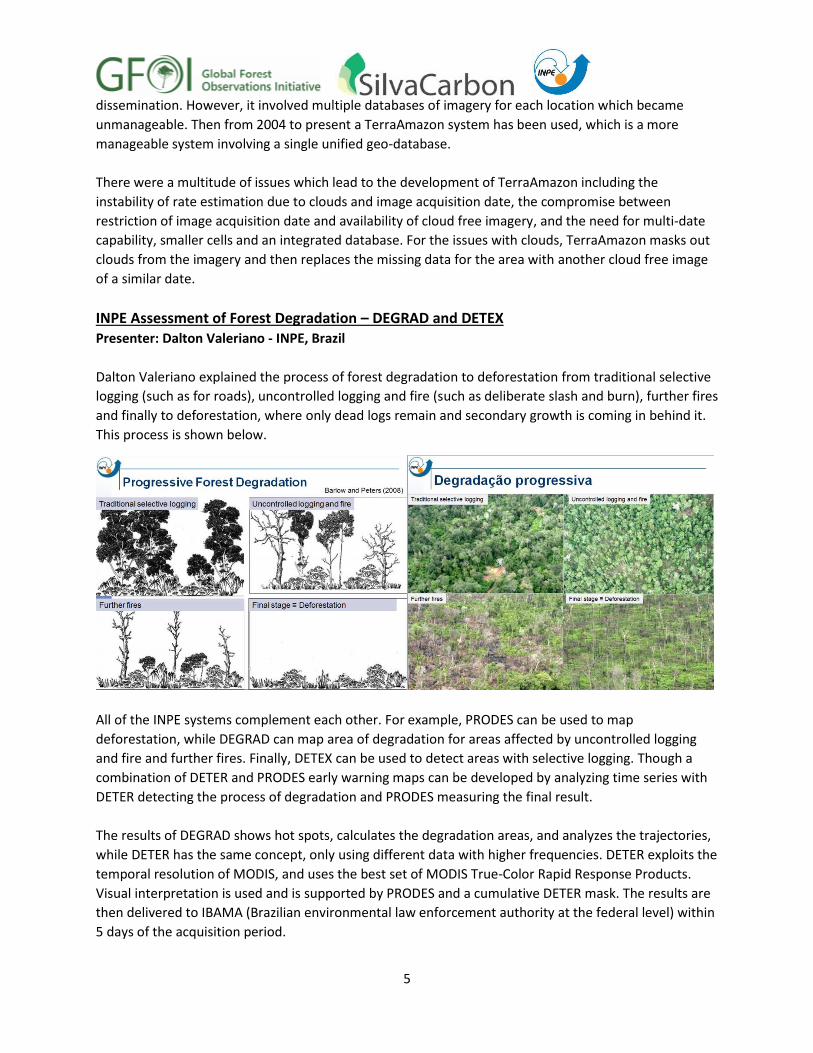
Brazil has a huge effort for
controlling deforestation, with a
large number of people involved
on both federal and local levels.
DETER is accessible by the public
online, and anyone who registers
can receive an automatic email for
specific areas showing when
change was detected. This data
are meant to help the law
enforcement agency by indicating
where to go in the field. The areas
with high degradation are able to
be detected with MODIS, and with
this form of data the whole of
Brazil is covered within 2 days. To
the right is a picture of the DETER
system.
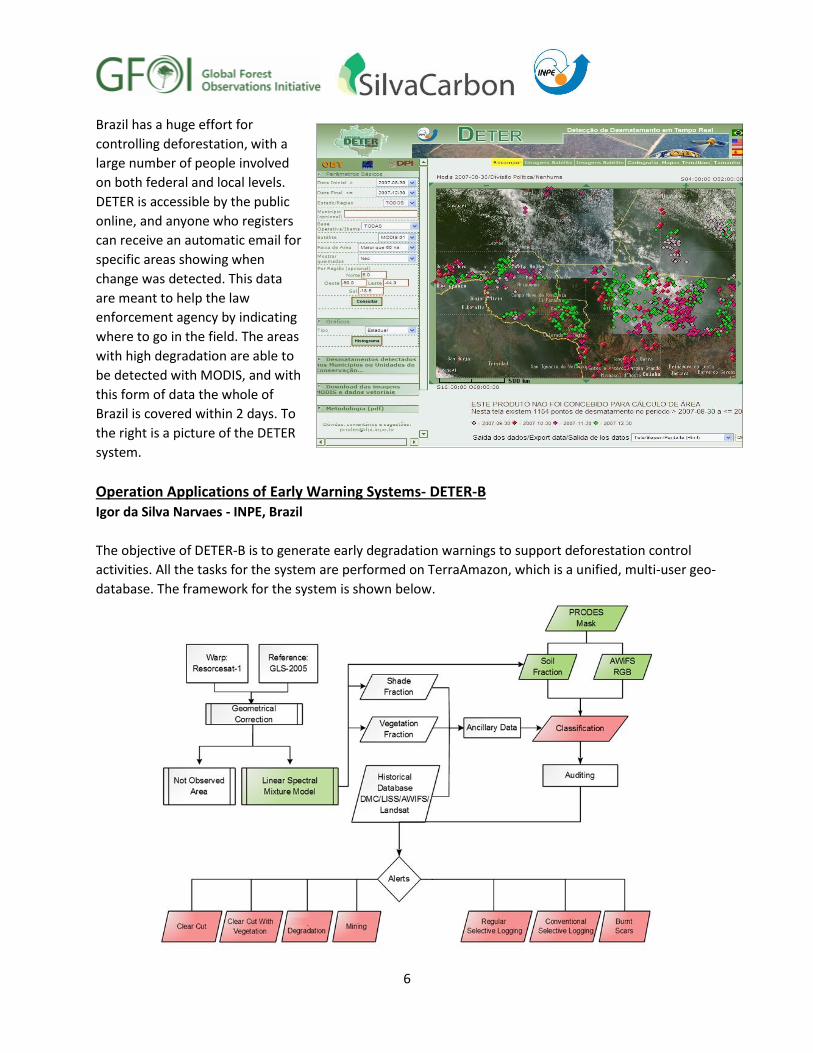
Operation Applications of Early Warning Systems- DETER-B Igor da Silva Narvaes - INPE, Brazil
The objective of DETER-B is to generate early degradation warnings to support deforestation control
activities. All the tasks for the system are performed on TerraAmazon, which is a unified, multi-user geo-
database. The framework for the system is shown below.

7
There are different ways to detect certain types of degradation. For example, clear-cut deforestation is
easy to detect as it has well-defined boundaries between the cleared space (bare soil) and the
untouched forest. DETER can also detect regrowth of vegetation in a deforested area, degradation,
mining, selective logging, and burn scars. Below are examples of detection for mining and burn scars.
DETER-B Field Data
Marcos Adami - INPE, Brazil
Three field campaigns were developed in 2013 in partnership with IBAMA in the municipalities of
Itaituba, Uruará, and Nova Progresso. The routes for this field work are displayed below.

8
The mapping period was from April to September with field work conducted in November and
December. Out of 250 points verified, 210 (or 85%) were confirmed deforestation while 40 were in
disagreement (15%). AWiFS was able to detect clear-cut deforestation, mining, and selective logging.
Questions/Comments:
Brian Zutta (MINAM) asked how many people are dedicated solely to early warning systems or
deforestation in each of the centers in Brazil. Marcos Adami responded that around 14 people
are needed. Right now, INPE only has 8 people because they only have the trial using 2013
imagery. However, INPE does not need more than 20 people to work on early warning for the
Amazon.
o Cesar Diniz (FAO International Consultant) commented that quantity is not the issue,
but rather training. If the country had a few properly trained people in interpretation
that is all that is needed.
o Brian Zutta added that there is a lack of understanding of how many people are actually
necessary. It is believed that only a few people are needed for both deforestation and
degradation. While Peru is not as big, there are some things that Brazil has already done
for deforestation and degradation that Peru is just starting to do now.
Country Presentations Each of Latin American SilvaCarbon countries (Peru, Colombia, Mexico, and Ecuador) presented on the
status and/or plans of the country for implementation of an early warning system for deforestation.
Status of the MRV System and the Integration of Early Warning Systems for Deforestation in Peru
Presenter: Brian Zutta – MINAM, Peru
Brian Zutta discussed the MRV system, its
progression, and how it is linked to the early
warning system which is currently being
developed through the collaboration of
various agencies. Peru shares the Amazon with
Brazil, with over 65 million ha of forest. The
map on the right displays areas of
deforestation in red from 2000 to 2011, with
approximately 1.2 ha of forest loss. This area
of deforestation will be even larger when the
data from 2012 to 2014 is added, with around
140,000 ha of additional loss per year in 2012
through 2014.
Landsat imagery is used to detect areas of
degradation and deforestation in various
locations throughout Peru. Currently, Peru
looks very similar to what Brazil was going
through in the 1980’s and 1990’s, except for a
9
couple of instances of palm oil plantations and gold mining in Peru within the last few years.
Brian Zutta showed time series of imagery displaying increases in these mining activity and palm oil
plantations. These plantations are considered non-forest in definition and are easy to detect as they
appears brighter on the imagery due to spacing between the trees and also because the areas all have
the same shape and pattern, which is much different from forested areas.
The MRV team has received funding from the Ministry for geo-processing and GIS and has moved into a
new office. This new office can hold up to 16 people and there will be a new server to disseminate the
data. REDD+ has caused MRV to grow, and it has been divided into four major areas:
# Major Topic Areas # of Hired Full-Time Technicians
1 Deforestation 1 (Will have a couple more in future)
2 Land use/Land use change 7
3 Carbon (Carbon maps/calculations) 2
4 Degradation, Reference emission levels, ect. 1 (Will have a couple more in future)
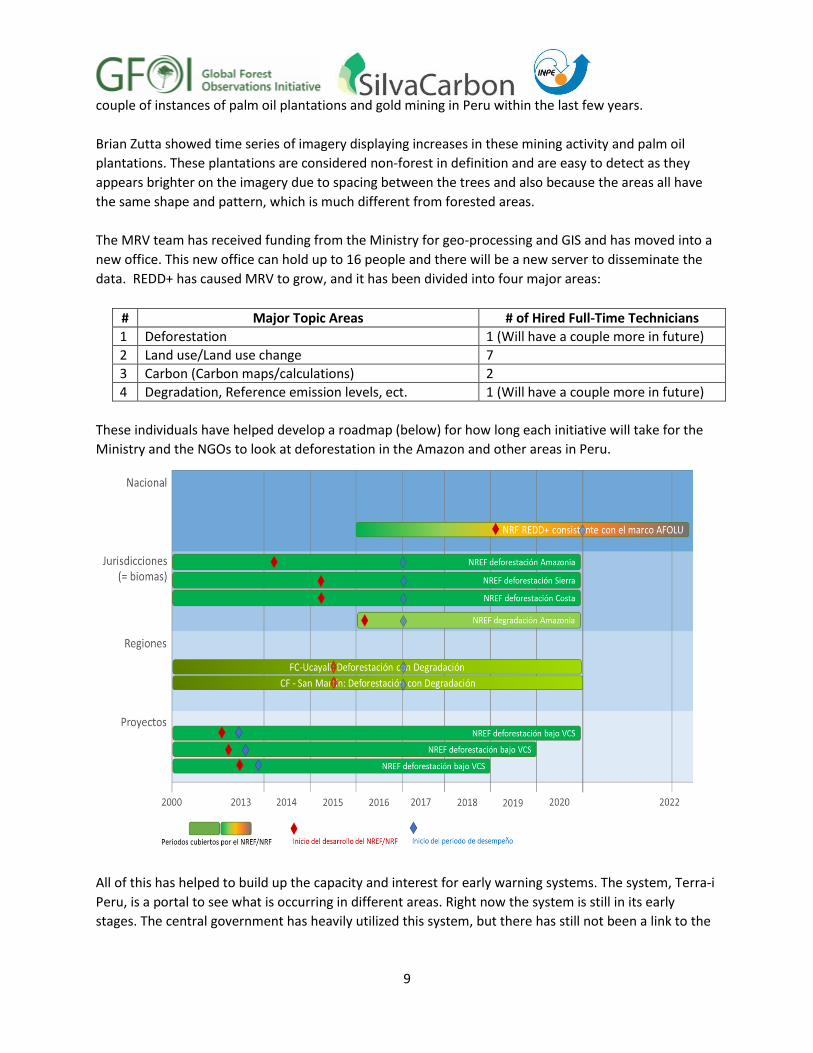
These individuals have helped develop a roadmap (below) for how long each initiative will take for the
Ministry and the NGOs to look at deforestation in the Amazon and other areas in Peru.
All of this has helped to build up the capacity and interest for early warning systems. The system, Terra-i
Peru, is a portal to see what is occurring in different areas. Right now the system is still in its early
stages. The central government has heavily utilized this system, but there has still not been a link to the
10
local and regional governments/players. This system uses MODIS data, which is very coarse, but still
provides useful information.
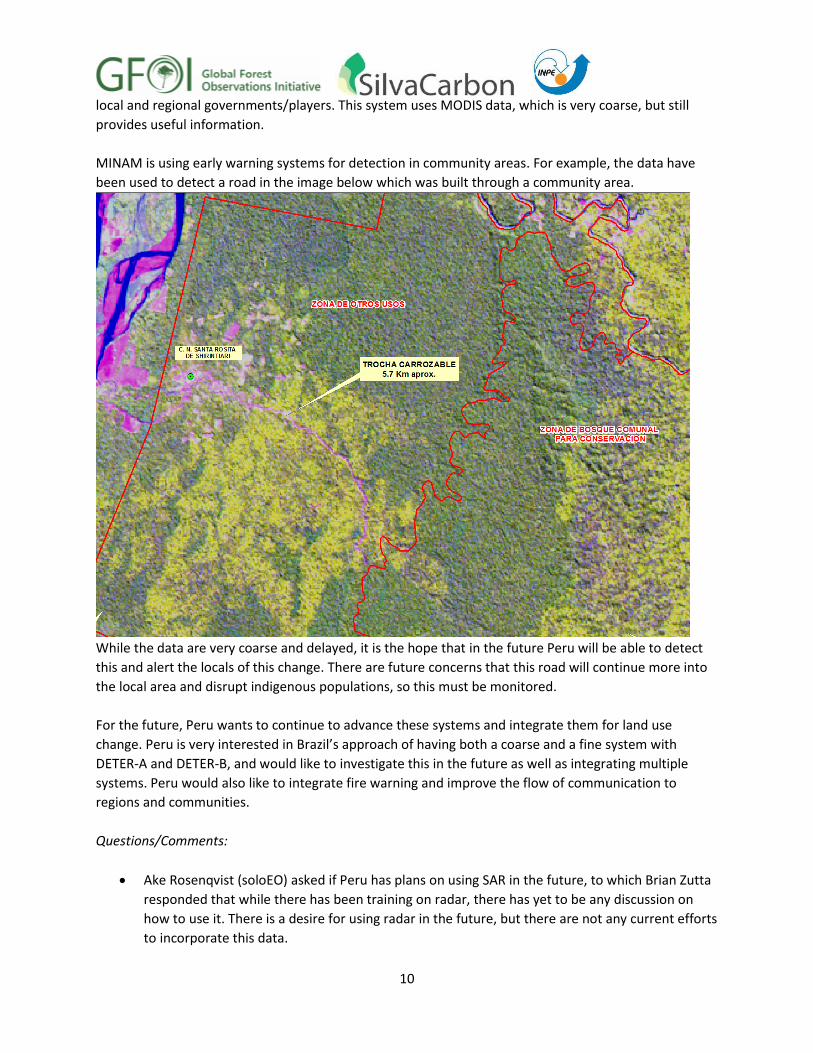
MINAM is using early warning systems for detection in community areas. For example, the data have
been used to detect a road in the image below which was built through a community area.
While the data are very coarse and delayed, it is the hope that in the future Peru will be able to detect
this and alert the locals of this change. There are future concerns that this road will continue more into
the local area and disrupt indigenous populations, so this must be monitored.
For the future, Peru wants to continue to advance these systems and integrate them for land use
change. Peru is very interested in Brazil’s approach of having both a coarse and a fine system with
DETER-A and DETER-B, and would like to investigate this in the future as well as integrating multiple
systems. Peru would also like to integrate fire warning and improve the flow of communication to
regions and communities.
Questions/Comments:
Ake Rosenqvist (soloEO) asked if Peru has plans on using SAR in the future, to which Brian Zutta
responded that while there has been training on radar, there has yet to be any discussion on
how to use it. There is a desire for using radar in the future, but there are not any current efforts
to incorporate this data.

11
Status and Plans for Implementation of an Early Warning System – Colombia
Presenter: Gustavo Galindo – IDEAM, Colombia
Colombia’s forest monitoring system has three important parts.
1. Deforestation quantification for gathering forest area data as well as the changes in these areas.
2. Carbon monitoring for gathering information about carbon stocks for greenhouse gas emissions.
3. Deforestation Early Warning System, which has become an annual process since last year.
Colombia has an approach for MRV that has to be coherent on the subnational level. They started
constructing different protocols for each of the regions to apply at the local, regional, and national
levels. Due to all of this, Colombia has worked with a lot of different imagery. Colombia was working
with around 100 images for the whole country through 2010. Since 2010, this number has increased to
700-800 images for an annual report. Colombia had to change the way it was processing the imagery
and working with the database as well as change how the datacenter was doing processing.
For the annual deforestation rates, Colombia had 162,000 acres of deforestation in 2013. Most of the
deforestation is in the Amazon region (57%), while 3% are areas without data. These areas with missing
data are complete the next year.
For early warning systems, Colombia started working with ALOS for ScanSAR images to try to detect
changes in forests automatically. Around 50 images were processed between 2008 and 2010 with
gamma software. There has been mixed results, but there is a lot of possibilities for it in the future and
Colombia is looking forward to working with it more. Early warning has become very important, in some
cases more important than deforestation results. People of local communities are very worried about it.
Colombia is doing this in a different way than Brazil. The country is making mosaics and then taking out
the problematic pixels, which is a mostly automated system. Colombia is working with software called
TISEG for pre-processing the data. All the processes for deforestation and early warning system always
end with manual interpretation and Colombia is not relying solely on automated results. This can be
done in two weeks, but in Colombia there are some months that are fully cloud covered, so the
minimum period for having results is 6 months.
Colombia is seeing that in less populated areas with more forest there is less capacity and therefore less
of a reaction from the results, while there is more deforestation present. So Colombia repeats early
warning every 6 months in these areas where there is more change happening. There are also a lot of
illegal activities in these areas, so it is very complicated.
Colombia is looking at ways that they can communicate directly with the government and the local
communities. Local areas are being taught how to download the images, do basic processing with the
software, and also how to do a visual interpretation every 15 days. Communities have not received any
support for the forests. They need to monitor it to receive funds.
12
Questions/Comments:
Inge Jonckheere (FAO) asked about sustainability of the imagery they are using and what the
option is if they do not get a good price. Gustavo Galindo responded that Colombia is currently
working only with MODIS and they have to work with other options like Sentinel. Colombia has
to consider how often they need to do this, as every six months may not be feasible. It is very
important that there is currently a lot of support, but they know that it will eventually end.
However, the forest monitoring system has to be sustainable, and they are working to find the
best way for this.
Ake Rosenqvist (soloEO) commented that in the near future Sentinel-2 will be available. This will
be a game changer because it will have very high resolution data with high temporal resolution.
The challenge is how to handle this vast amount of data. Sentinel-2 has some of the greatest
promise for forest monitoring, and Ake believes there is a place for radar in this. Any detection
system should not be built on one or the other system, but rather both. Radar can be used to fill
in the gaps. If a country is at the beginning of developing their system, they should include
radar. Radar is very different, but not necessarily difficult.
Early Warning Systems – Mexico
Presenter: Sergio Villela – CONAFOR, Mexico
In Mexico, the national implementation of REDD+ MRV system requires a strong and solid inter-
institutional cooperation at the federal level, including actors from academia and stakeholders at the
state level. The working group has nearly 40 people comprised of the following organizations:
Organization Responsibility
CONAFOR (National Forestry Commission) Generates land cover change reports
INEGI (National Institute of Geography and Statistics)
Provides national regulations for cartographic products and geospatial data
CONABIO (National Commission for the Use and Knowledge of Biodiversity)
Specializes in remote sensing processes in MRV activity data
The new automatic system, MAD-MEX (MRV activity data in Mexico) provides timely delivery of accurate
maps within a few days. It produces domestic land cover change maps at different scales (1:100,000 and
1:20,000). The products which are generated automatically from MAD-MEX are then edited, revised,
and validated to complete annual reporting for forest emissions of greenhouse gases. An issue from the
beginning has been the size of Mexico and the variety of different species which has created multiple
problems for developing an automatic classification system.
The objectives for Mexico are first to generate automatic land cover maps with classifications of Landsat
imagery from 1993, 1995, 2000, 2005, and 2010, and then with RapidEye imagery from 2011 onward.
Mexico also wishes to obtain land cover change activity data to overlap the Landsat classifications for
the years 1993-2010. The other objectives are to generate the historical deforestation rate for 1993-
2010, to obtain annual land cover change activity data with RapidEye imagery, and finally to obtain a
high accuracy classification for generating a finer classification scheme through post-processing.
13
RapidEye imagery has been used because of its high spatial resolution, the ability to pre-process data
with high geo-location accuracy, and its constellation of satellites with the likelihood of multi-temporal
coverage.
The classification process for MAD-MEX has been performed at different scales to determine land cover,
land cover change, forest/non-forest, forest change, and cover density through automated wall-to-wall
mapping and “map-to-image” with the use of historical land use cartography. The challenge with MAD-
MEX is being able to generate domestic products within 1 year due to the number of available staff from
the three organizations. Since 1990, when Mexico first started its national inventory, the country has
tried to consistently report on a five year cycle.
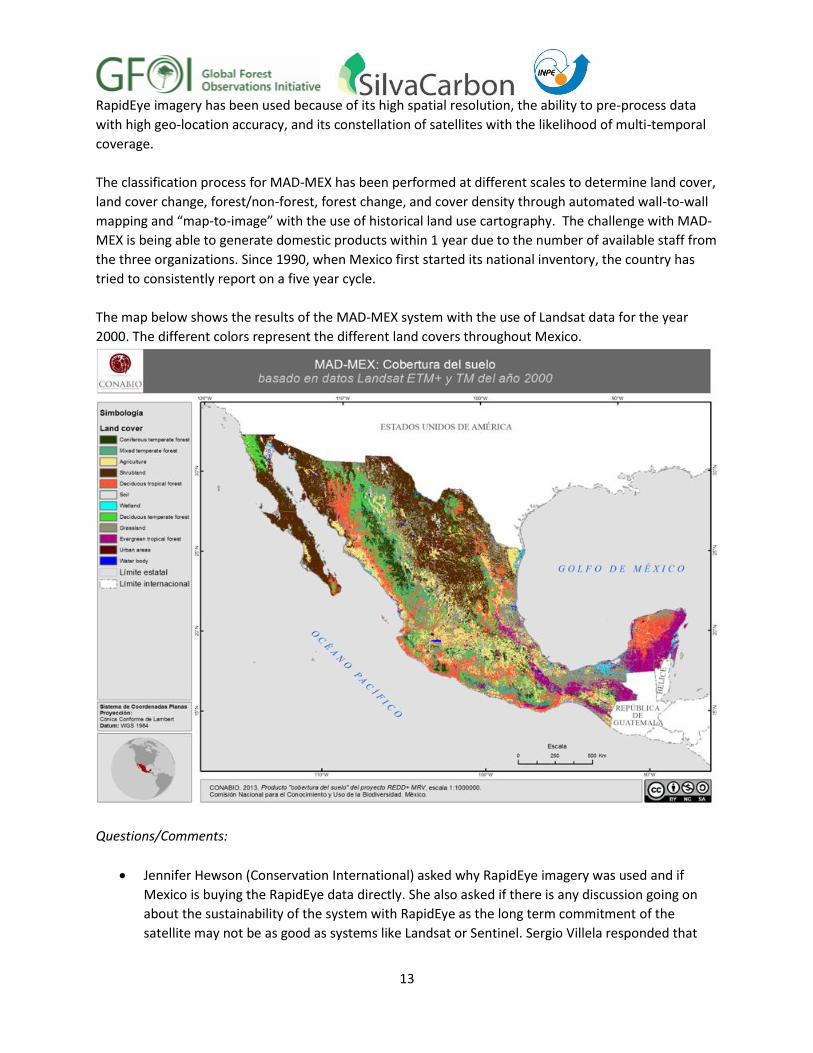
The map below shows the results of the MAD-MEX system with the use of Landsat data for the year
2000. The different colors represent the different land covers throughout Mexico.
Questions/Comments:
Jennifer Hewson (Conservation International) asked why RapidEye imagery was used and if
Mexico is buying the RapidEye data directly. She also asked if there is any discussion going on
about the sustainability of the system with RapidEye as the long term commitment of the
satellite may not be as good as systems like Landsat or Sentinel. Sergio Villela responded that
14
Landsat was used in the beginning but then an agreement was signed with RapidEye because it
can be used in both the dry season and the wet season, which is very good for areas such as the
Yucatan. Conabio bought the RapidEye imagery for all of the agencies in Mexico. He also stated
that the people in Mexico using the imagery have chosen RapidEye because of various issues
they have discovered while classifying with Landsat imagery.
Guillermo Sanchez (USFS) asked if RapidEye is being used for the whole country. Sergio Villela
responded that it is for the entire country. He is not sure of the price, but the imagery is still
better for Mexico, because they have to use a different scale.
Cesar Diniz asked if Mexico has tested using the panchromatic Landsat 8 band. Sergio Villela
responded that while he believes the group did, the issue is that higher resolution is needed for
the variety of projects and classes (115) that they have.
Ake Rosenqvist (soloEO) commented that the higher resolution of RapidEye can provide more
information for areas with increased woodland areas instead of tropical forests.
Jennifer Hewson added that while dry forests can be a big issue, Mexico should consider using
Landsat for the general information and RapidEye for the dry forests.
Status and Plans for Implementation of an Early Warning System – Ecuador
Presenter: Andrea Bustos and Nestor Acosta – MAE, Ecuador
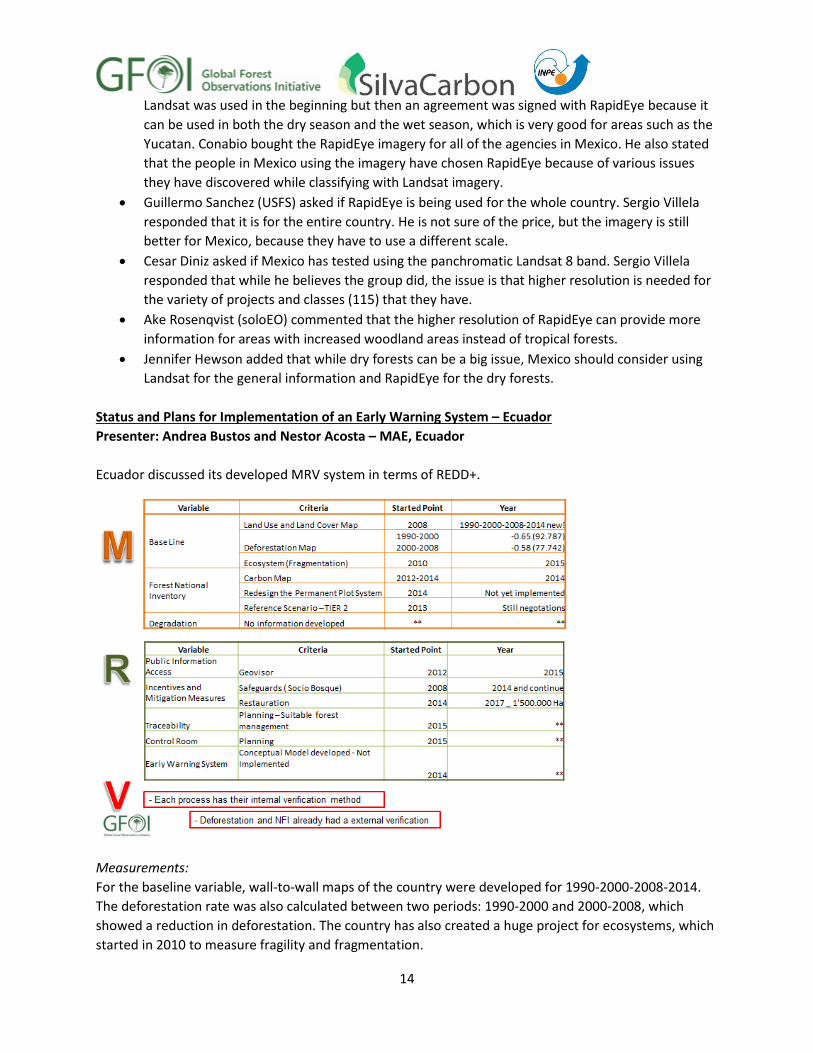
Ecuador discussed its developed MRV system in terms of REDD+.
Measurements:
For the baseline variable, wall-to-wall maps of the country were developed for 1990-2000-2008-2014.
The deforestation rate was also calculated between two periods: 1990-2000 and 2000-2008, which
showed a reduction in deforestation. The country has also created a huge project for ecosystems, which
started in 2010 to measure fragility and fragmentation.
15
For the forest national inventory, both carbon and base area maps were developed from 2012-2014.
The ecosystem maps were also used to make better estimations of the nine carbon strata. From these
nine strata there were 900 plots. From the national forest inventory, Ecuador has learned that they want
to make better decisions for placing plots so they are trying to redesign the permanent plot system. It
was discovered that some of the plots were not in the conservation area, resulting in the loss of some
data. So the plots will be redesigned and the grid will be changed from 100km to 100m.
Reports:
In the reports safeguards have been implemented with mainly
Socio Bosque. This project began in 2008 and is still ongoing.
Since 2008, over $24 million USD has been invested. There are
efforts in reforestation, and by 2017 Ecuador wants to
implement a reforestation area of 1,500,000 ha. Methodologies
are still being developed for how and where the reforestation
will be measured.
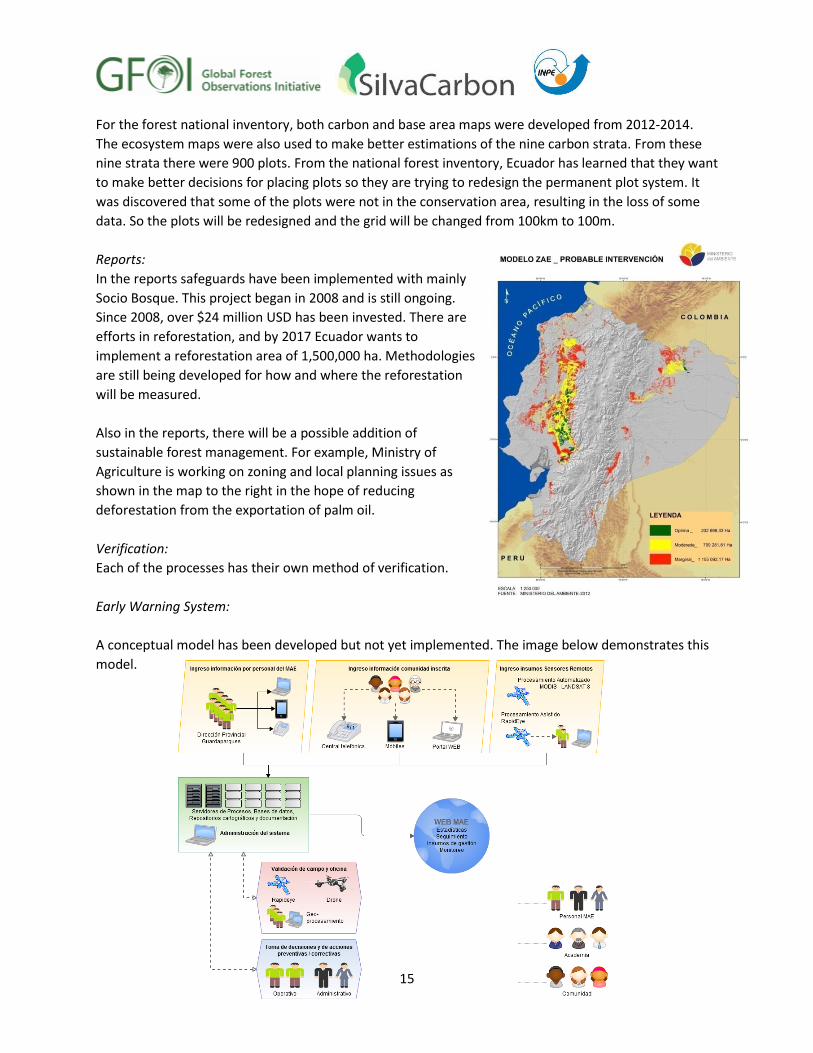
Also in the reports, there will be a possible addition of
sustainable forest management. For example, Ministry of
Agriculture is working on zoning and local planning issues as
shown in the map to the right in the hope of reducing
deforestation from the exportation of palm oil.
Verification:
Each of the processes has their own method of verification.
Early Warning System:
A conceptual model has been developed but not yet implemented. The image below demonstrates this
model.

16
In the first portion, there is an automatic remote sensing process to establish some agreement to
develop the algorithm for the model. The next part shows the action of the community (i.e. park
rangers) with the use of smart phones and the internet to introduce local information, as well as a call
center where workers from the Ministry can call and give the information in a web portal. The idea is
that when a fire, illegal logging, etc. occurs people can call and enter the information in the applications
or in the webpage to add the data into the system. This system should alert the authorities of those
specific problems. This information can be used to validate info generated in the automatic process.
The screen capture below shows what the system will look like for adding information.
Questions/Comments:
Pontus Olofsson (BU) asked how Ecuador intends to use the MODIS/Landsat data to monitor
change in near real-time. Nestor replied that this is one of the questions that they have, and
they are trying to work through it. Ecuador is studying using all the data and then developing
step-by-step procedures.
Pontus Olofsson added that Boston University has funding from NASA to try out their data, and
they would be interesting to testing it in Ecuador.

17
Day 2: January 22, 2015
EWS Methodologies Near Real-Time Mapping of Forest Disturbances
Presenter: Eliakim Hamunyela, Wageningen University
Eliakim Hamunyela explained that medium resolution data should be used for early warning systems
because small scale forest clearings will be the main challenge in the future, and this level of resolution
is necessary to see these changes.
BFAST-Monitor has been used in the past for near real-time change detection by taking all available data
and modeling the behavior for the location. Then when a new image becomes available, it adds the new
information. This approach takes data from the forest and makes out vegetation activity over time.
However, there have been problems involving monitoring dry forests and most of the time there is not
enough imagery to model the behavior. With this issue, the user is unaware if the forest is being
modeled or if it is noise. It is very difficult to point out abnormalities, so Wageningen University has
been working on a new approach.
This new method is called the spatial context approach, which makes it easier to see disturbances in
time series and therefore change can easily be pointed out. This approach has been tested at sites in
South America (shown below) using Landsat 5 and 7 NDVI time series from 1984 to 2014 in both humid
and dry forest areas. The test was to determine if change can be seen easily. The results found that the
approach works very well in dry forests and change is detected earlier. The results had fewer
fluctuations as compared to BFAST.
Humid forest
(evergreen)
Dry forest
(deciduous)
18
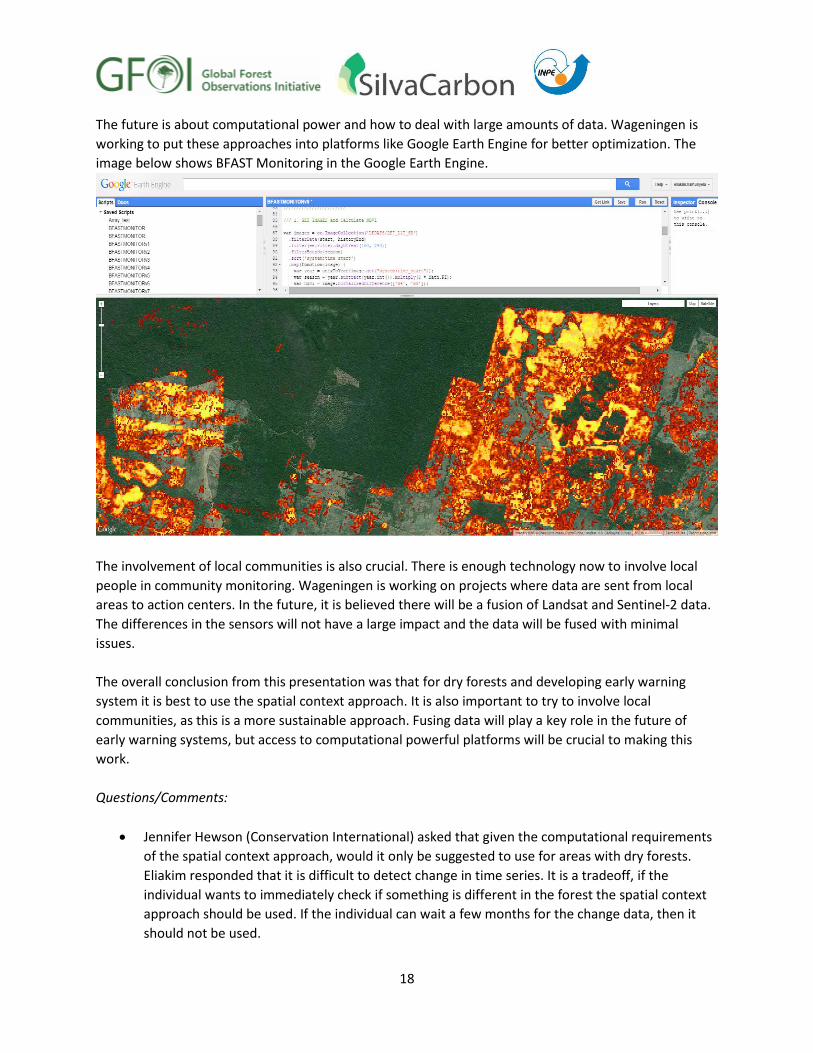
The future is about computational power and how to deal with large amounts of data. Wageningen is
working to put these approaches into platforms like Google Earth Engine for better optimization. The
image below shows BFAST Monitoring in the Google Earth Engine.
The involvement of local communities is also crucial. There is enough technology now to involve local
people in community monitoring. Wageningen is working on projects where data are sent from local
areas to action centers. In the future, it is believed there will be a fusion of Landsat and Sentinel-2 data.
The differences in the sensors will not have a large impact and the data will be fused with minimal
issues.
The overall conclusion from this presentation was that for dry forests and developing early warning
system it is best to use the spatial context approach. It is also important to try to involve local
communities, as this is a more sustainable approach. Fusing data will play a key role in the future of
early warning systems, but access to computational powerful platforms will be crucial to making this
work.
Questions/Comments:
Jennifer Hewson (Conservation International) asked that given the computational requirements
of the spatial context approach, would it only be suggested to use for areas with dry forests.
Eliakim responded that it is difficult to detect change in time series. It is a tradeoff, if the
individual wants to immediately check if something is different in the forest the spatial context
approach should be used. If the individual can wait a few months for the change data, then it
should not be used.
19
Pontus Olofsson (BU) asked why NDVI was used for their test sites. Eliakim responded that it
was not used because it was the best data but because the main focus was to determine how
the approach dealt with the fluctuations.
Pontus Olofsson added that Sentinel-2 is a very promising mission but it will take a long time for
the data to be useable for South America. The plan is to start with Europe then Africa and then
South America for the collection. NASA and USGS will work to integrate the data into their
systems to be compatible with Landsat.
Two MODIS-Based Approaches for Monitoring Forest Change in Near Real-Time
Presenter: Pontus Olofsson, Boston University
Boston University has received research funding from NASA (The Science of Terra and Aqua) and USGS
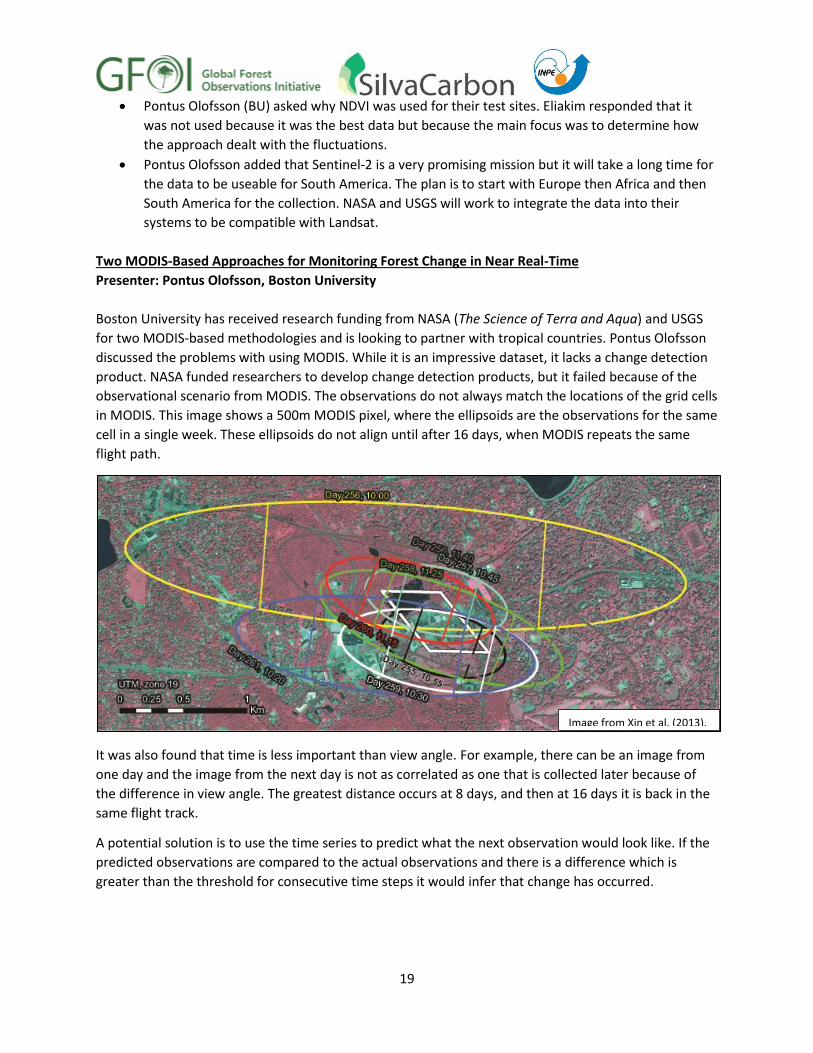
for two MODIS-based methodologies and is looking to partner with tropical countries. Pontus Olofsson
discussed the problems with using MODIS. While it is an impressive dataset, it lacks a change detection
product. NASA funded researchers to develop change detection products, but it failed because of the
observational scenario from MODIS. The observations do not always match the locations of the grid cells
in MODIS. This image shows a 500m MODIS pixel, where the ellipsoids are the observations for the same
cell in a single week. These ellipsoids do not align until after 16 days, when MODIS repeats the same
flight path.
It was also found that time is less important than view angle. For example, there can be an image from
one day and the image from the next day is not as correlated as one that is collected later because of
the difference in view angle. The greatest distance occurs at 8 days, and then at 16 days it is back in the
same flight track.
A potential solution is to use the time series to predict what the next observation would look like. If the
predicted observations are compared to the actual observations and there is a difference which is
greater than the threshold for consecutive time steps it would infer that change has occurred.
Image from Xin et al. (2013).
20
Two Approaches:
1. Direct Approach- this uses the dense time series of MODIS filtered by zenith angle to predict the next
MODIS observation.
2. Fusion Approach- this approach would use Landsat time series data to predict daily Landsat images to
recreate the MODIS acquisition process.
The change for both of these approaches would be inferred by comparing the predicted to the actual
observations.
Continuous Monitoring of Forest Change in Near Real-Time with Data from the MODIS Sensors
Presenter: Pontus Olofsson, Boston University
For the first approach, the basic idea is to take Landsat-based methods and run them with MODIS data.
For these Landsat methods Boston University teamed up with USGS to determine how to use the
Landsat data. USGS developing Land Change Monitoring, Assessment, and Projection (LCMAP), which
looks at the reasons for land cover and land use changing, how the change has varied over time, the
drivers for the change, and whether or not it is possible to detect both historical change and current
change consistency and with similar accuracy.
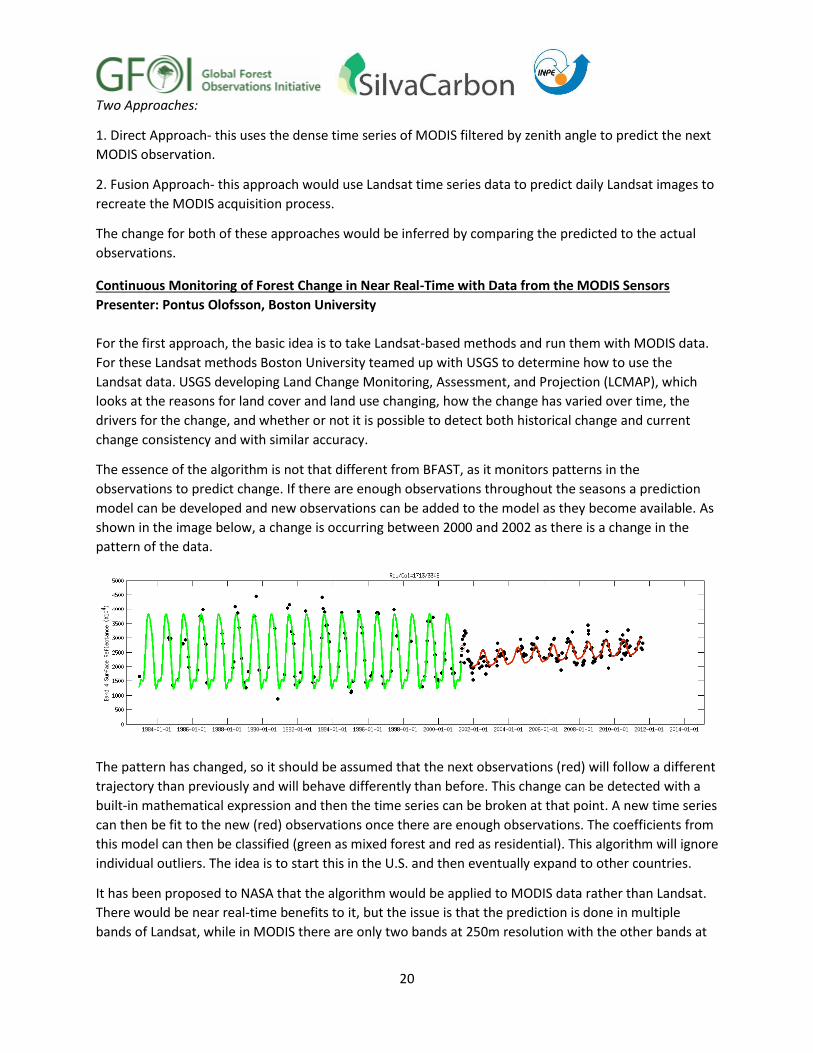
The essence of the algorithm is not that different from BFAST, as it monitors patterns in the
observations to predict change. If there are enough observations throughout the seasons a prediction
model can be developed and new observations can be added to the model as they become available. As
shown in the image below, a change is occurring between 2000 and 2002 as there is a change in the
pattern of the data.
The pattern has changed, so it should be assumed that the next observations (red) will follow a different
trajectory than previously and will behave differently than before. This change can be detected with a
built-in mathematical expression and then the time series can be broken at that point. A new time series
can then be fit to the new (red) observations once there are enough observations. The coefficients from
this model can then be classified (green as mixed forest and red as residential). This algorithm will ignore
individual outliers. The idea is to start this in the U.S. and then eventually expand to other countries.
It has been proposed to NASA that the algorithm would be applied to MODIS data rather than Landsat.
There would be near real-time benefits to it, but the issue is that the prediction is done in multiple
bands of Landsat, while in MODIS there are only two bands at 250m resolution with the other bands at
21
500m. It was tested and found that the 500m bands were not useful for detecting change. The two
250m bands are red and near-infrared. While there is obvious forest change with the near-infrared
band, it is still not helpful on its own. The best option is to use two bands: the red and also the red/near-
infrared. There is also the issue of the large zenith angle, so it was decided to eliminate all observations
over 25 degrees. In the upcoming semester, the plan is to weigh the observations, where the big blurry
pixels will have the lowest weights.
Future improvements:
In the future, BU will need to pay attention to the view zenith angle, and there is a desire to investigate
the use of the MAIAC data for both modeling and cloud screening. BU will look into the possibility of
adding VIIRS data into the time series and investigate how well it fits the MODIS time series. Also, BU
will need to figure out how to classify and screen the areas of non-forest and the best plan for
implementation in the tropics and other areas. Pontus added that if any country would like to work with
Boston University, they would be happy to work together, such as in Ecuador.
Questions/Comments:
Marcos Adami (INPE) asked how something like this could be done since there is a lot of Landsat
imagery for Brazil. Pontus replied that it would take a lot of processing power. Currently, USGS
has the capacity to do this, but it would be a lot for the Amazon.
Gustavo Galindo (IDEAM) asked if there is a difference between the Aqua and the Terra data.
Pontus answered that he had not seen any difference in the data used in the U.S. However, this
is not the case for the tropics. There is a difference, and there are fewer observations for Aqua
in the tropics due to fewer overpasses.
Near Real-Time Monitoring of Land Cover Disturbance by Fusion of MODIS and Landsat Data
Presenter: Pontus Olofsson, Boston University
This methodology assumes that the Landsat processing has already been performed, and then the
MODIS data can be added on top to detect disturbances. It creates synthetic images using the prediction
model and then uses the synthetic imagery as the ground surface so it can recreate the MODIS swath
observations based on the Landsat observations to predict future observations. The actual MODIS swath
observations are then compared with the synthetic swath to detect land cover change in near real-time.
Currently, BU is assessing the performance of the MODIS cloud mask, while looking into alternatives and
improvements. They are also continuing to develop and improve the original fusion prototype for
change detection and are using a study site in Canada to test the model on forest degradation and
beetle infestation. The fusion model is currently being tested for performance in a study site in Acre,
Brazil.
For the cloud issue, MODIS has an internal cloud mask which can eliminate regular clouds. However,
small and thin clouds are often missed, which causes the model to flag false changes. There are also a
limited number of clear observations in the Amazon, which will affect the quality of the synthetic
Landsat image.
For the test site in Acre, there is not a lot of clear imagery available for this area even with a
combination of Terra and Aqua. These clouds are causing issues with the analysis. There is a big issue of
22
residual clouds which are interfering with the ability to detect changes. In the test site, BU used all
available Landsat data to do analyses and then created synthetic Landsat data. A shift was found in
1988, showing a possible flooding area in the north of the site.
In conclusion, change can be detected with the fusion of the MODIS and Landsat. The internal cloud
mask for MODIS does a decent job, but small clouds can be missed. The clouds can affect the ability of
the approach to detect change in near real-time.
Questions/Comments:
Gustavo Galindo (IDEAM) asked how long the approach can predict and still be accurate as it can
be months before clear imagery is available for some South American countries. Pontus
answered that there is a threshold, and Colombia is reaching that threshold. There is a
combination of a lack of available Landsat data and the available imagery being cloudy. There is
a need to implement a way of weighing of the observations.
ForWARN: A Cross-Cutting Forest Resource Management and Decision-Support System
Presenter: Bill Hargrove, U.S. Forest Service
The ForWarn system was a joint effort by USDA, NASA, and Oak Ridge National Laboratory to help
monitor threats to forests. ForWARN is MODIS-based and covers the contiguous United States to
generate new potential disturbance maps every 8 days. The system detects all types of forest
disturbances, including insects, diseases, wildfires, ice and frost damage, tornadoes, hurricanes,
blowdowns, harvest, urbanization, and landslides.
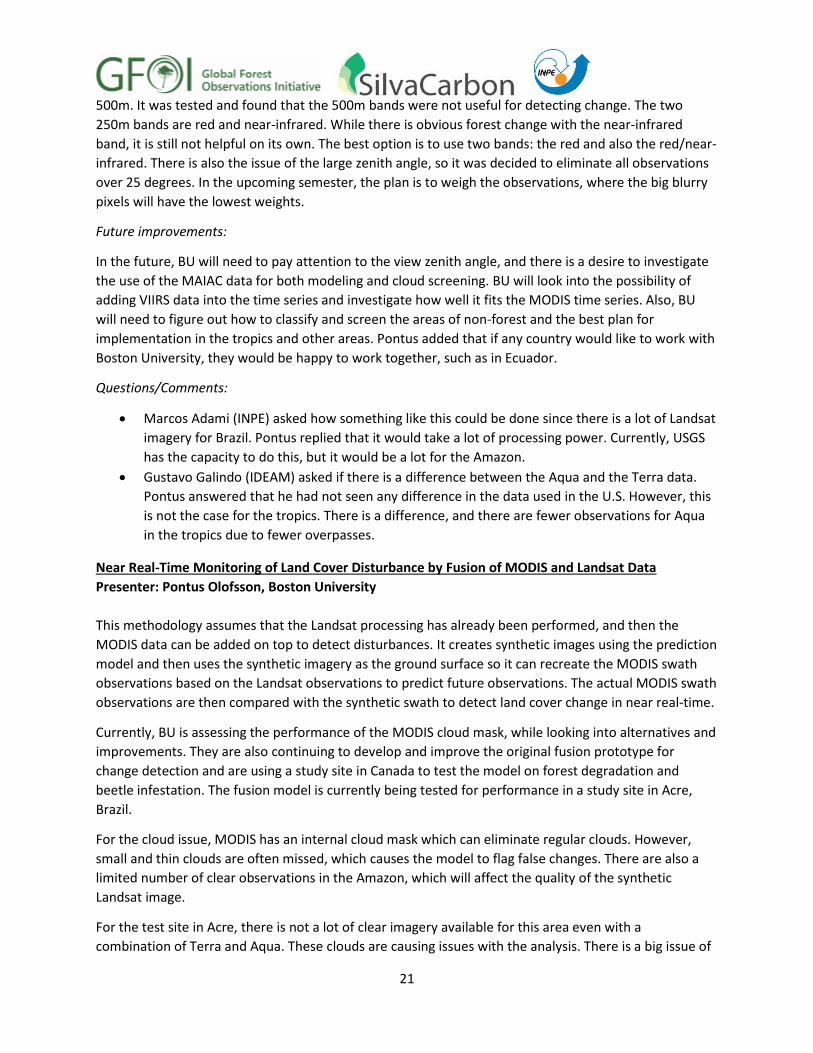
ForWarn has been in operation since January 2010, essentially covering 100% of the forest every 8 days.
The system has an online Forest Change Assessment Viewer, which is the main form of distribution for
the ForWarn system.

23
This system was developed for free by the University of North Carolina Asheville and is very similar to
Google Maps. There are many other ancillary maps in the same spatial context which can be used.
ForWarn works by comparing the current satellite greenness with a historically “normal” observed
greenness to find potential disturbances. The areas will less greenness than expected are determined to
be disturbed, while areas with more actual greenness than expected may show vigorous or recovering
vegetation. While the system only shows forested areas, ForWarn can detect all vegetation.
The normal or expected greenness value is both spatially customized for each map cell and also
temporally customized for each 8-day period. Every map is a percentage of expected greenness, with
less than 100% of expected greenness showing potential disturbances as green, yellow, or red. Greater
than 100% expected greenness shows vegetation recovered, which is shown as blue. The image below
shows a ForWarn image from June 1, 2011 displaying tornado damage in the U.S. The damage is easily
detected with a red core and yellow boundary.
Three slightly different national disturbance maps are created every 8 days. The differences are related
to the age of the disturbances mapped. A short-term history of the prior year depicts recent
disturbances. A mid-term history of the last three years shows intermediate-age disturbances. Finally, a
long-term history for the entire baseline period shows all disturbances since MODIS began. ForWarn can
see the extent of a disturbance, but also detect the recovery from it. It does not simply pick one
definition of normal, but three and allows the user to pick the definition that is most relevant to them.
Two great features are the Share-This-Map feature and the Pest Proximity Feature. Share-This-Map
creates a URL that the user can send to another person, who can click on it to see the same extent and
layer that the person was previously viewing. This facilitates communication and consultation with the
ForWarn team. The Pest Proximity Feature combines all pests/insects/diseases in an area so that when

24
the user clicks a certain point it shows all of the usual suspects (all insects/diseases that have been seen
near the point) to show all the likely disturbances. The user can also click on a location to get a graph
which shows the annual phenological track/profile. ForWarn is not measuring disturbances but rather
departures from normal phonological timing. It can detect weather departures from deviations of
precipitation and temperature on top of wildfires, pests, etc.
In 2014, three new ForWarn products were added. Two of the map products are ways to compare
current greenness with a seasonally normalized baseline, while the third is a new early detection map
which helps detect even more quickly. This uses adaptive length compositing to shorten the detection
times. Detection delays are caused by issues with clouds, which can cause false positives. There is a new
adaptive length compositing algorithm for current eMODIS image, where the blue band is used as a new
cloud-detection algorithm to objectively define a good look. If the blue value is too high, the value is not
used.
In the future, ForWarn will have a new cluster-derived baseline product, which will be the first non-
historically derived baseline for ForWarn. Another thing USFS is working on is backwards in time
processing to produce ForWarn products for the past, working back to 2000 imagery to create an instant
history which will provide more experience detecting additional types of disturbances to better
understand current disturbances. USFS is also building towards a set of subscription services, where
users will get alerts for nearby disturbances through social media. This is in high demand as users will
not have to keep checking the ForWarn system for change.
Overall, the goal for ForWarn is to act as an alarm for forest disturbance. Ultimately, USFS wants it to
convince forest managers to use ForWarn themselves to monitor their own forests. This is a great way
to establish a two way communication and a working partnership with forest managers.
The slides for this presentation are available at: http://www.geobabble.org/~hnw/first/brasil1
Questions/Comments:
Jennifer Hewson (Conservation International) asked how USFS is actually attributing the causes
of forest disturbances. Bill Hargrove responded that it is a protocol the USFS use that relies on
first answering the question of whether or not there is a real disturbance, but then compares
with many ancillary maps in the viewer. The comparison can usually get a good first order guess
on the cause of the disturbance. This is beyond the intended function of the system as it was
developed to act as a smoke alarm, but it does provide a cause and is almost always right.
Forest Change Assessment Viewer
Presenter: Bill Hargrove, U.S. Forest Service
The Forest Change Assessment Viewer is the main delivery vehicle for output from ForWarn. It is a free,
open, browser-based system which can see natural and human disturbances as well as recovery. It uses
moderate resolution satellite data to provide forest change recognition and a tracking system. USFS
tried to make the viewer as self-explanatory and user-friendly as possible. Whole groups of ancillary
information can be added, which allows users to have access to a multitude of information without
cluttering the interface.
25
In addition to having the viewer as a distribution device for ForWarn, USFS also have WMS, Web Map
Service and WCS, Web Coverage Service, which is aimed at higher GIS users. Smart phones can be used
to subscribe to all of these services. There are also trainings available on the capabilities as well as more
detailed webinars on the viewer. Shorter videos are also available on how to use particular features.
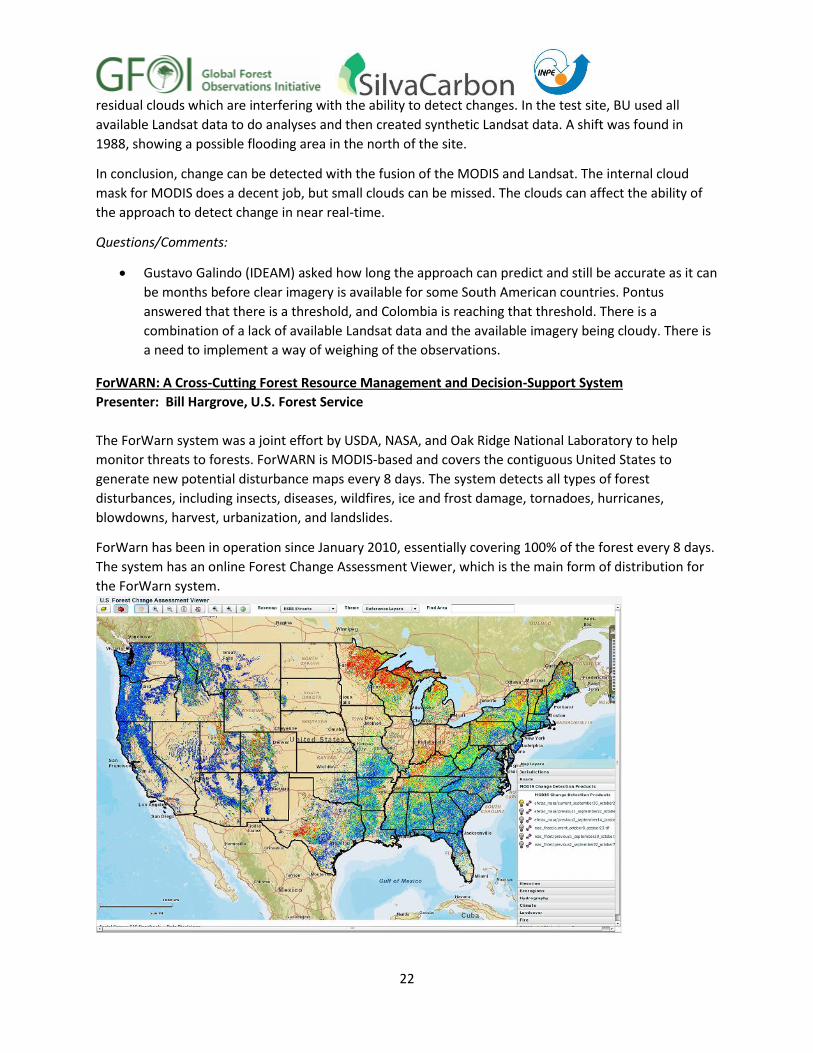
The viewer has a graph NDVI tool, which shows the NDVI change of a location through time. The viewer
also has multivariate geographic clustering to statistically create and draw homogenous regions with
respect to the phenology. USFS has done this across all MODIS data years for the 48 U.S. states. The
viewer can show maps of phenological ecoregions (phenoregions) which represents the best vegetation
type maps every 8 days over a 13 year period. If the phenology has ever acted differently, this can be
seen on the map. The map below shows the 50 most different national phenoregions for 2012.
USFS used the same multivariate approach globally with clustering of MODIS fire hotspots to examine all
the hotspots ever collected and aggregated them into 10km2 cells for all fires (human-cause and
wildfires). Clusters were developed for the 1000 most different fire types globally. This provides a
synoptic global perspective to see the coarse dynamic of fires.
USFS is also doing temporal unmixing of the phenological signal to separate evergreen and deciduous
forests. In the winter time, the only contributor to forest greenness is evergreen vegetation, this
constant seasonal evergreen contribution is quantify and subtracted from the total NDVI to separate
evergreen from deciduous. Then evergreen and deciduous vegetation can be mapped separately.
Declining and thriving forests can be located by performing a 150 million per-cell temporal linear
regression through the 11 yearly minimum and maximum NDVI surrogates. From this, a slope is
produced which shows the long-term trend in forest health. The image below shows the evergreen

26
thrive and decline of the forests in Western North Caroline between 2000 and 2010. There is nearly no
evergreen thrive present.
Slides available at: http://www.geobabble.org/~hnw/first/brasil2/.
Questions/Comments:
At the end of his presentation, Bill Hargrove commented that as countries develop their early
warning systems they should feel free to ask questions as the USFS has made a lot of mistakes
during the process. There will be a lot of challenges with the clouds, so it will be an interesting
topic.
Day 3: January 21, 2015
Field day organized by INPE to Parque Estadual Serra do Mar.
27
Day 4: January 22, 2015
Terra-i, A Near-Real Time Monitoring of Habitat Change
Presenter: Oscar Bautista, Terra-i
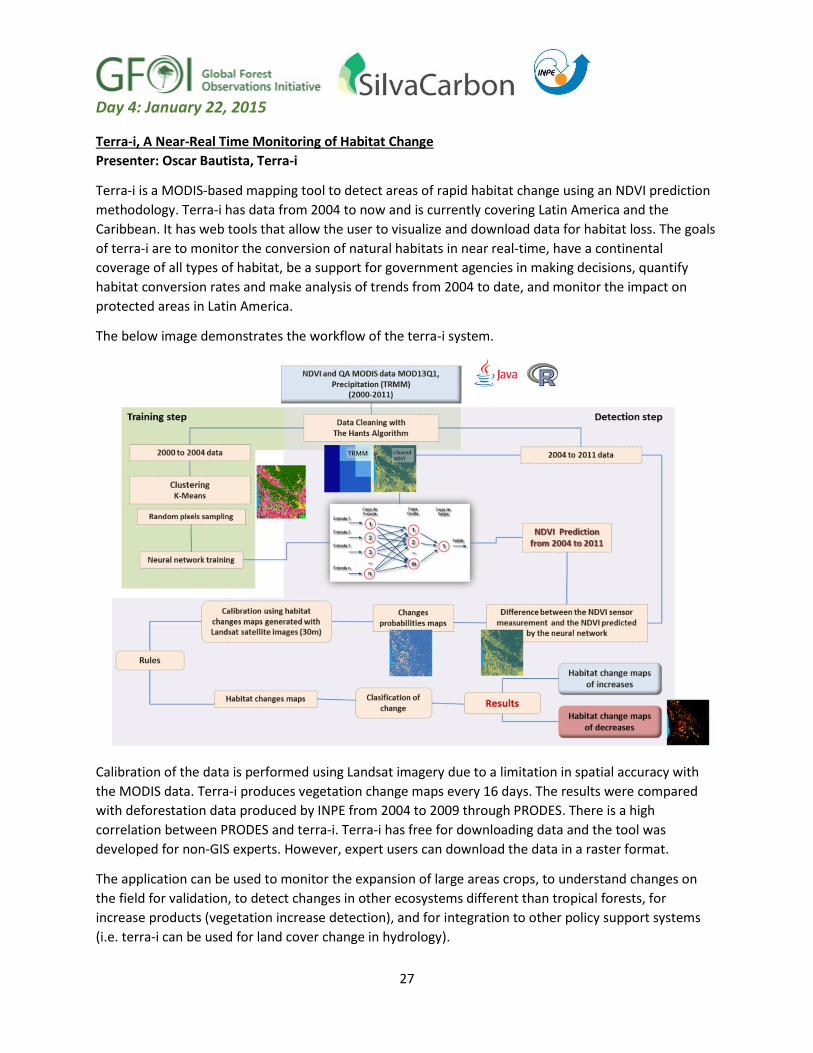
Terra-i is a MODIS-based mapping tool to detect areas of rapid habitat change using an NDVI prediction
methodology. Terra-i has data from 2004 to now and is currently covering Latin America and the
Caribbean. It has web tools that allow the user to visualize and download data for habitat loss. The goals
of terra-i are to monitor the conversion of natural habitats in near real-time, have a continental
coverage of all types of habitat, be a support for government agencies in making decisions, quantify
habitat conversion rates and make analysis of trends from 2004 to date, and monitor the impact on
protected areas in Latin America.
The below image demonstrates the workflow of the terra-i system.
Calibration of the data is performed using Landsat imagery due to a limitation in spatial accuracy with
the MODIS data. Terra-i produces vegetation change maps every 16 days. The results were compared
with deforestation data produced by INPE from 2004 to 2009 through PRODES. There is a high
correlation between PRODES and terra-i. Terra-i has free for downloading data and the tool was
developed for non-GIS experts. However, expert users can download the data in a raster format.
The application can be used to monitor the expansion of large areas crops, to understand changes on
the field for validation, to detect changes in other ecosystems different than tropical forests, for
increase products (vegetation increase detection), and for integration to other policy support systems
(i.e. terra-i can be used for land cover change in hydrology).
28
This system has had a lot of impact. For example, terra-i is now working with the government in Peru,
producing monthly data on a regular basis to evaluate their policies and the effectiveness of their
actions in the protected areas. Terra-i also cooperates with independent media, such as InfoAmazonia,
in exchanging data to produce monthly reports. Terra-i’s website currently has 1,500 users from 250
institutions. The users are mainly located in the U.S. and Colombia.
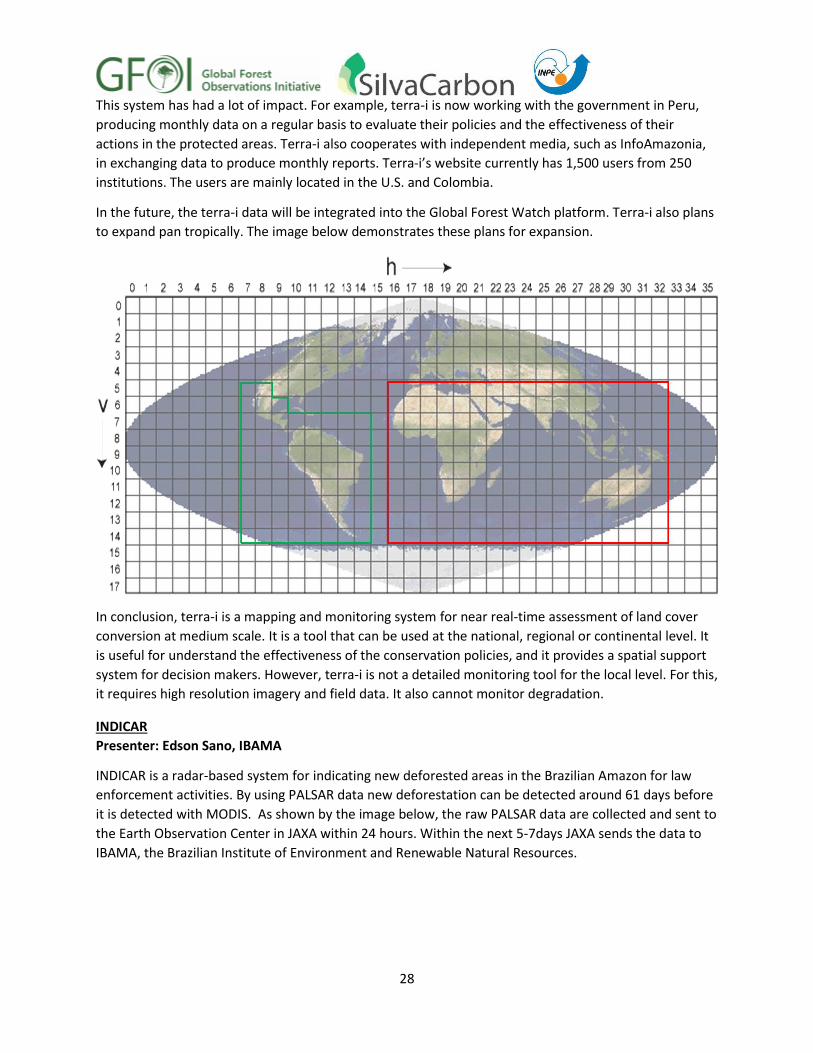
In the future, the terra-i data will be integrated into the Global Forest Watch platform. Terra-i also plans
to expand pan tropically. The image below demonstrates these plans for expansion.
In conclusion, terra-i is a mapping and monitoring system for near real-time assessment of land cover
conversion at medium scale. It is a tool that can be used at the national, regional or continental level. It
is useful for understand the effectiveness of the conservation policies, and it provides a spatial support
system for decision makers. However, terra-i is not a detailed monitoring tool for the local level. For this,
it requires high resolution imagery and field data. It also cannot monitor degradation.
INDICAR
Presenter: Edson Sano, IBAMA
INDICAR is a radar-based system for indicating new deforested areas in the Brazilian Amazon for law
enforcement activities. By using PALSAR data new deforestation can be detected around 61 days before
it is detected with MODIS. As shown by the image below, the raw PALSAR data are collected and sent to
the Earth Observation Center in JAXA within 24 hours. Within the next 5-7days JAXA sends the data to
IBAMA, the Brazilian Institute of Environment and Renewable Natural Resources.

29
For the Brazilian Amazon, there is full ALOS ScanSAR coverage every 46 days. The PALSAR HH signal can
locate areas of potential deforestation. Between September 2009 and March 2011, 1,382 polygons were
flagged as potential deforestation. Of these, 120 polygons were verified as illegal deforestation.
Currently, there is no information on the rate of false alarms due to a lack of knowledge of how many of
the flagged polygons were validated in the field by the IBAMA law enforcement team.
In conclusion, due to cloud cover, the ALOS-1 ScanSAR system allows for the detection of new
deforestation two months earlier than by MODIS.New deforestation is not unequivocally detected in
ALOS-1 ScanSAR HH-pol images. Two opposite brightness patterns demand more attention from the
interpreters.
Early Warning Capacity by Synthetic Aperture Radar (SAR)
Presenter: Ake Rosenqvist, soloEO
SAR is an active microwave sensor, which can be used day or night and can penetrate through clouds
and smoke. However, SAR is not entirely weather independent as environmental conditions can affect
the backscatter. The important ground parameters are di-electric properties (water content) and target
structure. A general rule for the di-electric properties is that with increased water content there is
increased backscatter. For the different target structures, they can result in different backscatter
mechanisms.
30
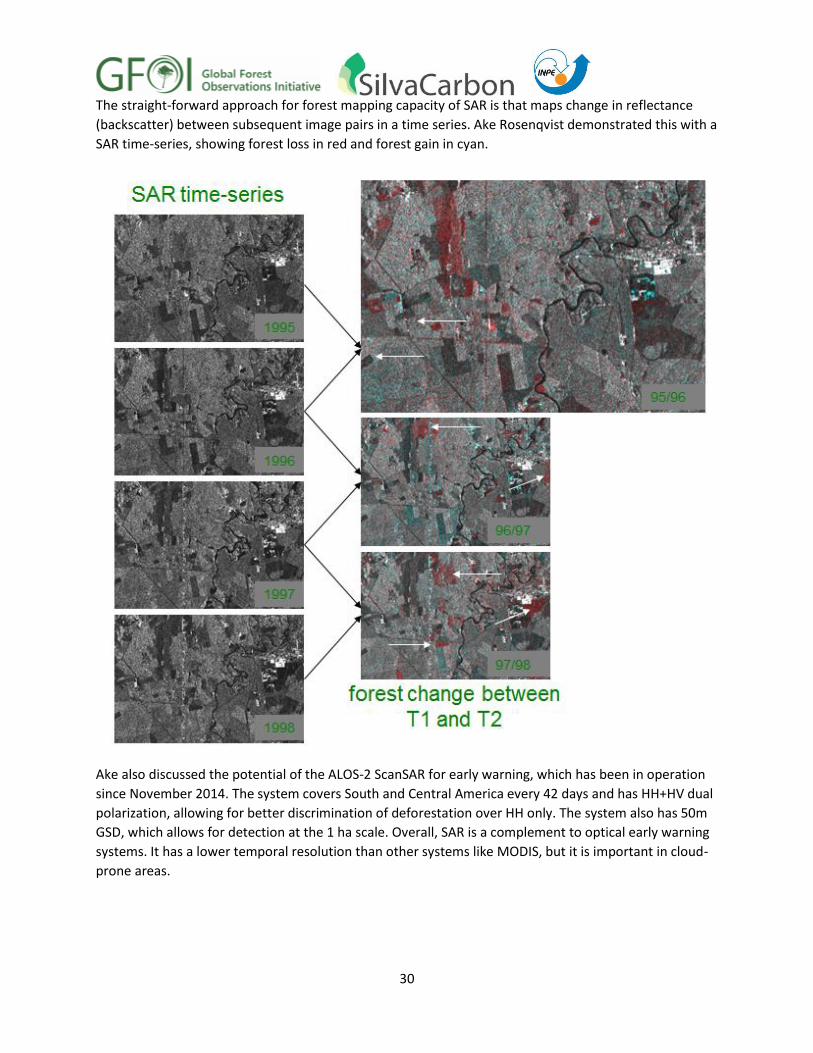
The straight-forward approach for forest mapping capacity of SAR is that maps change in reflectance
(backscatter) between subsequent image pairs in a time series. Ake Rosenqvist demonstrated this with a
SAR time-series, showing forest loss in red and forest gain in cyan.
Ake also discussed the potential of the ALOS-2 ScanSAR for early warning, which has been in operation
since November 2014. The system covers South and Central America every 42 days and has HH+HV dual
polarization, allowing for better discrimination of deforestation over HH only. The system also has 50m
GSD, which allows for detection at the 1 ha scale. Overall, SAR is a complement to optical early warning
systems. It has a lower temporal resolution than other systems like MODIS, but it is important in cloud-
prone areas.

31
Early Warning Systems for Fires
Firecast- Fire & Forest Monitoring & Forecasting System
Presenter: Jennifer Hewson, Conservation International
Conservation International, an organization founded in 1987 with 869 current employees, built the
Firecast system which is an integrated web-based tool to facilitate decisions. This system uses near real-
time Earth Observations to send alert information on fires, risk of fires, and disturbances to decision
makers. This system can also generate information in multiple languages and is aimed at responding to
user’s needs.
The end user products include the custom active fire
alerts, the drought/forest flammability index, and the fire
season severity forecasts. All of these can be found at
http://firecast.conservation.org. Users can subscribe to
this free service to receive email alerts, text files, KMLs,
and JPGs of the fire location. The GIS data used in the
system reflect the needs of the end users.
In Madagascar, fire is a serious threat to the habitat of
endangered tortoise species. A pilot was done to see
how quickly and effectively villages could respond to and
control active fires. Cash prizes were awarded for
development projects to improve schools, build wells,
and purchase solar panels.
Firecast includes a forest flammability risk model which is derived from satellite observations of rainfall,
temperature, and relative humidity. The products available include the actual risk index and daily rainfall
information. An example of the use of this model was by FAN, a conservation organization in Bolivia,
who uses the data to put into their own alert system (SATRIF), where the alerts were then disseminated
to local farming communities to inform on timing of burning.
The system also has a fire season severity component, which provides expected intensity of fires based
on weather conditions during the upcoming dry season. There is also an outreach and engagement
component, which focuses on understanding the needs of decision makers, engaging with government
institutions, providing capacity building, and soliciting feedback to improve the system.
Firecast Phase II is a three year NASA-funded project which will focus on system enhancements, new
products, exchanging mobile data, and further outreach. The intention is not to be a global system, but
to work in areas where CI has a strong field presence. Phase II will include Bolivia, Peru, Colombia,
Madagascar, and Indonesia. The system enhancements add near real-time fire products and burned
area products, provide alerts for deforestation and illegal logging, enable mobile data for validation
purposes, and expand fire risk and fire season severity forecasting. There are outreach activities in
Madagascar to integrate with the New Environmental Plan and in Indonesia to support projects of
peatlands management and to partner with Global Forest Watch in their fires platform. There is also
activity in Bolivia with FAN to facilitate the adoption of the system and to improve forest flammability
alerts.

32
For the future, there are proposed activities in Peru for case studies to demonstrate the impact of fires
and raise awareness, as well as to link with the REDD+ monitoring in Alto Mayo. There are also plans to
expand the alerts to Colombia. IDEAM is interested in integrating monitoring by local governments and
communities with alert systems such as Firecast.
The Global Early Warning System for Wildland Fire
Presenter: Bill de Groot, Natural Resources Canada
The Canadian Forest Fire Weather Index (FWI) system has been used in fire management since the
1970s. It is a global system with national applications in Europe, Asia, Southern Africa, North, Central
and South America, and the south Pacific region. The FWI system has 6 components including 3 fuel
moisture codes and 3 fire behavior indices. The fuel moisture codes are a simple accounting method to
keep track of fuels and the three codes are fine fuel moisture, duff moisture, and drought.
This whole system is entirely weather base.
Most of the fire systems are weather systems.
There are also fire behavior indices, which are
indicators of fire spreads, amount of fuel, and
fire intensity. Fire behavior integrates fire
weather, fuels, and topography.
The regional EWS prototype for Central and
South America was shown (right) which is based
in MODIS hotspots. For every hotspot there is a
pattern and from that pattern a prediction can
be created.
Often this system includes other remotely
sensed data, land cover, fuel information, and
information on the type of forest. To model fire
behavior emissions, the emissions are calculated
nationwide every year in Canada. Three fuel
consumption components are used:
aboveground, dead woody debris, and forest
floor. MODIS hotspots are used to determine
the daily fire activity. Then the group
interpolates the fire weather through the FWI
System to each pixel, and burns each cell using a
FWI-based fuel consumption algorithm.
Global Observation on Forest and Land Cover Dynamics GOFC-GOLD
Presenter: Wilfrid Schroeder, University of Maryland
GOFC-GOLD is a coordinated international effort consisting of a network of partners to improve the
quality and availability of observations of forests and land cover at regional and global scales by
producing and sharing useful, timely, and validated information products. GOFC-GOLD Land Cover & Fire
is a Panel of the Global Terrestrial Observing System GTOS (FAO GTOS Secretariat) and part of the Group

33
on Earth Observation (GEO). The group produces fire and fire related products for active fires, burned
areas, fire radiative power, global fire emissions, etc.
The GOFC-GOLD Fire Implementation team works with GOFC-GOLD Regional Networks to execute and
design projects and to develop consensus algorithms and methodologies for product generation and
validation. The Regional Networks connect researchers and data users, cater to user needs and foster
the transfer of technology, strengthen the involvement of local scientists, share regional data, secure
funding for sustained continuity, and improve and extend outreach activities.
Use of Spatially Refined Remote Sensing Active Fire Data Sets in Support of Fire Monitoring,
Management and Planning
Presenter: Wilfrid Schroeder, University of Maryland
At the University of Maryland, mid-infrared (SWIR) data are used to detect active fires. Wilfrid discussed
the evolution of fire mapping in near real-time. In 1980, fire mapping started with AVHRR 1km data for
12 hour active fire detection at sub-continental scaled. Then in 1990 GOES 4km high frequency active
fire detection was implemented at continental scales such as with South American biomass burning. In
the 2000s, MODIS 1km data allows for around 12 hour active fire detection and characterization at the
global scale for global fire monitoring. In 2010, VIIRS 375m data was implemented at global scales to
support landscape fire analyses such as fire growth simulations. VIIRS data filled the gaps for MODIS.
With VIIRS, there are more observations with improved small fire detection capabilities.
Landsat 8 and Sentinel-2 active fire data will supplement fire mapping and modeling applications in the
future and close the gap between strategic and tactical fire mapping. INPE/Cachoeira Paulista did a
study on small fire detection, where they burned a 3x10m area composed of firewood in a location in
Brazil which coincided with the Landsat 8 overpass. They did two fires, one in the morning (for the
Landsat overpass) and one in the afternoon (for the VIIRS overpass). This small fire was detected as
shown by the graph below.
For training and outreach, there will be a training workshop in Kruger National Park, South Africa in
August 2015. The VIIRS Active Fire website can be reached at http://viirsfire.geog.umd.edu/.
0
5000
10000
15000
20000
25000
30000
10:3011:0011:3012:0012:3013:0013:3014:0014:3015:0015:30
RadiantHeatFlux(w
.m-2)
LocalTime
LandsatOverpass
VIIRSOverpass

34
Operational Products Developed by INPE Fire Monitoring Program
Presenter: Fabiano Morelli, INPE
The fire pixels database has historic data from 1998
and integrates all data received by INPE ground stations
with their own methodology for processing and other
methods used in collaboration with other researchers.
Currently, there are 8 satellites collecting around 200
images per day. Average maps are generated to show
the fire dynamics throughout the season. Anomaly
maps, such as the one shown on the right, are also
produced which represent a departure from the
monthly average indicating abnormal fire activity.
Other operational products include statistical
references about fire monitoring, current situation
information to show the latest conditions, weather
products, fire risk to show how the characteristic of
vegetation impact fires, and fogograms to show the
variations in fire risk and weather variables for the next
four days at any point in the map. Burned area
mapping is also a useful product which is generated
with Landsat and MODIS data.
Working Groups
Participants from each of the countries were split into working groups (Peru, Ecuador, and Mexico and
then Colombia and Brazil) to discuss the points and questions below. The notes from this section were
provided from the groups.
Group 1: Peru/Ecuador (Mexico participating)
Points for Discussion/Questions:
Peru/Ecuador are both in the process of conceptualizing/beginning development of incorporating NRTM
into MRV. Not required for reporting, but multiple uses, for example:
1. early detection and improved governance/transparency of institutions responsible for management
2. Feed into deforestation monitoring system (i.e. facilitate detection & then mapping?) 3. rapid response/enforcement (illegal activities) 4. resource deployment (effective, plus planning of prescribed fires) 5. fire - response 6. general forest health
Additional considerations for inclusion in design of NRT system
7. What resolution do they anticipate needing for this activity? 8. What are the spatial characteristics of the main types of illegal activities they want to include in
the NRTM (small changes, but what patterns?) 9. Choice of satellite sensor

35
10. sensor expected lifetime 11. Transition plan to next-generation sensor? 12. Distribution/dissemination methods (who are the stakeholders and how do they need this
information – simple text files; JPGs of activity; ‘share-this-viewer type capability-, users cut/paste URL such as ForWarn demonstrated)
13. Review of systems available
Discussion:
Countries in the process of developing a NRTM system would benefit from access to a comparison study
of NRTM technologies that are available to assess the systems in terms of accuracy etc. – a system may
perform well visually, but is it accurate? Major elements to be included in the comparison study, which
includes a validation activity:
1. Assessment of ‘type’ of change the system identifies 2. Level of Operational readiness. ) 3. Ease of use? 4. Computational needs of the system 5. 6. Dissemination options for the results & ease of dissemination 7. Assessment of accuracy of maps by comparison to a reference sample, including levels of
omission/commission of forest loss 8. How the system operates in different forest ecosystems (for example, dry forest vs. humid) 9. How timely can the system capture change events (daily, weekly, etc) 10. Assessment of MMU of systems (aim of statistically verifying the minimum patch of forest loss
that one system can detect) Options for stratifying reference sample for use in validation could include:
1. Based on forest loss (i.e. change) 2. Based on forest loss AND ecoregions 3. Based on forest loss AND forest loss patch size (e.g., stratify by forest loss in 1-10ha, 11-20ha,
etc.) 4. Another option, focus on areas where early warning maps don’t agree, investigate this area to
understand what is causing that difference NB: the more variables included in the stratification…more complicated the stratification and analysis of
accuracy.
Peru
What they can do now? Agreement with Terra-I to but no one in MINAM currently dedicated to helping develop Terra-I Peru
Implementation of Terra-I will enable them to, for example, divide by concessions and understand the dynamics on ongoing activities per concession
Ease of use of Terra-I is v appealing
Regional groups have not used these data as yet
Peru has not looked at fires to date – so Firecast would be a good option here (Note: this is included in FireCast Phase II)
Activities like assessing general forest health are not the focus at the moment; mainly operational forest cover change is the key (ministries first need to understand forest change)
36
Ecuador
Conceptual model developed, but what would help them to go from a model to a system?
Dry forest, humid forest, Amazon in general is different in Ecuador to that of Brazil – maybe a MODIS-based system isn’t suitable here.
Smaller activities are more of a problem in Ecuador
Maybe a GUI-based system that takes out some of the analyst interaction would be suitable for Ecuador
Alternatively, there is interest in the development of a specific algorithm for use in the country Mexico
Level of usability of a NRTM system is a consideration for Mexico. Max-Mex, for example, the LCLCC system is being implemented in ministries @ national and provincial scale and this is proving problematic due to level of analyst needed
Group 2: Colombia/Brazil
Points for Discussion/Questions:
The Early Warning Systems in these countries are already in place.
Needs and improvement:
1) System improvements. Adaption of other systems/ development of new algorithms
2) Interest in additional uses of the warning system in place (e.g. fire, forest health, diseases, rates
of recovery, harvest/deforestation)
3) Frequency of rapid response, and reporting intervals
4) Data needed (ie. cloud covered areas) based on 1, 2, and 3
5) Products: binary or magnitudes
6) System to disseminate early response/enforcement
Future vision and direction of the system:
7) Transition plan to next-generation sensors (life expectancy of the sensors currently used)
8) Community involvement on reporting changes on real-time.
Discussion:
1) System improvements. Adaption of other systems/ development of new algorithms
For Brazil, IBAMA is running the systems using virtual interpretation with the purpose of not accepting
errors. The visual interpretation is the more reliable as it has fewer errors. The automatic classification
has around 80% accuracy, in the whole system with the visual interpretation the accuracy is 95%. There
is no automatic processing for detecting the deforested area; the automatization is to create a fraction
image. Upon this one the user will use interpretation.
Julio Dalge (INPE) commented that when the scientists are doing the same thing for years, there is a
traditional component. The remote sensing department and the image processing department have not
reviewed available algorithms. Re-training people is a big issue if you change the algorithm. It is a trade-
off among improving the systems and the cost of training.
37
The value of having different systems like Brazil add to the challenge of adding new capabilities to the
systems, like for example adding the capacity to evaluate degradation, palm plantation, etc. In some
extends some of the systems are subsystems, like PRODES is part of the DETER System.
Gustavo Galindo (IDEAM) stated that TerraAmazon is being used for quality control, and they are
focusing in that capacity of TerraAmazon instead of using the complete system. The key is that with any
system they have to rely on the visual interpretation as the final step, and it is important to train the
people in that. Colombia is reviewing some of the systems ready in Brazil, and there are a lot of
commission errors, but with the correction the results are good. They are finding errors in the validation
that they have done with drones. They have reviewed terra-i. For Colombia it is important to be
operational at the government level, they cannot access omissions errors for operational systems. In
terra-i they were analyzing 2004 and it was a Nina event, so Colombia understood those errors, but
terra-i presented the data just as it was.
Cesar Diniz (FAO International Consultant) stated that regardless, you are going to combine visual
interpretation and automatic algorithm. There is no single algorithm that can detect change out of the
ranges such as different biomass in Brazil. The combined approach for him is a bad solution. They are
trying to segment the system (one system for type of land). The system relies on how the users are
trained.
Coordination and communication is enhancing with the different centers of INPE.
In Colombia data are generated at the national level for the regions, and in Brazil there are others
institutions that need to agree with the release of the data.
Cesar Diniz (FAO International Consultant) added that when DETER data was release in 2004, they
started seeing remote sensing and understood that there were things they were not seeing. They
understood that MODIS data has bigger pixels. One thing that has to be clear, is releasing to the general
public, not releasing to the environmental agencies. INPE release to the environmental agencies daily
since 2004 with the beginning of DETER. The presidential mandate only applies to the public. Simply put,
the general public is not aware of what is happening.
2) Interest in additional uses of the warning system in place (e.g. fire, forest health, diseases, rates of
recovery, harvest/deforestation)
Brazil: INPE does not have the needed equipment to research these areas for forest health. They can go
to the level of research for droughts. If they are going to research, they will leave the operational area.
They have a group of researchers, but they do not recognize any researchers working in an operational
area. Researchers just do not like to be committed to something operational, because of the trade-off.
Colombia: Forest health is also research. For research the opportunity is joining with universities, it is a
very small window of opportunity for IDEAM to do research and link that to operational systems.
The link is very important. The countries will learn and make it operational. The science is applied to the
benefit of the population. Early warning system is indirect with REDD. For example Colombia is starting
38
monitoring, but they do not know about the drivers – the lack is related to the fact that they are not
connected to REDD. The money is where REDD is.
Cesar Diniz (FAO International Consultant): They are starting to learn more about the forest and the
dynamics. 30% of the income is from agriculture.
3) Frequency of rapid response, and reporting intervals
Colombia is reporting the change every 6 months. The issue with reporting more frequently is clouds.
More than that, most of the early warning systems are based in MODIS, where the pixels are too coarse
to distinguish between degradation and deforestation.
4) Data needed (ie. cloud covered areas) based on 1, 2, and 3 and 7) Transition plan to next-generation
sensors (life expectancy of the sensors currently used)
For clouds they are only two solutions now for Brazil: radar or multiple uses of sensors. The price for
radar is extremely expensive for Brazil. It is cheaper to build a satellite. Colombia will have full support of
CBERS. Colombia will have exactly the same coverage for CBERS than Brazil has.
Colombia is using a Landsat base every 15 days. They were planning on using ScanSAR, but it was about
$15 per image. Planet labs is another option, however the calibration is not accurate.
5) Products: binary or magnitudes
Binary is deforestation and not deforestation. If the product is to alert for deforestation and not
deforestation, then it is binary. PRODES quantifies magnitude, with how much of the forest is lost or
gained. We must know where the alert is for with details on the percentage of the area percentage is
that used for different land uses. By law In the Amazon, if you buy an area of land, you can cut 20% of
the area.
Colombia has magnitude at this time. They only want to know where things are happening. There is
another system, which is doing the work of deforestation area.
8) Community involvement on reporting changes on real-time.
Brazil: Is not possible to include communities on DETER. Deforestation gives the communities money.
The range of employment is impacted by deforestation. There is a program in Brazil calling green
municipality, it is about how in a couple of years the communities will move out of the deforestation
model and then they can join the program and get compensation for conservation.
Gustavo Galindo (IDEAM): at the local level one of the problems is how to relate to the land tenure. The
early warning systems have to work at the two levels, alongside the communities because they are the
owners of the forest. This only works in the communities that have very good governance. About 70% of
the deforestation of the countries is concentrated in 6 Landsat images, so there is hope to center the
work there and use higher resolutions images.

39
Day 5: January 23, 2015
Capacity Building Initiatives
INPE Capacity Building
Presenter: Cesar Diniz, FAO International Consultant
As a background, Cesar Diniz discussed the Amazon program, specifically focusing on PRODES and
TerraAmazon. PRODES is a system for measuring the annual rate of deforestation and the program can
be divided into three periods. In 1988 when PRODES began, processing was non-existent, so the first
period (1988-1996) was analogical. INPE used printed maps and had an overlay to draw polygons with
color pens. This overlay was then digitized with a scanner. This was a very detailed and tedious process,
which is why Brazil decided to go a different direction to make the drawing process easier, which
resulted in the Spring program during the second period (1997-2004). The Spring system was the first
digital program. The base of Spring was Landsat, and it had a database for digital image processing.
Finally, TerraAmazon started the third period (2004-Present). This put everyone together in a single
multi-user environment. It is a unified database, where there is topological control to ensure
overlapping areas and gap areas are accounted for based on control rules that are made by the user.
Difference rules and clean rules can be applied to change the way the data are displayed.
TerraAmazon allows people to work together on the same project. As shown below, individual work will
appear with green cells, while a colleague’s will appear red.
Not every user can do everything that they want, but rather they each have access based on their
position.
40
There will be three units for INPE Amazon. The current unit, Belem, focuses on satellite monitoring for
the Brazilian Legal Amazon and capacity building for tropical forest monitoring at the national and
international level. Belem has two training rooms as well as a large auditorium. The second upcoming
unit, Boa Vista, will receive, process, and disseminate satellite imagery, while the third upcoming unit in
Manaus will support studies for modeling climate change.
In terms of capacity building, there are three current projects with FAO and ACTO, which focus on how
to use the programs to do visual interpretation. Currently, the training is only using Prodes as the main
example but INPE is willing to expand. The projects use the basic concepts of remote sensing, digital
image processing, and geoprocessing to allow technicians to return to their countries with a better
understanding of the process. The INPE website provides training information with the name of the
trained individual and the type of training received to avoid repetition.
The first course was in October 2010. Since then, almost 300 people have been trained on the
international level. This number greatly increases with the national level.
Questions/Comments:
Doug Muchoney (SilvaCarbon) asked about the current status of Spring. INPE responded there
they are struggling to keep maintaining Spring due to budgeting issues. INPE intends to keep
updating it and they expect to have a new version by the end of the year.
Pontus Olofsson (BU) asked if it would be helpful to get data in a global equal area projection as
it would reduce the steps in resampling. INPE responded that it would be beneficial for sure.
Gustavo Galindo (IDEAM) asked if there are modifications needed to have PRODES work in other
types of forest. Dalton Valeriano responded that the issue right now is to move out of evergreen
rainforest as the whole methodology INPE has for evergreen forest is not very translatable to
other forests. INPE is very interested in having something similar to Terra-i. The technique they
have is not directly applicable to seasonal forests. They have the funding to do this, but it is
difficult to get started.
Capacity building efforts FAO
Presenter: Inge Jonckheere, FAO Forestry Department
FAO has advantages in information systems and early warning systems through programs such as the
Global Information and Early Warning System (GIEWS), EMPRES (for hazards such as pests and diseases),
the Global Forest Fire Information Management System (GFIMS), the Global Early Warning System
(GLEWS), and UN-REDD, which has a country specific web-platform to monitor REDD+ activities. For
FAO, it is very important that these programs are simple, country specific, and open source.
From the REDD+ Decision 4/CP.15, developing countries have to measure and report on forest-related
greenhouse gas emissions in a transparent way. FAO looked at what the real issue is for countries with
deforestation and found an issue in access to satellite data. As a solution, FAO will make the satellite
data and processing tools available over the internet with the appropriate training for each country.
The Space Data Management System (SDMS) will acquire, query, process, and deliver earth observation
data and forest information products to developing countries. It is a very new program and a great
opportunity for countries.
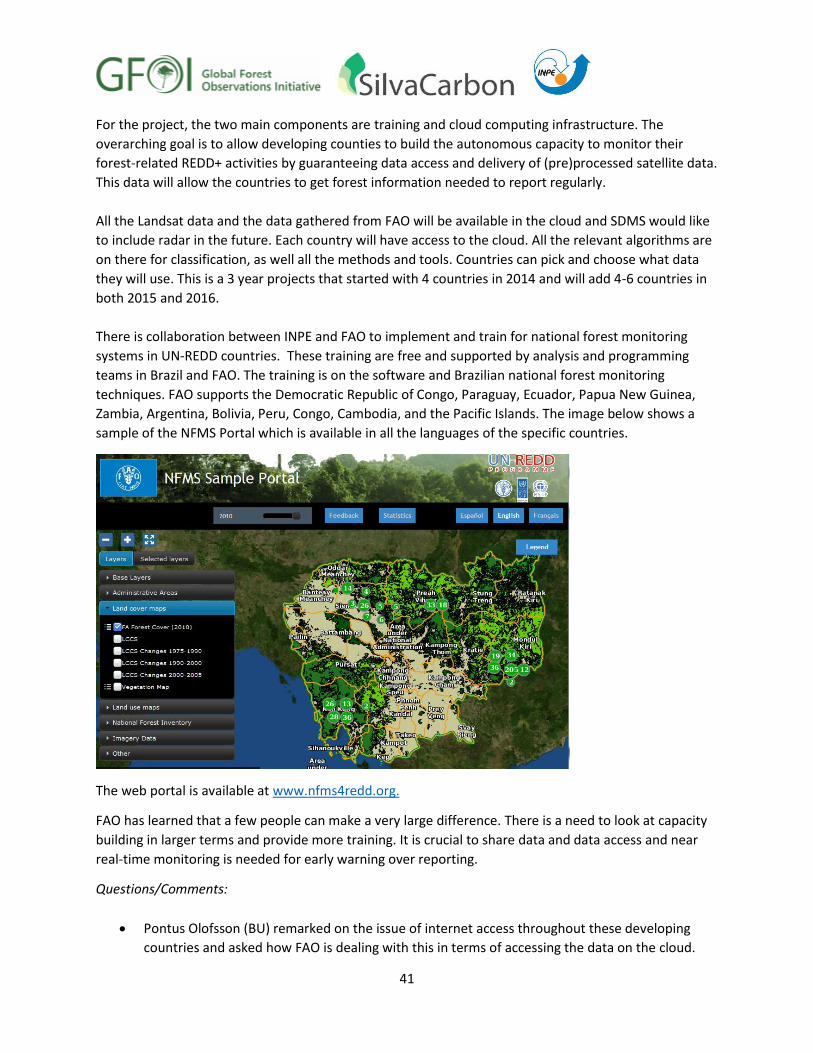
41
For the project, the two main components are training and cloud computing infrastructure. The
overarching goal is to allow developing counties to build the autonomous capacity to monitor their
forest-related REDD+ activities by guaranteeing data access and delivery of (pre)processed satellite data.
This data will allow the countries to get forest information needed to report regularly.
All the Landsat data and the data gathered from FAO will be available in the cloud and SDMS would like
to include radar in the future. Each country will have access to the cloud. All the relevant algorithms are
on there for classification, as well all the methods and tools. Countries can pick and choose what data
they will use. This is a 3 year projects that started with 4 countries in 2014 and will add 4-6 countries in
both 2015 and 2016.
There is collaboration between INPE and FAO to implement and train for national forest monitoring
systems in UN-REDD countries. These training are free and supported by analysis and programming
teams in Brazil and FAO. The training is on the software and Brazilian national forest monitoring
techniques. FAO supports the Democratic Republic of Congo, Paraguay, Ecuador, Papua New Guinea,
Zambia, Argentina, Bolivia, Peru, Congo, Cambodia, and the Pacific Islands. The image below shows a
sample of the NFMS Portal which is available in all the languages of the specific countries.
The web portal is available at www.nfms4redd.org.
FAO has learned that a few people can make a very large difference. There is a need to look at capacity
building in larger terms and provide more training. It is crucial to share data and data access and near
real-time monitoring is needed for early warning over reporting.
Questions/Comments:
Pontus Olofsson (BU) remarked on the issue of internet access throughout these developing
countries and asked how FAO is dealing with this in terms of accessing the data on the cloud.
42
Inge Jonckherre responded that FAO is looking into satellite internet options for each country,
but for this part the country only has to download the data they want, rather than the Landsat
mosaics that took so much time before.
Gustavo Galindo (IDEAM) asked how the license is managed for the commercial imagery. Inge
stated that RapidEye is aware of this project and has come up with specific license restrictions.
However, everyone will be able to use the data at both the national and local level.
ALOS PALSAR 25m Global Mosaic Data
Presenter: Ake Rosenqvist, soloEO
Since October 31, 2014, JAXA has made PALSAR 25m global mosaic data openly available free of charge.
Annual mosaics from 2007- 2010 are available in 1°x1° tiles. This data can be downloaded from
http://www.eorc.jaxa.jp/ALOS/en/palsar_fnf/fnf_index.htm. The user needs to register, but then they
can download tiles of an area of interest for certain years. The user can download forest/non forest data
or actual imagery, though Ake Rosenqvist recommends downloading the actual PALSAR imagery. The
user will then get the raw data at 4500x4500 pixels as a 16 bit GEOTIF. This data are radiometrically and
geometrically corrected for topography.
Panel Discussion A panel was held to discuss additional questions from the participants.
What would be the different levels of development for an early warning system? What would be the steps and milestones?
Pontus Olofsson (BU) answered that is depends on the aim. For example, if the country wants to
develop their own system the first step would be to make a decision on whether or not to use
something already made like Terra-I or make something new.
Brian Zutta (MINAM) stated that this was his question and clarified by saying that it would be
good to have this mapped out in a step-by-step manual. There needs to be a decision of what
those milestones are and what is needed to get there. This could be like a cookbook or as some
form of comparison.
Dalton Valeriano (INPE) commented that in Brazil early warning system are very effective
because there is an 80% chance that the change is illegal deforestation. The main purpose for
Brazil was to produce very quick information for the country to act. But some other countries
may have a different aim. Dalton saw very clever approaches for early warning here, but the
usefulness depends on the aim.
How does INPE classify or report the areas that have been regenerated to forest class since the year that began PRODES project?
Marcos Adami (INPE) responded that INPE has a project (TerraClass) that counts classes like
secondary vegetation because the regrowth needs to be classified into the different types of
vegetation that is growing.
Dalton Valeriano (INPE) added that today Brazil is very careful in deciding if burned areas are
deforestation or not. It is better to not map deforestation until the next year to see that it is
confirmed. With a time series, a country can see when an area was disturbed first. This is not
difficult, but there is a need for money and people.
43
Are there plans to extend these systems to other forest countries (e.g. Tanzania, Cameroon, DR, Indonesia)
Pontus Olofsson (BU) stated that the systems are active in those countries. There will be the
same type of workshop in those countries. If they are interested they will receive support.
First I have a recommendation rather than a question: this group might want to build on the political leverage that GEO/GFOI/FAO, etc. provide to try and establish mechanisms to facilitate access to existing SAR data for the region.
Inge Jonckheere (FAO) commented that yes, it will happen from the FAO and GFOI
perspective. For GFOI, it will be crucial to have good access and they are optimistic.
Wilfrid Schroeder (UMD) who recommended this point commented on his own experience
with JAXA, who opened up its archive to those working in his project. Wilfrid recommended
that the group should start off with an attempt to get the data free of charge from
collaboration leads.
Should a regional "golden tile" be selected (e.g., a single Landsat scene in a tri-national border like Brazil-Bolivia-Peru) allowing the different countries/groups to more easily test - and most importantly - compare new methods and techniques? This could facilitate evaluation of the different approaches used by each country, therefore identifying qualities and limitations involved.
Wilfrid Schroeder (UMD) commented that this was his suggestion and that he attended a
similar workshop with this in mind. If the countries could leverage the time and energy that
they did on providing this information, a small area could be selected as a starting point. By
combining three countries, the group could take advantage of what is being done and put
the data in one database to see which approaches are going well. For the starting point, a
few groups could start testing methodologies and then export to other areas and share the
investment of the area.
Did you have viable (economic and operationally) automatic early warning systems to monitor large areas? Is it using better resolution than MODIS or is it based on radar? For the matter of enriching the discussion…Is it better to focus on development of fully automatic systems or should we focus in visual interpretation methods? What is to be considered here?
Dalton Valeriano (INPE) commented that INPE has to try as much as they can and they have to
be fast and accurate, because if the information is delivered too late it will not be relevant.
Accuracy is something that should be taken into consideration and it is better to omit than
commit. The country should also abandoned any automatic approach to guarantee a level of
accuracy that will not cost as much.
Gustavo Galindo (IDEAM) stated that early warning is very important as well as the effects it will
have. In Colombia, some change was detected and alerts were sent out, which resulted in the
media reporting. This area of change was only detecting logging, and they had to do a visual
correction to take out these areas.
Cesar Diniz (FAO Consultant) stated that it is very dependent on the country and it will come to
whether or not the country has a high level algorithm capability. If so, the country should
combine this information. If the capacity is not there, then it is better to spend more time on
basics remote sensing.

44
It is interesting to explore how capacity building and knowledge transfer may take place without interfering with each country sovereignty….thoughts?
Inge Jonckheere (FAO) stated that it is true that this is a very delicate point and that before FAO
it should serve the needs of the countries. FAO is not there to say what a country is doing is
wrong but rather to say there is another option. FAO is just offering support, but there is
definitely a delicate balance.
Sylvia Wilson (SilvaCarbon) commented that sometimes the decisions in implementing these
tools are developed at the top level, such as from the donors who think it will be helpful, but a
lot of times the countries were never even asked if it would be helpful.
Dalton Valeriano (INPE) stated that INPE has dealt with the easy part so far in how to deal with
evergreen forest. INPE needs to think about how to deal with long time series of Landsat data.
They are already thinking about some limitation in terms of memory space for this data. There
should be a dialogue between GEO and Google on getting each country access to their own
imagery. Otherwise the countries will just repeat what Google has already done.
o Wilfrid Schroeder (UMD) stated that he went to a meeting in Colorado with Rebecca
Moore (Google). Google has a really aggressive agenda for collecting, archiving, and
delivering data. The group needs to be careful in how they negotiate with Google, as it
could end either really well or poorly.
Could FAO include a firecast warning system? Could GFOI offer training in design and implementation in algorithms?
Inge Jonckheere (FAO) supposed that this could be done. There is a budget for training, but
these are REDD countries.
Sylvia Wilson (SilvaCarbon) added that SilvaCarbon and FAO could provide this training. It is not
impossible, but rather a matter of interest based on the countries.
Is it possible to combine many methodologies for the same region? More information about the systems already developed (the way they work), and how they compare to each other. Advantages and disadvantages.
Pontus Olofsson (BU) commented that they would need information if they wanted to combine
methodologies.
Oscar Bautista (Terra-i) stated that with different methodologies, the result is the result of those
methods. It is important to measure in the same way to later compare and have an accurate
number. The most important is the result rather than the methodology.
Julio Dalge (INPE) added that if you try to compare the numbers it is too complex. When there is
an operational system in place, there is not much room to accommodate many methodologies
because in the end they have to give a very robust set of number to the government.
Dalton Valeriano (INPE) added that everything has to be consistent, and once a country decides
on one method they must stick with it for a long time, otherwise the data are not reliable.
Oscar Bautista also added that it might be useful to compare the results between the countries.
Gustavo Galindo (IDEAM) stated that it would be beneficial to compare, as it is a richer result to
compare different methods. It is important there is an official result, and it can be mixed which
is the complicated part.
45
I think it would be useful to conduct a study comparing the different EWS products that are available. Such a study would include measures of performance, cost, ease of use, ease of implementation, computing resources needed, etc. This would be highly valuable for countries looking to implement or improve their EWS capabilities. Maybe SilvaCarbon should fund and initiate such a study.
Pontus Olofsson (BU) stated that for countries like Peru and Ecuador it would be helpful to make
that type of decision if they have a comparison study.
Sylvia Wilson (SilvaCarbon) added that for the SilvaCarbon program it is not impossible but
depends on how efficient it will be.
In terms of traceability, be part of the SDMS would let the negotiations of REDD+ be more transparent and easily?
Inge Jonckheere (FAO) answered that if it is the data download then no. If it is for reporting,
then yes. It is about how the statistics are created, it is good to have open algorithms. For sure it
would help country to reprocess.
Closing
The 12th Regional Workshop was closed with a thank you for all to attending from Dalton Valeriano. INPE
was very pleased to host this meeting and hope to be a part of future workshops. Sylvia Wilson closed
with a special thanks from SilvaCarbon to INPE for hosting the event.

46
List of Participants:
Name Institution Email
1 Nestor Acosta MAE- Ecuador [email protected]
3 Marcos Adami INPE -Brazil [email protected]
4 Marcia Alvarenga INPE - Brazil [email protected]
5 Oscar Bautista CIAT - Colombia [email protected]
6 Andrea Bustos Ministry of Environment - Ecuador [email protected]
7 Chelsea Cook USGS - US [email protected]
8 Julio Dalge INPE - Brazil [email protected]
9 Cesar Diniz INPE - Brazil [email protected]
10 Leila Fonseca INPE - Brazil [email protected]
11 Gustavo Galindo IDEAM - Colombia [email protected]
12 Eliakim Hamunyela Wageningen University - The Netherlands [email protected]
13 William Hargrove U.S. Forest Service [email protected]
14 Ximena Herrera Ministry of Environment - Ecuador [email protected]
15 Jennifer Hewson Conservation International - US [email protected]
16 Inge Jonckheere FAO - Italy [email protected]
17 Fabiano Morelli INPE - Brazil [email protected]
18 Doug Muchoney USGS - US [email protected]
19 Igor Narvaes Brazil [email protected]
20 Pontus Olofsson Boston University - US [email protected]
21 Alicia Peduzzi U.S. Forest Service [email protected]
22 Raul Rodriguez Mexico [email protected]
23 Ake Rosenqvist JAXA - Japan [email protected]
24 Guillermo Sanchez U.S. Forest Service - Ecuador [email protected]
25 Wilfrid Schroeder NOAA-US [email protected]
26 Dalton Valeriano INPE - Brazil [email protected]
27 Sergio Villela CONAFOR - Mexico [email protected]
28 Sylvia Wilson USGS - US [email protected]
29 Brian Zutta MINAM - Peru [email protected]
Report by: Chelsea Cook