1268-1658-1-PB
10
1 ______________________________________________________________________________ H. Chen, Y. Lan, W. Hoffmann, W. Wu and S. Zhang. “Development of a Data Acquisition and Processing System for Precision Agriculture”. Agricultural Engineering International: the CIGR Ejournal. Manuscript. IT 08 001. Vol. X. December, 2008. Development of a Data Acquisition and Processing System for Precision Agriculture H. Chen 1 , Y. Lan 2 , W. Wu 1 , W. C. Hoffmann 2 , S. Zhang 1, 3 1 Jilin University, 5988 Renmin Street, Chang Chun, China, 130022 2 USDA-ARS-APMRU, College Station, TX 77845 3 Texas A&M University, College Station, TX 77843 *Correspondence Author: Email:[email protected], Tel: 979-260-3759 ABSTRACT A data acquisition and processing system for precision agriculture was developed by using MapX5.0 and Visual C6.0. This system can be used easily and quickly for drawing grid maps in- field, making out parameters for grid-reorganization, guiding for in-field data collection, converting data between different formats, managing databases, and drawing thematic maps for VRT(variable rate technology) application in-field. Experiment results have shown that the system works well for data acquisition of variable rate fertilizer application for precision agriculture and for generating output field maps. This paper describes the design and implementation of the software programs using MapX5.0 and Visual C 6.0 for data acquisition and processing for precision agriculture. Keywords: Precision agriculture, data acquisition and processing, VC6.0, MapX5.0, China 1. INTRODUCTION In recent years, the research and application of precision agriculture has been deve loping rapidly. Geospatial Information System, GIS, is one of the key technologies in precision ag riculture technology systems. GIS uses a software platform for analyzing, processing, and displaying spatial geographical information. There are hundreds of kinds of commercial GIS software programs currently being used widely in the world. Howeve r, these programs can not fit the requests of particular users directly as commercial GIS products for all kinds of users. When using commercial GIS software on a particular agricultural field, many users usually need to make further developments and ada ptations of the software. Some scholars and researchers have
Transcript of 1268-1658-1-PB

8/3/2019 1268-1658-1-PB
http://slidepdf.com/reader/full/1268-1658-1-pb 1/10
1
______________________________________________________________________________
H. Chen, Y. Lan, W. Hoffmann, W. Wu and S. Zhang. “Development of a Data Acquisition andProcessing System for Precision Agriculture”. Agricultural Engineering International: the CIGR
Ejournal. Manuscript. IT 08 001. Vol. X. December, 2008.
Development of a Data Acquisition and Processing System for Precision
Agriculture
H. Chen1, Y. Lan
2, W. Wu
1, W. C. Hoffmann
2, S. Zhang
1, 3
1Jilin University, 5988 Renmin Street, Chang Chun, China, 130022
2USDA-ARS-APMRU, College Station, TX 778453Texas A&M University, College Station, TX 77843
*Correspondence Author: Email:[email protected], Tel: 979-260-3759
ABSTRACT
A data acquisition and processing system for precision agriculture was developed by using
MapX5.0 and Visual C6.0. This system can be used easily and quickly for drawing grid maps in-field, making out parameters for grid-reorganization, guiding for in-field data collection,
converting data between different formats, managing databases, and drawing thematic maps for
VRT(variable rate technology) application in-field. Experiment results have shown that the
system works well for data acquisition of variable rate fertilizer application for precisionagriculture and for generating output field maps. This paper describes the design and
implementation of the software programs using MapX5.0 and Visual C 6.0 for data acquisition
and processing for precision agriculture.
Keywords: Precision agriculture, data acquisition and processing, VC6.0, MapX5.0, China
1. INTRODUCTION
In recent years, the research and application of precision agriculture has been developing rapidly.
Geospatial Information System, GIS, is one of the key technologies in precision agriculturetechnology systems. GIS uses a software platform for analyzing, processing, and displaying
spatial geographical information. There are hundreds of kinds of commercial GIS software
programs currently being used widely in the world. However, these programs can not fit therequests of particular users directly as commercial GIS products for all kinds of users. When
using commercial GIS software on a particular agricultural field, many users usually need tomake further developments and adaptations of the software. Some scholars and researchers have
8/3/2019 1268-1658-1-PB
http://slidepdf.com/reader/full/1268-1658-1-pb 2/10
2
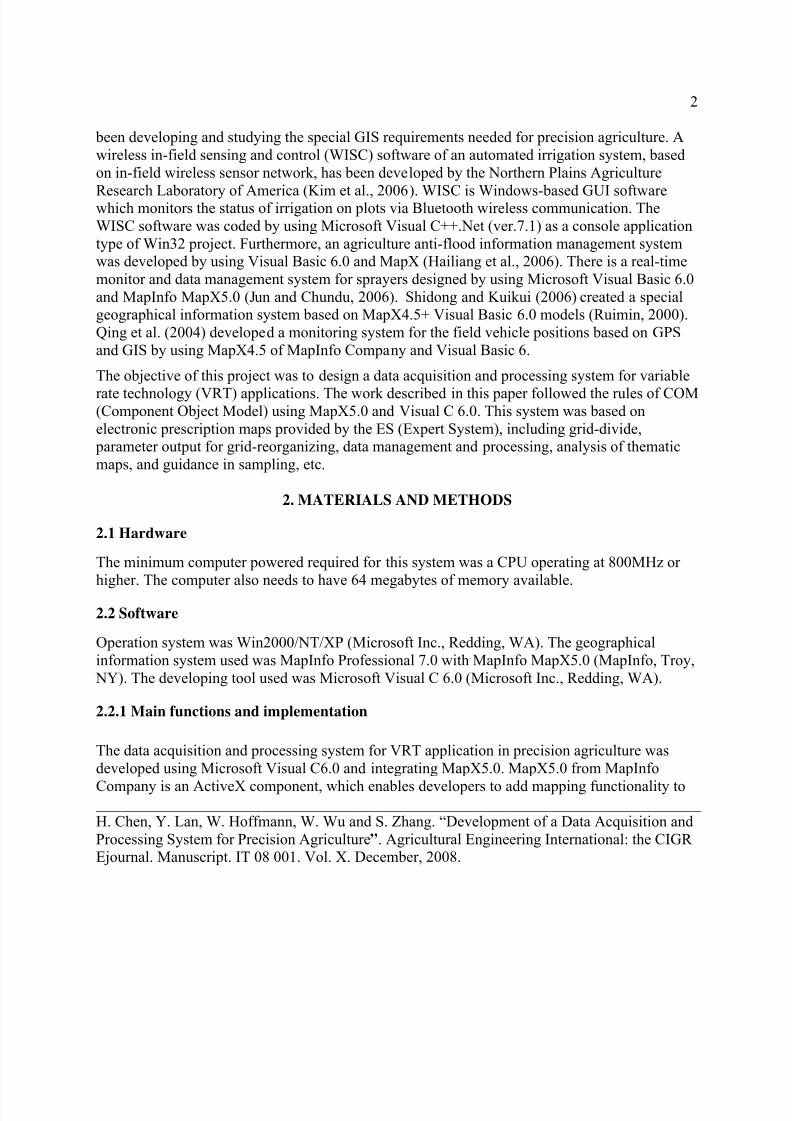
been developing and studying the special GIS requirements needed for precision agriculture. A
wireless in-field sensing and control (WISC) software of an automated irrigation system, based
on in-field wireless sensor network, has been developed by the Northern Plains Agriculture
Research Laboratory of America (Kim et al., 2006). WISC is Windows-based GUI softwarewhich monitors the status of irrigation on plots via Bluetooth wireless communication. The
WISC software was coded by using Microsoft Visual C++.Net (ver.7.1) as a console application
type of Win32 project. Furthermore, an agriculture anti-flood information management systemwas developed by using Visual Basic 6.0 and MapX (Hailiang et al., 2006). There is a real-time
monitor and data management system for sprayers designed by using Microsoft Visual Basic 6.0
and MapInfo MapX5.0 (Jun and Chundu, 2006). Shidong and Kuikui (2006) created a specialgeographical information system based on MapX4.5+ Visual Basic 6.0 models (Ruimin, 2000).
Qing et al. (2004) developed a monitoring system for the field vehicle positions based on GPS
and GIS by using MapX4.5 of MapInfo Company and Visual Basic 6.
The objective of this project was to design a data acquisition and processing system for variable
rate technology (VRT) applications. The work described in this paper followed the rules of COM(Component Object Model) using MapX5.0 and Visual C 6.0. This system was based on
electronic prescription maps provided by the ES (Expert System), including grid-divide, parameter output for grid-reorganizing, data management and processing, analysis of thematic
maps, and guidance in sampling, etc.
2. MATERIALS AND METHODS
2.1 Hardware
The minimum computer powered required for this system was a CPU operating at 800MHz or
higher. The computer also needs to have 64 megabytes of memory available.
2.2 Software
Operation system was Win2000/NT/XP (Microsoft Inc., Redding, WA). The geographical
information system used was MapInfo Professional 7.0 with MapInfo MapX5.0 (MapInfo, Troy,
NY). The developing tool used was Microsoft Visual C 6.0 (Microsoft Inc., Redding, WA).
2.2.1 Main functions and implementation
The data acquisition and processing system for VRT application in precision agriculture was
developed using Microsoft Visual C6.0 and integrating MapX5.0. MapX5.0 from MapInfo
Company is an ActiveX component, which enables developers to add mapping functionality to ______________________________________________________________________________
H. Chen, Y. Lan, W. Hoffmann, W. Wu and S. Zhang. “Development of a Data Acquisition and
Processing System for Precision Agriculture”. Agricultural Engineering International: the CIGR Ejournal. Manuscript. IT 08 001. Vol. X. December, 2008.

8/3/2019 1268-1658-1-PB
http://slidepdf.com/reader/full/1268-1658-1-pb 3/10
3
any application quickly and easily. In this project, ActiveX components were the programmable
and reusable COM-base objects, and they communicated with other applications through
interfaces of property pages, events, and methods. COM is a group of protocols for interface
between modules. Applying COM can build a link between two modules and make themcommunicate with each other by using an “interface” as soon as the link is constructed.
The data acquisition and processing system, developed based on Microsoft Visual C 6.0 and
MapX5.0 was specially applied in precision agriculture production. It consists of functions of the
MapInfo platform. Here, the key points of the system’s design are not only in designing and programming its basic functions, but in solving practical problems in variable rate technology
application in order to meet the needs of automatic variable rate applicators. The functions of the
system are as follows.
2.3 Design for User Interface
In general, the style and features of a user interface (UI) are sorted into three classes in softwaredevelopment, namely UI of menu, table, and command lines. These three classes of UI have their
own styles and features respectively. In the system, a complex interface style was made of amenu, a table, and command lines according to needs of the users and applications. The UI was
composed of five parts: main menu, toolbar, operating map window, parameter input window for
grid-divide, and parameter output window for grid-reorganize. Figure 1 shows the main UI of thesystem working. The basic functions of the operating map were achieved with menu and
command lines on the screen. The key maps and functions of grid-divide used a table style to
display. Thus, this kind of complex interface style is concise and easy to operate.
2.4 Functions and Implementation
According to the requirements of the map-based VRT (Variable Rate Technology) application,the system functions were sorted into five objects to be operated: map, menu command, dialog box, toolbar, and serial communication interface by means of the OOP (Object-Oriented Method
of Programming). After building models for every object and link between the objects, the
objects are available through their property pages, methods, and events. The main functions are
as follows.
3. RESULTS AND DISCUSSION
3.1 Map
This system has the general functions of operating a map in GIS, such as zoom out, zoom in,
navigation, and map editor (Fig. 2). All these functions were implemented by operating a set of objects of m_ctrlMapX by citing property pagers and methods of objects integrated in MapX5.0.
______________________________________________________________________________
H. Chen, Y. Lan, W. Hoffmann, W. Wu and S. Zhang. “Development of a Data Acquisition andProcessing System for Precision Agriculture”. Agricultural Engineering International: the CIGR
Ejournal. Manuscript. IT 08 001. Vol. X. December, 2008.

8/3/2019 1268-1658-1-PB
http://slidepdf.com/reader/full/1268-1658-1-pb 4/10
4
Figure1. User interface for variable rate applications.
In the software designing procedure, the first step is to build a group of tools and menus through programming in VC 6.0, then, commands are carried out in response to the functions of the tools
and menu commands. The functions of the operating maps, such as zoom out, zoom in, pan,layer etc., are implemented by using the map controls to cite predefined tools in MapX5.0.
______________________________________________________________________________
H. Chen, Y. Lan, W. Hoffmann, W. Wu and S. Zhang. “Development of a Data Acquisition andProcessing System for Precision Agriculture”. Agricultural Engineering International: the CIGR
Ejournal. Manuscript. IT 08 001. Vol. X. December, 2008.
Map window Parameter input window for
grid-divide
Parameter output window for
grid-recognize
Main Menu Toolbar

8/3/2019 1268-1658-1-PB
http://slidepdf.com/reader/full/1268-1658-1-pb 5/10
5
.
Figure 2. Toolbar designed for MAP functions in the user interface.
3.2 Data Management and Processing
This system can manage three kinds of format data:﹡.tab of MapInfo,﹡.gst of MapX and﹡.txt
of Windows. It is able to construct and process the electronic maps in vector format, add and
save map data easily, record and save the data coming from the GPS receiver to meet the needsof VRT applications, which are map-based.
In the system, the data management module was divided into three sub-modules, which wereused for building, saving the data files with *.gst format and *.tab formats, and recording data
received by the GPS receiver respectively.
The first was called a map sub-module for data with *.gst format. The *.gst format file can be directly loaded-on when clicking the drop-down menu [Map]|[Open GST] in the working
window of the system. At the same time, a *.tab format file can also be opened and saved as
a *.gst format file by the clicking drop-down menu [Map]|[Save GST].
The second was a data sub-module for files with *.tab format. A *.tab format file can be built and loaded directly when clicking the drop-down menu [Map]| [Building TAB layer]. If
the users want to add spatial data to a map, they can easily input attribute data when building
data tables without using MapInfo platform. A *.tab layer is added to the GST layer directly by clicking the drop-down menu [Map]|[Add TAB layer] in loading a *.tab function.
______________________________________________________________________________
H. Chen, Y. Lan, W. Hoffmann, W. Wu and S. Zhang. “Development of a Data Acquisition andProcessing System for Precision Agriculture”. Agricultural Engineering International: the CIGR
Ejournal. Manuscript. IT 08 001. Vol. X. December, 2008.
Set up
Area
Dot
Label
Info
Rotund
Select
Zoom out
Layer
Save
New
Tool
Line
Characte
Open
Copy
Zoom
Pan
Point
Rectangle
Distance

8/3/2019 1268-1658-1-PB
http://slidepdf.com/reader/full/1268-1658-1-pb 6/10
6
The third is a sub-module for GPS data acquisition, which saves the navigation data received
by the GPS receiver as a *.txt format file used for checking and saving data.
3.3 Navigation and Positioning
GPS positioning data can be received in real-time and displayed in the map window so that the
system implemented real-time navigation and positioning for in-field sampling and application.
The function of navigation and positioning by using GPS receivers was composed of two sub-modules, which are used for the port configuration and navigation respectively.
The first sub-module was for a RS-232 serial port configuration. As soon as the port parameters
for communication were set by directly clicking the drop-down menu [Navigation]|[Port set], the
system established communication with the GPS receiver and carried out GPS navigation. TheRS-232 serial communication between the system and the GPS receiver was bridged by using
MSCOmm32.OCX, (Microsoft Inc., Redding, WA), which provided RS-232 data
communication with all the protocols. At the same time, VC6.0 programmable language provided the controls with standard functions for dealing with events and processes and a port
configuration for the serial communication through their property pagers and methods. The
procedure of software design was realized through two steps: The first was to define a group of
parameters, called m_ctrlCom with type of CMSComm, and then to apply this object to cite its property pagers and methods to complement the port configuration. The key sentences of the
program are showed below:
void CDCASView::SetPortParameter()
{m_ctrlCom.SetCommPort(1);//set communication port COM1;
m_ctrlCom.SetInBufferSize(4096); //set buffer aream_ctrlCom.SetSettings("9600,N,8,1");//set communication parameters
m_ctrlCom.SetRThreshold(122);//means one character initiate one eventm_ctrlCom.SetInputLen(0);//if character is valid, accept all character content
m_ctrlCom.SetInputMode(1);
if(!m_ctrlCom.GetPortOpen())
{AfxMessageBox ("serial initialization succeed!\nPort:COM1\nbaud rate: 9600\ndata bit:
8\nstop bit: 1\nparity bit: N\nserial close!");} //set-up state displays to users via dialog box
The second sub-module was for navigation and positioning. The applicator’s position wasdisplayed in the map window. The GPS receiver started to work when clicking drop-down menu
[Navigation]|[Begin navigating] in the UI. This sub-module reads the positional data, including ______________________________________________________________________________ H. Chen, Y. Lan, W. Hoffmann, W. Wu and S. Zhang. “Development of a Data Acquisition and
Processing System for Precision Agriculture”. Agricultural Engineering International: the CIGR
Ejournal. Manuscript. IT 08 001. Vol. X. December, 2008.

8/3/2019 1268-1658-1-PB
http://slidepdf.com/reader/full/1268-1658-1-pb 7/10
7
longitude, latitude and speed of the applicator, coming from the navigation system with
NEMA0183 format from the GPS receiver.
3.4 Field Parameters and Grid-Divide
After getting the outline map of the working-field by using the GPS receiver, a grid-map was
generated. The grid-map divided the working-field into many operational units for a map-based
VRT applicator. This process is referred to as a grid-divide. Field parameters are defined whenmaking a grid-map. Field parameters consist of a group of data which are used to describe shape,
location of the working-field, length, and width of the grids involved in the working-field which
the VRT applicator is. When a user inputs field parameters in the parameter input window for thegrid-divide (see Figure 1), the system divides a working-field into many grids according to the
field parameters, saves them as the grid-map with vector format, and outputs these parameters to
the controller of the VRT applicator.
Users can freely set the length and width of the grid-map according to their needs and workingdirection of the applicator. A grid-map can be produced by clicking the drop-down menu
[Grid]|[Divide grid] in the main window and saving as a *.tab format file automatically.
3.5 Grid-Recognize and Parameters Output
When an automatic map-based VRT applicator is working in the fields, it must know where the
applicator is as it receives the signals of the GPS’s positioning. This process of judgment is
called grid-recognize. The goal of grid-recognize is to let the VRT applicator know which grid or operating unit it is in. It calculates the grid coding M and N of the operation unit automatically.
The formula of coding (M, N) for grid-recognize was:
( ) ( )[ ] 1int 00 +×−+×−= Q X X P Y Y LM ( ) ( )[ ] 1int 00 +×−−×−= T X X S Y Y L N (1)
Where (see Figure 3):
M – coding number in horizon
N – coding number in vertical X 0、Y 0 — longitude and latitude coordinates of base point of the working-field (°);
X 、Y— current longitude and latitude coordinates (°);
α — angle between y’-axis and one edge of the working-field (°),( y’-axis is vertical to x’-axis);
β — angle between x-axis and the other edge of the working-field (°);mA — width of a grid (m);
______________________________________________________________________________
H. Chen, Y. Lan, W. Hoffmann, W. Wu and S. Zhang. “Development of a Data Acquisition and
Processing System for Precision Agriculture”. Agricultural Engineering International: the CIGR
Ejournal. Manuscript. IT 08 001. Vol. X. December, 2008.

8/3/2019 1268-1658-1-PB
http://slidepdf.com/reader/full/1268-1658-1-pb 8/10
8
mB — height of a grid (m); RLon — coefficient in latitude (°/m);
RLat — coefficient in longitude (°/m); Lint — integrated function, that is to convert a real number to an integer less than its.
Defined P, Q, S and T as parameters of grid-recognize gotten by following:
RLat mA P
×
×−=
α β β tancossin
RLonmAQ
×
×+=
α β β tansincos (2)
RLat mBS
×
= β cos
RLonmBT
×
= β sin
In formula (2), parameters for grid-recognize (P, Q, S, T) and longitude and latitude coordinates
of base point of the working-field(X0, Y0) were considered as a group of constants in a givenworking-field. Parameters for grid-recognize (P, Q, S, T) were calculated and output to the
controller on the VRT applicator are displayed in the working window. The function of the grid-
recognize is an important part in the system. Users can get parameters for grid-recognize from
the working window automatically when inputting field parameters and by clicking the button of the grid in the working window.
Figure 3. Parameters in reference coordinate
______________________________________________________________________________
H. Chen, Y. Lan, W. Hoffmann, W. Wu and S. Zhang. “Development of a Data Acquisition and
Processing System for Precision Agriculture”. Agricultural Engineering International: the CIGR
Ejournal. Manuscript. IT 08 001. Vol. X. December, 2008.
y′
Ox0,y0
x′
α
β
Y
x
x,y
x′,y′

8/3/2019 1268-1658-1-PB
http://slidepdf.com/reader/full/1268-1658-1-pb 9/10
9
3.6 Data Query
Data query mainly functions as a query and attributes information about every grid. By data
query function, users can gather ‘attribute data’ and utilize the toolbar to zoom out, zoom in, and
revert or hide legends functions. While selecting the grids, user can pick up and display attributedata, such as soil nutrient contents and yield in every grid, output decision prescription about rateof fertilizer application, pest control and other parameters, in the table style. All of the attribute
data saved in database can be shown to users in the form of a dialog box by clicking any position
with Info tools in the opened map window.
The data query function was composed of two sub-modules. The first one was a module for database link. It linked the attribute database to the map layer and data display, analyses and
query of attribute data in GIS. The other was a module for database query and display. The
attribute information linked to the layer was displayed in the dialog box by user-defined Infotools.
3.7 Analysis of Thematic Maps
After attribute data were linked to the map layer, all of the attribute information was displayed in
thematic map style, which complements the analysis of thematic maps. For instance, nutrient
contents of N, P and K in the soil of a given working-field can be displayed in thematic maps
respectively by clicking the drop-down menu [Thematic maps]|[Add thematic maps]. The main program sentences are as follows:
void CDCASView::OnThemeAdd (){ds = m_ctrlMapX.GetDatasets().Add(miDataSetLayer, layerVt);
ds.GetThemes().Add(miThemeRanged, "N");//implement analysis of thematic map N
ds = m_ctrlMapX.GetDatasets().Add(miDataSetLayer, layerVt);ds.GetThemes().Add(miThemeRanged, "P");// implement analysis of thematic map P
ds = m_ctrlMapX.GetDatasets().Add(miDataSetLayer, layerVt);ds.GetThemes().Add(miThemeRanged, "K");// implement analysis of thematic map K}
4. CONCLUSIONS
In order to carry out the VRT application in precision agriculture, a special data acquisition and
processing system was designed, which is one of the key technologies in precision agriculture production. The system was developed in user-friendly interface, using familiar windows and
drop-down menu and was easy to use. The system was made with modular GIS technology. It
not only has traditional GIS functions, but has also integrated GPS receiver. Its specializationand simplification made the system easy to popularize and apply for the precision agricultural
______________________________________________________________________________
H. Chen, Y. Lan, W. Hoffmann, W. Wu and S. Zhang. “Development of a Data Acquisition and
Processing System for Precision Agriculture”. Agricultural Engineering International: the CIGR Ejournal. Manuscript. IT 08 001. Vol. X. December, 2008.

8/3/2019 1268-1658-1-PB
http://slidepdf.com/reader/full/1268-1658-1-pb 10/10
10
production. Data of GIS was processed by the self-developed VRT applicator according to the
specialties of precision agriculture production management and needs of automatic variable rate
fertilizer application for precision agriculture. Grid-maps and parameters for grid-recognize in agiven working-field were output to the auto/semi-auto variable rate fertilizer applicator. The
system has been successfully employed in variable rate fertilizer applicator since 2004.
The system was programmed with MapX5.0 controls, which can be installed and run on any platform supported by ActiveX conveniently. Furthermore, there is good compatibility with the
Windows operation system using the VC6.0 program language. Using modular design
technology, one module fulfills one function, and thus, improves the stability and expandabilityof the system.
5. REFERENCES
Hailiang, Z., H. Dongjian, and W. Jianhua. 2006. Research of application of GIS integrated
technique in agriculture anti-flood information management system. Journal of
Agricultural Machinery. 37(1): 111-113.
Jun, W., and W Chundu. 2006. Position data collection and processing for variable rate sprayer.Mechanization study. 10: 161-163
Kim, Y., R.G. Evans, W.M. Iversen, F.J. Pierce, and J.L. Chavez. 2006. Software design for wireless in-field sensor-based irrigation management. ASABE Paper No. 063074. St.
Joseph, MI: ASABE.
Qing, Y., Z. Zheng, and P. Shujie. 2004. Field vehicle position monitoring system based on GPSand GIS. Transactions of the Chinese Society of Agricultural Engineering . 20(4): 84-87.
Ruimin. 2000. Mapinfo 5.X Operating Guide. China: China Railway Publishing Company.
Shidong, W., and C. Kuikui. 2006. Development of geographic information system application
based on MapX. Computer Study. 4: 1-3.
______________________________________________________________________________
H. Chen, Y. Lan, W. Hoffmann, W. Wu and S. Zhang. “Development of a Data Acquisition andProcessing System for Precision Agriculture”. Agricultural Engineering International: the CIGR
Ejournal. Manuscript. IT 08 001. Vol. X. December, 2008.