12566_09.pdf
17
9.1 Introduction If plastics are processed by injection molding, deviations of the dimensions of the molding from the dimensions of the cavity cannot be avoided. These deviations from the nominal size are summarized under the term shrinkage. 9.2 Definition of Shrinkage In the injection-molding technique, shrinkage is the difference between an arbitrary dimension in the cavity and the corresponding dimension in the molding with reference to the cavity dimension. S = 1 C ~ 1 M 100% (9.1) ^c Of course, this definition is not unambiguous (Figure 9.1) [9.1]. On one side, the dimensions of the cavity change from thermal expansion (0 —> 1) and mechanical loading during operation (1 — > 2), on the other side, the effect of time on the dimensions of the molding has to be taken into consideration (2 -^ 5). One distinguishes the demolding shrinkage (point 3), which is measured immediately after the molding has been ejected, and the processing shrinkage (point 4). The processing shrinkage is measured after storing the molding in a standard climate for 16 hours [9.2]. In this context the cavity dimension has to be determined at an ambient temperature of 23 0 C ± 2 0 C. 9 Shrinkage s i o n o f m o l i n g Figure 9.1 Dimensional changes as a function of time [9.1] 0 Dimension in cold mold, 1 Dimension in hot mold, 2 Dimension in mold under clamping After-shrinkage A S ) hrnkage after demolding SD ) Pr oc essng shrinkage PS) Tot al shr ink age TS )
Transcript of 12566_09.pdf

8/11/2019 12566_09.pdf
http://slidepdf.com/reader/full/1256609pdf 1/16
9 . 1 I n t r o d u c t i o n
If plastics are processed by injection molding, deviations of the dimensions of the
molding from the dimensions of the cavity cannot be avoided. These deviations from the
nominal size are summarized under the term shrinkage.
9 . 2 D e f i n i t i o n o f S h r i n k a g e
In the injection-molding technique, shrinkage is the difference between an arbitrary
dimension in the cavity and the corresponding dimension in the molding with reference
to the cavity dimension.
S =
1 C
~
1 M
100% (9.1)
^c
Of course, this definition is not unambiguous (Figure 9.1)
[9.1].
On one side, the dimensions of the cavity change from thermal expansion (0
—>
1) and
mechanical loading during operation (1
—>
2 ), on the other side, the effect of time on the
dimensions of the molding has to be taken into consideration (2 - ^ 5).
One distinguishes the demo lding shrinkage (point 3), which is measured imm ediately
after the molding has been ejected, and the processing shrinkage (point 4). The
processing shrinkage is measured after storing the molding in a standard climate for 16
hours [9.2]. In this context the cavity dimension has to be determined at an ambient
temperature of 23
0
C ± 2
0
C .
9 S h r i n k a g e
D
i
m
e
n
s
i
o
n
o
f
m
o
l
i
n
g
Figure 9.1 Dimen sional changes as a
function of time [9.1]
0 Dimension in cold mold,
1 Dimension in hot mold,
2 Dimension in mold under clamping
force and holding p ressure,
3 Dimension of molding after dem olding,
4 Measuremen t of processing shrinkage
(DIN 16901),
5 Dim ension after storage
After-shrinkage AS)
hrnkage after demolding SD)
Processng shrinkage PS)
Total shrinkage TS)
Timet

8/11/2019 12566_09.pdf
http://slidepdf.com/reader/full/1256609pdf 2/16
After extended storage another dimensional change may occur from the effect of
temperature changes and especially from post-conditioning. It is called post-shrinkage
(4
—>
5). This ch ange is caused by relaxation of residual stresses, re-orientation and
post-crystallization in crystalline materials. Except in crystalline materials, it is
negligibly small, though. The sum of processing shrinkage and post-shrinkage is called
total shrinkage. If additional dimensional deviations from moisture absorption or
higher temperatures of use have to be taken into account at the time of acceptance,
post-treatment and conditions of measurement have to be negotiated between molder
and customer. In addition, one can distinguish shrinkage in dependence on the direction
of flow (Figure 9.2). Radial processing shrinkage is shrinkage in the direction of flow,
tangential shrinkage is that perpendicular to the direction of flow.
The difference in processing shrinkage is the difference between radial and tangential
shrinkage and is a measurement of the anisotropy of the shrinkage. The shrinkage in
thickness is measured as section thickness, but it is usually not of interest in prac tice. For
measuring, any kind of mechanical or optical instrument can be used, but a possible error
from the measuring force should be taken into account for soft materials.
If the dimensions in Equation (9.1) are replaced by the volumes of cavity and
molding, one talks about volume shrinkage [9.3].
Figure 9.2 Frozen mod el [9.7]
Contour shrunk
Mold contour
Plastic core
Frozen frame
ound
length
Figure 9.3 M agnitude of shrinkage
depending on direction of flow
S
R
Radial shrinkage,
S
T
Tangential shrinkage,
S Shrinkage difference
(9-2)
V Specific volume of the material (Figure 9.7)
Longitudinal and volume shrinkage are related to one another but because of anisotropy
(dependency of shrinkage on direction), linear shrinkage cannot be calculated from
volume shrinkage. Another problem is the impossibility to measure volume shrinkage.
8/11/2019 12566_09.pdf
http://slidepdf.com/reader/full/1256609pdf 3/16
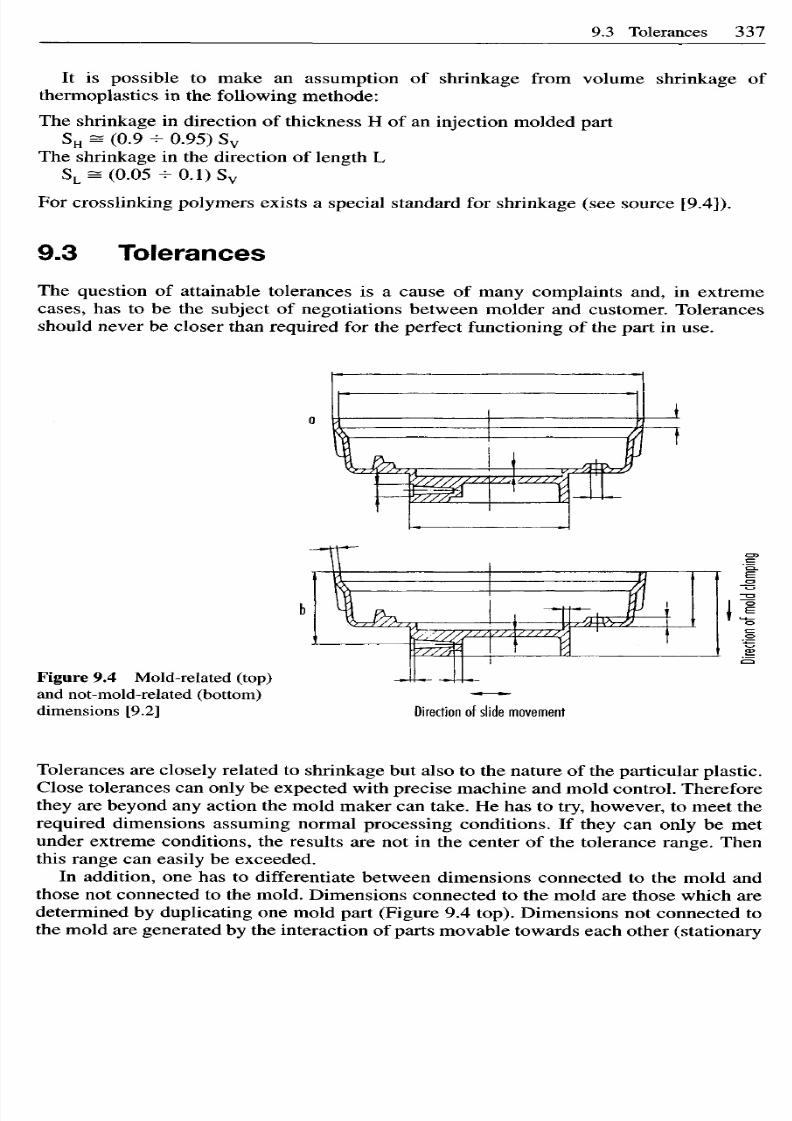
Tolerances are closely related to sh rinkage but also to the nature of the particular plas tic.
Close tolerances can only be expected with precise machine and mold control. Therefore
they are beyond any action the mold maker can take. He has to try, however, to meet the
required dimensions assuming normal processing conditions. If they can only be met
under extreme conditions, the results are not in the center of the tolerance range. Then
this range can easily be exceeded.
In addition, one has to differentiate between dimensions connected to the mold and
those not connected to the mold. Dim ensions con nected to the mold are those which are
determined by duplicating one mold part (Figure 9.4 top ). Dim ensions not connected to
the mold are generated by the interaction of parts mov able toward s each other (stationary
Figure 9.4 Mo ld-related (top)
and not-mold-related (bottom)
dimensions [9.2]
Direction
o f
slide movement
D
i
r
e
c
t
o
n
o
f
m
o
l
d
c
l
a
m
p
i
n
g
It is possible to make an assumption of shrinkage from volume shrinkage of
thermoplastics in the following method e:
The shrinkage in direction of thickness H of an injection molded part
S
H
(0.9 - 0.95) S
v
The shrinkage in the direction of length L
S
L
= (0.05 - 0 . 1 ) S
v
For crosslinking polymers exists a special standard for shrinkage (see source [9.4]).
9 3 T o l e r a n c e s
The question of attainable tolerances is a cause of many complaints and, in extreme
cases, has to be the subject of negotiations between molder and customer. Tolerances
should never be closer than required for the perfect functioning of the part in use.

8/11/2019 12566_09.pdf
http://slidepdf.com/reader/full/1256609pdf 4/16
Figure 9.5
Practical tolerances on dimensions of articles molded from ABS (Courtesy of the
Society of the Plastics Industry)
and movable mold
half,
slides) (Figure 9.4 bottom). This differentiation takes into
account the lower accuracy, which results from movable mold components; they do not
have exactly reproducible end po sitions.
Standards for tolerances are given in the form of tables in the Plastics Engineering
Handbook [9.11]. These tables (an example is shown in Figure 9.5) were developed by
the Society of the Plastics Industry, Inc. and are based on data obtained from
representative material suppliers and molders.
S T A N D A R D S A N D P R A C T I C E S O P
PLASTICS CUSTOM MOLDERS
Engineer ing and
Technical Standards
A B S
NOTE:
The Commercial values shown below represent common production tolerances at the most economical level.
The Fine values represent closer tolerances that can be held but at a greater cost.
Plus or Minus in Thousands of an Inch
imensions
(Inches)
Drawing
Code
A = Diameter
(see Note #1 )
B = Depth
(see Note # 3)
C = Height
(sec Note # 3)
D=BottomWall
(see Note # 3)
E = Side Wall
(see Note # 4)
F = Hole Size
Diameter
(see Note #1)
G = Hole Size
Depth
(seeNote#5)
Draft Allowance
per side
(see Note # 5)
Flatness
(see Note #4 )
Thread Size
(class)
Concentricity
(sec Note #4)
Fillets, Ribs,
Corners
(see Note #6)
Surface Finish
Color Stability
6 000 to 12.000
for each additional
inch add (inches)
0 000 to 0.125
0.125 to
0 250
0 250 to 0 500
0 500 Over
0 000
to
0 250
0 250 to 0 500
0 500 to 1.000
0 000
to 3.000
3.000 to 6 000
Internal
External
(T.I.R.)
(see Note #7 )
(see Note #7)
Comm. ±
.003
.004
.003
.002
.002
.003
.004
.003
.004
.005
2°
.015
.030
1
1
.009
.025
F i n c ±
.002
.002
.002
.001
.001
.002
.002
.002
.002
.003
1°
.010
.020
2
2
.005
.015
REFERENCE NOTES
1 — These tolerances do not include allowance for aging
characteristics of material.
2 - Tolerances based on
wall section.
3
—
Parting line must be taken into consideration.
4 — Part design should maintain a wall thickness as nearly
constant as possible. Complete uniformity in this
dimension is impossible to achieve.
5 — Care must be taken that the ratio of the depth of a
cored hole to its diameter docs not reach a point that
will result in excessive pin damage.
6 —These values should be increased whenever com -
patible with desired design and good molding
technique.
7
—
Customer-Molder understanding necessary prior to
tooling.
8/11/2019 12566_09.pdf
http://slidepdf.com/reader/full/1256609pdf 5/16
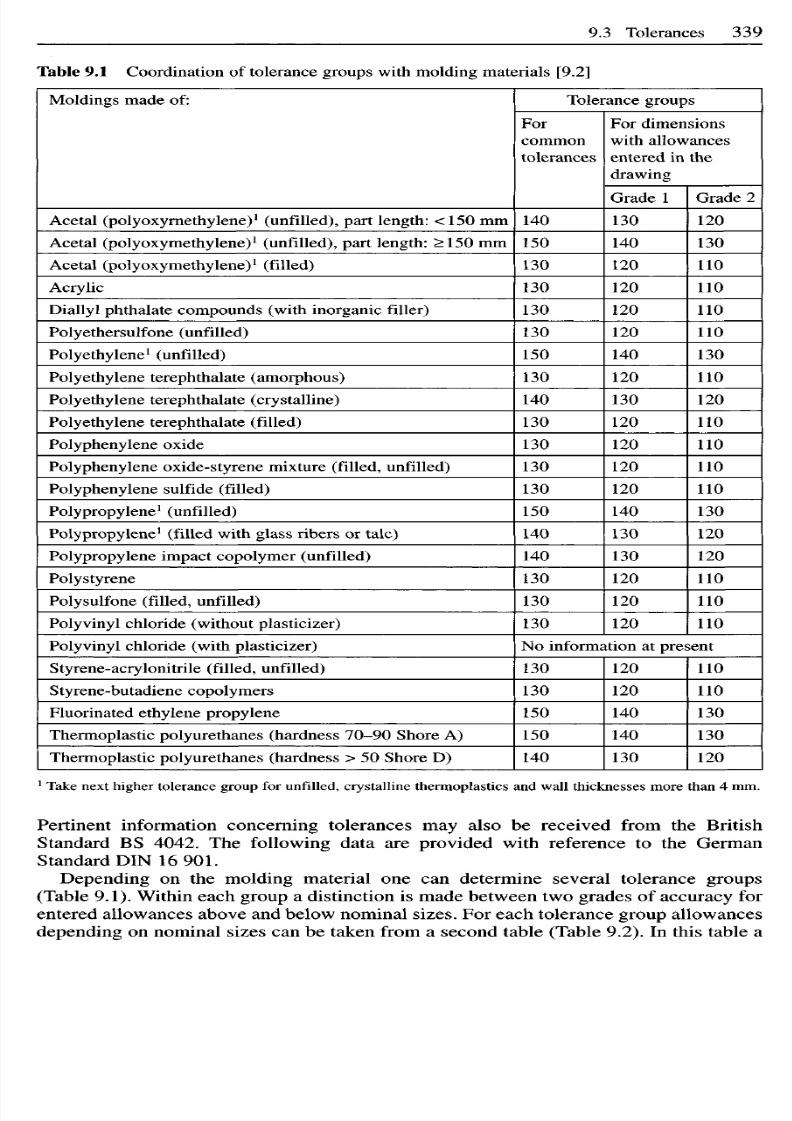
1
Take next higher tolerance group
for
unfilled, crystalline thermoplastics and wall thicknesses more than
4
mm.
Pertinent information concerning tolerances may also be received from the British
Standard BS 4042. The following data are provided with reference to the German
Standard DIN 16 901.
Depending on the molding material one can determine several tolerance groups
Table 9.1). Within each group a distinction is made between two grades of accuracy for
entered allowances above and below nominal sizes. For each tolerance group allowances
depending on nominal sizes can be taken from a second table Table 9.2). In this table a
Table 9.1
Coordination
of
tolerance groups with molding materials
[9.2]
Moldings made
of:
Acetal (polyoxyrnethylene)
1
(unfilled), part length: < 150 mm
Acetal (polyoxymethylene)
1
(unfilled), part length: >150 mm
Acetal (polyoxymethylene)
1
(filled)
Acrylic
Diallyl phthalate comp ounds (with inorganic filler)
Polyethersulfone (unfilled)
Polyethylene
1
(unfilled)
Polyethylene terephthalate (amorphous)
Polyethylene terephthalate (crystalline)
Polyethylene terephthalate (filled)
Polyphenylene oxide
Polyphenylene oxide-styrene mixture (filled, unfilled)
Polyphenylene sulfide (filled)
Polypropylene
1
(unfilled)
Polypropylene
1
(filled with glass ribers or talc)
Polypropylene impact copolymer (unfilled)
Polystyrene
Polysulfone (filled, unfilled)
Polyvinyl chloride (without plasticizer)
Poly vinyl ch loride (with plasticizer)
Styrene-acrylonitrile (filled, unfilled)
Styrene-butadiene copolymers
Fluorinated ethylene propylene
Thermoplastic polyurethanes (hardness 70-90 Shore
A)
Thermoplastic polyurethanes (hardness
> 50
Shore
D)
Tolerance groups
For
common
tolerances
140
150
130
130
130
130
150
130
140
130
130
130
130
150
140
140
130
130
130
For dimensions
with allowances
entered in the
drawing
Grade
1
130
140
120
120
120
120
140
120
130
120
120
120
120
140
130
130
120
120
120
Grade 2
120
130
110
110
110
110
130
110
120
110
110
110
110
130
120
120
110
110
110
No information
at
present
130
130
150
150
140
120
120
140
140
130
110
110
130
130
120
8/11/2019 12566_09.pdf
http://slidepdf.com/reader/full/1256609pdf 6/16
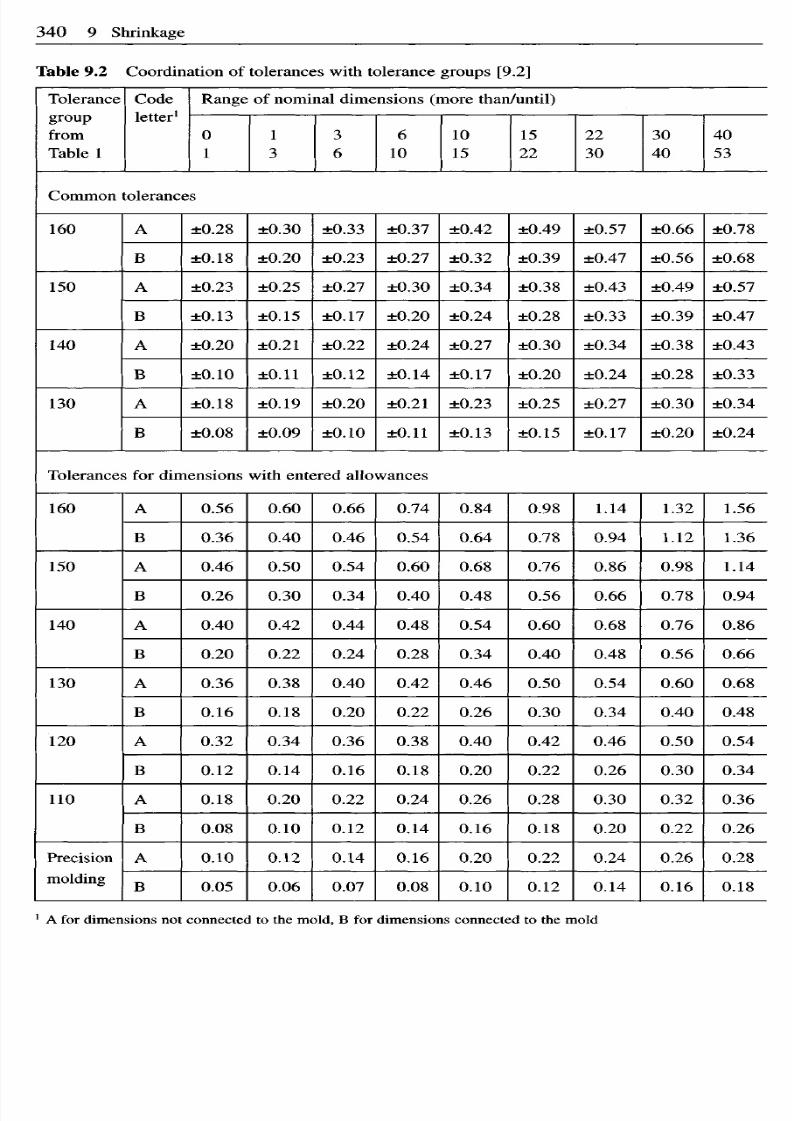
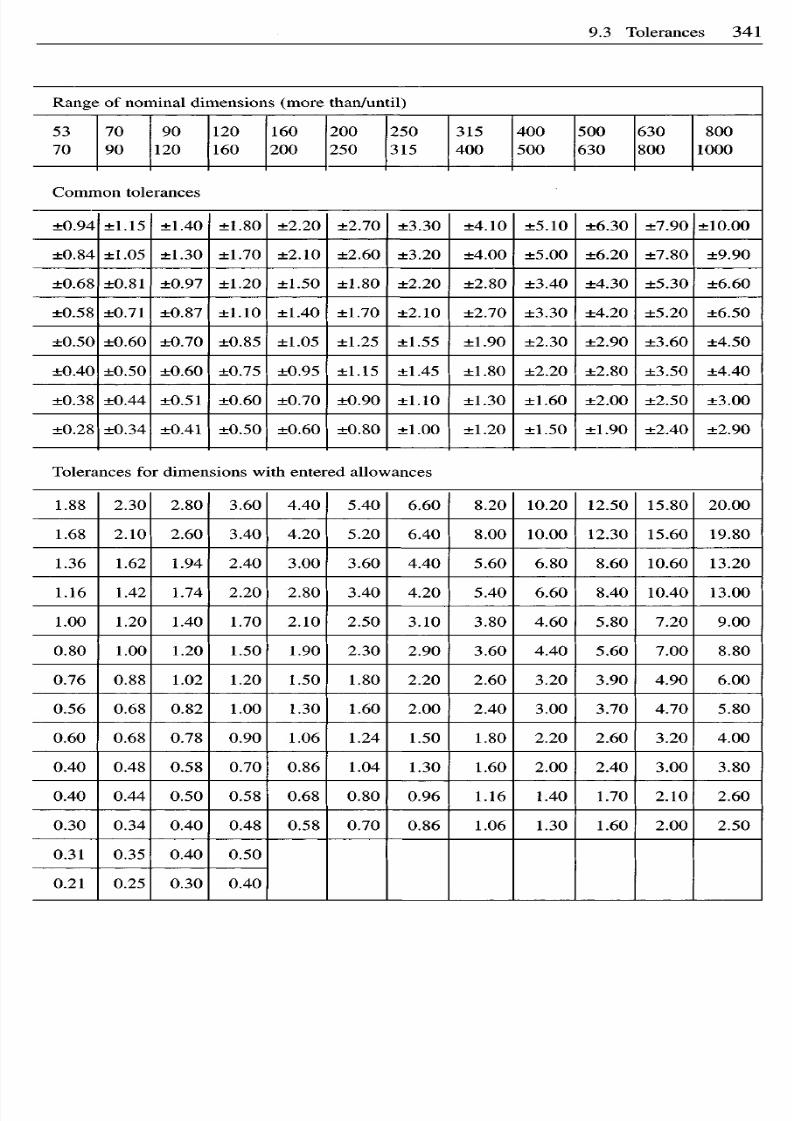
Table 9.2 Coordination of tolerances with tolerance groups [9.2]
Tolerance
group
from
Table 1
Code
letter
1
Range
of
nominal dimensions more than/until)
0
1
1
3
3
6
6
10
10
15
15
22
22
30
30
40
40
53
Common tolerances
160
150
140
130
A
B
A
B
A
B
A
B
±0.28
±0.18
±0.23
±0.13
±0.20
±0.10
±0.18
±0.08
±0.30
±0.20
±0.25
±0.15
±0.21
±0.11
±0.19
±0.09
±0.33
±0.23
±0.27
±0.17
±0.22
±0.12
±0.20
±0.10
±0.37
±0.27
±0.30
±0.20
±0.24
±0.14
±0.21
±0.11
±0.42
±0.32
±0.34
±0.24
±0.27
±0.17
±0.23
±0.13
±0.49
±0.39
±0.38
±0.28
±0.30
±0.20
±0.25
±0.15
±0.57
±0.47
±0.43
±0.33
±0.34
±0.24
±0.27
±0.17
±0.66
±0.56
±0.49
±0.39
±0.38
±0.28
±0.30
±0.20
±0.78
±0.68
±0.57
±0.47
±0.43
±0.33
±0.34
±0.24
Tolerances
for
dimensions with entered allowances
160
150
140
130
120
110
Precision
molding
A
B
A
B
A
B
A
B
A
B
A
B
A
B
0.56
0.36
0.46
0.26
0.40
0.20
0.36
0.16
0.32
0.12
0.18
0.08
0.10
0.05
0.60
0.40
0.50
0.30
0.42
0.22
0.38
0.18
0.34
0.14
0.20
0.10
0.12
0.06
0.66
0.46
0.54
0.34
0.44
0.24
0.40
0.20
0.36
• 0 . 1 6
0.22
0.12
0.14
0.07
0.74
0.54
0.60
0.40
0.48
0.28
0.42
0.22
0.38
0.18
0.24
0.14
0.16
0.08
0.84
0.64
0.68
0.48
0.54
0.34
0.46
0.26
0.40
0.20
0.26
0.16
0.20
0.10
0.98
0.78
0.76
0.56
0.60
0.40
0.50
0.30
0.42
0.22
0.28
0.18
0.22
0.12
1.14
0.94
0.86
0.66
0.68
0.48
0.54
0.34
0.46
0.26
0.30
0.20
0.24
0.14
1.32
1.12
0.98
0.78
0.76
0.56
0.60
0.40
0.50
0.30
0.32
0.22
0.26
0.16
1.56
1.36
1.14
0.94
0.86
0.66
0.68
0.48
0.54
0.34
0.36
0.26
0.28
0.18
1
A for
dimensions
no t
connected
to the
mold,
B for
dimensions connected
to the
mold
8/11/2019 12566_09.pdf
http://slidepdf.com/reader/full/1256609pdf 7/16
Range of nominal dimensions more than/until)
53
70
70
90
90
120
120
160
160
200
200
250
250
315
315
400
400
500
500
630
630
800
800
1000
Common tolerances
±0.94
±0.84
±0.68
±0.58
±0.50
±0.40
±0.38
±0.28
±1.15
±1.05
±0.81
±0.71
±0.60
±0.50
±0.44
±0.34
±1.40
±1.30
±0.97
±0.87
±0.70
±0.60
±0.51
±0.41
±1.80
±1.70
±1.20
±1.10
±0.85
±0.75
±0.60
±0.50
±2.20
±2.10
±1.50
±1.40
±1.05
±0.95
±0.70
±0.60
±2.70
±2.60
±1.80
±1.70
±1.25
±1.15
±0.90
±0.80
±3.30
±3.20
±2.20
±2.10
±1.55
±1.45
±1.10
±1.00
±4.10
±4.00
±2.80
±2.70
±1.90
±1.80
±1.30
±1.20
±5.10
±5.00
±3.40
±3.30
±2.30
±2.20
±1.60
±1.50
±6.30
±6.20
±4.30
±4.20
±2.90
±2.80
±2.00
±1.90
±7.90
±7.80
±5.30
±5.20
±3.60
±3.50
±2.50
±2.40
±10.00
±9.90
±6.60
±6.50
±4.50
±4.40
±3.00
±2.90
Tolerances for dimensions with entered allowances
1.88
1.68
1.36
1.16
1.00
0.80
0.76
0.56
0.60
0.40
0.40
0.30
0.31
0.21
2.30
2.10
1.62
1.42
1.20
1.00
0.88
0.68
0.68
0.48
0.44
0.34
0.35
0.25
2.80
2.60
1.94
1.74
1.40
1.20
1.02
0.82
0.78
0.58
0.50
0.40
0.40
0.30
3.60
3.40
2.40
2.20
1.70
1.50
1.20
1.00
0.90
0.70
0.58
0.48
0.50
0.40
4.40
4.20
3.00
2.80
2.10
1.90
1.50
1.30
1.06
0.86
0.68
0.58
5.40
5.20
3.60
3.40
2.50
2.30
1.80
1.60
1.24
1.04
0.80
0.70
6.60
6.40
4.40
4.20
3.10
2.90
2.20
2.00
1.50
1.30
0.96
0.86
8.20
8.00
5.60
5.40
3.80
3.60
2.60
2.40
1.80
1.60
1.16
1.06
10.20
10.00
6.80
6.60
4.60
4.40
3.20
3.00
2.20
2.00
1.40
1.30
12.50
12.30
8.60
8.40
5.80
5.60
3.90
3.70
2.60
2.40
1.70
1.60
15.80
15.60
10.60
10.40
7.20
7.00
4.90
4.70
3.20
3.00
2.10
2.00
20.00
19.80
13.20
13.00
9.00
8.80
6.00
5.80
4.00
3.80
2.60
2.50

8/11/2019 12566_09.pdf
http://slidepdf.com/reader/full/1256609pdf 8/16
difference is also made between dimensions connected to the mold and those not
connected to the mold.
9 4 C a u s e s o f S h r i n k a g e
The intrinsic cause for shrinkage of injection-molded parts is the thermodyn amic behavior
of the material (Figure 9.6). It is also called p-v-T (pressure-volume-temperature)
behavior and characterizes the compressibility and thermal expansion of plastics [9.5].
There is a basically different p-v-T behavior between two classes of materials
(amorphous and crystalline). As a melt, both classes show a linear dependency of the
specific volume on the temperature. For the solid phase, however, there are considerable
differences. On the basis of crystallization the specific volume decreases exponentially
with decreasing temperature while amorphous materials also have a linear dependency
in the solid phase. This difference is the reason for the greater shrinkage of crystalline
thermoplastics.
To assess the process w ith respect to shrinkag e, the change in state in a p-v-T diagram
is very helpful. Pressure and temperature during the process are recorded isochronously
in a p-v-T diagram (Figure 9.7).
Following the volume filling of the cavity (0
— »
1) the material is com pacted in the
compression phase without substantial change in temperature (1 — » 2). The magnitude of
the locally attainable pressure in the molding depends on the magnitude of the holding
pressure exerted by the machine and on the resistance to flow in the cavity.
Subsequently, the molding steadily cools down (2 — » 3). Related to this is a volume
contraction, which can be partly compensated by the holding pressure, which supplies
additional melt to the cavity through the liquid core of the solidifying molding. If no
more melt can be fed into the cavity, e.g., by a solidified gate, the change in state is
isochoric (3
— »
4).
S
p
e
c
i
c
v
o
l
u
m
e
S
p
e
c
i
c
v
o
l
u
m
e
amorphous
crystalline
cm
3
/g
Temperature
0
C
cmfyg
Temperature
0
C
Figure 9.6 p-v-T diagram of an
amorphous (top) and a crystalline
(bottom) thermoplastic material
8/11/2019 12566_09.pdf
http://slidepdf.com/reader/full/1256609pdf 9/16
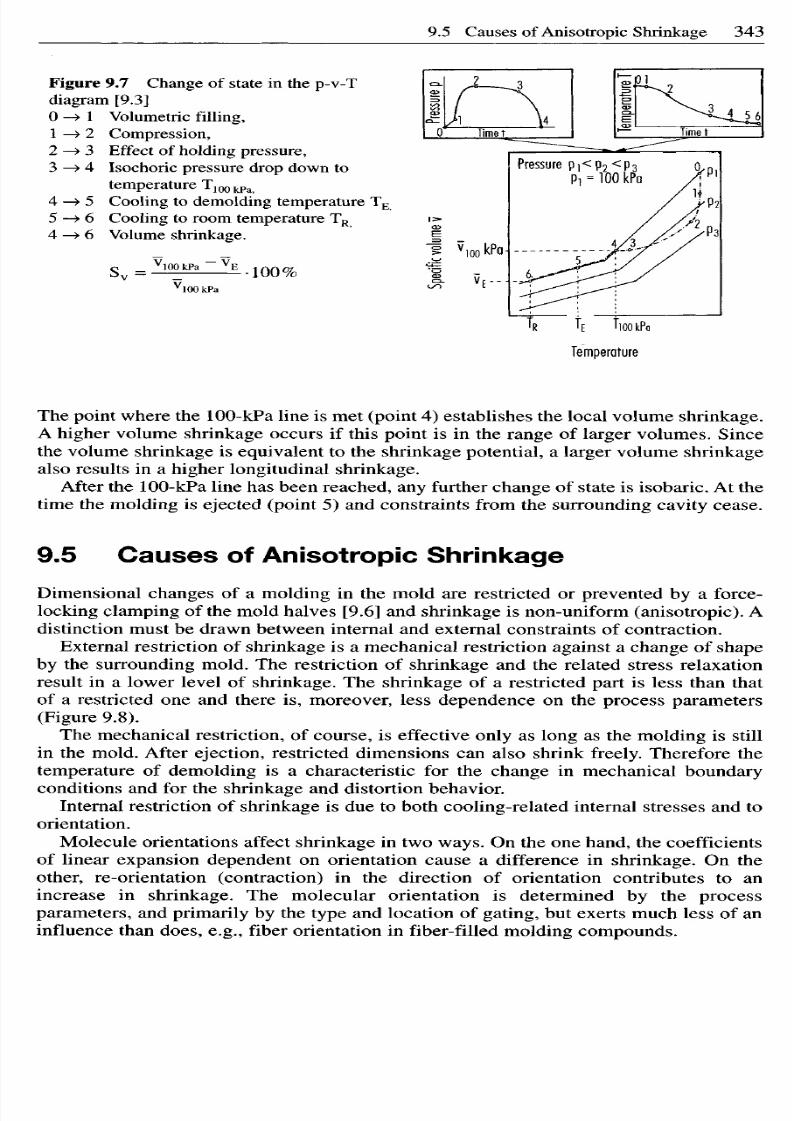
The point wh ere the 100-kPa line is met (point 4) establishes the local volum e sh rinkage .
A higher volume shrinkage occurs if this point is in the range of larger volumes. Since
the volume shrinkage is equivalent to the shrinkage potential, a larger volume shrinkage
also results in a higher longitudinal shrinkage.
After the 100-kPa line has been reached , any further chang e of state is isoba ric. At the
time the molding is ejected (point 5) and constraints from the surrounding cavity cease.
9 5 C a u s e s o f A n i s o t r o p i c S h r i n k a g e
Dimensional changes of a molding in the mold are restricted or prevented by a force-
locking clamping of the mold halves [9.6] and shrinkage is non-uniform (anisotropic). A
distinction must be drawn between internal and external constraints of contraction.
External restriction of shrinkage is a mechanical restriction against a change of shape
by the surrounding mold. The restriction of shrinkage and the related stress relaxation
result in a lower level of shrinkage. The shrinkage of a restricted part is less than that
of a restricted one and there is, moreover, less dependence on the process parameters
(Figure 9.8).
The mechanical restriction, of course, is effective only as long as the molding is still
in the mold. After ejection, restricted dimensions can also shrink freely. Therefore the
temperature of demolding is a characteristic for the change in mechanical boundary
conditions and for the shrinkage and distortion behavior.
Internal restriction of shrinkage is due to both cooling-related internal stresses and to
orientation.
M olecule orientations affect shrinkage in two ways. On the one hand, the coefficients
of linear expansion dependent on orientation cause a difference in shrinkage. On the
other, re-orientation (contraction) in the direction of orientation contributes to an
increase in shrinkage. The molecular orientation is determined by the process
parameters, and primarily by the type and location of gating, but exerts much less of an
influence than does, e.g., fiber orientation in fiber-filled molding compounds.
Figure 9.7 Change of state in the p-v-T
diagram [9.3]
0 — > 1 Volumetric filling,
1 — > 2 Com pression,
2
— >
3 Effect of holdin g press ure,
3 — > 4 Isochoric pressure drop down to
temperature T
100 kPa
4
—
5 Cooling to demolding temperature T
E
5 — > 6 Cooling to room temperature T
R
4 - * 6 Volume shrinkage.
S
p
e
c
i
c
v
o
l
u
m
e
v
P
r
e
s
s
u
r
e
p
T
e
m
p
e
r
a
t
u
r
e
T
Timet
Timet
Pressure
Temperature

8/11/2019 12566_09.pdf
http://slidepdf.com/reader/full/1256609pdf 10/16
Oriented by the flow processes, the fibers hinder shrinkage primarily in the direction of
orientation because they hav e a lower thermal exp ansion and greater stiffness relative to
the matrix material (Figure 9.9) [9.8]. Through the use of fibers, shrinkage may be
reduced by up to 80%. However, no further reductions in shrinkage behavior are
observed at additions of more than 20% fiberglass.
Incorporation of fillers such as glass beads and mineral powder leads to isotropic
shrinkage. The reduction in overall shrinkage that occurs is due to the lower
compressibility of the material as a whole.
Aside from fiber orientation, molecular orientation in the direction of flow leads to
anisotropic shrinkage.
Hodng pressure
P
H
MPa
Pa
Hodng pressure
P
H
Figure 9.8 Shrinkage of a free (left) and a confined (right) circular plate
S
h
r
n
k
a
g
e
S
|
S
h
r
n
k
a
g
e
S
i
near gate
in
center
fa r trom gate
near gate
in center
fa r
from gate
L
o
n
g
i
u
d
i
n
a
l
s
h
r
n
k
a
g
e
S
|
Temperature
o f
cavity wall
0
C
Figure 9.9 Effect of
glass fibers and spheres on
shrinkage
Part: bushing,
Material: PBPT unreinforced
( X ) ,
3 0 glass spheres (O),
3 0 glass fibers (D),
T
M
= 251°C,
P
w
= 33 MPa.

8/11/2019 12566_09.pdf
http://slidepdf.com/reader/full/1256609pdf 11/16
9 6 C a u s e s o f D i s t o r t i o n
Distortion is one result of anisotropic shrinkage. Frequently, it is caused by asymmetric
cooling relative to the part thickness. A higher wall temperature on the top side as shown
in Figure 9.10 leads, for example, to higher temperatures in the upper layers and, via
greater volume contraction, to deflection towards the warmer side. This differential
cooling may also be caused by inserts, such as decorative m aterial in in-mold decoration.
Corner distortion (Figure 9.11; see also Figure 8.46) is due to poorer heat dissipation
towards the inside of a corner. This has the effect of reducing the corner angles.
Similarly, differences in the thickness of ribs will displace the temperature profile from
its symmetrical center position and result in distortion of the moldings (Figure 9.12).
This cooling-induced distortion can be prevented by altering the mold temperature,
where necessary, by relocating the cooling channels or using mold inserts of different
material. Inner corners and thick ribs need to be cooled better than other part sections
(see also Section 8.6).
To avoid distortion caused by orientation, the gate should be repositioned or the flow
path modified by changing the wall thickness. Distortion in flat parts can be coun teracted
by applying thin bracing ribs.
The low thermal conductivity of plastic results in the temperature profile shown in
Figure 9.10. Different cooling conditions exist for the different layers and so volume
contraction also varies. Due to mechanical coupling between the layers, thermal
contraction in the longitudinal and transverse directions is restricted. This restriction
does not exist in the direction of thickness, with the result that most of the volume
shrinkage takes the form of shrinkage of the cross-section. Restrictions of shrinkage of
the same kind in longitudinal and transverse direction result in the same shrinkage,
provided no warpage orientation of molecules or fibers occurs.
o)
Moded part
thckness s
b) No mechanca coupng
of layers
c) Rea change
mechancay couped)
Therma contracton
igure 9.10 Mod el of stress buildup [9.12]

8/11/2019 12566_09.pdf
http://slidepdf.com/reader/full/1256609pdf 12/16
9 7 E f f e c t o f P r o c e s s i n g o n S h r i n k a g e
Other than by modifications to the mold and a change of material, the molder can only
influence shrinkage and distortion by making changes to the process. From the p-v-T
diagram, it can be seen that pressu re and temp erature are the main factors affecting
shrinkage. Design changes will affect these parameters and thus also the shrinkage. A
survey of the influences exerted by various parameters is shown in Figure 9.13 [9.11].
With amorphous as well as with crystalline thermoplastics, the holding pressure exerts
the greatest effect on shrinkage (Figure 9.8).
Under holding pressure, the material in the cavity is compressed and the volume
contraction from cooling is compensated by additional melt supply. The influence of the
holding pressure is shown in the p-v-T diagram charting the progress of the process
(see Figure 9.7). If the holding pressure is increased, the process is shifted to lower
specific volumes, reaching at lower specific volumes the 100-kPa line at which the part
undergoes lower shrinkage. The influence of the holding pressure is degressive,
however; in other words, the reduction in shrinkage decreases with increase in holding
pressure.
Figure 9.12
Distortion caused
by differences in wall thickness
Figure 9.11
Corner distortion through poorer heat
dissipation in internal corners
S
h
r
n
k
a
g
e
S
h
r
n
k
a
g
e
S
h
r
n
k
a
g
e
S
h
r
n
k
a
g
e
S
h
r
n
k
a
g
e
S
h
r
n
k
a
g
e
S
h
r
n
k
a
g
e
S
h
r
n
k
a
g
e
S
h
r
n
k
a
g
e
S
h
r
n
k
a
g
e
S
h
r
n
k
a
g
e
S
h
r
n
k
a
g
e
Wall thickness
Fow restriction
Runner profile
cross-section
Runner length
Holding
pressure
time
Holding
pressure
Fow path/wall thickness ratio
Gate size
Mold
temperature
Melt
temperature
Injection
speed
Figure 9.13 Relationships between shrinkage and characteristic parameters [9.11]
In
direction
o f
flow
Perpendcuar to
direction o f flow

8/11/2019 12566_09.pdf
http://slidepdf.com/reader/full/1256609pdf 13/16
With an increase in holding pressure, a reduction in shrinkage of up to 0.5% can be
obtained in crystalline materials. With amorphous materials, a reduction of just 0.2%
max. is feasible because of their overall lower level of shrinkage.
The second major influence on shrinkage is the temperature of the material.
Theoretically, a higher injection temperature has two opposing effects on shrinkage:
on the one hand, a higher temperature results in a higher thermal contraction potential of
the material (see also Figure 9.7 and [9.7]) and, on the other, the decrease in melt
viscosity causes a better transfer of pressure and with this a reduction in shrinkage.
Given sufficiently long holding-pressure stages, the effect of improved cavity pressure
predominates in the case of crystalline materials (Figure 9.14).
S
h
r
n
k
a
g
e
S
|
S
h
r
n
k
a
g
e
S
Met temperature
TM
Figure 9.14
Effect of melt temperature on shrinkage (top: Crystalline, bottom : Amorphou s
material)
Melt temperature TM
near gate
:'
in center :
fa r from gate
near gate
in center
fa r from
gate~
0
C
0
C

8/11/2019 12566_09.pdf
http://slidepdf.com/reader/full/1256609pdf 14/16
With crystalline materials, a reduction in shrinkage can be obtained of up to 0.5%; with
amorphous plastics, the figure is up to 0.15%. All other parameters determine the
shrinkage behavior via the pressure and temperature. While a greater wall thickness
leads to better pressure transfer, the poor thermal conductivity of plastics makes volume
contraction more noticeable at high temperatures and increases the shrinkage.
Restrictions to flow impa ir pressure transfer and so increase shrinkage. In contrast, larger
runner profile cross-sections and thicker gates make for better pressure transfer. A large
runner length leads, just as does a large flow path to wall thickness ratio, to a drop in
pressure and thus to greater shrinkage. H ot runners, however, reduce shrinkage.
The influences of the holding pressure time can be used to again illustrate the most
important criterion concerning shrinkage. As the holding pressure time increases, the
forcing of additional material into the cavity reduces shrinkage. This can only happen,
however, as long as the melt, particularly the gate and sprue, has not frozen. Prolonging
the holding pressure time beyond that has no further effect. For this reason, a part for
homogeneous molding materials should always be gated at the thickest point and the
wall thicknesses should be such that holding pressure can take effect even in those areas
furthest away from the sprue.
With glass-reinforced materials, there are some particularities (Figure 9.15). In the
direction of fiber orientation, it is not possible to affect shrinkage by modifying pro-
cessing parameters, as the rigidity of the fibers exerts an extremely strong influence. The
effect perpendicular to the direction of fibers is approximately the same as it is with the
matrix material only.
9 8 S u p p l e m e n t a r y M e a n s f o r P r e d i c t i n g S h r i n k a g e
The s implest
w a y t o
est imate shr inkage
fo r
d imens ioning
a
m o l d
is to
cons ult tables
(Table 9.3). They are provided b y t h e raw-mater ia l suppl iers in the dat a shee ts fo r their
respect ive mater ia ls .
However , the par t ly wide range o f listed data is pro ble ma tic b ec aus e i t doe s not al low
a sufficiently accurate prediction
o f
shr inkage ;
n o r a r e
per t inent process param eters
k n o w n o r conf igurat ions o f mol ding s f rom whi ch t h e shr inkag e was obtained. Transfer
to othe r con figu rati ons is , ther efor e, difficult.
L
o
n
g
i
u
d
i
n
a
l
s
h
r
n
k
a
g
e
Cavity pressure
p
c
max
Figure 9.15 Effect on shrinkage of glass fiber reinforced materials
10OkPa
Molding: plate
Material: Nyon
6,
30% gass
reinforced
Thickness:
3 mm
Reaton to direction
of
flow:

8/11/2019 12566_09.pdf
http://slidepdf.com/reader/full/1256609pdf 15/16
A more accurate prediction can be made on the basis of a collection of data gained
through experience. This is the most reliable method for predicting linear shrinkage so
far. In such a collection the shrinkage data of all parts are listed which have been
produced in the past as well as their processing conditions. Because of different
restrictions to shrinkage and geometry elements, families of dimensions are formed.
If the mold for a similar part has to be designed, these data can be used for
dimensioning.
Another and increasingly more accurate estimate of shrinkage behavior is provided by
FEA simulation [9.12] see also Chapter 14). Exact dimensioning of parts with the aid of
this method is not yet possible. However, the process and the part can be optimized in
respect to shrinkage and distortion behavior. The ability to predict part dimensions and
volume shrinkage, but more so the temperature and pressure behavior, are important
tools for accomplishing this. Since several physical parameters such as crystallization
behavior cannot as yet be determined, some material data cannot be determined with
sufficient accuracy batch fluctuations cannot be allowed for, and it is still not possible to
make an exact predictive simulation of part dimensions.
R e f e r e n c e s
[9.1] Hov en-Nievelstein, W. B.:
Die
Verarbeitungsschwindung thermoplastischer Formmassen.
Dissertation, Tech. University, A achen, 1984.
[9.2] German Standard: DIN
16901:
Kunststoff-Formteile Toleranzen und Abnahmebedingun-
gen fiir LangenmaBe.
[9.3] Schmidt, Th. W.: Zur Abschatzung der Schwindung. Dissertation, Tech. University,
Aachen,
1986.
[9.4] German Standard: DIN 53464: Prufung von Kunststoffen. Bestimm ung der Schwindungs-
eigenschaften von PreBstoffen aus warmhartbaren PreBmassen.
[9.5] Geisbiisch, P.: An satze zur Schw indungsberechn ung ungefiillter und m ineralisch gefullter
Therm oplaste. D issertation, Tech. University, Aach en, 1980.
[9.6] Zipp, Th.: Erfahrungsanalyse
zur
Erm ittlung
des
notwen digen WerkzeugiibermaBes beim
SpritzgieBen. Unp ublished report, IKV, Aache n, 1985.
[9.7] Stitz,
S.:
Analyse
der
Forrnteilbildung beim SpritzgieBen
von
Plastomeren
als
G rundlage
fiir die ProzeBsteuerung. Dissertation, Tech. University, Aachen, 1973.
[9.8] Menges, G.; Hoven-Nievelstein, W. B.; Zipp, Th.: E rfahrungskatalog zur V erarbeitungs-
schwindung thermoplastischer Formmassen beim SpritzgieBen. Unpublished report, IKV,
Aachen, 1984/85.
Table 9 3 Shrinkage
of
some thermoplastics [9.10]
Material
Nylon 6
Nylon 6-GR
Nylon 6/6
Nylon 6/6-GR
Low-density polyethylene
High-density polyethylene
Polystyrene
Styrene-acrylonitrile
Polymethyl methacrylate (Acrylic)
Shrinkage
%
1-1.5
0.5
1-2
0.5
1.5-3
2-3
0.5-0.7
0.4-0.6
0.3-0.6
Material
Polycarbonate
Polyoxymethylene (Acetal)
Polyvinyl chloride, rigid
Polyvinyl chloride, soft
Acrylonitrile-butadiene-styrene
Polypropylene
Cellulose acetate
Cellulose acetate butyrate
Cellulose propionate
Shrinkage
%
0.8
2
0.5-0.7
1-3
0.4-0.6
1.2-2
0.5
0.5
0.5
8/11/2019 12566_09.pdf
http://slidepdf.com/reader/full/1256609pdf 16/16
[9.9] Baur, E.; Schleede, K.; Lessenich , V.; Ort, St.; FiIz, P.; Potsch, G.; Gro th, S.;
Greif,
H.:
Formteil- und Werkzeugkonstruktion aus einer Hand - Die modernen Hilfsmittel fur den
Konstrukteur. Contribution to 14th Technical Conference on Plastics, Aachen, 1988.
[9.10] Strack Norm alien fur Form werk zeuge. Hand book, Strack-Norm a Gm bH , W uppertal.
[9.11] Frados, J.: Plastics Engineering H andbook. Van Nostrand R einhold, New York, 1976.
[9.12] Potsch, M. G.: Prozessimulation zur Abschatzung von Sch windung und Verzug thermo-
plastischer Spritzgussteile. Dissertation, RWTM, Aachen, 1991.