125-140-1-PB
12
Journal of Society for Transportation and Traffic Studies (JSTS) Vol.4 No.4 22 O-D Matrix Estimation of Subarea Road Network Applying CUBE Program ABSTRACT: The study presents the simulation approach to estimate and update previous trip tables. Cube Analyst (developed by Citilabs) was used to update and estimate trip table along Phahonyothin, Viphavadi Roads and the Elevated Tollway from Din Daeng to Phahonyothin Road (section in front of the Royal Thai Mint). These data obtained from the Extended Bangkok Urban (eBUM) model developed by the Office of Transport and Traffic Policy and Planning (OTP) along with the available traffic counts on the study corridor from Systra MVA (Thailand) were used in the simulation techniques. The resultant trip table was validated by subsequently applying back in the Highway Assignment model using Equilibrium Assignment method and compared to traffic volume counts along the study corridor. As a result of the comparison, it was found that the overall discrepancy was less than 5% with a R-square correlation of 0.96. This demonstrates that the approach along with available traffic data can be used to update trip table with an acceptance level of accuracy. KEYWORDS: Trip table, O-D Matrix Estimate, Cube Analyst 1. INTRODUCTION The O-D matrix estimation is an important task in transportation planning modeling. The task aims to estimate the present and future travel demands in order to plan for efficiently alleviating traffic congestions and sustainable transportation system improvement. In general, the O-D matrix estimation requires a lot of travel behavioral data collected by Home Interview Survey (HIS) and Roadside Interview Survey (RIS) Methods. The accuracy of estimation is relied on the sample sizes of surveys, more sampling, more accurate. In practice, the survey for less than five percentages already needs a lot of resources, including time, staff, and budget, so that it is very difficult to develop an O-D matrix for an individual study. The O-D matrix can be estimated by a number of methods. Basically, it can be categorized into three groups, including 1) the Data Expansion Method for the Primary Data Surveyed from the Study Area, 2) The Parameter Estimation from the Function of Socio-Economic Variables in the Study Area, and 3) The O-D Matrix Estimation from Traffic Volume Surveys on the Road Networks within the Study Area. Tossaphol Chaipitakroj developed the O- D matrix based on the traffic volume counted from the field, and then using the Maximum Likelyhood Regression Analysis Method. To validate the estimated parameters in modeling, Tossaphol tested rout choices in the opened-end road network of the small study area. It was found that the total average difference between modelled and surveyed traffic volumes on each route is only -1.28 percentages, and its R-Square (R 2 ) Value is 0.99. This pointed out traffic volume data from field surveys is suitable for to Anuchit PHANCHANA Systra MVA (Thailand) Ltd 128/404-405 Payathai Road, Rajthewee, Bangkok 10400, Thailand Terdsak RONGVIRIYAPHANIJ Systra MVA (Thailand) Ltd 128/404-405 Payathai Road, Rajthewee, Bangkok 10400, Thailand
-
Upload
dineshkumar -
Category
Documents
-
view
215 -
download
2
description
O-D Matrix Estimation of Subarea Road Network Applying CUBE Program
Transcript of 125-140-1-PB

Journal of Society for Transportation and Traffic Studies (JSTS) Vol.4 No.4
22
O-D Matrix Estimation of Subarea Road Network Applying CUBE Program
ABSTRACT:
The study presents the simulation approach to estimate and update previous trip tables. Cube Analyst (developed by Citilabs) was used to update and estimate trip table along Phahonyothin, Viphavadi Roads and the Elevated Tollway from Din Daeng to Phahonyothin Road (section in front of the Royal Thai Mint). These data obtained from the Extended Bangkok Urban (eBUM) model developed by the Office of Transport and Traffic Policy and Planning (OTP) along with the available traffic counts on the study corridor from Systra MVA (Thailand) were used in the simulation techniques. The resultant trip table was validated by subsequently applying back in the Highway Assignment model using Equilibrium Assignment method and compared to traffic volume counts along the study corridor. As a result of the comparison, it was found that the overall discrepancy was less than 5% with a R-square correlation of 0.96. This demonstrates that the approach along with available traffic data can be used to update trip table with an acceptance level of accuracy. KEYWORDS: Trip table, O-D Matrix Estimate, Cube Analyst
1. INTRODUCTION
The O-D matrix estimation is an important task in transportation planning modeling. The task aims to estimate the present and future travel demands in order to plan for efficiently alleviating traffic congestions and sustainable transportation system improvement. In general, the O-D matrix estimation requires a lot of travel behavioral data collected by Home Interview Survey (HIS) and Roadside Interview Survey (RIS) Methods. The accuracy of estimation is relied on the sample sizes of surveys, more sampling, more accurate. In practice, the survey for less than five percentages already needs a lot of resources, including time, staff, and budget, so that it is very difficult to develop an O-D matrix for an individual study. The O-D matrix can be estimated by a number of methods. Basically, it can be categorized into three groups, including 1) the Data Expansion
Method for the Primary Data Surveyed from the Study Area, 2) The Parameter Estimation from the Function of Socio-Economic Variables in the Study Area, and 3) The O-D Matrix Estimation from Traffic Volume Surveys on the Road Networks within the Study Area.
Tossaphol Chaipitakroj developed the O-D matrix based on the traffic volume counted from the field, and then using the Maximum Likelyhood Regression Analysis Method. To validate the estimated parameters in modeling, Tossaphol tested rout choices in the opened-end road network of the small study area. It was found that the total average difference between modelled and surveyed traffic volumes on each route is only -1.28 percentages, and its R-Square (R2) Value is 0.99. This pointed out traffic volume data from field surveys is suitable for to
Anuchit PHANCHANA Systra MVA (Thailand) Ltd 128/404-405 Payathai Road, Rajthewee, Bangkok 10400, Thailand
Terdsak RONGVIRIYAPHANIJ Systra MVA (Thailand) Ltd 128/404-405 Payathai Road, Rajthewee, Bangkok 10400, Thailand

O-D Matrix Estimation of Subarea Road Network Applying CUBE Program
estimating the O-D Matrix of the opened-end road network.
Surachai Srilenawat applied the Maximum Entropy Regression Analysis Method to forecast traffic volumes on the regioinal highway networks. Surachai used the O-D table in the base year estimated from the surveyed traffic volumes and traffic assignment model. The forecasted volumes on the highway networks were validated with the actual flows, before using the model to forecast the future traffics.
This study aims to propose the O-D Matrix Estimation for the small study area or local area by using the Large Area Model. CUBE software
package was utilized to study the network of Viphavadirangsit and Donmaung Tollway Roads. The study also applied the Extended Bangkok Urban Model (eBUM) developed by the Office of Transport and Traffic Policy and Planning (OTP). With using the eBUM model, two main tasks had to be conducted, including travel behavior data selection and O-D Matrix Estimation based on the traffic volume surveys. The actual raffic volume data supported by Systra MVA (Thailand) Company Limited was employed together with Cube Analyst Module. The traffics assigned into the network by the Equilibrium Assignment Model in CUBE was compared with the traffic data collected from the field in order to validate the study result.
2.The O-D Matrix and the Esitmation Method
2.1The O-D Matrix
The O-D Matrix is the table presenting travel demands between zones within the study area. It has two-dimensional array. Column presents an origin zone, Row presents a destination zone. A figure in each cell presents travel demand or number of trips for that zone pair (Origin and
Destination). An example of zone and the O-D table is illustrated in Figure 1. If the study area is divided into seven zones, the O-D table will consist of 49 numbers of travel demands between zones and the dimension of the matrix is 7x7.
Figure 1 Study Zones and the O-D Table
The O-D Matrix Esitmation Method
1
6
7
23
54
1 2 3 4 5 6 7
1 0 31 33 57 30 20 16
2 31 0 53 62 33 23 19
3 33 53 0 55 34 29 19
4 57 62 55 0 63 32 42
5 30 33 34 63 0 23 26
6 20 23 29 32 23 0 14
7 0 31 33 57 30 20 16
Destination Zones
OriginZones
OD Matrix
23

O-D Matrix Estimation of Subarea Road Network Applying CUBE Program
Three methods to estimate the O-D matrix or Table are listed below.
1) The Data Expansion Method: This approach employs the primary data surveyed in the current or base year from the study area. It also needs to apply the sampling theory to estimate the base year O-D table. To forecast the future travel demands, various data expansion methods can be used, for example the Growth Factor Method is a popular approach for expanding the O-D table, because of its indifficulty and fast operation.
2) The Parameter Estimation Method: The method aims to estimate the matrix from the function of model variables, normally use the socio-economic data or variables of travelers and the specific characters of the study area, together with travel demands forecasted by the surveyed base year demands. This method will estimate the function parameter able to quantify numbers of
trips between origin and destination. The popular method for the parameter estimation method is the Sequential 4-Step Models, which is widely used in urban transportation planning.
3) The O-D Matrix Estimation from Traffic Volume Surveys: This method is recently developed, and it aims to find out the best parameter estimation. The well-known estimation methods are the linear programing method, the entropy maximization method and the maximum likelihood method. It aims to employ the O-D table estimated from the counted traffic data. This will be very suitable for any study area, which often conducts traffic count surveys for various purposes, such as accident analysis and prevention planning, urban transportation planning, traffic improvement plan etc. At present, the traffic count instructments have been developed continuously with advanced technologies and inexpensive compared to the past, so it is worth to employ this technique to estimate the O-D matrix for the planning purpose.
The O-D Matrix Esimation by CUBE Package
CUBE software has the module of Cube Analyst. This module can estimate the O-D table by using the Maximum Likelihood Regression Method. This aims to estimate the value of parameter by using Equation 1
The accuracy of variable estimation is relied on the quality of observed data. The M value in Equation 2.1 presents the similarity or
difference of estimated variables. The value of 𝑀 normally is the negative value. To achieve the maximum accuracy, the The value of 𝑀 should be the minimum absolute value.
The maximum likelihood regression method estimates the parameter value based on the actual data. It employs the Random Sampling with the Parametric Distribution as shown the relationship in Equation 2
24
O-D Matrix Estimation of Subarea Road Network Applying CUBE Program
22
According to Equation 2, it is found that prob (𝑋 = 𝑥) is the Probability Distribution Function. The Inferential Statistics, when the
value of 𝑥is known, and it needs to estimate the parameter by considering the Likelihood Function shown in Equation 3
In Equation 3, when consider traffic volumes conuted from the field it needs to assume the distribution of traffic volumes to be
the Poisson Distribution, so that the new equation can be rewritten into Equiation 4
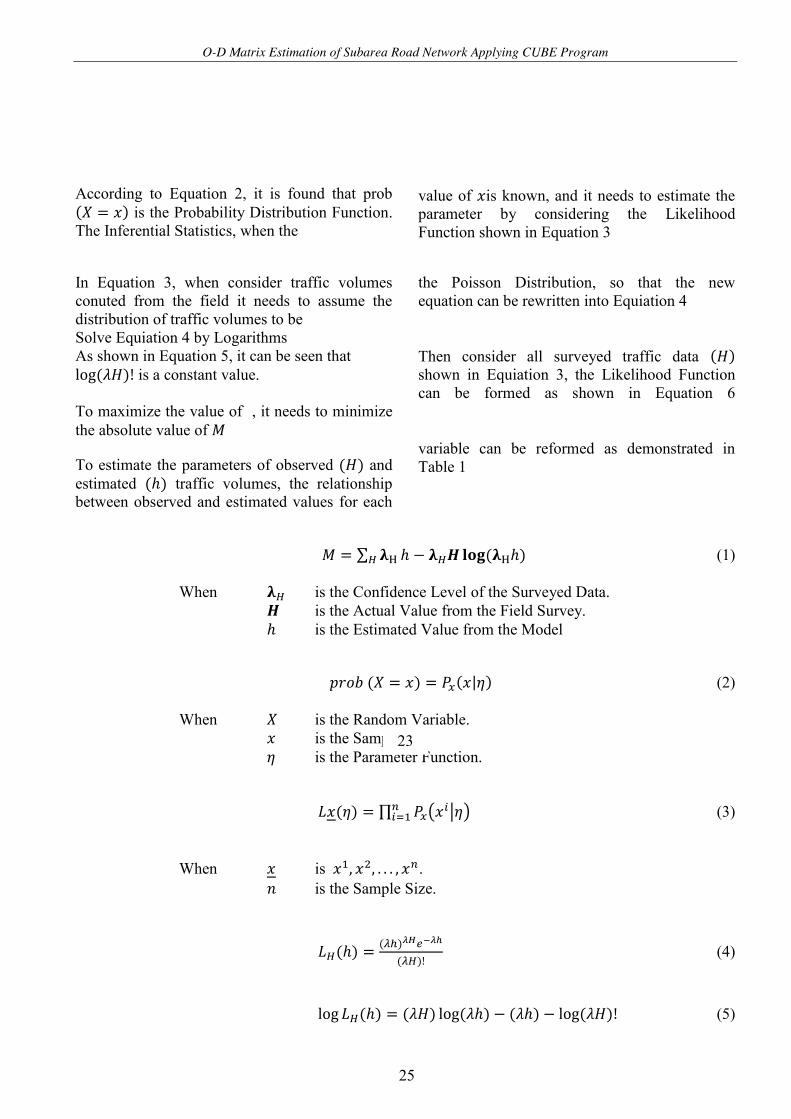
Solve Equiation 4 by LogarithmsAs shown in Equation 5, it can be seen that log(𝜆𝐻)! is a constant value.
Then consider all surveyed traffic data (𝐻) shown in Equiation 3, the Likelihood Function can be formed as shown in Equation 6
To maximize the value of , it needs to minimize the absolute value of 𝑀
To estimate the parameters of observed (𝐻) and estimated (ℎ) traffic volumes, the relationship between observed and estimated values for each
variable can be reformed as demonstrated in Table 1
𝑀 = ∑ 𝛌 ℎ − 𝛌 𝑯 𝐥𝐨𝐠(𝛌 ℎ) (1)
When 𝛌 is the Confidence Level of the Surveyed Data. 𝑯 is the Actual Value from the Field Survey. ℎ is the Estimated Value from the Model
𝑝𝑟𝑜𝑏 (𝑋 = 𝑥) = 𝑃 (𝑥|𝜂) (2)
When 𝑋 is the Random Variable. 𝑥 is the Sample. 𝜂 is the Parameter Function.
𝐿𝑥(𝜂) = ∏ 𝑃 𝑥 𝜂 (3)
When 𝑥 is 𝑥 , 𝑥 , . . . , 𝑥 . 𝑛 is the Sample Size.
𝐿 (ℎ) = ( )( )!
(4)
log 𝐿 (ℎ) = (𝜆𝐻) log(𝜆ℎ) − (𝜆ℎ) − log(𝜆𝐻)! (5)
23
25

Journal of Society for Transportation and Traffic Studies (JSTS) Vol.4 No.4
𝐿 = ∏ 𝐿 (ℎ) (6)
𝑀 = ∑ 𝑀 (7)
Table 1 The Relationship Formulation of Observed and Estimated Values for each Trips Related Variables.
Therefore, the equation of Objective Function (M) in Equation 2.1 can be rewritten into Equation 2.8.
The Objective Function in Equation 2.8 can be calibrated for number of trips from origin to destination zones. In Cube Analyst, Equation 2.8 is modified into Equation 2.9.
Objective Function , M = ∑ λ (V − Q log(λ V )) Traffic Volumes Observed on Screenline +∑ λ (G − O log(λ G )) Trip Productions in Origin Zone +∑ λ (A − D log(λ A )) Trip Attractions in Destination Zone +∑ λ (T − N log(λ T )) The Prior O-D Matrix
+∑ λ (T −t ) The Travel Cost Table (8)
𝑇 = 𝑎 𝑏 𝑡 ∏ 𝑥 (9)
𝑎 is Trip Productions in Origin Zone. 𝑏 is Trip Attractions in Destination Zone. 𝑡 is Number of Trips from Origin Zone i to Destination Zone j 𝑥 is Number of Trips counted on the Screenline, Route k 𝑅 is Probability to travel from Zone i to Zone j by Route
Data/ Variables Observed Values (H)
Estimated Values (h)
Number of Trips between Origin Zone i to Destination Zone j Number of Trip Productions in Origin Zone i Number of Trip Attractions in Destination Zone j Number of Trips counted on the Screenline, Route k
Nij Oi Dj QK
𝐺 = 𝑇
𝐴 = 𝑇
𝐴 = 𝑅 𝑇
Tij
24
25
26

O-D Matrix Estimation of Subarea Road Network Applying CUBE Program
22
𝑡 = 𝑐 𝑒 (10)
𝑐 is Cost for Traveling from Origin Zone i to Destination Zone j. 𝑎, 𝛽 is Parameters.
If actual number of trips travel from Zone i to Zone j is unavailable, the value of tij can be calculated by using Equation 2.10.
Equation 2.9 is suitable for estimating the current travel demands rather than the future ones, because it does not consider travel behaviors. In
the opposite, Equation 2.10 employs the Gravity Model from Trip
Distribution Modelling to reflect travel behaviors. This Gravity Model assume that travelers decide to travel to the zones that they pay the lowest costs.
3. ASSUMPTION OF THE STUDY
3.1 Study Area
This study determines study area along Viphawadi Rangsit route since Din Daeng
intersection to Phahonyothin Road, in front of Royal Thai Mint, as show in figure 2
Figure 2 Study Area
27

O-D Matrix Estimation of Subarea Road Network Applying CUBE Program
22
3.2 Bangkok and Metropolitan Transport Model
This study will have the process to extract O-D Matrix which is related study area from the existing model. Which will use the “eBUM” model to extract. eBUM modeling is the usage of travelling table, partly on the Highway O-D Matrix, Highway Network and Path File. Which come from Highway Assigment Model “eBUM” or Enhance Bangkok Urban Transport Model is the model of Bangkok Metropolitan and surroundings at present. There is developed by government sector, namely Office of Transport
and Traffic Planning Policy (OTP). eBUM starts to use for traffic policy planning in 1997 and improve development until in 2011. The perspective of eBUM is the development model of 4 stages which are comprised of Trip Generation, Trip Distribution, Model Split and Trip Assignment in figures 3 shown the area and road network of eBUM Model
Study Data and Resource This study is overall secondary data. Data and source summarized on table 2
Figure 3 The Area and Road Network of eBUM Model
Table 2 Data and source for this study
Type of Data Source Road Network Data eBUM Model [5] O-D Matrix of Bangkok and Metropolitan Data
eBUM Model [5]
Path File eBUM Model [5] Traffic Volume on Viphawadi Rangsit Systra MVA (Thailand) Ltd. Traffic Volume of Don Muang Tollway Systra MVA (Thailand) Ltd. [6]
Bangkok
Samut Prakarn
Nonthaburi
Pathum Thani
Nakhorn Pathom
Samut Sakhon
27
28

Journal of Society for Transportation and Traffic Studies (JSTS) Vol.4 No.4
22
4. STAGE OF STUDY
There is 3 stages of this study; Screening from travelling schedule of eBUM model, estimate travelling table by using Cube Analyst and comparison of results stages of the study indicated on figure 4
4.1 O-D Matrix Extraction from eBUM Model
In this process, the O-D Matrix, Network and Path File from eBUM Model will be input to the Sub Area Extraction on CUBE Program
The first step of Sub Area Extraction is opening the highway network, O-D Matrix and Path File. After that, draw the boundary of the study area onto the network and using command Sub Area Extraction. Finally, we will get O-D Matrix and road network of the study area that is the corridor of Viphawadi Rangsit route since Din Daeng intersection to Phahonyothin Road, in front of Royal Thai Mint. Figure 5 shown the road network which is the results of Sub Area Extraction by using Cube program.
4.2 Estimation of O-D Matrix by Cube Analyst
Take the preliminary O-D Matrix and road network of the study area from the Sub Area Extraction process to the Cube Analyst module. And also input the existing traffic volume of the study area in this stage. We used the traffic volume of the screenline and traffic volume of the entry-exit from Don Muang Tollway. Finally, we will get the O-D Matrix of the study area from this stage.
4.3 Highway Assignment
This stage is the process of loading the O-D Matrix from Cube Analyst module onto the road network from Sub Area Extraction facilities to produce traffic volumes.
4.4 The Study Result and Validation
4.4.1 The Study Result
The output of Cube Analyst is the. This table can be demonstrated in term of traffic volumes on the network in the study area. The trip tables represented travel pattern along the study corridor especially along Viphavadi road and the Tollway. By using the Equilibrium Assignment method, the traffic volumes on Viphavadi Road and the Tollway can be estimated as shown in Figure 6
29

Journal of Society for Transportation and Traffic Studies (JSTS) Vol.4 No.4
22
Figure 4 Stage of Study
30

O-D Matrix Estimation of Subarea Road Network Applying CUBE Program
22
Figure 5 Sub Area Extraction on CUBE Program
Figure 6 Traffic Volume in The Study Area from Model
31

Journal of Society for Transportation and Traffic Studies (JSTS) Vol.4 No.4
22
4.4.2 The Result Validation
The resultant trip table was validated by subsequently applying back in the Highway Assignment model using Equilibrium Assignment method and compared to traffic volume counts along the study corridor. As a result of the comparison, it was found that for the Screenline the overall discrepancy was less than
5% with a R-square correlation of 0.97 (See Figure 5.2). The overall discrepancy of the Tollway was also less than 5% and its R-square correlation is 0.96 (See Figure 7).
These demonstrate that the approach along with available traffic data proposed in this study can be used to update trip table with an acceptance level of accuracy.
Figure 7 Traffic Volume Validation on the Screeline
Figure 8 Traffic Volume Validation on the Entry/Exit of Tollway
32

Journal of Society for Transportation and Traffic Studies (JSTS) Vol.4 No.4
22
5. CONCLUSION
This study pointed out the module of Cube Analyst is applicable for estimiating the O-D matrix. In particular, its reliability and accuracy are acceptable for transportation planning. Therefore, it is worth to apply this technique to
estimate the O-D table instead of conducting home and/or roadside interview surveys. However, there is a limitation on forecasting future travel demands, especially for long term planning, because the travel behaviors and socio-economic variables of travelers are not taken into account.
REFERENCE
Citilabs.2008. “Discover Cube 5.0 Tutorial, Advanced Scripting Techniques with Cube Voyager,
Citilabs Inc. 1211 Miccosukee Road Tallahassee FL 32308 USA. June de Dios Ortúzar,2002. “ Modelling Transport”,Department of Transport Engineering Pontificia
Universidad Católica de Chile Santiago Chile Office of Transport and Traffic Policy and Planning,2007, “Final Report of Transport Data and Model
Center (TDMC) V Project” Surachai Srilenawat.1991. “Traffic Forecsting on Rural Highways Employing Urban Transportation
Models”, Thesis Civil Engineering Chulalongkorm University Systra MVA (Thailand) Ltd.,2010,“DMT Traffic and Revenue Forecast Report 2010” Tossaphol Chaipitakroj,2002. “Development of an O-D trip matrix from traffic count”, Thesis Civil
Engineering(Transportation), Price of Songkla University
33


![MOMP SERIES HYDRAULIC MOTOR · 13 PERFORMANCE DATA MO m ] P ) Max.Cont. Max.Int. e Max.Cont. Max.Int. Flow (L/Min) 30 60 80 100 125 140 160 175 Flow (L/Min) 30 60 80 100 125 140 160](https://static.fdocuments.in/doc/165x107/5f3c002b0d2bf2344b57061c/momp-series-hydraulic-13-performance-data-mo-m-p-maxcont-maxint-e-maxcont.jpg)