122014 - Creating the Environment for Entrepreneurship
30
Department of Economics Working Paper Series Creating the Environment for Entrepreneurship through Economic Freedom Joshua Hall, Robert Lawson Lawson and Saurav Roychoudhury Working Paper No. 15-01 This paper can be found at the College of Business and Economics Working Paper Series homepage: http://be.wvu.edu/phd_economics/working-papers.htm
Transcript of 122014 - Creating the Environment for Entrepreneurship

Department of Economics Working Paper Series
Creating the Environment for Entrepreneurship through Economic Freedom Joshua Hall, Robert Lawson Lawson and Saurav Roychoudhury
Working Paper No. 15-01
This paper can be found at the College of Business and Economics Working Paper Series homepage:
http://be.wvu.edu/phd_economics/working-papers.htm

Creating the Environment for Entrepreneurship through Economic Freedom
Joshua C. Hall
Associate Professor of Economics West Virginia University
College of Business and Economics 1601 University Avenue
Morgantown, WV 26506-6025 304-293-7870
Robert A. Lawson Jerome M. Fullinwider Chair in Economic Freedom
William J. O’Neil Center for Global Markets and Freedom Edwin L. Cox School of Business
Southern Methodist University P.O. Box 750333
Dallas, Texas 75275 214-768-1708
Saurav Roychoudhury Associate Professor of Finance
School of Management and Leadership Capital University
1 College and Main Columbus, Ohio 43209
614-236-7230 [email protected]
Abstract
In this paper we argue that the ability of people to freely trade, enter into contracts, and start businesses in a system of private property and the rule of law is crucial for productive entrepreneurship. One measure of how freely individuals can engage in economic activity is the Economic Freedom of the World (EFW) index. After examining the economic policies that harm economic freedom and possibly entrepreneurship, we highlight the correspondence between economic freedom and a number of measures of entrepreneurship. We conclude with some thoughts regarding future research involving economic freedom and entrepreneurship.
Keywords: economic freedom; institutions; entrepreneurship; new firm JEL Codes: M13; O50

1
Creating the Environment for Entrepreneurship through Economic Freedom
I. Introduction
That entrepreneurship is important for economic progress is hardly a point worth arguing in this
day and age. Whether talking about the Kirznerian arbitrager or the Schumpeterian creative
destructor, both are seen as vital to the economically efficient use of scarce resources.1 What is
less understood perhaps, or at least less agreed upon, is how a society might go about fostering
an entrepreneurial culture.
One approach is to use direct government action to stimulate entrepreneurial activity. In the
United States, one prominent example is the Small Business Administration, which according to
its website “has delivered millions of loans, loan guarantees, contracts, counseling sessions and
other forms of assistance to small businesses.”2 Another approach is to eliminate the multitude of
government-imposed impediments to entrepreneurship, and allow the market process to run its
course. In other words, entrepreneurship can be fostered through economic freedom.
Consider as an example the Kirznerian entrepreneur who recognizes that bananas sell for
$0.50 per bunch in Guatemala but sell for $1.00 per bunch in the United States. So long as the
costs associated with shipping, contract negotiating, financing, required profit, etc. are less than
$0.50, he will be encouraged to import bananas to the United States from Guatemala. The net
gains of this action are easy for neo-classical economists to demonstrate with simple supply and
demand diagrams. But if the government of the United States enacts a tariff or otherwise
impedes the importation of bananas, this value-creating activity may not take place. Indeed
according to the World Bank’s Doing Business project it takes 5 days and $1,315 to process a
standard shipping container into the United States, and this figure omits an tariffs or customs
duties.3 Tariffs and duties in the United States average about 3.5% but can be much higher for

2
selected goods. The tariff for dairy products averages 19.8%, for beverages 16.3%, for sugar
12.1% and for clothing 11.4%.4 Costs associated with acquiring an import quota for select
additional items, such as sugar or Japanese cars, can add up to even more. How many value-
creating imports are discouraged by this array of policies?
Next consider the Schumpeterian innovator who discovers a new product to meet some
consumer desire. What are the impediments to starting her new business? In the United States,
the World Bank estimates that it takes 6 procedures, 6 days and 1.4% of a typical person’s
annual income to start a business. Not too bad by world standards. But in places like India it is
much worse: 12 procedures, 29 days, and a whopping 46.8% of a typical annual income. What if
the new business involves constructing a new building? In India, getting construction permits
takes 34 procedures, 227 days and 1631% of average annual income. To get electricity takes 7
procedures, 67 days and 216% of average annual income. How many would-be Indian
entrepreneurs are squelched by such suffocating regulations?5
Rather than adding more government policies to stimulate entrepreneurial activity, would not
it be prudent to at least consider eliminating the various government policies that stifle such
activity in the first place? This paper will proceed to examine the various economic policies that
harm economic freedom and potentially harm entrepreneurial activity. In the end, we will
demonstrate the correspondence between economic freedom and various measures of
entrepreneurship.
II. Economic Freedom and the Entrepreneurial Environment
We argue that economic freedom, the ability of people to freely trade, enter into contracts,
and to compete and start businesses within a legal framework of private property and rule of law,

3
is critically important in creating an entrepreneurial environment. In order to support this claim
empirically, we first need to measure economic freedom. Fortunately, the Economic Freedom of
the World (EFW) index (Gwartney, Lawson and Hall, 2014) provides such a measure.6
The construction of the index published in Economic Freedom of the World is based on three
important methodological principles. First, objective components are always preferred to those
that involve surveys or value judgments. Given the multi-dimensional nature of economic
freedom and the importance of legal and regulatory elements it is sometimes necessary to use
data based on surveys, expert panels, and generic case studies. To the fullest extent possible,
however, the index uses objective components. Second, the data used to construct the index
ratings are from external sources such as the International Monetary Fund, World Bank, and
World Economic Forum that provide data for a large number of countries. Data provided directly
from a source within a country are rarely used, and only when the data are unavailable from
international sources. Importantly, the value judgments of the authors or others in the Economic
Freedom Network are never used to alter the raw data or the rating of any country. Third,
transparency is present throughout. The report provides information about the data sources, the
methodology used to transform raw data into component ratings, and how the component ratings
are used to construct both the area and summary ratings.
Exhibit 1 indicates the structure of the EFW index. The index measures the degree of
economic freedom present in five major areas: (1) Size of Government: Expenditures, and Taxes,
Enterprises; (2) Legal Structure and Security of Property Rights; (3) Access to Sound Money; (4)
Freedom to Trade Internationally; (5) Regulation of Credit, Labor, and Business.
Within the five major areas, there are 23 components in the index. Many of those
components are themselves made up of several sub-components. In total, the index comprises 42
distinct variables. Each component and sub-component is placed on a scale from 0 to 10. The

4
sub-component ratings are averaged to determine each component. The component ratings
within each area are then averaged to derive ratings for each of the five areas. In turn, the five
area ratings are averaged to derive the summary rating for each country.
Size of Government: Expenditures, Taxes, and Enterprises
The four components of Area 1 indicate the extent to which countries rely on the political
process to allocate resources and goods and services. When government spending increases
relative to spending by individuals, households, and businesses, government decision-making is
substituted for personal choice and economic freedom is reduced. The first two components
address this issue. Government consumption as a share of total consumption (1A) and transfers
and subsidies as a share of GDP (1B) are indicators of the size of government. When government
consumption is a larger share of the total, political choice is substituted for personal choice.
Similarly, when governments tax some people in order to provide transfers to others, they reduce
the freedom of individuals to keep what they earn.
The third component (1C) in this area measures the extent to which countries use private
rather than government enterprises to produce goods and services. Government firms play by
rules that are different from those to which private enterprises are subject. They are not
dependent on consumers for their revenue or on investors for capital. They often operate in
protected markets. Thus, economic freedom is reduced as government enterprises produce a
larger share of total output.
The fourth component (1D) is based on (Di) the top marginal income tax rate and (Dii) the
top marginal income and payroll tax rate and the income threshold at which these rates begin to
apply. These two sub-components are averaged to calculate the top marginal tax rate (1D). High
marginal tax rates that apply at relatively low income levels are also indicative of reliance upon
government. Such rates deny individuals the fruits of their labor. Thus, countries with high

5
marginal tax rates and low income thresholds are rated lower.
Taken together, the four components of Area 1 measure the degree to which a country relies
on personal choice and markets rather than government budgets and political decision-making.
Therefore, countries with low levels of government spending as a share of the total, a smaller
government enterprise sector, and lower marginal tax rates earn the highest ratings in this area.
Legal Structure and Security of Property Rights
Protection of persons and their rightfully acquired property is a central element of economic
freedom and a civil society. Indeed, it is the most important function of government. Area 2
focuses on this issue. The key ingredients of a legal system consistent with economic freedom
are rule of law, security of property rights, an independent judiciary, and an impartial court
system. Components indicating how well the protective function of government is performed
were assembled from three primary sources: the International Country Risk Guide, the Global
Competitiveness Report, and the World Bank’s Doing Business project.
Security of property rights, protected by the rule of law, provides the foundation for both
economic freedom and the efficient operation of markets. Freedom to exchange, for example, is
meaningless if individuals do not have secure rights to property, including the fruits of their
labor. When individuals and businesses lack confidence that contracts will be enforced and the
fruits of their productive efforts protected, their incentive to engage in productive activity is
eroded. Perhaps more than any other area, this area is essential for the efficient allocation of
resources. Countries with major deficiencies in this area are unlikely to prosper regardless of
their policies in the other four areas.
Access to Sound Money
Money oils the wheels of exchange. An absence of sound money undermines gains from
trade. As Milton Friedman informed us long ago, inflation is a monetary phenomenon, caused by

6
too much money chasing too few goods. High rates of monetary growth invariably lead to
inflation. Similarly, when the rate of inflation increases, it also tends to become more volatile.
High and volatile rates of inflation distort relative prices, alter the fundamental terms of long-
term contracts, and make it virtually impossible for individuals and businesses to plan sensibly
for the future. Sound money is essential to protect property rights and, thus, economic freedom.
Inflation erodes the value of property held in monetary instruments. When governments finance
their expenditures by creating money, in effect, they are expropriating the property and violating
the economic freedom of their citizens.
The important thing is that individuals have access to sound money: who provides it makes
little difference. Thus, in addition to data on a country’s inflation and its government’s monetary
policy, it is important to consider how difficult it is to use alternative, more credible, currencies.
If bankers can offer saving and checking accounts in other currencies or if citizens can open
foreign bank accounts, then access to sound money is increased and economic freedom
expanded.
There are four components to the EFW index in Area 3. All of them are objective and
relatively easy to obtain and all have been included in the earlier editions of the index. The first
three are designed to measure the consistency of monetary policy (or institutions) with long-term
price stability. Component 3D is designed to measure the ease with which other currencies can
be used via domestic and foreign bank accounts. In order to earn a high rating in this area, a
country must follow policies and adopt institutions that lead to low (and stable) rates of inflation
and avoid regulations that limit the ability to use alternative currencies.
Freedom to Trade Internationally
In our modern world of high technology and low costs for communication and transportation,
freedom of exchange across national boundaries is a key ingredient of economic freedom. Many

7
goods and services are now either produced abroad or contain resources supplied from abroad.
Voluntary exchange is a positive-sum activity: both trading partners gain and the pursuit of the
gain provides the motivation for the exchange. Thus, freedom to trade internationally also
contributes substantially to our modern living standards.
In response to protectionist critics and special-interest politics, virtually all countries adopt
trade restrictions of various types. Tariffs and quotas are obvious examples of roadblocks that
limit international trade. Because they reduce the convertibility of currencies, controls on the
exchange rate also hinder international trade. The volume of trade is also reduced if the passage
of goods through customs is onerous and time consuming. Sometimes these delays are the result
of administrative inefficiency while in other instances they reflect the actions of corrupt officials
seeking to extract bribes. In both cases, economic freedom is reduced.
The components in this area are designed to measure a wide variety of restraints that affect
international exchange: tariffs, quotas, hidden administrative restraints, and exchange rate and
capital controls. In order to get a high rating in this area, a country must have low tariffs, a trade
sector larger than expected, easy clearance and efficient administration of customs, a freely
convertible currency, and few controls on the movement of capital.
Regulation of Credit, Labor, and Business
When regulations restrict entry into markets and interfere with the freedom to engage in
voluntary exchange, they reduce economic freedom. The fifth area of the index focuses on
regulatory restraints that limit the freedom of exchange in credit, labor, and product markets. The
first component (5A) reflects conditions in the domestic credit market. The first two sub-
components provide evidence on the extent to which the banking industry is dominated by
private firms and whether foreign banks are permitted to compete in the market. The final two
sub-components indicate the extent to which credit is supplied to the private sector and whether

8
controls on interest rates interfere with the market in credit. Countries that use a private banking
system to allocate credit to private parties and refrain from controlling interest rates receive
higher ratings for this regulatory component.
Many types of labor-market regulations infringe on the economic freedom of employees and
employers. Among the more prominent are minimum wages, dismissal regulations, centralized
wage setting, extension of union contracts to nonparticipating parties, and conscription. The labor-
market component (5B) is designed to measure the extent to which these restraints upon economic
freedom are present. In order to earn high marks in the component rating regulation of the labor
market, a country must allow market forces to determine wages and establish the conditions of
hiring and firing, and refrain from the use of conscription.
Like the regulation of credit and labor markets, the regulation of business activities
(component 5C) inhibits economic freedom. The sub-components of 5C are designed to identify
the extent to which regulations and bureaucratic procedures restrain entry and reduce
competition. In order to score high in this portion of the index, countries must allow markets to
determine prices and refrain from regulatory activities that retard entry into business and increase
the cost of producing products. They also must refrain from “playing favorites,” that is, from
using their power to extract financial payments and reward some businesses at the expense of
others.
III. Economic Freedom and Entrepreneurship
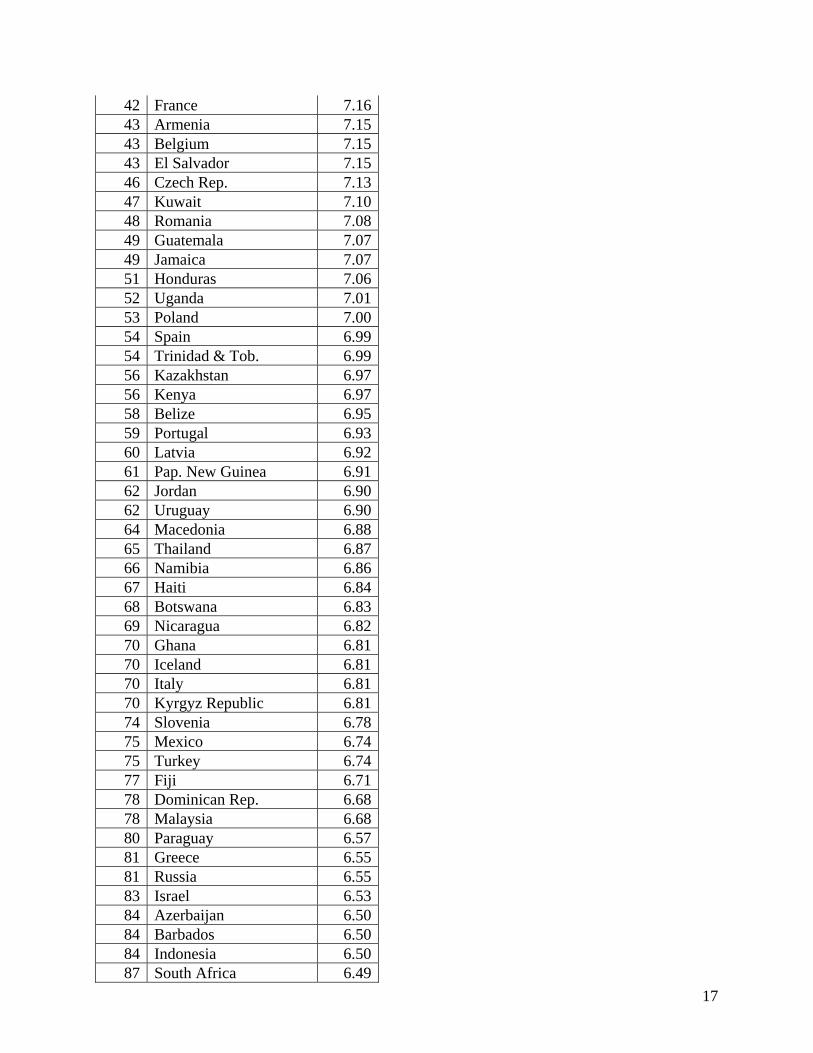
Exhibit 2 presents summary economic freedom ratings, sorted from highest to lowest for 141
countries. These ratings are for the year 2009. Hong Kong and Singapore, once again, occupy the
top two positions. The other nations in the top 10 are New Zealand, Switzerland, Australia,
Canada, Chile, United Kingdom, Mauritius, and the United States. The rankings of other major
countries include Germany (21st), Japan (22nd), Korea (30th), France (42nd), Spain (54th), Italy

9
(70th), Mexico (75th), Russia (81st), China (92nd), India (94th), and Brazil (102nd). The ten lowest-
rated countries are Chad, Burundi, Republic of Congo, Guinea-Bissau, Central African Republic,
Democratic Republic of Congo, Angola, Venezuela, Myanmar, and again in last place,
Zimbabwe.
This chapter concludes with some graphs (Exhibits 3-8) illustrating simple relationships
between economic freedom and various measures of entrepreneurial activity. The graphs use the
average of the EFW index for the period from 1990 to 2010, breaking the data into four quartiles
ordered from low to high. Because persistence is important and the impact of economic freedom
will be felt over a lengthy time period, it is better to use the average rating over a fairly long time
span rather than the current rating to observe the impact of economic freedom on performance.
We are not necessarily arguing that there is a direct causal relation between economic
freedom and the variables considered below. In other words, these graphics are no substitute for
real, scholarly investigation that controls for other factors. Nonetheless, we believe that the
graphs provide some insights about the contrast between the nature and characteristics of market-
oriented economies and those dominated by government regulation and planning. At the very
least, these figures suggest potential fruitful areas for research, which we will highlight while
discussing the exhibits.7
Nevertheless, each and every indicator we have examined related to entrepreneurship
demonstrates the positive relationship between economic freedom and entrepreneurial activity.
Exhibit 3, for example, looks at the relationship between economic freedom and new firm entry
density, which is defined as the number of newly registered limited liability firms per 1,000
working age people. The exhibit shows that new firm entry density is more than three times
higher in the most economically free quartile of countries compared to the least economically
free quartile. Interestingly, new firm entry density actually declines when going from the least

10
free quartile to the next quartile.
Given the aggregate nature of this data it is difficult to pinpoint exactly why this non-linear
relationship between economic freedom and new firm entry density might exist but one
possibility might be related to how the incentives for formalization of new businesses change
while economic freedom is increasing. For example, in countries where government plays a very
direct role in planning economic activity, the formal registration of favored businesses is
relatively straightforward and simple. Then when countries move away from outright planning
but fail to provide widespread economic freedom, the incentives for formalization of new firms
drops until economic freedoms across a number of areas can be secured, as is evidenced by the
increase in new firm entry density going from the second highest quartile to the highest quartile.
Exhibit 4 illustrates the relationship between economic freedom and the Global
Entrepreneurship and Development Index (GEDI). The GEDI measures entrepreneurial attitudes,
activities, and aspirations across a large number of countries. Like in the case with new firm
entry density, there exists a large difference between scores in the least economically free
quartile of countries and the most economically free quartile of countries. While average GEDI
scores increase for every quartile from the lowest to the highest, it should be noted that the
biggest jump occurs from the second freest quartile to the most economically free quartile. A
similarly large jump when going from the second to the most economically free quartile can be
seen in Exhibit 3. A similar relationship can be seen in Exhibit 5, which shows the relationship
between the EFW and the Entrepreneurship and Opportunity sub-index of the Legatum
Institute’s Legatum Prosperity Index. To be in the most economically free quartile a country
generally has to be economically free across all five areas of the EFW index. This suggests that
that being economically free across multiple areas of economic freedom might be important to
entrepreneurship and consequently to economic progress. Future research is needed on how

11
exactly the various components of economic freedom work together to foster entrepreneurship.
In a manner similar to the three previous exhibits, Exhibits 6, 7, and 8 employ survey
questions from the World Economic Forum’s Executive Opinion Survey that are related to
entrepreneurship. For example, Exhibit 6 uses responses to the question “How easy or difficult is
it to start a new business in your country?” Countries receive scores based on aggregated
answers from individuals, who answered the question with a score ranging from 1 (very difficult)
to 7 (very easy). The figure again shows a positive relationship between how economically free a
country is and this measure of entrepreneurship. It is important to note that this question, unlike
new firm entry density in Exhibit 3, does not distinguish between formal and informal
enterprises and instead merely reflects survey respondents perceptions of how easy it is to start a
business. One possible fruitful area of research suggested by this exhibit is how does economic
freedom relate differently, if at all, to entrepreneurial perceptions or motivations compared to
entrepreneurial actions.
Economically free countries because economically free societies have higher incomes and
more developed banking sectors. This is important for entrepreneurs as it makes available
resources to be used in the formation of new enterprises. Exhibits 7 and 8 highlight this point
using survey data on access to bank loans and venture capital availability. The results are
consistent: in countries with greater economic freedom entrepreneurs have greater access to bank
loans and venture capital.
IV. Concluding Thoughts
Entrepreneurs enhance our lives by directing resources toward their most valuable uses and
by creating new products to satisfy our wants and desires. Both economic intuition and the
empirical evidence support the notion that societies with more economic freedom foster greater

12
entrepreneurial activity. This result is confirmed not only in the simple relationships we have
presented here, but also in a growing number of empirical studies (Kreft and Sobel 2005;
Campbell and Rogers 2007;Bjørnskov and Foss 2008; Gohmann et al. 2008; Nyström 2008;
Hall and Sobel 2008; Wiseman and Young 2013; Hall et al. 2013).
Despite this growing literature, there is still much about the relationship between economic
freedom and entrepreneurship that it is not well understood. For example, how important are
local barriers to entrepreneurship? The Institute for Justice, a special-interest law firm in
Washington D.C., has published multiple reports showing the regulatory burdens facing
entrepreneurs in U.S. cities (Milnikel and Satterthwaite 2010; Hottot 2010; Bindas 2010;
Frommer 2010). These reports not only document the significant local barriers to
entrepreneurship that exist within major cities in the United States, they also highlight how
cross-country evidence does not necessarily shed light on specific regulations that may impose
significant costs upon potential and actual entrepreneurs in a particular industry. While the true
costs of regulation might never be known (Benson 2004) they are likely to be large and vary by
location and sector. Future research can take advantage of new sources of data like the Economic
Freedom Index of Metropolitan Areas (Stansel 2013) and RegData (Al-Ubaydli and McLaughlin
2013).
Little is also known about the distribution of benefits from the opening up of entrepreneurial
opportunities that comes from economic freedom. One of the benefits of case studies like the
ones from the Institute for Justice and those contained in Llosa (2008) is that they illustrate how
the entrepreneurial decisions of the poor are distorted by regulations. The high cost of complying
with regulations that enact high barriers to entry into the formal sector mean that the poor either
give up their entrepreneurial dreams or pursue their entrepreneurial activity in the informal
sector.8

13
A final related topic in need of additional research is the difference between entrepreneurship
and wealth creation. Presumably the reason why so many policymakers and scholars are
concerned with entrepreneurship is because of its contribution to economic progress. Self-
employment, however, could be the result of limitations on economic freedom. For example, low
levels of economic freedom could stifle the development of a large formal sector, limiting paid
employment opportunities and driving many individuals to self-employment out of necessity. Or
the growth of small businesses in a region could reflect rent seeking instead of profit seeking
(Sobel and Garrett 2002; Hall and Ross 2009). Two recent papers that focus on how institutions
shape entrepreneurial opportunities towards wealth creation are Sobel (2008) and Sanandaji and
Leeson (2013) provide a good foundation upon which future research could build.

14
Exhibit 1: The Areas and Components of the EFW Index
Area 1: Size of Government: Expenditures, Taxes, and Enterprises
A
General government consumption spending as a percentage of total consumption
B Transfers and subsidies as a percentage of GDP
C Government enterprises and investment
D Top marginal tax rate
i Top marginal income tax rate
ii Top marginal income and payroll tax rates
Area 2: Legal Structure and Security of Property Rights A Judicial independence B Impartial courts C Protection of property rights
D Military interference in rule of law and the political process
E Integrity of the legal system F Legal enforcement of contracts
G Regulatory restrictions on the sale of real property
Area 3: Access to Sound Money A Money growth B Standard deviation of inflation C Inflation: Most recent year
D Freedom to own foreign currency bank accounts
Area 4: Freedom to Trade Internationally A Taxes on international trade
i. Revenues for trade taxes (%of trade sector)
ii Mean tariff rate
iii Standard deviation of tariff rates
B Regulatory Trade Barriers i Non-tariff trade barriers
ii Compliance cost of importing & exporting

15
C Size of the trade sector relative to expected
D Black-market exchange rates
E International capital market controls
i
Foreign ownership/investment restrictions
ii Capital controls
Area 5: Regulation of Credit, Labor, and Business A Credit market regulations
i. Ownership of banks ii Foreign bank competition iii Private sector credit
iv
Interest rate controls/Negative real interest rates
B Labor market regulations
i Hiring regulations and minimum wage
ii Hiring and firing regulations
iii Centralized collective bargaining
iv Hours regulations
v Mandated cost of worker dismissal
vi Conscription C Business Regulations
i Price controls
ii Administrative requirements
iii Bureaucracy costs iv Starting a business
v Extra payments/bribes/favoritism
vi Licensing restrictions vii Cost of tax compliance

16
Exhibit 2: Economic Freedom Ratings and Rankings, 2009
Rank Countries
EFW Index,
20091 Hong Kong 9.012 Singapore 8.683 New Zealand 8.204 Switzerland 8.035 Australia 7.986 Canada 7.817 Chile 7.778 United Kingdom 7.719 Mauritius 7.67
10 United States 7.6011 Bahrain 7.5911 Finland 7.5913 Slovak Rep 7.5614 Unit. Arab Em. 7.5415 Denmark 7.5215 Estonia 7.5215 Hungary 7.5218 Cyprus 7.5119 Austria 7.5020 Luxembourg 7.4921 Germany 7.4522 Japan 7.4423 Panama 7.4124 Lithuania 7.4025 Ireland 7.3826 Taiwan 7.3727 Georgia 7.3628 Bulgaria 7.3428 Oman 7.3430 Albania 7.3230 Korea, South 7.3230 Netherlands 7.3233 Malta 7.3133 Peru 7.3135 Norway 7.3036 Mongolia 7.2937 Montenegro 7.2738 Zambia 7.2639 Sweden 7.2440 Bahamas 7.2241 Costa Rica 7.17
17
42 France 7.1643 Armenia 7.1543 Belgium 7.1543 El Salvador 7.1546 Czech Rep. 7.1347 Kuwait 7.1048 Romania 7.0849 Guatemala 7.0749 Jamaica 7.0751 Honduras 7.0652 Uganda 7.0153 Poland 7.0054 Spain 6.9954 Trinidad & Tob. 6.9956 Kazakhstan 6.9756 Kenya 6.9758 Belize 6.9559 Portugal 6.9360 Latvia 6.9261 Pap. New Guinea 6.9162 Jordan 6.9062 Uruguay 6.9064 Macedonia 6.8865 Thailand 6.8766 Namibia 6.8667 Haiti 6.8468 Botswana 6.8369 Nicaragua 6.8270 Ghana 6.8170 Iceland 6.8170 Italy 6.8170 Kyrgyz Republic 6.8174 Slovenia 6.7875 Mexico 6.7475 Turkey 6.7477 Fiji 6.7178 Dominican Rep. 6.6878 Malaysia 6.6880 Paraguay 6.5781 Greece 6.5581 Russia 6.5583 Israel 6.5384 Azerbaijan 6.5084 Barbados 6.5084 Indonesia 6.5087 South Africa 6.49

18
88 Vietnam 6.4889 Croatia 6.4689 Philippines 6.4691 Serbia 6.4492 China 6.4393 Egypt 6.4294 India 6.4094 Tunisia 6.4096 Madagascar 6.2996 Moldova 6.2996 Rwanda 6.2999 Bolivia 6.27
100 Bosnia and Herzegovina 6.23
101 Colombia 6.21102 Brazil 6.19103 Bangladesh 6.17103 Malawi 6.17105 Iran 6.16105 Morocco 6.16107 Nigeria 6.12107 Sri Lanka 6.12109 Lesotho 6.11110 Guyana 6.10111 Mauritania 6.05112 Ecuador 6.04112 Tanzania 6.04114 Pakistan 6.03115 Mali 5.98116 Cameroon 5.97117 Benin 5.96118 Burkina Faso 5.94119 Argentina 5.90120 Cote d'Ivoire 5.86121 Syria 5.83122 Gabon 5.82123 Togo 5.74124 Senegal 5.73125 Ukraine 5.70126 Ethiopia 5.62126 Sierra Leone 5.62128 Mozambique 5.53129 Nepal 5.50130 Niger 5.44131 Algeria 5.36132 Chad 5.32

19
133 Burundi 5.12134 Congo, Rep. Of 5.04135 Guinea-Bissau 5.03136 Central Afr. Rep. 4.88137 Congo, Dem. R. 4.84138 Angola 4.76139 Venezuela 4.28140 Myanmar 4.16141 Zimbabwe 4.08

20
Sources: Fraser Institute, Economic Freedom of the World; World Bank Group Entrepreneurship Snapshots Database, 2010. Note: New Firm Entry Density: Is the number of newly registered limited liability firms per 1,000 working-age people (those ages 15-64).
1.87
1.10
3.13
5.98
0.00
1.00
2.00
3.00
4.00
5.00
6.00
7.00
Least Free Third Second Most Free
New
fir
ms
per
1,0
00 w
ork
ing
age
pop
ula
tion
Economic Freedom Quartile
Exhibit 3: Economic Freedom and New Firm Entry Density

21
Sources: Fraser Institute, Economic Freedom of the World; Center for Entrepreneurship and Public Policy (CEPP) at George Mason University, Global Entrepreneurship and Development Index (GEDI), 2010. Note: The Global Entrepreneurship and Development Index (GEDI) comprises of three sub-indices on Entrepreneurial Attitudes, Entrepreneurial Activities and, Entrepreneurial Aspirations.
0.1800.232
0.285
0.478
0.000
0.100
0.200
0.300
0.400
0.500
0.600
Least Free Third Second Most Free
GED
I Index
Economic Freedom Quartile
Exhibit 4: Economic Freedom and Global Entrepreneurship & Development

22
Sources: Fraser Institute, Economic Freedom of the World; Legatum Institute, Legatum Prosperity Index™, 2012. Note: The Legatum Prosperity Index™ is a multidimensional composite index that provides an assessment of prosperity in 110 countries around the world. The Index uses 89 variables, which are statistically related to income and well-being, and categorizes them into eight fundamental pillars of prosperity (sub-indices).The Prosperity Index is the equally weighted average of the eight pillars of prosperity. We use the Entrepreneurship and Opportunity pillar or Sub-Index. The numbers used are simple averages of 2009 and 2010.
‐1.639‐1.129
‐0.059
2.394
‐2.000
‐1.500
‐1.000
‐0.500
0.000
0.500
1.000
1.500
2.000
2.500
LeastFree Third Second MostFree
Entrepreneurship&Opportunity
sub‐index
EconomicFreedomQuartile
Exhibit 5: Economic Freedom and Entrepreneurship & Opportunity

23
Sources: Fraser Institute, Economic Freedom of the World; World Economic Forum, Executive Opinion Survey. Note: Based on the question: “How easy or difficult is it to start a new business in your country? (1 = Very difficult; 7 = Very easy)” (Executive Opinion Survey).
3.7574.203 4.190
5.093
0.000
1.000
2.000
3.000
4.000
5.000
6.000
LeastFree Third Second MostFreeEas
ines
s of
sta
rtin
g b
usi
nes
s(1
= V
ery
dif
ficu
lt;
7 =
Ver
y ea
sy)
EconomicFreedomQuartile
Exhibit 6: Economic Freedon and Easiness of Starting a New Business

24
Sources: Fraser Institute, Economic Freedom of the World; World Economic Forum, Executive Opinion Survey. Note: Based on the question: “How easy is it to obtain a bank loan in your country with only a good business plan and no collateral? (1 = Very difficult; 7 = Very easy)” (Executive Opinion Survey).
2.466 2.5982.998
3.580
0.000
1.000
2.000
3.000
4.000
LeastFree Third Second MostFree
Eas
e of
Acc
ess
to L
oan
s (1
= V
ery
dif
ficu
lt;
7 =
Ver
y ea
sy)
EconomicFreedomQuartile
Exhibit 7: Economic Freedom and Ease of Access to Loans

25
Sources: Fraser Institute, Economic Freedom of the World; World Economic Forum, Executive Opinion Survey. Note: Based on the question: “In your country, how easy is it for entrepreneurs with innovative but risky projects to find venture capital? (1 = Very difficult; 7 = Very easy)” (Executive Opinion Survey).
2.338 2.4802.690
3.434
0.000
0.500
1.000
1.500
2.000
2.500
3.000
3.500
4.000
LeastFree Third Second MostFreeVen
ture
Cap
ital
Ava
ilab
ilit
y(1
= V
ery
dif
ficu
lt;
7 =
Ver
y ea
sy)
Economic Freedom
Exhibit 8: Economic Freedom and Venture Capital availability

26
References Al-Ubaydli, Omar, and Patrick McLaughlin. 2013. “RegData: A Numberical Database on
Industry-Specific Regulations for All U.S. Industries and Federal Regulations, 1997-2010.” George Mason University Mercatus Center Working Paper No. 12-20.
Benson, Bruce. 2004. “Opportunities Forgone: The Unmeasurable Costs of Regulation.” Journal
of Private Enterprise 19(2): 1-25. Bindas, Michael. 2010. L.A. vs. Small Business: City of Angels No Heaven for Entrepreneurs.
Institute for Justice City Study Series. Bjørnskov, Christian, and Nicolai J. Foss. 2008. “Economic Freedom and Entrepreneurial
Activity: Some Cross-Country Evidence.” Public Choice 134(3-4): 307-328. Bjørnskov, Christian, and Nicolai Foss. 2012. How Institutions of Liberty Promote
Entrepreneurship and Growth. In James Gwartney, Robert Lawson, and Joshua Hall (eds.) Economic Freedom of the World: 2012 Annual Report (Vancouver: Fraser Institute/Economic Freedom Network).
Campbell, Noel, and Tammy M. Rogers. 2007. “Economic Freedom and Net Business
Formation.” Cato Journal 27(1): 23-36. Frommer, Robert. 2010. Washington, DC vs. Entrepreneurs: DC’s Monumental Regulations
Stifle Small Businesses. Institute for Justice City Study Series. Gohmann, Stephan, Bradley Hobbs, and Myra McCrickard. 2008. “Economic Freedom and
Service Industry Growth in the United States.” Entrepreneurship Theory and Practice 32(5): 855-874.
Gohmann, Stephan, Bradley Hobbs, and Myra McCrickard. 2013. “Economic Freedom,
Entrepreneurial Activity, and the Service Sector.” Journal of Entrepreneurship and Public Policy 2(2): 144-159.
Gwartney, James, Robert Lawson, and Walter Block. 1996. Economic Freedom of the World:
1975-1995 (Vancouver: Fraser Institute/Economic Freedom Network). Gwartney, James, Robert Lawson, and Joshua Hall. 2014. Economic Freedom of the World:
2014 Annual Report (Vancouver: Fraser Institute/Economic Freedom Network). Hall, Joshua, and Robert Lawson. 2014. “Economic Freedom of the World: An Accounting of
the Literature.” Contemporary Economic Policy 32(1): 1-19. Hall, Joshua C., and Justin M. Ross. 2009. “New Empirical Estimates of Rent-Seeking: An
Update of Sobel and Garrett [2002].” Journal of Public Finance and Public Choice 27(2-3): 125-136.
27
Hall, Joshua, and Russell Sobel. 2008. “Institutions, Entrepreneurship, and Regional Differences in Economic Growth.” American Journal of Entrepreneurship 1(1): 69-96.
Hall, Joshua, Boris Nikolaev, John Pulito and Ben VanMetre, 2013. “Freedom and
Entrepreneurship: New Evidence from the States.” American Journal of Entrepreneurship 6(1): 85-99.
Holcombe, Randall. 2008. Entrepreneurship and Economic Growth. In Benjamin Powell (ed.)
Making Poor Nations Rich: Entrepreneurship and the Process of Economic Development. (Stanford: Stanford University Press).
Hottot, Wesley. 2010. Houston, We Have a Problem: Space City Regulations Prevent
Entrepreneurs from Taking Off. Institute for Justice City Study Series. Kreft, Steven, and Russell Sobel. 2005. “Public Policy, Entrepreneurship, and Economic
Freedom.” Cato Journal 25(3): 595-616. Llosa, Alvaro Vargas (ed.). 2008. Lessons from the Poor: Triumph of the Entrepreneurial Spirit.
Oakland, CA: Independent Institute. Milnikel, Elizabeth, and Emily Satterthwaite. 2010. Regulatory Field: Home of Chicago Laws.
Institute for Justice City Study Series. Nyström, Kristina. 2008. “The Institutions of Economic Freedom and Entrepreneurship:
Evidence from Panel Data.” Public Choice 136(3-4): 269-282. Sanandaji, Tino, and Peter T. Leeson. 2013. “Billionaires.” Industrial and Corporate Change
22(1): 313-337. Sobel, Russell S.. 2008. “Testing Baumol: Institutional Quality and the Productivity of
Entrepreneurship.” Journal of Business Venturing 23(6): 641-655. Sobel, Russell S., and Thomas A. Garrett. 2002. “On the Measurement of Rent Seeking and its
Social Opportunity Cost.” Public Choice 112(1-2): 115-136. Stansel, Dean. 2013. “An Economic Freedom Index for US Metropolitan Areas.” Journal of
Regional Analysis and Policy 43(1): 3-20. VanMetre, Benjamin J., and Joshua C. Hall. 2011. “How Friendly to Entrepreneurs are" Business
Friendly" Policies? Some Preliminary Results.” Journal of Business and Economic Perspectives 37(1), 105-116.
Wiseman, Travis, and Andrew T. Young. 2013. “Economic Freedom, Entrepreneurship, and
Income Levels: Some US State-level Empirics.” American Journal of Entrepreneurship 6(1): 100-119.
Notes
28
1 For a discussion of the differences between Kizner and Schumpeter in this context see Holcombe (2008). 2 Source: http://www.sba.gov/about-sba-services/what-we-do. 3 Source: http://www.doingbusiness.org/data/exploretopics/trading-across-borders. 4 Source: http://www.wto.org/english/res_e/booksp_e/tariff_profiles11_e.pdf. 5 Sources: http://www.doingbusiness.org/data/exploretopics/dealing-with-construction-permits and http://www.doingbusiness.org/data/exploretopics/getting-electricity. 6 The first edition of the EFW index was authored by Gwartney, Lawson and Block (1996). Much of this section is drawn, with permission from the publisher, from Chapter 1 of the EFW annual report (various years). Complete details on the EFW index are available at http://www.freetheworld.com. 7 For a survey of the existing economic freedom-entrepreneurship literature see, Bjørnskov and Foss (2012). For an accounting of the literature that uses the Economic Freedom of the World index see Hall and Lawson (2014). 8Perhaps this is why many so-called “pro-business” policies do not seem to related to measures of formal entrepreneurship in the United States (VanMetre and Hall 2011).