121119-IEEA12285-TOC-Global Semiconductor Industry · PDF file• Global semiconductor...
8
Lucintel http://www.marketresearch.com/Lucintel-v2747/ Publisher Sample Phone: 800.298.5699 (US) or +1.240.747.3093 or +1.240.747.3093 (Int'l) Hours: Monday - Thursday: 5:30am - 6:30pm EST Fridays: 5:30am - 5:30pm EST Email: [email protected] MarketResearch.com
Transcript of 121119-IEEA12285-TOC-Global Semiconductor Industry · PDF file• Global semiconductor...

Lucintel http://www.marketresearch.com/Lucintel-v2747/
Publisher Sample
Phone: 800.298.5699 (US) or +1.240.747.3093 or +1.240.747.3093 (Int'l) Hours: Monday - Thursday: 5:30am - 6:30pm EST
Fridays: 5:30am - 5:30pm EST
Email: [email protected] MarketResearch.com

Global Semiconductor Industry 2012-2017: Trend, Profit, and Forecast Analysis
Lucintel, a premier global management consulting and market research firm creates your equation for growth — whether you need to understand market dynamics, identify new opportunities, or increase your profitability.
Publication Date October 2012

2
Global Semiconductor Industry 2012-2017: Trend, Profit , and Forecast Analysis
Background: The global semiconductor industry is expected to witness a CAGR of 4.3% over the next five years and reach an estimated $394 billion in 2017. Global macroeconomic developments and technological advances, personal computers, and memory markets are expected to drive demand over the forecast period. Lucintel, a leading global management consulting and market research firm, has analyzed the global semiconductor industry and presents its findings in “Global Semiconductor Industry 2012-2017: Trend, Profit, and Forecast Analysis .” The industry consists of establishments primarily engaged in the manufacturing and selling of semiconductors. The global semiconductor industry is a fragmented market. The Asia Pacific (APAC) region dominates this market and represents approximately three-fourths of the global market. Some of the major players include Intel Corporation, Samsung Electronics, Taiwan Semiconductor, Texas Instruments, and Toshiba Corporation. The combination of factors such as continuing transfer of worldwide electronic equipment production to China and the above-average semiconductor content of that equipment influences market dynamics tremendously. As indicated in the study, there is increasing demand for semiconductors from the BRIC (Brazil, Russia, India, and China) economies due to increasing end-use electronic product demand. The demand for laptops, notebooks, and tablet computers has overtaken the demand for desktop computers due to their advantages such as low cost, portability, and variety. Some of the industry challenges include the economic cycle, which may have the strongest negative influence on semiconductor industry growth. The Rest of the World is the emerging market for the industry due to the increase in the growth of automotive and consumer electronics and huge opportunities in developing countries. Lucintel’s report provides an overview of the global semiconductor industry, tracking two market segments of the industry in four geographic regions. Thus, eight segments of the global semiconductor industry are tracked. The report studies manufacturers of integrated circuit segment and optoelectronic-sensor-discrete segment, providing a five-year annual trend analysis that highlights market size, profit and cost structure for North America, Europe, APAC, and ROW. The report also provides forecast, addressing market opportunities for next five years for each of these regions.
This comprehensive guide from Lucintel provides readers with valuable information and the tools needed to successfully drive critical business decisions with a thorough understanding of the market’s potential. This report will save Lucintel clients hundreds of hours in personal research time on a global market and it offers significant benefits in expanding business opportunities throughout the global semiconductor industry analysis. In a fast-paced ever-changing world, business leaders need every advantage available to them in a timely manner to drive change in the market and to stay ahead of their competition. This report provides business leaders with a keen advantage in this regard by making them aware of emerging trends and demand requirements on an annual basis.
Features and Scope of this Report: To make any investment or strategic decision, you need adequate and timely information. This market report fulfills this core need. Some of the features of this market report are:
3
Global Semiconductor Industry 2012-2017: Trend, Profit , and Forecast Analysis
• Industry size estimates in terms of (US $) value by regions and segments • Global semiconductor industry analysis annual trend (2006-2011) and forecast (2012-
2017) • Porter’s Five Force analysis • New product launch and merger and acquisition activity in global semiconductor industry
analysis • Quarterly demand trend (Q1 2010-Q4 2011) and forecast analysis (Q1 2012-Q4 2013) for
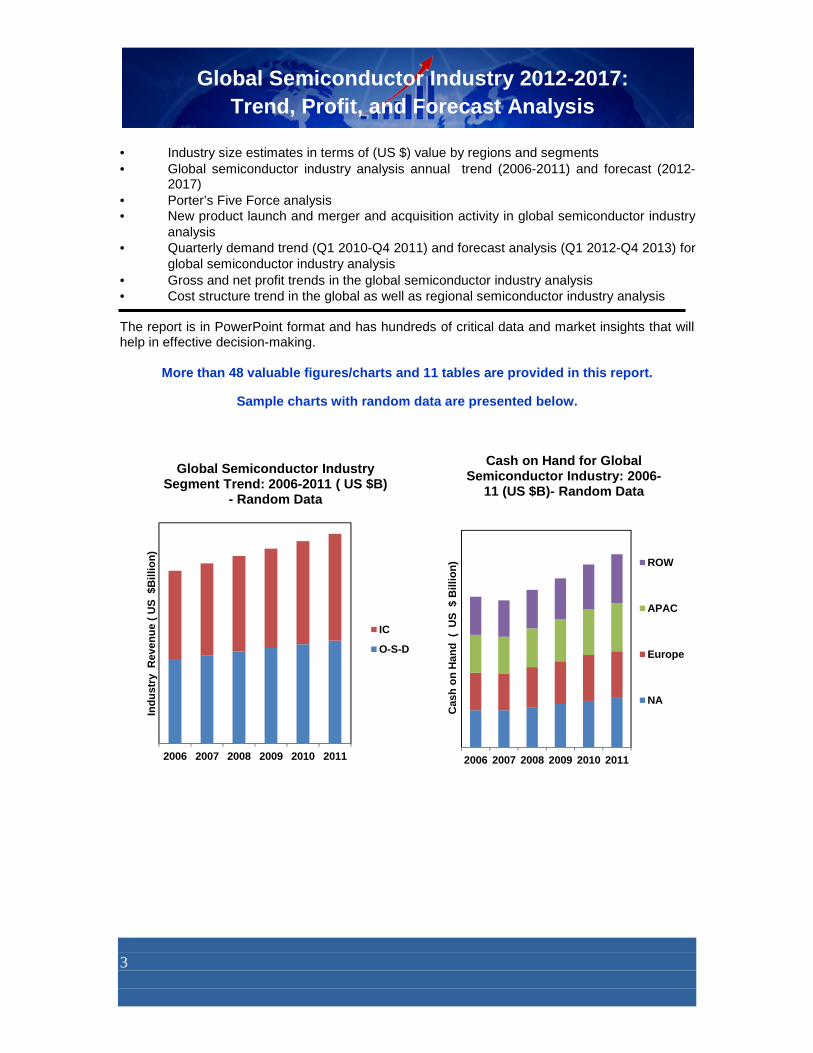
global semiconductor industry analysis • Gross and net profit trends in the global semiconductor industry analysis • Cost structure trend in the global as well as regional semiconductor industry analysis The report is in PowerPoint format and has hundreds of critical data and market insights that will help in effective decision-making.
More than 48 valuable figures/charts and 11 tables a re provided in this report.
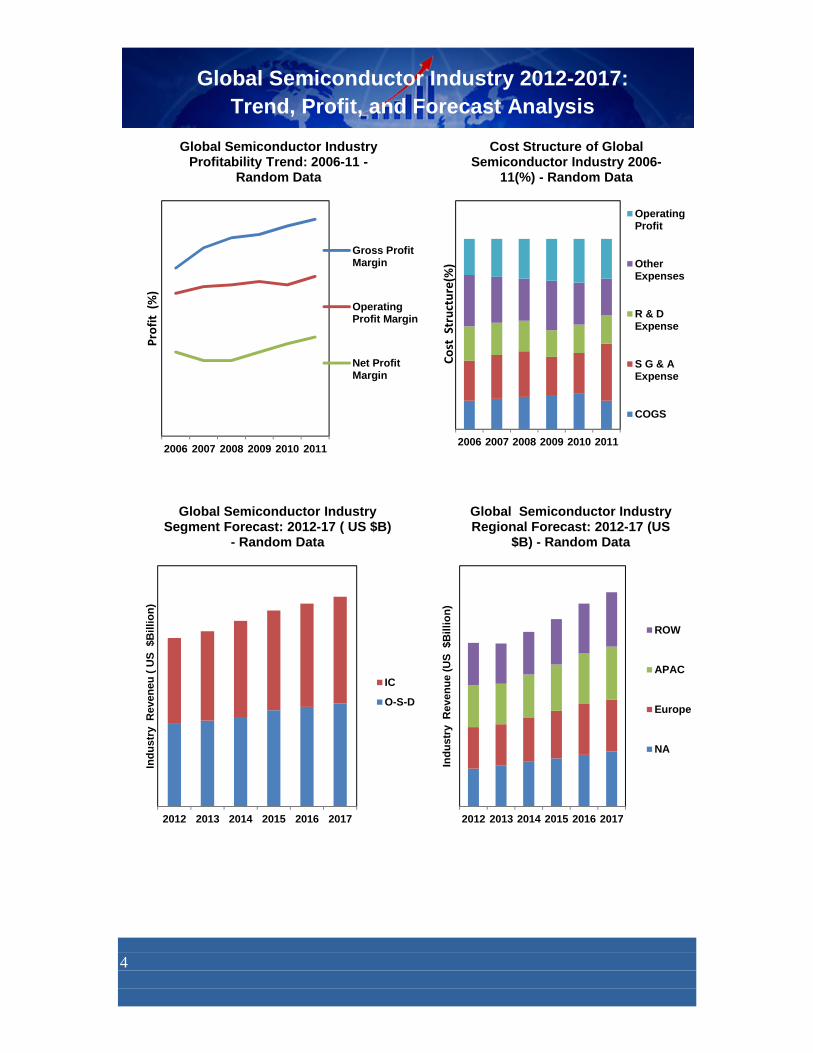
Sample charts with random data are presented below.
2006 2007 2008 2009 2010 2011
Indu
stry
Rev
enue
( U
S $
Bill
ion)
Global Semiconductor Industry Segment Trend: 2006-2011 ( US $B)
- Random Data
IC
O-S-D
2006 2007 2008 2009 2010 2011
Cas
h on
Han
d (
US
$ B
illio
n)Cash on Hand for Global
Semiconductor Industry: 2006-11 (US $B)- Random Data
ROW
APAC
Europe
NA
4
Global Semiconductor Industry 2012-2017: Trend, Profit , and Forecast Analysis
2006 2007 2008 2009 2010 2011
Pro
fit
(%
)Global Semiconductor Industry
Profitability Trend: 2006-11 -Random Data
Gross ProfitMargin
OperatingProfit Margin
Net ProfitMargin
2006 2007 2008 2009 2010 2011C
ost
S
tru
ctu
re(%
)
Cost Structure of Global Semiconductor Industry 2006-
11(%) - Random Data
OperatingProfit
OtherExpenses
R & DExpense
S G & AExpense
COGS
2012 2013 2014 2015 2016 2017
Indu
stry
Rev
eneu
( U
S $
Bill
ion)
Global Semiconductor Industry Segment Forecast: 2012-17 ( US $B)
- Random Data
IC
O-S-D
2012 2013 2014 2015 2016 2017
Indu
stry
Rev
enue
(U
S $
Bill
ion)
Global Semiconductor Industry Regional Forecast: 2012-17 (US
$B) - Random Data
ROW
APAC
Europe
NA

5
Global Semiconductor Industry 2012-2017: Trend, Profit , and Forecast Analysis
Global Semiconductor Industry: Porter’s Five Forces Analysis Random Data
CA
GR
(%
) : 2
012-
17
Gross Profit in US $M
Global Semiconductor Industry Opportunities by Region - Random Data
North America
Europe
Asia
Rest of World
Threat of Substitutes
• U
• V
• W
Threat of New Entrants
• A
• B
Competitive Rivalry
• D
• E
•
Supplier Power
• X
• Y
Buyer Power
• P
• Q

11
Global Semiconductor Industry 2012-2017: Trend, Profit , and Forecast Analysis
Table of Contents 1. Executive Summary
2. Industry Definition and Scope
3. Industry Overview
4. Global Macroeconomic Overview
5. Industry Trends
6. Industry Forecasts
7. Emerging Trends
8. Conclusions
List of Figures Chapter 3. Industry Overview
Figure 3.1: External forces shaping global semiconductor industry Chapter 4. Global Macroeconomic Overview
Figure 4.1: Global GDP growth rate trend Figure 4.2: Global inflation rate trend Figure 4.3: Global population growth rate trend Figure 4.4: Global unemployment rate trend Figure 4.5: Regional GDP growth rate trend Figure 4.6: Regional inflation rate trend Figure 4.7: Regional population growth rate trend Figure 4.8: Regional unemployment rate trend
Chapter 5. Industry Trends
Figure 5.1: Global semiconductor industry annual trend 2006-11 (US $B) Figure 5.2: Global semiconductor industry regional trend 2006-11 (US $B) Figure 5.3: Global semiconductor industry regional trend 2006-11 (%) Figure 5.4: Global semiconductor industry segment trend 2006-11 (US $B) Figure 5.5: Global semiconductor industry segment trend 2006-11 (%) Figure 5.6: Global semiconductor industry quarterly trend 2010-11 (US $B) Figure 5.7: Global semiconductor industry profitability trend 2006-11 Figure 5.8: Global semiconductor industry revenue per employee Trend 2006-11 Figure 5.9: Cost structure of global semiconductor industry 2006-11 Figure 5.10: Cost structure in North American semiconductor industry 2006-11 Figure 5.11: Cost structure in European semiconductor industry 2006-11 Figure 5.12: Cost structure in Asia Pacific semiconductor industry 2006-11 Figure 5.13: Top 5 companies vs. cell phone gross profit & net profit analysis 2011 Figure 5.14: Cash on hand for global semiconductor industry 2006-11 (US $B) Figure 5.15: Cash on hand for global semiconductor industry 2006-11 (%) Figure 5.16: Asset for global semiconductor industry 2006-11 (US $B) Figure 5.17: Assets for global semiconductor industry 2006-11 (%)
12
Global Semiconductor Industry 2012-2017: Trend, Profit , and Forecast Analysis
Figure 5.18: Debt for global semiconductor industry 2006-11 (US $B) Figure 5.19: Debt for global semiconductor industry 2006-11 (%) Figure 5.20: Industry shares of top players in global semiconductor industry in 2006 Figure 5.21: Industry shares of top players in global semiconductor industry in 2011 Figure 5.22: Global semiconductor industry 2006 market share analysis
Figure 5.23: Global semiconductor industry 2011 market share analysis Chapter 6. Industry Forecasts
Figure 6.1: Global semiconductor industry annual forecast 2012-17 (US $B) Figure 6.2: Global semiconductor industry quarterly forecast 2011-12 (US $B) Figure 6.3: Global GDP growth rate forecast Figure 6.4: Global inflation rate forecast Figure 6.5: Global population growth rate forecast Figure 6.6: Global unemployment rate forecast Figure 6.7: Regional GDP growth rate forecast Figure 6.8: Regional inflation rate forecast Figure 6.9: Regional population growth rate forecast Figure 6.10: Regional unemployment rate forecast Figure 6.11: Global semiconductor industry regional forecast 2012-17 (US $B) Figure 6.12: Global semiconductor industry regional forecast 2012-17 (%)
Figure 6.13: Global semiconductor industry segment forecast 2012-17 (US $B) Figure 6.14: Global semiconductor industry segment forecast 2012-17 (%)
Chapter 7. Emerging Trends Figure 7.1: Global semiconductor industry opportunity by region Figure 7.2: Global semiconductor industry opportunity by segment
List of Tables
Chapter 3. Industry Overview
Table 3.1: Industry parameters of global cell phone industry Table 3.2: Relative industry attractiveness by region
Chapter 5. Industry Trends Table 5.1: Regional revenue growth rate Table 5.2: Segment revenue growth rate Table 5.3: Percentage change in cost structure Table 5.4: Percentage change in cash on hand Table 5.5: Percentage change in total asset Table 5.6: Percentage change in total debt Table 5.7: Key companies by revenue growth Table 5.8: Key companies by revenue decline
Chapter 6. Industry Forecasts
Table 6.1: Global cell phone regional forecast growth rate