120 U.S. Fish and Wildlife Service - Pacific Region …...from 0.0 (high hatchery influence, low...
82
120 Columbia River Basin Hatchery Review Team Columbia River Basin, Mountain Snake Province Clearwater and Salmon River Watersheds Dworshak, Kooskia and Hagerman National Fish Hatcheries Clearwater, Magic Valley, McCall, and Sawtooth Fish Hatcheries (Idaho Department of Fish & Game) Assessments and Recommendations Final Report, Appendix A: All-H Analyzer (AHA) Output for Salmon and Steelhead Stocks March 2011 U.S. Fish and Wildlife Service - Pacific Region
Transcript of 120 U.S. Fish and Wildlife Service - Pacific Region …...from 0.0 (high hatchery influence, low...
120
Columbia River Basin Hatchery Review Team
Columbia River Basin, Mountain Snake Province
Clearwater and Salmon River Watersheds
Dworshak, Kooskia and Hagerman National Fish Hatcheries
Clearwater, Magic Valley, McCall, and Sawtooth Fish Hatcheries
(Idaho Department of Fish & Game)
Assessments and Recommendations
Final Report, Appendix A:
All-H Analyzer (AHA) Output for Salmon and Steelhead Stocks
March 2011
U.S. Fish and Wildlife Service - Pacific Region

Please cite as:
U.S. Fish and Wildlife Service (USFWS). 2011. Dworshak, Kooskia, and Hagerman National Fish
Hatcheries and Clearwater, Magic Valley, McCall, and Sawtooth State Fish Hatcheries Assessments
and Recommendations - Appendix A: All-H Analyzer (AHA) Output for Salmon and Steelhead Stocks.
Final Report, March 2011. Hatchery Review Team, Pacific Region. U.S. Fish and Wildlife Service,
Portland, Oregon. Available at: http://www.fws.gov/Pacific/fisheries/Hatcheryreview/reports.html.
USFWS Columbia Basin Hatchery Review Team Lower Snake Federal Hatcheries Assessments and Recommendations Reports–March 2011
Appendix A – AHA Output 3
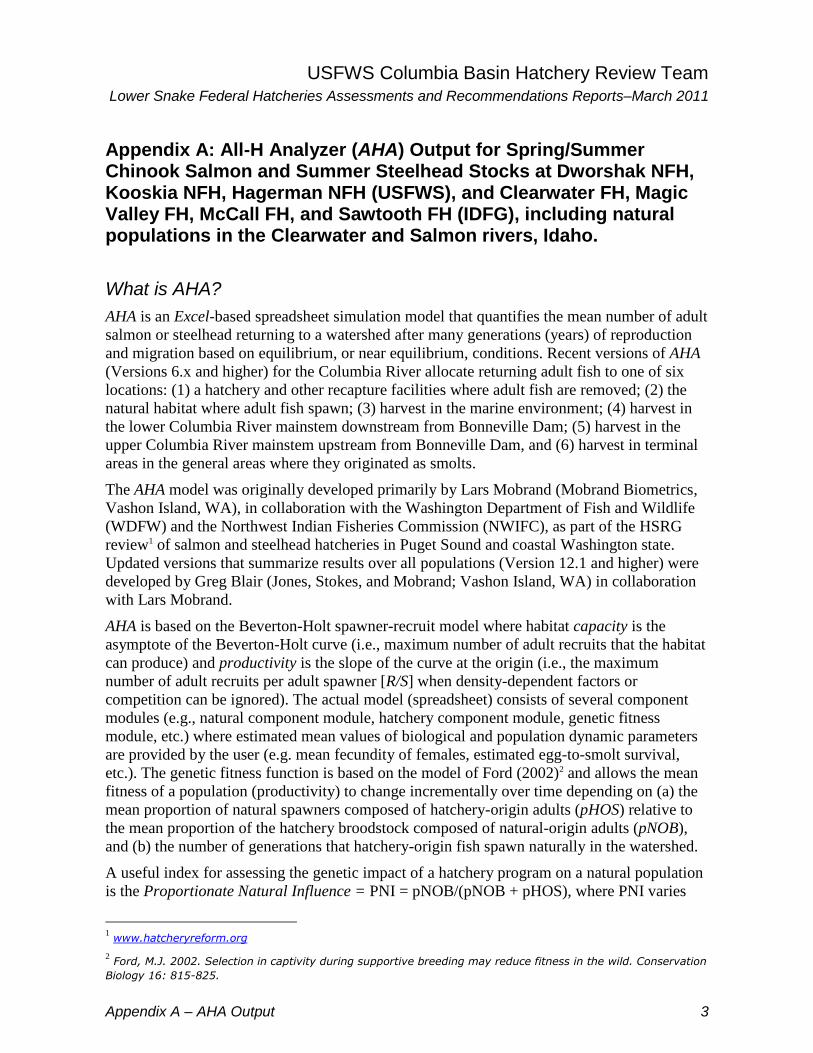
Appendix A: All-H Analyzer (AHA) Output for Spring/Summer Chinook Salmon and Summer Steelhead Stocks at Dworshak NFH, Kooskia NFH, Hagerman NFH (USFWS), and Clearwater FH, Magic Valley FH, McCall FH, and Sawtooth FH (IDFG), including natural populations in the Clearwater and Salmon rivers, Idaho.
What is AHA?
AHA is an Excel-based spreadsheet simulation model that quantifies the mean number of adult
salmon or steelhead returning to a watershed after many generations (years) of reproduction
and migration based on equilibrium, or near equilibrium, conditions. Recent versions of AHA
(Versions 6.x and higher) for the Columbia River allocate returning adult fish to one of six
locations: (1) a hatchery and other recapture facilities where adult fish are removed; (2) the
natural habitat where adult fish spawn; (3) harvest in the marine environment; (4) harvest in
the lower Columbia River mainstem downstream from Bonneville Dam; (5) harvest in the
upper Columbia River mainstem upstream from Bonneville Dam, and (6) harvest in terminal
areas in the general areas where they originated as smolts.
The AHA model was originally developed primarily by Lars Mobrand (Mobrand Biometrics,
Vashon Island, WA), in collaboration with the Washington Department of Fish and Wildlife
(WDFW) and the Northwest Indian Fisheries Commission (NWIFC), as part of the HSRG
review1 of salmon and steelhead hatcheries in Puget Sound and coastal Washington state.
Updated versions that summarize results over all populations (Version 12.1 and higher) were
developed by Greg Blair (Jones, Stokes, and Mobrand; Vashon Island, WA) in collaboration
with Lars Mobrand.
AHA is based on the Beverton-Holt spawner-recruit model where habitat capacity is the
asymptote of the Beverton-Holt curve (i.e., maximum number of adult recruits that the habitat
can produce) and productivity is the slope of the curve at the origin (i.e., the maximum
number of adult recruits per adult spawner [R/S] when density-dependent factors or
competition can be ignored). The actual model (spreadsheet) consists of several component
modules (e.g., natural component module, hatchery component module, genetic fitness
module, etc.) where estimated mean values of biological and population dynamic parameters
are provided by the user (e.g. mean fecundity of females, estimated egg-to-smolt survival,
etc.). The genetic fitness function is based on the model of Ford (2002)2 and allows the mean
fitness of a population (productivity) to change incrementally over time depending on (a) the
mean proportion of natural spawners composed of hatchery-origin adults (pHOS) relative to
the mean proportion of the hatchery broodstock composed of natural-origin adults (pNOB),
and (b) the number of generations that hatchery-origin fish spawn naturally in the watershed.
A useful index for assessing the genetic impact of a hatchery program on a natural population
is the Proportionate Natural Influence = PNI = pNOB/(pNOB + pHOS), where PNI varies
1 www.hatcheryreform.org
2 Ford, M.J. 2002. Selection in captivity during supportive breeding may reduce fitness in the wild. Conservation
Biology 16: 815-825.

USFWS Columbia Basin Hatchery Review Team Lower Snake Federal Hatcheries Assessments and Recommendations Reports–March 2011
4 Appendix A – AHA Output
from 0.0 (high hatchery influence, low natural environmental influence) to 1.0 (no hatchery
influence). When pHOS = pNOB, the hatchery and natural environments will have
approximately equal influence on the genetic constitutions of both hatchery and wild fish, and
PNI = 0.5. For integrated hatchery populations and natural stocks, the goal is for PNI to be
greater than 0.5 and as close to 1.0 as possible (e.g., > 0.67) as a long-term goal.
The AHA model is currently being used by fishery comanagers in the Pacific Northwest as a
“planning tool” to (a) document assumptions and parameters for hatchery and natural
populations and (b) compare the outcomes of alternative management strategies and
scenarios. Only those scenarios achieving realistic or desired outcomes are considered valid.
For example, any scenario that results in extirpation of a stock is considered invalid, where
any or all of the four H’s3 can contribute to stock extirpation.
For more detail on AHA, see the “Tools” page of the Hatchery Scientific Review Group’s
(HSRG’s) website: http://www.hatcheryreform.us. An AHA user’s guide, the AHA model, and
all AHA datasets for the Columbia River Basin are available for download. See also “HSRG
White Paper No. 1” under the publications page for theoretical details regarding PNI and the
relative effects of the hatchery and natural environments on mean population fitness.
Explanation of Tables A1-A564
Information in the following AHA output tables (Tables A1-A56) is intended to provide a
summary “snapshot” of the potential equilibrium outcomes associated with current hatchery
programs and alternatives considered by the Hatchery Review Team. Five sets of simulations
or scenarios are presented in each table: (a) current situation and hatchery programs; (b) the
potential “no hatchery” condition; (c) the “hatchery solution” proposed by the HSRG; and (d)
two alternative scenarios proposed by the HRT. AHA version 13.2.1 was used to generate the
outputs in Tables A1-A56.
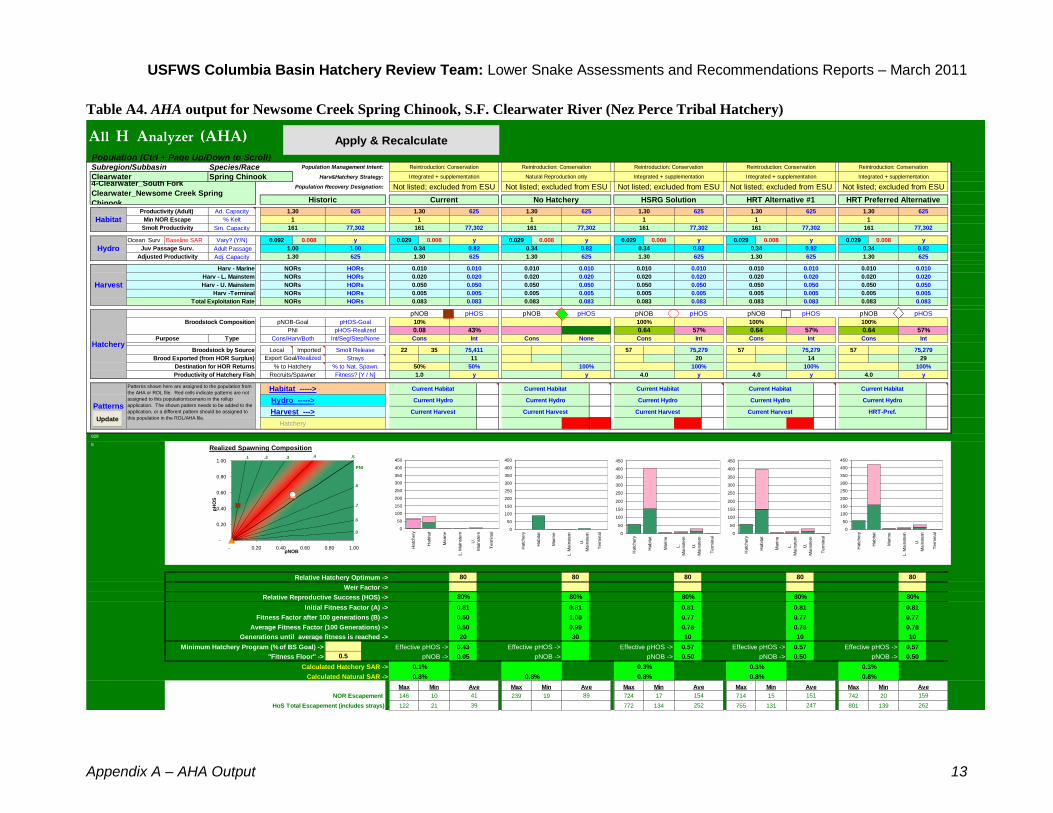
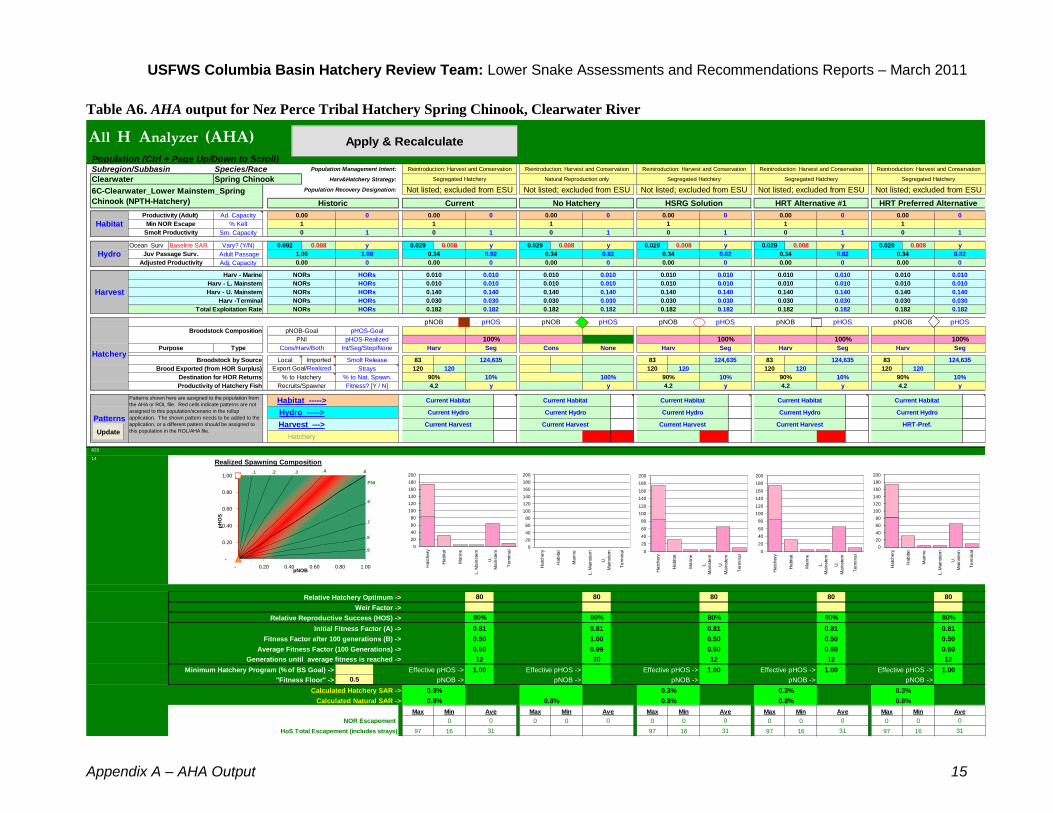
Output of AHA is displayed in a series of colored bar graphs representing the equilibrium,
mean numbers of adult fish (recruits) allocated to each of the six aforementioned locations
(hatchery, freshwater habitat, and four harvest locations). In those bar graphs, solid green
represents natural-origin fish; solid pink represents hatchery-origin fish, pink diagonal hash
bars represent hatchery-origin fish in excess of comanager goals, and pink vertical bars
represent hatchery-origin fish that have been selected at least one generation in the natural
environment (e.g. as occurs in a genetically-integrated hatchery program).
The graph in the lower-left portion of each table shows the realized mean values of pNOB and
pHOS for each of the five scenarios (Current, No Hatchery, etc.). The diagonal lines represent
combination values of pNOB and pHOS that yield the same value of PNI. Symbols on the PNI
graph correspond with each of the scenarios shown as bar graphs (see also the Components of
3 Habitat, Harvest, Hydropower, and Hatcheries are commonly referred to as the “four H’s”.
4 Parameter estimates used to generate the following tables have not all been verified and should be considered
preliminary. However, their values are based on the best information available, and the general results presented in the following tables are not expected to change significantly as the parameter estimates are verified and updated.

USFWS Columbia Basin Hatchery Review Team Lower Snake Federal Hatcheries Assessments and Recommendations Reports–March 2011
Appendix A – AHA Output 5
this Report section for definitions of biological significance, population viability, habitat, and
harvest ratings).
The outputs presented in Tables A1-A56 are intended to be viewed electronically on a
desktop computer where portions of the tables can be “zoomed in” for clarity. The Review
Team acknowledges that those tables are difficult to read as printed paper copies.
AHA data files in V.13.2.1 are stored as “roll-up” files for all populations of each salmonid
species in the Columbia River Basin. The specific parameterized versions of the “roll-up”
files and AHA (V.13.2.1) used to generate the outputs in Tables A1-A56 are available upon
request from the Chair of the Hatchery Review Team. Some familiarity with AHA is required,
and expected, before implementing the software. The software and baseline data files for
Tables A1-A56 can be downloaded from the HSRG website under the “Tools” tab at
www.hatcheryreform.us.

USFWS Columbia Basin Hatchery Review Team Lower Snake Federal Hatcheries Assessments and Recommendations Reports–March 2011
6 Appendix A – AHA Output
Tables A1-A9: AHA outputs for the Clearwater River Major Population
Group (MPG) of spring-summer Chinook salmon

USFWS Columbia Basin Hatchery Review Team Lower Snake Federal Hatcheries Assessments and Recommendations Reports–March 2011
Appendix A – AHA Output 7
Parameters and assumptions for spring/summer Chinook in the Clearwater River Major Population Group (MPG) Productivity and survival parameters for hatchery origin spring Chinook within the Clearwater River
basin (Table 1A) were obtained from the HSRG, as provided by Idaho Department of Fish and Game
(IDFG).
Table 1A. Mean values of reproductive and survival parameters assumed in the AHA analyses
for hatchery-origin spring/summer Chinook released within the Clearwater River MPG.
Hatchery/
Release location
Population/Stock
Female
Fecundity
(No. of
eggs)
Within-
hatchery
survival
(egg-to-
smolt)
Post-release
survival (%)
(smolt-to-adult)
Recruit/spawner
(R/S; adults)
Dworshak NFH
Dworshak NFH Spring
Chinook
4,500
0.79
0.58%
7.0
Kooskia NFH
Kooskia NFH Spring
Chinook
4,500
0.79
0.58%
7.0
Clearwater FH/
Powell Satellite, Lochsa
River
Lochsa River Spring
Chinook
4,200
0.90
0.44%
6.0
Clearwater FH, NPTH/
Lower Selway River,
Lochsa River Spring
Chinook
4,500
Smolts = 0.79
Parr = 0.85
Smolts = 0.26%
Smolt+parr=0.14%
Smolts = 3.2
Parr = 0.7
Clearwater Hatchery/
Upper Selway River,
Lochsa River Spring
Chinook
4,500
Parr = 0.85
Parr = 0.07%
Parr = 0.9
Clearwater Hatchery/
Crooked and Red River
Satellites
S.F. Clearwater R. Spring
Chinook
4,200
0.70
0.37%
4.0
Nez Perce Tribal Hatchery
NPTH Spring Chinook
4,500
0.79
0.35%
4.2
Nez Perce Tribal Hatchery/
Newsome Creek
Newsome Creek Spring
Chinook
4,200
Smolts = 0.70
Pre-smolts =
0.79
Smolts = 0.37%
Pre-smolts= 0.09%
Smolts = 4.0
Pre-smolts = 1.0
Nez Perce Tribal Hatchery/
Lolo Creek
Lolo Creek Spring Chinook
4,500
Smolts = 0.70
Pre-smolts =
0.79
Smolts = 0.37%
Pre-smolts= 0.08%
Smolts = 4.0
Pre-smolts = 1.0

USFWS Columbia Basin Hatchery Review Team Lower Snake Federal Hatcheries Assessments and Recommendations Reports–March 2011
8 Appendix A – AHA Output
Current programs, HSRG solutions, and HRT alternatives
The HRT modeled Alternative 1 (current hatchery programs with implementation of all HRT
recommendations) and the Team’s preferred alternatives for each of the spring Chinook hatchery
programs conducted within the Clearwater River basin. Each population release site consists of five
scenarios: Current program, No Hatchery scenario, HSRG Solution, HRT Alternative 1, and the HRT
Preferred Alternative (Table 2A). The HRT Preferred Alternative assumes that reestablishment of
naturally spawning populations is the principal short-term goal of spring Chinook hatchery programs
in the Lochsa, Selway, and upper South Fork Clearwater rivers.

USFWS Columbia Basin Hatchery Review Team Lower Snake Federal Hatcheries Assessments and Recommendations Reports–March 2011
Appendix A – AHA Output 9
Table 2A. Summary of the number of hatchery-origin (HOR) spring Chinook smolts, pre-smolts, and parr released in the Clearwater River
under four strategies modeled in AHA Tables A1-A9: (1) Current programs are based on the LSRCP Cooperators 2008 Annual Operating
Plan for the Clearwater River, (2) the HSRG Solution, (3) HRT Alternative 1 (current programs with implementation of HRT
recommendations), and (4) the HRT Preferred Alternative which emphasizes reestablishment of naturally spawning populations in the
Lochsa, Selway, and upper S.F. Clearwater rivers and emphasizes harvest in the mainstem Clearwater River. The names of hatchery
stocks/populations are in italics (e.g., “Dworshak”, “Kooskia”, etc.) and are identified by the facility/location where adults are trapped for
broodstock. The Hatchery Review Team did not specifically review programs associated with the Nez Perce Tribal Hatchery (e.g., Lolo
Creek, Newsome Creek), but the AHA outputs for those programs are presented here as part of the data set packages available from the
HSRG (www.hatcheryreform.us).
Release location
Current
HSRG Solution
HRT Alternative 1
HRT Preferred Alternative
Dworshak NFH,
N.F. Clearwater River
(AHA Table A1)
1.05 M Dworshak smolts
No recommendation
(same as Current)
Same as current
1.45M Dworshak smolts
Kooskia NFH,
Clear Creek
(AHA Table A2)
600K Kooskia smolts
No recommendation
(same as Current)
500K Kooskia smolts
Terminate on-station rearing;
600K Kooskia smolts reared at
Clearwater Hatchery.
S.F. Clearwater River,
Red and Crooked rivers
(AHA Table A3)
1.1M SF Clearwater smolts
No recommendation
(same as Current)
Same as Current
300K Red/Crooked R. smolts
(pNOB = 0.67)
Newsome Creek
(AHA Table A4) 30K Newsome Cr. pre-smolts
45K NPTH pre-smolts
75K Newsome Cr. smolts
(pNOB = 1.0)
No recommendation
(Same as HSRG)
No recommendation
(Same as HSRG)
Lolo Creek
(AHA Table A5) 85K Lolo Cr. pre-smolts
65K NPTH pre-smolts
100K Lolo Cr. smolts
(pNOB = 1.0)
No recommendation
(Same as HSRG)
No recommendation
(Same as HSRG)
Nez Perce Tribal
Hatchery (NPTH)
(AHA Table A6)
125K NPTH smolts
No recommendation
(same as Current)
No recommendation
(same as Current)
No recommendation
(same as Current)
Lochsa River at Powell
Pond (AHA Table A7)
400K Lochsa smolts
700K Lochsa smolts
400K Lochsa smolts
300K Lochsa smolts
(pNOB = 0.75)
Lower Selway River,
including Meadow Cr.
(AHA Table A8)
300K Lochsa smolts
400K Dworshak parr (released
into Meadow Creek)
No recommendation
(same as Current)
300K Lochsa smolts
200K Lochsa smolts
Upper Selway River
(AHA Table A9)
300K Lochsa parr
100K Selway smolts
(pNOB = 1.0)
300K Lochsa parr
200K Lochsa parr

USFWS Columbia Basin Hatchery Review Team: Lower Snake Assessments and Recommendations Reports – March 2011
10 Appendix A – AHA Output
Table A1. AHA output for Dworshak NFH spring Chinook, North Fork Clearwater River
Population (Ctrl + Page Up/Down to Scroll)Species/Race Population Management Intent:
Harv&Hatchery Strategy:
Population Recovery Designation:
Ad. Capacity
% Kelt
Sm. Capacity
Ocean Surv Baseline SAR Vary? (Y/N) 0.092 0.008 0.029 0.008 0.029 0.008 0.029 0.008 0.029 0.008 0.029 0.008
Adult Passage
Adj. Capacity
Harv - Marine
Harv - L. Mainstem
Harv - U. Mainstem
Harv -Terminal
Total Exploitation Rate
Broodstock Composition
Type
Local Imported 700 700 700 966
266 266 266 266
Destination for HOR Returns
Productivity of Hatchery Fish
443
13Realized Spawning Composition
Relative Hatchery Optimum -> 80 80 80 80 80
Weir Factor ->
Relative Reproductive Success (HOS) -> 80% 80% 80% 80% 80%
Initial Fitness Factor (A) -> 0.81 0.81 0.81 0.81 0.81
Fitness Factor after 100 generations (B) -> 0.50 1.00 0.50 0.50 0.50
Average Fitness Factor (100 Generations) -> 0.50 0.99 0.50 0.50 0.50
Generations until average fitness is reached -> 12 30 12 12 12
Minimum Hatchery Program (% of BS Goal) -> Effective pHOS -> 1.00 Effective pHOS -> Effective pHOS -> 1.00 Effective pHOS -> 1.00 Effective pHOS -> 1.00
"Fitness Floor" -> 0.5 pNOB -> pNOB -> pNOB -> pNOB -> pNOB ->
Calculated Hatchery SAR ->
Calculated Natural SAR ->
Max Min Max Min Max Min Max Min Max Min
NOR Escapement 0 0 0 0 0 0 0 0 0 0
HoS Total Escapement (includes strays) 979 170 979 170 979 170 1,351 234
All H Analyzer (AHA)
Harvest --->
Hatchery
7.0
0
Current
0.01 0 00.01
No Hatchery
Segregated Hatchery
0.01
Not listed; excluded from ESU
1
0
y
0.82
Current Habitat
0
Ave
0.8%
0.413
pHOS
320
0.8%
10%
Current Hydro
Current Harvest
Ave
y
HORs
HORs
0.010
HORs
0.005
HORs
0.010
0.080
0.080
0.300
Hydro
Harvest
NORs
NORs
0.01Adjusted Productivity
NORs
Juv Passage Surv.
NORs
NORs
0.050
pHOS
0.050
0.083
0.005
0.413
pNOB
0.083
1
0.020
0.34
0.01
0.020
HORs 0.010
1
11
6B-NF Clearwater_Spring Chinook
(Dworshak-Hatchery)
y
1
Historic
1
0.01 0
1
Productivity (Adult)
Min NOR EscapeHabitatSmolt Productivity
% to Hatchery
Purpose
Export Goal/Realized
Cons/Harv/Both
Broodstock by Source
Brood Exported (from HOR Surplus)
1
1.00 0.34
0
y
1.00
0.01
0.050
00
0.080
0.080
0.010 0.010
0.34
Not listed; excluded from ESU
HRT Alternative #1
0
1
0.01
0.82
1
y
0.82
0.020 0.080
0.300
0.0100.010
10%
0.083
0.300
0.083
Seg
320
0.8%
Current Habitat
0.5%
pHOS-Goal
1,051,143
Int/Seg/Step/None
Smolt Release
90%
y
100%% to Nat. Spawn. 90%
7.0
pNOB-Goal
pHOSpNOB
PNI 100%
Seg
pHOS-Realized
ConsHarv Seg
Strays
0
Ave Ave
0
None
Recruits/Spawner
0.5%
Current Harvest
7.0Fitness? [Y / N]
Current Harvest
Current Hydro
0.5%
11
0
0.82
0.01 0
0.300
0.4130.083
0.0100.010
y
0.34
0.01 0
1
0.080
0.020 0.080
0.005
0.020
0.080 0.050
0.080
0.0050.300
pNOB
SegHarv
100%
pHOS
100%
0.080
pNOB
Harv
7.0
90%
0.413
Reintroduction: Harvest
Segregated Hatchery
0.5%
Ave
y
Not listed; excluded from ESU
1,450,576
HRT Preferred Alternative
0.010
0.413
0.050
pHOS
1,051,143
100%
Not listed; excluded from ESU
1 1
HSRG Solution
0.01 0
0.8%
Current Habitat
Current Hydro
y
10%
320
90% 10%
Current Habitat
0.8%
442
0
Subregion/Subbasin
0.005
pNOB
Clearwater Spring Chinook
Reintroduction: Harvest
Hatchery
0.01
Harv
1,051,143
y
Current Hydro
Current Harvest
Current Hydro
HRT-Pref.Patterns
Patterns shown here are assigned to the population from
the AHA or ROL file. Red cells indicate patterns are not
assigned to this population/scenario in the rollup
application. The shown pattern needs to be added to the
application, or a different pattern should be assigned to
this population in the ROL/AHA file.
Current Habitat
Hydro ----->
Habitat ----->
1
0.34
y
Reintroduction: Harvest
1
Not listed; excluded from ESU
0.82
Reintroduction: Conservation Reintroduction: Harvest
Natural Reproduction only Segregated Hatchery Segregated Hatchery
-
0.20
0.40
0.60
0.80
1.00
- 0.20 0.40 0.60 0.80 1.00pNOB
pH
OS
.5
.9
.8
.7
.6
.4.3.2
PNI
.1
0
500
1,000
1,500
2,000
2,500
3,000
3,500
4,000
4,500
Ha
tch
ery
Ha
bita
t
Ma
rin
e
L. M
ain
ste
m
U.
Ma
inste
m
Te
rmin
al
0
500
1,000
1,500
2,000
2,500
3,000
3,500
4,000
4,500
Ha
tch
ery
Ha
bita
t
Ma
rin
e
L. M
ain
ste
m
U.
Ma
inste
m
Te
rmin
al
0
500
1,000
1,500
2,000
2,500
3,000
3,500
4,000
4,500
Ha
tch
ery
Ha
bita
t
Ma
rin
e
L.
Ma
inste
m
U.
Ma
inste
m
Te
rmin
al
0
500
1,000
1,500
2,000
2,500
3,000
3,500
4,000
4,500
Ha
tch
ery
Ha
bita
t
Ma
rin
e
L.
Ma
inste
m
U.
Ma
inste
m
Te
rmin
al
0
500
1,000
1,500
2,000
2,500
3,000
3,500
4,000
4,500
Ha
tch
ery
Ha
bita
t
Ma
rin
e
L. M
ain
ste
m
U.
Ma
inste
m
Te
rmin
al
Ha
tch
ery
Ha
bita
tM
ari
ne L.
U.
Te
rmin
al
Apply & Recalculate
Update

USFWS Columbia Basin Hatchery Review Team: Lower Snake Assessments and Recommendations Reports – March 2011
Appendix A – AHA Output 11
Table A2. AHA output for Kooskia NFH spring Chinook, Clear Creek, and Middle Fork Clearwater River
Population (Ctrl + Page Up/Down to Scroll)Species/Race Population Management Intent:
Harv&Hatchery Strategy:
Population Recovery Designation:
Ad. Capacity
% Kelt
Sm. Capacity
Ocean Surv Baseline SAR Vary? (Y/N) 0.092 0.008 0.029 0.008 0.029 0.008 0.029 0.008 0.029 0.008 0.029 0.008
Adult Passage
Adj. Capacity
Harv - Marine
Harv - L. Mainstem
Harv - U. Mainstem
Harv -Terminal
Total Exploitation Rate
Broodstock Composition
Type
Local Imported 400 400 334 400
Destination for HOR Returns
Productivity of Hatchery Fish
444
12Realized Spawning Composition
Relative Hatchery Optimum -> 80 80 80 80 80
Weir Factor ->
Relative Reproductive Success (HOS) -> 80% 80% 80% 80% 80%
Initial Fitness Factor (A) -> 0.81 0.81 0.81 0.81 0.81
Fitness Factor after 100 generations (B) -> 0.50 1.00 0.50 0.50 0.50
Average Fitness Factor (100 Generations) -> 0.50 0.99 0.50 0.50 0.50
Generations until average fitness is reached -> 12 30 12 12 12
Minimum Hatchery Program (% of BS Goal) -> Effective pHOS -> 1.00 Effective pHOS -> Effective pHOS -> 1.00 Effective pHOS -> 1.00 Effective pHOS -> 1.00
"Fitness Floor" -> 0.5 pNOB -> pNOB -> pNOB -> pNOB -> pNOB ->
Calculated Hatchery SAR ->
Calculated Natural SAR ->
Max Min Max Min Max Min Max Min Max Min
NOR Escapement 0 0 0 0 0 0 0 0 0 0
HoS Total Escapement (includes strays) 559 97 559 97 467 81 559 97
All H Analyzer (AHA)
Harvest --->
Hatchery
7.0
0
Current
0.01 0 00.01
No Hatchery
Segregated hatchery
0.01
Not listed; excluded from ESU
1
0
y
0.82
Current Habitat
0
Ave
0.8%
0.413
pHOS
183
0.8%
10%
Current Hydro
Current Harvest
Ave
y
HORs
HORs
0.010
HORs
0.005
HORs
0.010
0.080
0.080
0.300
Hydro
Harvest
NORs
NORs
0.01Adjusted Productivity
NORs
Juv Passage Surv.
NORs
NORs
0.050
pHOS
0.050
0.083
0.005
0.413
pNOB
0.083
1
0.020
0.34
0.01
0.020
HORs 0.010
1
11
6A-Clearwater_Middle Fork Clearwater
Spring Chinook (Kooskia-Hatchery)
y
1
Historic
1
0.01 0
1
Productivity (Adult)
Min NOR EscapeHabitatSmolt Productivity
% to Hatchery
Purpose
Export Goal/Realized
Cons/Harv/Both
Broodstock by Source
Brood Exported (from HOR Surplus)
1
1.00 0.34
0
y
1.00
0.01
0.050
00
0.080
0.080
0.010 0.010
0.34
Not listed; excluded from ESU
HRT Alternative #1
0
1
0.01
0.82
1
y
0.82
0.020 0.080
0.300
0.0100.010
10%
0.083
0.300
0.083
Seg
183
0.8%
Current Habitat
0.5%
pHOS-Goal
600,652
Int/Seg/Step/None
Smolt Release
90%
y
100%% to Nat. Spawn. 90%
7.0
pNOB-Goal
pHOSpNOB
PNI 100%
Seg
pHOS-Realized
ConsHarv Seg
Strays
0
Ave Ave
0
None
Recruits/Spawner
0.5%
Current Harvest
7.0Fitness? [Y / N]
Current Harvest
Current Hydro
0.5%
11
0
0.82
0.01 0
0.300
0.4130.083
0.0100.010
y
0.34
0.01 0
1
0.080
0.020 0.080
0.005
0.020
0.080 0.050
0.080
0.0050.300
pNOB
SegHarv
100%
pHOS
100%
0.080
pNOB
Harv
7.0
90%
0.413
Reintrodution: Harvest
Rear spring Chinook at Clearwater and Dworshak
0.5%
Ave
y
Not listed; excluded from ESU
600,652
HRT Preferred Alternative
0.010
0.413
0.050
pHOS
501,545
100%
Not listed; excluded from ESU
1 1
HSRG Solution
0.01 0
0.8%
Current Habitat
Current Hydro
y
10%
153
90% 10%
Current Habitat
0.8%
183
0
Subregion/Subbasin
0.005
pNOB
Clearwater Spring Chinook
Reintrodution: Harvest
Hatchery
0.01
Harv
600,652
y
Current Hydro
Current Harvest
Current Hydro
HRT-Pref.Patterns
Patterns shown here are assigned to the population from
the AHA or ROL file. Red cells indicate patterns are not
assigned to this population/scenario in the rollup
application. The shown pattern needs to be added to the
application, or a different pattern should be assigned to
this population in the ROL/AHA file.
Current Habitat
Hydro ----->
Habitat ----->
1
0.34
y
Reintrodution: Harvest
1
Not listed; excluded from ESU
0.82
Reintroduction: Conservation Reintrodution: Harvest
Natural Reproduction Only Segregated hatchery Segregated hatchery
-
0.20
0.40
0.60
0.80
1.00
- 0.20 0.40 0.60 0.80 1.00pNOB
pH
OS
.5
.9
.8
.7
.6
.4.3.2
PNI
.1
0
500
1,000
1,500
2,000
2,500
Ha
tch
ery
Ha
bita
t
Ma
rin
e
L. M
ain
ste
m
U.
Ma
inste
m
Te
rmin
al
0
500
1,000
1,500
2,000
2,500
Ha
tch
ery
Ha
bita
t
Ma
rin
e
L. M
ain
ste
m
U.
Ma
inste
m
Te
rmin
al
0
500
1,000
1,500
2,000
2,500
Ha
tch
ery
Ha
bita
t
Ma
rin
e
L.
Ma
inste
m
U.
Ma
inste
m
Te
rmin
al
0
500
1,000
1,500
2,000
2,500
Ha
tch
ery
Ha
bita
t
Ma
rin
e
L.
Ma
inste
m
U.
Ma
inste
m
Te
rmin
al
0
500
1,000
1,500
2,000
2,500
Ha
tch
ery
Ha
bita
t
Ma
rin
e
L. M
ain
ste
m
U.
Ma
inste
m
Te
rmin
al
Ha
tch
ery
Ha
bita
tM
ari
ne L.
U.
Te
rmin
al
Apply & Recalculate
Update
USFWS Columbia Basin Hatchery Review Team: Lower Snake Assessments and Recommendations Reports – March 2011
12 Appendix A – AHA Output
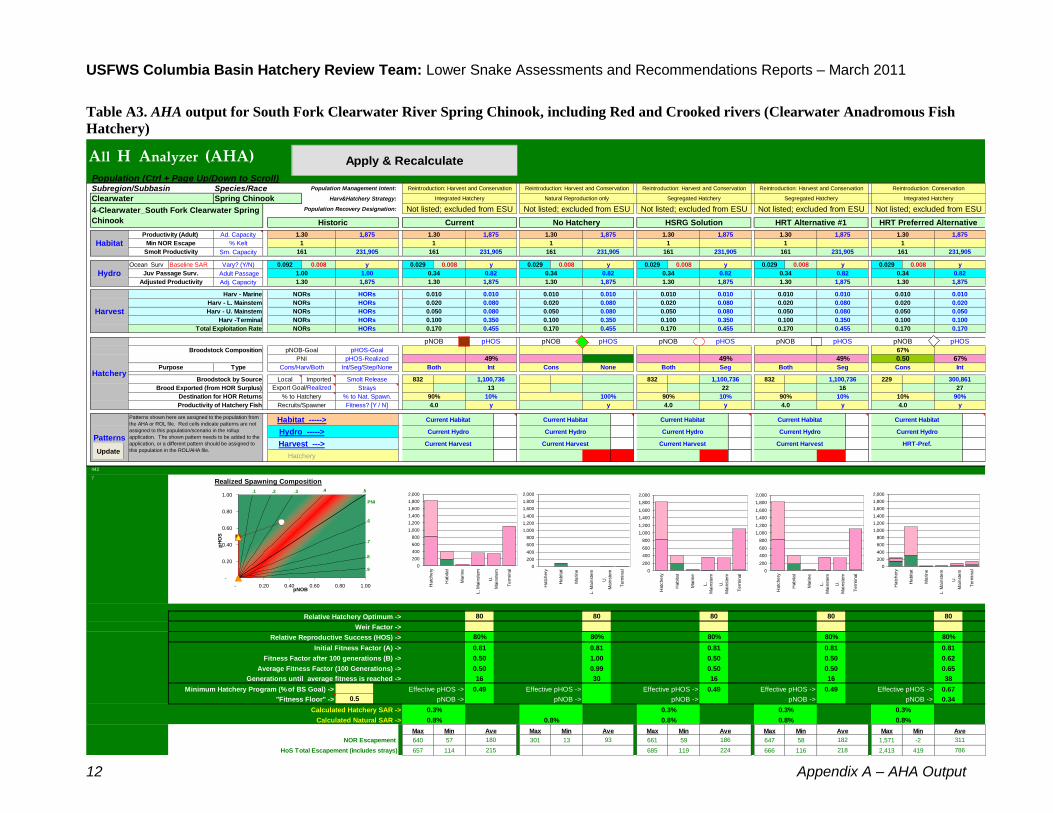
Table A3. AHA output for South Fork Clearwater River Spring Chinook, including Red and Crooked rivers (Clearwater Anadromous Fish
Hatchery)
Population (Ctrl + Page Up/Down to Scroll)Species/Race Population Management Intent:
Harv&Hatchery Strategy:
Population Recovery Designation:
Ad. Capacity
% Kelt
Sm. Capacity
Ocean Surv Baseline SAR Vary? (Y/N) 0.092 0.008 0.029 0.008 0.029 0.008 0.029 0.008 0.029 0.008 0.029 0.008
Adult Passage
Adj. Capacity
Harv - Marine
Harv - L. Mainstem
Harv - U. Mainstem
Harv -Terminal
Total Exploitation Rate
Broodstock Composition
Type
Local Imported 832 832 832 229
Destination for HOR Returns
Productivity of Hatchery Fish
442
7Realized Spawning Composition
Relative Hatchery Optimum -> 80 80 80 80 80
Weir Factor ->
Relative Reproductive Success (HOS) -> 80% 80% 80% 80% 80%
Initial Fitness Factor (A) -> 0.81 0.81 0.81 0.81 0.81
Fitness Factor after 100 generations (B) -> 0.50 1.00 0.50 0.50 0.62
Average Fitness Factor (100 Generations) -> 0.50 0.99 0.50 0.50 0.65
Generations until average fitness is reached -> 16 30 16 16 38
Minimum Hatchery Program (% of BS Goal) -> Effective pHOS -> 0.49 Effective pHOS -> Effective pHOS -> 0.49 Effective pHOS -> 0.49 Effective pHOS -> 0.67
"Fitness Floor" -> 0.5 pNOB -> pNOB -> pNOB -> pNOB -> pNOB -> 0.34
Calculated Hatchery SAR ->
Calculated Natural SAR ->
Max Min Max Min Max Min Max Min Max Min
NOR Escapement 640 57 301 13 661 59 647 58 1,571 -2
HoS Total Escapement (includes strays) 657 114 685 119 666 116 2,413 419
All H Analyzer (AHA)
Harvest --->
Hatchery
4.0
180
Current
1.30 1,875 1,8751.30
No Hatchery
Integrated Hatchery
1.30
Not listed; excluded from ESU
1
1,875
y
0.82
Current Habitat
93
Ave
0.8%
0.455
pHOS
215
13
0.8%
10%
Current Hydro
Current Harvest
Ave
y
HORs
HORs
0.010
HORs
0.100
HORs
0.010
0.080
0.080
0.350
Hydro
Harvest
NORs
NORs
1.30Adjusted Productivity
NORs
Juv Passage Surv.
NORs
NORs
0.050
pHOS
0.050
0.170
0.100
0.455
pNOB
0.170
1
0.020
0.34
1.30
0.020
HORs 0.010
1
161161
4-Clearwater_South Fork Clearwater Spring
Chinook
y
231,905
Historic
231,905
1.30 1,875
161
Productivity (Adult)
Min NOR EscapeHabitatSmolt Productivity
% to Hatchery
Purpose
Export Goal/Realized
Cons/Harv/Both
Broodstock by Source
Brood Exported (from HOR Surplus)
231,905
1.00 0.34
1,875
y
1.00
1.30
0.050
1,8751,875
0.080
0.080
0.010 0.010
0.34
Not listed; excluded from ESU
HRT Alternative #1
1,875
1
1.30
0.82
231,905
y
0.82
0.020 0.080
0.350
0.0100.010
22
10%
0.170
0.350
0.170
Seg
224
0.8%
Current Habitat
0.3%
pHOS-Goal
1,100,736
Int/Seg/Step/None
Smolt Release
90%
y
100%% to Nat. Spawn. 90%
4.0
pNOB-Goal
pHOSpNOB
PNI 49%
Int
pHOS-Realized
ConsBoth Seg
Strays
186
Ave Ave
182
None
Recruits/Spawner
0.3%
Current Harvest
4.0Fitness? [Y / N]
Current Harvest
Current Hydro
0.3%
231,905161
1,875
0.82
1.30 1,875
0.100
0.1700.170
0.0100.010
y
0.34
1.30 1,875
1
0.050
0.020 0.020
0.100
0.020
0.080 0.050
0.080
0.1000.350
pNOB
IntCons
67%
pHOS
0.50
67%
49%
0.080
pNOB
Both
4.0
90%
0.455
Reintroduction: Conservation
Integrated Hatchery
0.3%
Ave
y
Not listed; excluded from ESU
300,861
HRT Preferred Alternative
0.010
0.455
0.050
pHOS
1,100,736
49%
16
Not listed; excluded from ESU
161 161
HSRG Solution
1.30 1,875
0.8%
Current Habitat
Current Hydro
y
10%
218
10% 90%
27
Current Habitat
0.8%
786
311
Subregion/Subbasin
0.100
pNOB
Clearwater Spring Chinook
Reintroduction: Harvest and Conservation
Hatchery
1.30
Both
1,100,736
y
Current Hydro
Current Harvest
Current Hydro
HRT-Pref.Patterns
Patterns shown here are assigned to the population from
the AHA or ROL file. Red cells indicate patterns are not
assigned to this population/scenario in the rollup
application. The shown pattern needs to be added to the
application, or a different pattern should be assigned to
this population in the ROL/AHA file.
Current Habitat
Hydro ----->
Habitat ----->
231,905
0.34
y
Reintroduction: Harvest and Conservation
1
Not listed; excluded from ESU
0.82
Reintroduction: Harvest and Conservation Reintroduction: Harvest and Conservation
Natural Reproduction only Segregated Hatchery Segregated Hatchery
-
0.20
0.40
0.60
0.80
1.00
- 0.20 0.40 0.60 0.80 1.00pNOB
pH
OS
.5
.9
.8
.7
.6
.4.3.2
PNI
.1
0
200
400
600
800
1,000
1,200
1,400
1,600
1,800
2,000
Ha
tch
ery
Ha
bita
t
Ma
rin
e
L. M
ain
ste
m
U.
Ma
inste
m
Te
rmin
al
0
200
400
600
800
1,000
1,200
1,400
1,600
1,800
2,000
Ha
tch
ery
Ha
bita
t
Ma
rin
e
L. M
ain
ste
m
U.
Ma
inste
m
Te
rmin
al
0
200
400
600
800
1,000
1,200
1,400
1,600
1,800
2,000
Ha
tch
ery
Ha
bita
t
Ma
rin
e
L.
Ma
inste
m
U.
Ma
inste
m
Te
rmin
al
0
200
400
600
800
1,000
1,200
1,400
1,600
1,800
2,000
Ha
tch
ery
Ha
bita
t
Ma
rin
e
L.
Ma
inste
m
U.
Ma
inste
m
Te
rmin
al
0
200
400
600
800
1,000
1,200
1,400
1,600
1,800
2,000
Ha
tch
ery
Ha
bita
t
Ma
rin
e
L. M
ain
ste
m
U.
Ma
inste
m
Te
rmin
al
Ha
tch
ery
Ha
bita
tM
ari
ne L.
U.
Te
rmin
al
Apply & Recalculate
Update
USFWS Columbia Basin Hatchery Review Team: Lower Snake Assessments and Recommendations Reports – March 2011
Appendix A – AHA Output 13
Table A4. AHA output for Newsome Creek Spring Chinook, S.F. Clearwater River (Nez Perce Tribal Hatchery)
Population (Ctrl + Page Up/Down to Scroll)Species/Race Population Management Intent:
Harv&Hatchery Strategy:
Population Recovery Designation:
Ad. Capacity
% Kelt
Sm. Capacity
Ocean Surv Baseline SAR Vary? (Y/N) 0.092 0.008 0.029 0.008 0.029 0.008 0.029 0.008 0.029 0.008 0.029 0.008
Adult Passage
Adj. Capacity
Harv - Marine
Harv - L. Mainstem
Harv - U. Mainstem
Harv -Terminal
Total Exploitation Rate
Broodstock Composition
Type
Local Imported 22 35 57 57 57
Destination for HOR Returns
Productivity of Hatchery Fish
828
8Realized Spawning Composition
Relative Hatchery Optimum -> 80 80 80 80 80
Weir Factor ->
Relative Reproductive Success (HOS) -> 80% 80% 80% 80% 80%
Initial Fitness Factor (A) -> 0.81 0.81 0.81 0.81 0.81
Fitness Factor after 100 generations (B) -> 0.50 1.00 0.77 0.77 0.77
Average Fitness Factor (100 Generations) -> 0.50 0.99 0.78 0.78 0.78
Generations until average fitness is reached -> 20 30 10 10 10
Minimum Hatchery Program (% of BS Goal) -> Effective pHOS -> 0.43 Effective pHOS -> Effective pHOS -> 0.57 Effective pHOS -> 0.57 Effective pHOS -> 0.57
"Fitness Floor" -> 0.5 pNOB -> 0.05 pNOB -> pNOB -> 0.50 pNOB -> 0.50 pNOB -> 0.50
Calculated Hatchery SAR ->
Calculated Natural SAR ->
Max Min Max Min Max Min Max Min Max Min
NOR Escapement 146 10 239 19 724 17 714 15 742 20
HoS Total Escapement (includes strays) 122 21 772 134 755 131 801 139
All H Analyzer (AHA)
Harvest --->
Hatchery
4.0
41
Current
1.30 625 6251.30
No Hatchery
Integrated + supplementation
1.30
Not listed; excluded from ESU
1
625
y
0.82
Current Habitat
89
Ave
0.8%
0.083
pHOS
39
11
0.8%
50%
Current Hydro
Current Harvest
Ave
y
HORs
HORs
0.010
HORs
0.005
HORs
0.010
0.050
0.020
0.005
Hydro
Harvest
NORs
NORs
1.30Adjusted Productivity
NORs
Juv Passage Surv.
NORs
NORs
0.050
pHOS
0.050
0.083
0.005
0.083
pNOB
0.083
1
0.020
0.34
1.30
0.020
HORs 0.010
1
161161
4-Clearwater_South Fork
Clearwater_Newsome Creek Spring
Chinook
y
77,302
Historic
77,302
1.30 625
161
Productivity (Adult)
Min NOR EscapeHabitatSmolt Productivity
% to Hatchery
Purpose
Export Goal/Realized
Cons/Harv/Both
Broodstock by Source
Brood Exported (from HOR Surplus)
77,302
1.00 0.34
625
y
1.00
1.30
0.050
625625
0.020
0.050
0.010 0.010
0.34
Not listed; excluded from ESU
HRT Alternative #1
625
1
1.30
0.82
77,302
y
0.82
0.020 0.020
0.005
0.0100.010
20
100%
100%
0.083
0.005
0.083
Int
252
0.8%
Current Habitat
0.3%
pHOS-Goal
75,411
Int/Seg/Step/None
Smolt Release
10%
y
100%% to Nat. Spawn. 50%
4.0
pNOB-Goal
0.08
pHOSpNOB
PNI 43%
Int
pHOS-Realized
ConsCons Int
Strays
154
Ave Ave
151
None
Recruits/Spawner
0.3%
Current Harvest
1.0Fitness? [Y / N]
Current Harvest
Current Hydro
0.1%
77,302161
625
0.82
1.30 625
0.005
0.0830.083
0.0100.010
y
0.34
1.30 625
1
0.050
0.020 0.020
0.005
0.020
0.050 0.050
0.020
0.0050.005
pNOB
IntCons
57%
pHOS
0.64
100%
57%
0.050
pNOB
Cons
0.64
4.0
0.083
Reintroduction: Conservation
Integrated + supplementation
0.3%
Ave
y
Not listed; excluded from ESU
75,279
HRT Preferred Alternative
0.010
0.083
0.050
pHOS
75,279
57%
14
Not listed; excluded from ESU
161 161
HSRG Solution
1.30 625
0.8%
Current Habitat
Current Hydro
y
100%
247
100%
29
Current Habitat
0.8%
262
159
Subregion/Subbasin
100%
0.005
pNOB
Clearwater Spring Chinook
Reintroduction: Conservation
Hatchery
0.64
1.30
Cons
75,279
y
Current Hydro
Current Harvest
Current Hydro
HRT-Pref.Patterns
Patterns shown here are assigned to the population from
the AHA or ROL file. Red cells indicate patterns are not
assigned to this population/scenario in the rollup
application. The shown pattern needs to be added to the
application, or a different pattern should be assigned to
this population in the ROL/AHA file.
Current Habitat
Hydro ----->
Habitat ----->
77,302
0.34
y
Reintroduction: Conservation
1
Not listed; excluded from ESU
0.82
Reintroduction: Conservation Reintroduction: Conservation
Natural Reproduction only Integrated + supplementation Integrated + supplementation
-
0.20
0.40
0.60
0.80
1.00
- 0.20 0.40 0.60 0.80 1.00pNOB
pH
OS
.5
.9
.8
.7
.6
.4.3.2
PNI
.1
0
50
100
150
200
250
300
350
400
450
Ha
tch
ery
Ha
bita
t
Ma
rin
e
L. M
ain
ste
m
U.
Ma
inste
m
Te
rmin
al
0
50
100
150
200
250
300
350
400
450
Ha
tch
ery
Ha
bita
t
Ma
rin
e
L. M
ain
ste
m
U.
Ma
inste
m
Te
rmin
al
0
50
100
150
200
250
300
350
400
450
Ha
tch
ery
Ha
bita
t
Ma
rin
e
L.
Ma
inste
m
U.
Ma
inste
m
Te
rmin
al
0
50
100
150
200
250
300
350
400
450
Ha
tch
ery
Ha
bita
t
Ma
rin
e
L.
Ma
inste
m
U.
Ma
inste
m
Te
rmin
al
0
50
100
150
200
250
300
350
400
450
Ha
tch
ery
Ha
bita
t
Ma
rin
e
L. M
ain
ste
m
U.
Ma
inste
m
Te
rmin
al
Ha
tch
ery
Ha
bita
tM
ari
ne L.
U.
Te
rmin
al
Apply & Recalculate
Update

USFWS Columbia Basin Hatchery Review Team: Lower Snake Assessments and Recommendations Reports – March 2011
14 Appendix A – AHA Output
Table A5. AHA output for Lolo Creek Spring Chinook, Clearwater River (Nez Perce Tribal Hatchery)
Population (Ctrl + Page Up/Down to Scroll)Species/Race Population Management Intent:
Harv&Hatchery Strategy:
Population Recovery Designation:
Ad. Capacity
% Kelt
Sm. Capacity
Ocean Surv Baseline SAR Vary? (Y/N) 0.092 0.008 0.029 0.008 0.029 0.008 0.029 0.008 0.029 0.008 0.029 0.008
Adult Passage
Adj. Capacity
Harv - Marine
Harv - L. Mainstem
Harv - U. Mainstem
Harv -Terminal
Total Exploitation Rate
Broodstock Composition
Type
Local Imported 64 48 76 76 76
Destination for HOR Returns
Productivity of Hatchery Fish
439
10Realized Spawning Composition
Relative Hatchery Optimum -> 80 80 80 80 80
Weir Factor ->
Relative Reproductive Success (HOS) -> 80% 80% 80% 80% 80%
Initial Fitness Factor (A) -> 0.81 0.81 0.81 0.81 0.81
Fitness Factor after 100 generations (B) -> 0.50 1.00 0.83 0.83 0.83
Average Fitness Factor (100 Generations) -> 0.50 0.99 0.83 0.83 0.83
Generations until average fitness is reached -> 19 30 25 25 25
Minimum Hatchery Program (% of BS Goal) -> Effective pHOS -> 0.39 Effective pHOS -> Effective pHOS -> 0.43 Effective pHOS -> 0.43 Effective pHOS -> 0.43
"Fitness Floor" -> 0.5 pNOB -> pNOB -> pNOB -> 0.50 pNOB -> 0.50 pNOB -> 0.50
Calculated Hatchery SAR ->
Calculated Natural SAR ->
Max Min Max Min Max Min Max Min Max Min
NOR Escapement 280 23 575 44 1,473 69 1,452 66 1,498 72
HoS Total Escapement (includes strays) 216 34 1,014 176 995 172 1,038 180
All H Analyzer (AHA)
Harvest --->
Hatchery
4.0
81
Current
1.30 1,500 1,5001.30
No Hatchery
Integrated + Supplementation
1.30
Not listed; excluded from ESU
1
1,500
y
0.82
Current Habitat
214
Ave
0.8%
0.083
pHOS
66
14
0.8%
50%
Current Hydro
Current Harvest
Ave
y
HORs
HORs
0.010
HORs
0.005
HORs
0.010
0.050
0.020
0.005
Hydro
Harvest
NORs
NORs
1.30Adjusted Productivity
NORs
Juv Passage Surv.
NORs
NORs
0.050
pHOS
0.050
0.083
0.005
0.083
pNOB
0.083
1
0.020
0.34
1.30
0.020
HORs 0.010
1
161161
5-Clearwater_Lolo Creek Spring Chinook
y
185,524
Historic
185,524
1.30 1,500
161
Productivity (Adult)
Min NOR EscapeHabitatSmolt Productivity
% to Hatchery
Purpose
Export Goal/Realized
Cons/Harv/Both
Broodstock by Source
Brood Exported (from HOR Surplus)
185,524
1.00 0.34
1,500
y
1.00
1.30
0.050
1,5001,500
0.020
0.050
0.010 0.010
0.34
Not listed; excluded from ESU
HRT Alternative #1
1,500
1
1.30
0.82
185,524
y
0.82
0.020 0.020
0.005
0.0100.010
22
100%
100%
0.083
0.005
0.083
Int
332
0.8%
Current Habitat
0.3%
pHOS-Goal
150,535
Int/Seg/Step/None
Smolt Release
y
100%% to Nat. Spawn. 50%
4.0
pNOB-Goal
pHOSpNOB
PNI 39%
Int
pHOS-Realized
ConsCons Int
Strays
357
Ave Ave
352
None
Recruits/Spawner
0.3%
Current Harvest
1.0Fitness? [Y / N]
Current Harvest
Current Hydro
0.1%
185,524161
1,500
0.82
1.30 1,500
0.005
0.0830.083
0.0100.010
y
0.34
1.30 1,500
1
0.050
0.020 0.020
0.005
0.020
0.050 0.050
0.020
0.0050.005
pNOB
IntCons
43%
pHOS
0.70
100%
43%
0.050
pNOB
Cons
0.70
4.0
0.083
Reintroduction: Conservation
Integrated + Supplementation
0.3%
Ave
y
Not listed; excluded from ESU
100,990
HRT Preferred Alternative
0.010
0.083
0.050
pHOS
100,990
43%
16
Not listed; excluded from ESU
161 161
HSRG Solution
1.30 1,500
0.8%
Current Habitat
Current Hydro
y
100%
326
100%
30
Current Habitat
0.8%
340
363
Subregion/Subbasin
100%
0.005
pNOB
Clearwater Spring Chinook
Reintroduction: Conservation
Hatchery
0.70
1.30
Cons
100,990
y
Current Hydro
Current Harvest
Current Hydro
HRT-Pref.Patterns
Patterns shown here are assigned to the population from
the AHA or ROL file. Red cells indicate patterns are not
assigned to this population/scenario in the rollup
application. The shown pattern needs to be added to the
application, or a different pattern should be assigned to
this population in the ROL/AHA file.
Current Habitat
Hydro ----->
Habitat ----->
185,524
0.34
y
Reintroduction: Conservation
1
Not listed; excluded from ESU
0.82
Reintroduction: Conservation Reintroduction: Conservation
Natural Reproduction only Integrated + Supplementation Integrated + Supplementation
-
0.20
0.40
0.60
0.80
1.00
- 0.20 0.40 0.60 0.80 1.00pNOB
pH
OS
.5
.9
.8
.7
.6
.4.3.2
PNI
.1
0
100
200
300
400
500
600
700
800
Ha
tch
ery
Ha
bita
t
Ma
rin
e
L. M
ain
ste
m
U.
Ma
inste
m
Te
rmin
al
0
100
200
300
400
500
600
700
800
Ha
tch
ery
Ha
bita
t
Ma
rin
e
L. M
ain
ste
m
U.
Ma
inste
m
Te
rmin
al
0
100
200
300
400
500
600
700
800
Ha
tch
ery
Ha
bita
t
Ma
rin
e
L.
Ma
inste
m
U.
Ma
inste
m
Te
rmin
al
0
100
200
300
400
500
600
700
800
Ha
tch
ery
Ha
bita
t
Ma
rin
e
L.
Ma
inste
m
U.
Ma
inste
m
Te
rmin
al
0
100
200
300
400
500
600
700
800
Ha
tch
ery
Ha
bita
t
Ma
rin
e
L. M
ain
ste
m
U.
Ma
inste
m
Te
rmin
al
Ha
tch
ery
Ha
bita
tM
ari
ne L.
U.
Te
rmin
al
Apply & Recalculate
Update
USFWS Columbia Basin Hatchery Review Team: Lower Snake Assessments and Recommendations Reports – March 2011
Appendix A – AHA Output 15
Table A6. AHA output for Nez Perce Tribal Hatchery Spring Chinook, Clearwater River
Population (Ctrl + Page Up/Down to Scroll)Species/Race Population Management Intent:
Harv&Hatchery Strategy:
Population Recovery Designation:
Ad. Capacity
% Kelt
Sm. Capacity
Ocean Surv Baseline SAR Vary? (Y/N) 0.092 0.008 0.029 0.008 0.029 0.008 0.029 0.008 0.029 0.008 0.029 0.008
Adult Passage
Adj. Capacity
Harv - Marine
Harv - L. Mainstem
Harv - U. Mainstem
Harv -Terminal
Total Exploitation Rate
Broodstock Composition
Type
Local Imported 83 83 83 83
120 120 120 120 120 120 120 120
Destination for HOR Returns
Productivity of Hatchery Fish
820
14Realized Spawning Composition
Relative Hatchery Optimum -> 80 80 80 80 80
Weir Factor ->
Relative Reproductive Success (HOS) -> 80% 80% 80% 80% 80%
Initial Fitness Factor (A) -> 0.81 0.81 0.81 0.81 0.81
Fitness Factor after 100 generations (B) -> 0.50 1.00 0.50 0.50 0.50
Average Fitness Factor (100 Generations) -> 0.50 0.99 0.50 0.50 0.50
Generations until average fitness is reached -> 12 30 12 12 12
Minimum Hatchery Program (% of BS Goal) -> Effective pHOS -> 1.00 Effective pHOS -> Effective pHOS -> 1.00 Effective pHOS -> 1.00 Effective pHOS -> 1.00
"Fitness Floor" -> 0.5 pNOB -> pNOB -> pNOB -> pNOB -> pNOB ->
Calculated Hatchery SAR ->
Calculated Natural SAR ->
Max Min Max Min Max Min Max Min Max Min
NOR Escapement 0 0 0 0 0 0 0 0 0 0
HoS Total Escapement (includes strays) 97 16 97 16 97 16 97 16
All H Analyzer (AHA)
Harvest --->
Hatchery
4.2
0
Current
0.00 0 00.00
No Hatchery
Segregated Hatchery
0.00
Not listed; excluded from ESU
1
0
y
0.82
Current Habitat
0
Ave
0.8%
0.182
pHOS
31
0.8%
10%
Current Hydro
Current Harvest
Ave
y
HORs
HORs
0.010
HORs
0.030
HORs
0.010
0.140
0.010
0.030
Hydro
Harvest
NORs
NORs
0.00Adjusted Productivity
NORs
Juv Passage Surv.
NORs
NORs
0.140
pHOS
0.140
0.182
0.030
0.182
pNOB
0.182
1
0.010
0.34
0.00
0.010
HORs 0.010
1
00
6C-Clearwater_Lower Mainstem_Spring
Chinook (NPTH-Hatchery)
y
1
Historic
1
0.00 0
0
Productivity (Adult)
Min NOR EscapeHabitatSmolt Productivity
% to Hatchery
Purpose
Export Goal/Realized
Cons/Harv/Both
Broodstock by Source
Brood Exported (from HOR Surplus)
1
1.00 0.34
0
y
1.00
0.00
0.140
00
0.010
0.140
0.010 0.010
0.34
Not listed; excluded from ESU
HRT Alternative #1
0
1
0.00
0.82
1
y
0.82
0.010 0.010
0.030
0.0100.010
10%
0.182
0.030
0.182
Seg
31
0.8%
Current Habitat
0.3%
pHOS-Goal
124,635
Int/Seg/Step/None
Smolt Release
90%
y
100%% to Nat. Spawn. 90%
4.2
pNOB-Goal
pHOSpNOB
PNI 100%
Seg
pHOS-Realized
ConsHarv Seg
Strays
0
Ave Ave
0
None
Recruits/Spawner
0.3%
Current Harvest
4.2Fitness? [Y / N]
Current Harvest
Current Hydro
0.3%
10
0
0.82
0.00 0
0.030
0.1820.182
0.0100.010
y
0.34
0.00 0
1
0.140
0.010 0.010
0.030
0.010
0.140 0.140
0.010
0.0300.030
pNOB
SegHarv
100%
pHOS
100%
0.140
pNOB
Harv
4.2
90%
0.182
Reintroduction: Harvest and Conservation
Segregated Hatchery
0.3%
Ave
y
Not listed; excluded from ESU
124,635
HRT Preferred Alternative
0.010
0.182
0.140
pHOS
124,635
100%
Not listed; excluded from ESU
0 0
HSRG Solution
0.00 0
0.8%
Current Habitat
Current Hydro
y
10%
31
90% 10%
Current Habitat
0.8%
31
0
Subregion/Subbasin
0.030
pNOB
Clearwater Spring Chinook
Reintroduction: Harvest and Conservation
Hatchery
0.00
Harv
124,635
y
Current Hydro
Current Harvest
Current Hydro
HRT-Pref.Patterns
Patterns shown here are assigned to the population from
the AHA or ROL file. Red cells indicate patterns are not
assigned to this population/scenario in the rollup
application. The shown pattern needs to be added to the
application, or a different pattern should be assigned to
this population in the ROL/AHA file.
Current Habitat
Hydro ----->
Habitat ----->
1
0.34
y
Reintroduction: Harvest and Conservation
1
Not listed; excluded from ESU
0.82
Reintroduction: Harvest and Conservation Reintroduction: Harvest and Conservation
Natural Reproduction only Segregated Hatchery Segregated Hatchery
-
0.20
0.40
0.60
0.80
1.00
- 0.20 0.40 0.60 0.80 1.00pNOB
pH
OS
.5
.9
.8
.7
.6
.4.3.2
PNI
.1
0
20
40
60
80
100
120
140
160
180
200
Ha
tch
ery
Ha
bita
t
Ma
rin
e
L. M
ain
ste
m
U.
Ma
inste
m
Te
rmin
al
0
20
40
60
80
100
120
140
160
180
200
Ha
tch
ery
Ha
bita
t
Ma
rin
e
L. M
ain
ste
m
U.
Ma
inste
m
Te
rmin
al
0
20
40
60
80
100
120
140
160
180
200
Ha
tch
ery
Ha
bita
t
Ma
rin
e
L.
Ma
inste
m
U.
Ma
inste
m
Te
rmin
al
0
20
40
60
80
100
120
140
160
180
200
Ha
tch
ery
Ha
bita
t
Ma
rin
e
L.
Ma
inste
m
U.
Ma
inste
m
Te
rmin
al
0
20
40
60
80
100
120
140
160
180
200
Ha
tch
ery
Ha
bita
t
Ma
rin
e
L. M
ain
ste
m
U.
Ma
inste
m
Te
rmin
al
Ha
tch
ery
Ha
bita
tM
ari
ne L.
U.
Te
rmin
al
Apply & Recalculate
Update

USFWS Columbia Basin Hatchery Review Team: Lower Snake Assessments and Recommendations Reports – March 2011
16 Appendix A – AHA Output
Table A7. AHA output for Lochsa River Spring Chinook (Powell Satellite Facility and Clearwater Fish Hatchery)
Population (Ctrl + Page Up/Down to Scroll)Species/Race Population Management Intent:
Harv&Hatchery Strategy:
Population Recovery Designation:
Ad. Capacity
% Kelt
Sm. Capacity
Ocean Surv Baseline SAR Vary? (Y/N) 0.092 0.008 0.029 0.008 0.029 0.008 0.029 0.008 0.029 0.008 0.029 0.008
Adult Passage
Adj. Capacity
Harv - Marine
Harv - L. Mainstem
Harv - U. Mainstem
Harv -Terminal
Total Exploitation Rate
Broodstock Composition
Type
Local Imported 236 412 236 177
460 460 274 274 386 386 258 258
Destination for HOR Returns
Productivity of Hatchery Fish
695
1Realized Spawning Composition
Relative Hatchery Optimum -> 80 80 80 80 80
Weir Factor ->
Relative Reproductive Success (HOS) -> 80% 80% 80% 80% 80%
Initial Fitness Factor (A) -> 0.81 0.81 0.81 0.81 0.81
Fitness Factor after 100 generations (B) -> 0.50 1.00 0.50 0.50 0.63
Average Fitness Factor (100 Generations) -> 0.50 0.99 0.50 0.50 0.66
Generations until average fitness is reached -> 17 30 15 16 38
Minimum Hatchery Program (% of BS Goal) -> Effective pHOS -> 0.47 Effective pHOS -> Effective pHOS -> 0.59 Effective pHOS -> 0.53 Effective pHOS -> 0.74
"Fitness Floor" -> 0.5 pNOB -> pNOB -> pNOB -> pNOB -> pNOB -> 0.37
Calculated Hatchery SAR ->
Calculated Natural SAR ->
Max Min Max Min Max Min Max Min Max Min
NOR Escapement 371 33 262 17 800 82 584 56 1,109 0
HoS Total Escapement (includes strays) 358 62 1,172 203 682 118 2,257 392
All H Analyzer (AHA)
Harvest --->
Hatchery
6.0
105
Current
1.30 940 9401.30
No Hatchery
Segregated Hatchery + Imports
1.30
Not listed; excluded from ESU
1
940
y
0.82
Current Habitat
92
Ave
0.8%
0.330
pHOS
117
11
0.8%
10%
Current Hydro
Current Harvest
Ave
y
HORs
HORs
0.010
HORs
0.050
HORs
0.010
0.080
0.080
0.200
Hydro
Harvest
NORs
NORs
1.30Adjusted Productivity
NORs
Juv Passage Surv.
NORs
NORs
0.050
pHOS
0.050
0.124
0.050
0.330
pNOB
0.124
1
0.020
0.34
1.30
0.020
HORs 0.010
1
161161
1-Clearwater_Lochsa Spring Chinook
y
116,262
Historic
116,265
1.30 940
161
Productivity (Adult)
Min NOR EscapeHabitatSmolt Productivity
% to Hatchery
Purpose
Export Goal/Realized
Cons/Harv/Both
Broodstock by Source
Brood Exported (from HOR Surplus)
116,262
1.00 0.34
940
y
1.00
1.30
0.050
940940
0.080
0.080
0.010 0.010
0.34
Not listed; excluded from ESU
HRT Alternative #1
940
1
1.30
0.82
116,262
y
0.82
0.020 0.080
0.200
0.0100.010
14
20%
0.124
0.200
0.124
Seg
383
0.8%
Current Habitat
0.4%
pHOS-Goal
401,436
Int/Seg/Step/None
Smolt Release
80%
y
100%% to Nat. Spawn. 90%
6.0
pNOB-Goal
pHOSpNOB
PNI 47%
Seg
pHOS-Realized
ConsBoth Seg
Strays
216
Ave Ave
159
None
Recruits/Spawner
0.4%
Current Harvest
6.0Fitness? [Y / N]
Current Harvest
Current Hydro
0.4%
116,262161
940
0.82
1.30 940
0.050
0.1240.124
0.0100.010
y
0.34
1.30 940
1
0.050
0.020 0.020
0.050
0.020
0.080 0.050
0.080
0.0500.200
pNOB
IntCons
74%
pHOS
0.50
75%
59%
0.080
pNOB
Both
6.0
80%
0.330
Reintroduction: Conservation
Integrated Hatchery
0.4%
Ave
y
Not listed; excluded from ESU
300,681
HRT Preferred Alternative
0.010
0.330
0.050
pHOS
401,436
53%
12
Not listed; excluded from ESU
161 161
HSRG Solution
1.30 940
0.8%
Current Habitat
Current Hydro
y
20%
223
30% 70%
13
Current Habitat
0.8%
738
204
Subregion/Subbasin
0.050
pNOB
Clearwater Spring Chinook
Reintroduction: Harvest and Conservation
Hatchery
1.30
Both
700,812
y
Current Hydro
Current Harvest
Current Hydro
HRT-Pref.Patterns
Patterns shown here are assigned to the population from
the AHA or ROL file. Red cells indicate patterns are not
assigned to this population/scenario in the rollup
application. The shown pattern needs to be added to the
application, or a different pattern should be assigned to
this population in the ROL/AHA file.
Current Habitat
Hydro ----->
Habitat ----->
116,262
0.34
y
Reintroduction: Harvest and Conservation
1
Not listed; excluded from ESU
0.82
Reintroduction: Conservation Reintroduction: Harvest and Conservation
Natural Reproduction Only Segregated Hatchery Segregated Hatchery
-
0.20
0.40
0.60
0.80
1.00
- 0.20 0.40 0.60 0.80 1.00pNOB
pH
OS
.5
.9
.8
.7
.6
.4.3.2
PNI
.1
0
200
400
600
800
1,000
1,200
1,400
Ha
tch
ery
Ha
bita
t
Ma
rin
e
L. M
ain
ste
m
U.
Ma
inste
m
Te
rmin
al
0
200
400
600
800
1,000
1,200
1,400
Ha
tch
ery
Ha
bita
t
Ma
rin
e
L. M
ain
ste
m
U.
Ma
inste
m
Te
rmin
al
0
200
400
600
800
1,000
1,200
1,400
Ha
tch
ery
Ha
bita
t
Ma
rin
e
L.
Ma
inste
m
U.
Ma
inste
m
Te
rmin
al
0
200
400
600
800
1,000
1,200
1,400
Ha
tch
ery
Ha
bita
t
Ma
rin
e
L.
Ma
inste
m
U.
Ma
inste
m
Te
rmin
al
0
200
400
600
800
1,000
1,200
1,400
Ha
tch
ery
Ha
bita
t
Ma
rin
e
L. M
ain
ste
m
U.
Ma
inste
m
Te
rmin
al
Ha
tch
ery
Ha
bita
tM
ari
ne L.
U.
Te
rmin
al
Apply & Recalculate
Update

USFWS Columbia Basin Hatchery Review Team: Lower Snake Assessments and Recommendations Reports – March 2011
Appendix A – AHA Output 17
Table A8. AHA output for Lower Selway River Spring Chinook, including Meadow Creek, Lochsa River Stock (Clearwater Fish Hatchery
and Nez Perce Tribal Hatchery)
Population (Ctrl + Page Up/Down to Scroll)Species/Race Population Management Intent:
Harv&Hatchery Strategy:
Population Recovery Designation:
Ad. Capacity
% Kelt
Sm. Capacity
Ocean Surv Baseline SAR Vary? (Y/N) 0.092 0.008 0.029 0.008 0.029 0.008 0.029 0.008 0.029 0.008 0.029 0.008
Adult Passage
Adj. Capacity
Harv - Marine
Harv - L. Mainstem
Harv - U. Mainstem
Harv -Terminal
Total Exploitation Rate
Broodstock Composition
Type
Local Imported 466 466 200 134
Destination for HOR Returns
Productivity of Hatchery Fish
785
3Realized Spawning Composition
Relative Hatchery Optimum -> 80 80 80 80 80
Weir Factor ->
Relative Reproductive Success (HOS) -> 80% 80% 80% 80% 80%
Initial Fitness Factor (A) -> 0.81 0.81 0.81 0.81 0.81
Fitness Factor after 100 generations (B) -> 0.50 1.00 0.50 0.50 0.50
Average Fitness Factor (100 Generations) -> 0.50 0.99 0.50 0.50 0.50
Generations until average fitness is reached -> 13 30 13 14 14
Minimum Hatchery Program (% of BS Goal) -> Effective pHOS -> 0.76 Effective pHOS -> Effective pHOS -> 0.76 Effective pHOS -> 0.72 Effective pHOS -> 0.68
"Fitness Floor" -> 0.5 pNOB -> pNOB -> pNOB -> pNOB -> pNOB ->
Calculated Hatchery SAR ->
Calculated Natural SAR ->
Max Min Max Min Max Min Max Min Max Min
NOR Escapement 624 82 153 12 626 83 580 72 518 61
HoS Total Escapement (includes strays) 2,115 367 2,143 372 1,615 280 1,142 198
All H Analyzer (AHA)
Harvest --->
Hatchery
3.2
178
Current
1.30 400 4001.30
No Hatchery
Segregated hatchery + supplementation
1.30
Not listed: excluded from ESU
1
400
y
0.82
Current Habitat
57
Ave
0.8%
0.279
pHOS
692
11
0.8%
100%
Current Hydro
Current Harvest
Ave
y
HORs
HORs
0.010
HORs
0.005
HORs
0.010
0.080
0.080
0.140
Hydro
Harvest
NORs
NORs
1.30Adjusted Productivity
NORs
Juv Passage Surv.
NORs
NORs
0.050
pHOS
0.050
0.083
0.005
0.279
pNOB
0.083
1
0.020
0.34
1.30
0.020
HORs 0.010
1
161161
2-Clearwater_Lower Selway Spring
Chinook
y
49,473
Historic
49,628
1.30 400
161
Productivity (Adult)
Min NOR EscapeHabitatSmolt Productivity
% to Hatchery
Purpose
Export Goal/Realized
Cons/Harv/Both
Broodstock by Source
Brood Exported (from HOR Surplus)
49,473
1.00 0.34
400
y
1.00
1.30
0.050
400400
0.080
0.080
0.010 0.010
0.34
Not listed: excluded from ESU
HRT Alternative #1
400
1
1.30
0.82
49,473
y
0.82
0.020 0.080
0.140
0.0100.010
20
100%
0.083
0.140
0.083
Seg
701
0.8%
Current Habitat
0.2%
pHOS-Goal
730,053
Int/Seg/Step/None
Smolt Release
y
100%% to Nat. Spawn.
1.8
pNOB-Goal
pHOSpNOB
PNI 76%
Seg
pHOS-Realized
ConsBoth Seg
Strays
179
Ave Ave
163
None
Recruits/Spawner
0.1%
Current Harvest
1.8Fitness? [Y / N]
Current Harvest
Current Hydro
0.1%
49,473161
400
0.82
1.30 400
0.140
0.2790.083
0.0100.010
y
0.34
1.30 400
1
0.080
0.020 0.080
0.005
0.020
0.080 0.050
0.080
0.0050.140
pNOB
SegCons
68%
pHOS
10%
76%
0.080
pNOB
Both
3.2
0.279
Reintroduction: Harvest and Conservation
Segregated hatchery + supplementation
0.2%
Ave
y
Not listed: excluded from ESU
201,219
HRT Preferred Alternative
0.010
0.279
0.050
pHOS
300,326
72%
14
Not listed: excluded from ESU
161 161
HSRG Solution
1.30 400
0.8%
Current Habitat
Current Hydro
y
100%
529
100%
29
Current Habitat
0.8%
374
143
Subregion/Subbasin
0.005
pNOB
Clearwater Spring Chinook
Reintroduction: Harvest and Conservation
Hatchery
1.30
Both
730,053
y
Current Hydro
Current Harvest
Current Hydro
HRT-Pref.Patterns
Patterns shown here are assigned to the population from
the AHA or ROL file. Red cells indicate patterns are not
assigned to this population/scenario in the rollup
application. The shown pattern needs to be added to the
application, or a different pattern should be assigned to
this population in the ROL/AHA file.
Current Habitat
Hydro ----->
Habitat ----->
49,473
0.34
y
Reintroduction: Harvest and Conservation
1
Not listed: excluded from ESU
0.82
Reintroduction: Conservation Reintroduction: Harvest and Conservation
Natural Reproduction only Segregated hatchery Segregated hatchery
-
0.20
0.40
0.60
0.80
1.00
- 0.20 0.40 0.60 0.80 1.00pNOB
pH
OS
.5
.9
.8
.7
.6
.4.3.2
PNI
.1
0
100
200
300
400
500
600
700
800
900
1,000
Ha
tch
ery
Ha
bita
t
Ma
rin
e
L. M
ain
ste
m
U.
Ma
inste
m
Te
rmin
al
0
100
200
300
400
500
600
700
800
900
1,000
Ha
tch
ery
Ha
bita
t
Ma
rin
e
L. M
ain
ste
m
U.
Ma
inste
m
Te
rmin
al
0
100
200
300
400
500
600
700
800
900
1,000
Ha
tch
ery
Ha
bita
t
Ma
rin
e
L.
Ma
inste
m
U.
Ma
inste
m
Te
rmin
al
0
100
200
300
400
500
600
700
800
900
1,000
Ha
tch
ery
Ha
bita
t
Ma
rin
e
L.
Ma
inste
m
U.
Ma
inste
m
Te
rmin
al
0
100
200
300
400
500
600
700
800
900
1,000
Ha
tch
ery
Ha
bita
t
Ma
rin
e
L. M
ain
ste
m
U.
Ma
inste
m
Te
rmin
al
Ha
tch
ery
Ha
bita
tM
ari
ne L.
U.
Te
rmin
al
Apply & Recalculate
Update
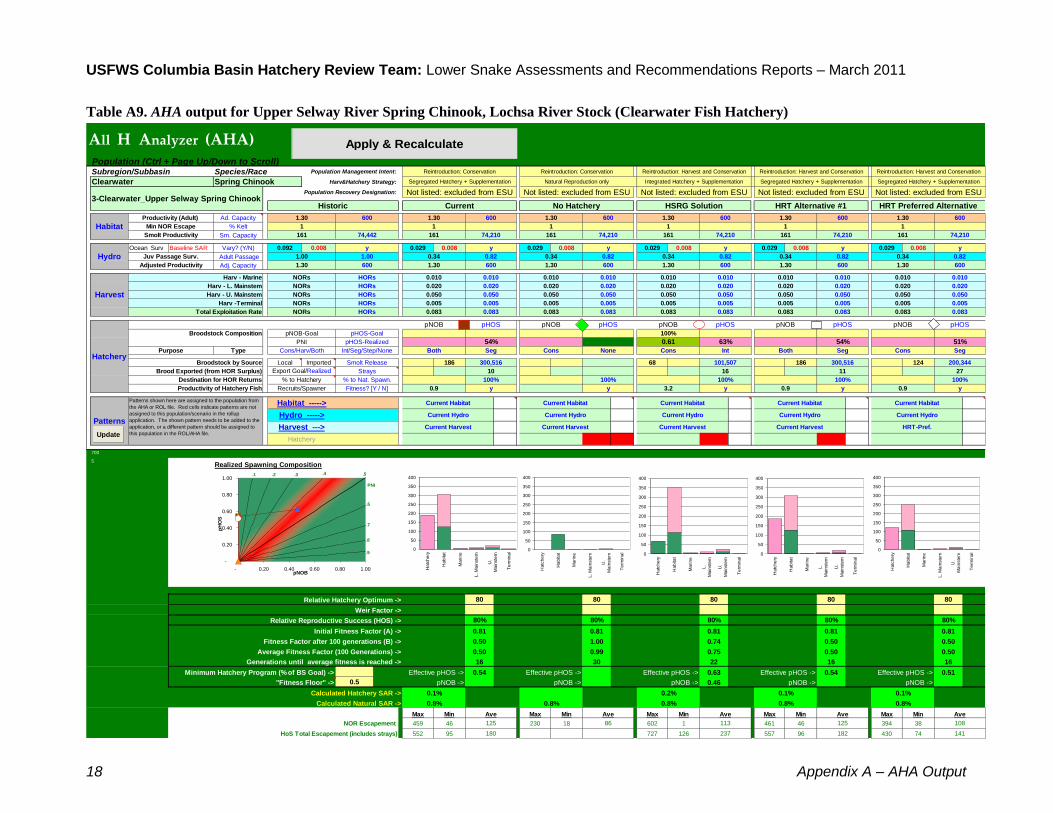
USFWS Columbia Basin Hatchery Review Team: Lower Snake Assessments and Recommendations Reports – March 2011
18 Appendix A – AHA Output
Table A9. AHA output for Upper Selway River Spring Chinook, Lochsa River Stock (Clearwater Fish Hatchery)
Population (Ctrl + Page Up/Down to Scroll)Species/Race Population Management Intent:
Harv&Hatchery Strategy:
Population Recovery Designation:
Ad. Capacity
% Kelt
Sm. Capacity
Ocean Surv Baseline SAR Vary? (Y/N) 0.092 0.008 0.029 0.008 0.029 0.008 0.029 0.008 0.029 0.008 0.029 0.008
Adult Passage
Adj. Capacity
Harv - Marine
Harv - L. Mainstem
Harv - U. Mainstem
Harv -Terminal
Total Exploitation Rate
Broodstock Composition
Type
Local Imported 186 68 186 124
Destination for HOR Returns
Productivity of Hatchery Fish
700
5Realized Spawning Composition
Relative Hatchery Optimum -> 80 80 80 80 80
Weir Factor ->
Relative Reproductive Success (HOS) -> 80% 80% 80% 80% 80%
Initial Fitness Factor (A) -> 0.81 0.81 0.81 0.81 0.81
Fitness Factor after 100 generations (B) -> 0.50 1.00 0.74 0.50 0.50
Average Fitness Factor (100 Generations) -> 0.50 0.99 0.75 0.50 0.50
Generations until average fitness is reached -> 16 30 22 16 16
Minimum Hatchery Program (% of BS Goal) -> Effective pHOS -> 0.54 Effective pHOS -> Effective pHOS -> 0.63 Effective pHOS -> 0.54 Effective pHOS -> 0.51
"Fitness Floor" -> 0.5 pNOB -> pNOB -> pNOB -> 0.46 pNOB -> pNOB ->
Calculated Hatchery SAR ->
Calculated Natural SAR ->
Max Min Max Min Max Min Max Min Max Min
NOR Escapement 459 46 230 18 602 1 461 46 394 38
HoS Total Escapement (includes strays) 552 95 727 126 557 96 430 74
All H Analyzer (AHA)
Harvest --->
Hatchery
0.9
125
Current
1.30 600 6001.30
No Hatchery
Segregated Hatchery + Supplementation
1.30
Not listed: excluded from ESU
1
600
y
0.82
Current Habitat
86
Ave
0.8%
0.083
pHOS
180
10
0.8%
100%
Current Hydro
Current Harvest
Ave
y
HORs
HORs
0.010
HORs
0.005
HORs
0.010
0.050
0.020
0.005
Hydro
Harvest
NORs
NORs
1.30Adjusted Productivity
NORs
Juv Passage Surv.
NORs
NORs
0.050
pHOS
0.050
0.083
0.005
0.083
pNOB
0.083
1
0.020
0.34
1.30
0.020
HORs 0.010
1
161161
3-Clearwater_Upper Selway Spring Chinook
y
74,210
Historic
74,442
1.30 600
161
Productivity (Adult)
Min NOR EscapeHabitatSmolt Productivity
% to Hatchery
Purpose
Export Goal/Realized
Cons/Harv/Both
Broodstock by Source
Brood Exported (from HOR Surplus)
74,210
1.00 0.34
600
y
1.00
1.30
0.050
600600
0.020
0.050
0.010 0.010
0.34
Not listed: excluded from ESU
HRT Alternative #1
600
1
1.30
0.82
74,210
y
0.82
0.020 0.020
0.005
0.0100.010
16
100%
0.083
0.005
0.083
Int
237
0.8%
Current Habitat
0.1%
pHOS-Goal
300,516
Int/Seg/Step/None
Smolt Release
y
100%% to Nat. Spawn.
3.2
pNOB-Goal
pHOSpNOB
PNI 54%
Seg
pHOS-Realized
ConsBoth Seg
Strays
113
Ave Ave
125
None
Recruits/Spawner
0.2%
Current Harvest
0.9Fitness? [Y / N]
Current Harvest
Current Hydro
0.1%
74,210161
600
0.82
1.30 600
0.005
0.0830.083
0.0100.010
y
0.34
1.30 600
1
0.050
0.020 0.020
0.005
0.020
0.050 0.050
0.020
0.0050.005
pNOB
SegCons
51%
pHOS
63%
0.050
pNOB
Both
0.9
0.083
Reintroduction: Harvest and Conservation
Segregated Hatchery + Supplementation
0.1%
Ave
y
Not listed: excluded from ESU
200,344
HRT Preferred Alternative
0.010
0.083
0.050
pHOS
300,516
54%
11
Not listed: excluded from ESU
161 161
HSRG Solution
1.30 600
0.8%
Current Habitat
Current Hydro
y
100%
182
100%
27
Current Habitat
0.8%
141
108
Subregion/Subbasin
100%
0.005
pNOB
Clearwater Spring Chinook
Reintroduction: Conservation
Hatchery
0.61
1.30
Cons
101,507
y
Current Hydro
Current Harvest
Current Hydro
HRT-Pref.Patterns
Patterns shown here are assigned to the population from
the AHA or ROL file. Red cells indicate patterns are not
assigned to this population/scenario in the rollup
application. The shown pattern needs to be added to the
application, or a different pattern should be assigned to
this population in the ROL/AHA file.
Current Habitat
Hydro ----->
Habitat ----->
74,210
0.34
y
Reintroduction: Harvest and Conservation
1
Not listed: excluded from ESU
0.82
Reintroduction: Conservation Reintroduction: Harvest and Conservation
Natural Reproduction only Integrated Hatchery + Supplementation Segregated Hatchery + Supplementation
-
0.20
0.40
0.60
0.80
1.00
- 0.20 0.40 0.60 0.80 1.00pNOB
pH
OS
.5
.9
.8
.7
.6
.4.3.2
PNI
.1
0
50
100
150
200
250
300
350
400
Ha
tch
ery
Ha
bita
t
Ma
rin
e
L. M
ain
ste
m
U.
Ma
inste
m
Te
rmin
al
0
50
100
150
200
250
300
350
400
Ha
tch
ery
Ha
bita
t
Ma
rin
e
L. M
ain
ste
m
U.
Ma
inste
m
Te
rmin
al
0
50
100
150
200
250
300
350
400
Ha
tch
ery
Ha
bita
t
Ma
rin
e
L.
Ma
inste
m
U.
Ma
inste
m
Te
rmin
al
0
50
100
150
200
250
300
350
400
Ha
tch
ery
Ha
bita
t
Ma
rin
e
L.
Ma
inste
m
U.
Ma
inste
m
Te
rmin
al
0
50
100
150
200
250
300
350
400
Ha
tch
ery
Ha
bita
t
Ma
rin
e
L. M
ain
ste
m
U.
Ma
inste
m
Te
rmin
al
Ha
tch
ery
Ha
bita
tM
ari
ne L.
U.
Te
rmin
al
Apply & Recalculate
Update
USFWS Columbia Basin Hatchery Review Team Lower Snake Federal Hatcheries Assessments and Recommendations Reports–March 2011
Appendix A – AHA Output 19
Tables A10-A17: AHA outputs for Clearwater River Major Population
Group (MPG) of summer steelhead

USFWS Columbia Basin Hatchery Review Team Lower Snake Federal Hatcheries Assessments and Recommendations Reports–March 2011
20 Appendix A – AHA Output
Parameters and assumptions for summer steelhead in the Clearwater River Major Population Group (MPG) Productivity and survival parameters for hatchery-origin steelhead released within the Clearwater
River basin (Table 3A) were obtained from the HSRG, as provided by Idaho Department of Fish and
Game (IDFG).
Table 3A. Mean values of reproductive and survival parameters assumed in the AHA analyses
for hatchery-origin steelhead released within the Clearwater River MPG.
Hatchery/
Release location
Population/Stock
Female
Fecundity
(No. of
eggs)
Within-
hatchery
survival
(egg-to-smolt)
Post-release
survival (%)
(smolt-to-
adult)
Recruit/spawner
(R/S; adults)
Dworshak NFH
Dworshak NFH Steelhead
6,848
0.74
0.78%
35.0
Dworshak NFH/
Clear Creek, Kooskia NFH
Dworshak NFH Steelhead
6,848
0.74
0.78%
35.0
Dworshak NFH, Clearwater
FH/
S.F. Clearwater River, Red
House
Dworshak NFH Steelhead
6,848
0.74
0.78%
35.0
Dworshak NFH, Clearwater
FH/
Upper S.F. Clearwater River
Dworshak NFH Steelhead
6,848
0.74
0.78%
35.0
Clearwater FH/
Lolo Creek
Dworshak NFH Steelhead
6,848
0.74
0.78%
35.0
Current programs, HSRG solutions, and HRT alternatives
The HRT modeled Alternative 1 and its preferred alternatives for each of the steelhead hatchery
programs conducted within the Clearwater River basin. Each population release site consists of five
scenarios: Current program, No Hatchery scenario, HSRG Solution, HRT Alternative 1, and the HRT
Preferred Alternative (Table 4A). The HRT Preferred Alternative assumes that reestablishment of
naturally spawning populations is the principal goal of hatchery programs in the upper South Fork
Clearwater River, including natural spawning locations in Crooked River, Red River, American River,
Newsome Creek, Meadow Creek, and Mill Creek. The HRT Preferred Alternative emphasizes harvest
in the lower S.F. Clearwater River (Red House release site) and mainstem Clearwater River
downstream from Clear Creek and Kooskia NFH.
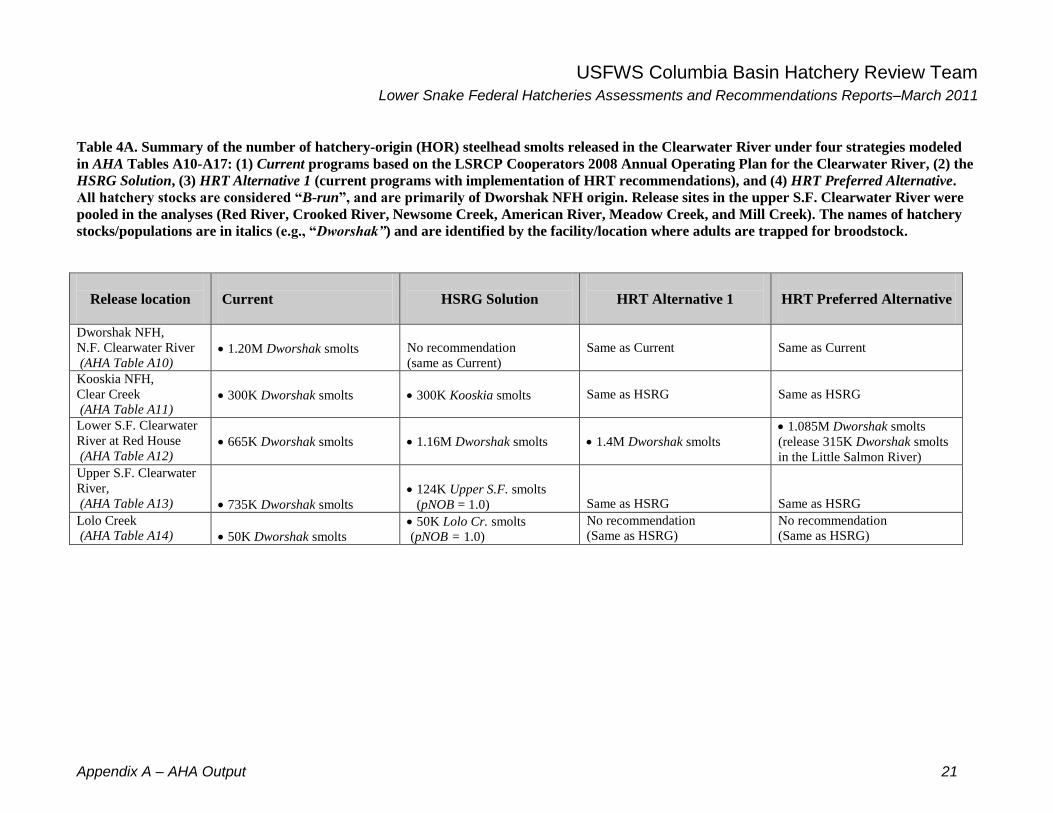
USFWS Columbia Basin Hatchery Review Team Lower Snake Federal Hatcheries Assessments and Recommendations Reports–March 2011
Appendix A – AHA Output 21
Table 4A. Summary of the number of hatchery-origin (HOR) steelhead smolts released in the Clearwater River under four strategies modeled
in AHA Tables A10-A17: (1) Current programs based on the LSRCP Cooperators 2008 Annual Operating Plan for the Clearwater River, (2) the
HSRG Solution, (3) HRT Alternative 1 (current programs with implementation of HRT recommendations), and (4) HRT Preferred Alternative.
All hatchery stocks are considered “B-run”, and are primarily of Dworshak NFH origin. Release sites in the upper S.F. Clearwater River were
pooled in the analyses (Red River, Crooked River, Newsome Creek, American River, Meadow Creek, and Mill Creek). The names of hatchery
stocks/populations are in italics (e.g., “Dworshak”) and are identified by the facility/location where adults are trapped for broodstock.
Release location
Current
HSRG Solution
HRT Alternative 1
HRT Preferred Alternative
Dworshak NFH,
N.F. Clearwater River
(AHA Table A10)
1.20M Dworshak smolts
No recommendation
(same as Current)
Same as Current
Same as Current
Kooskia NFH,
Clear Creek
(AHA Table A11)
300K Dworshak smolts
300K Kooskia smolts
Same as HSRG
Same as HSRG
Lower S.F. Clearwater
River at Red House
(AHA Table A12)
665K Dworshak smolts
1.16M Dworshak smolts
1.4M Dworshak smolts
1.085M Dworshak smolts
(release 315K Dworshak smolts
in the Little Salmon River)
Upper S.F. Clearwater
River,
(AHA Table A13)
735K Dworshak smolts
124K Upper S.F. smolts
(pNOB = 1.0)
Same as HSRG
Same as HSRG
Lolo Creek
(AHA Table A14)
50K Dworshak smolts
50K Lolo Cr. smolts
(pNOB = 1.0)
No recommendation
(Same as HSRG)
No recommendation
(Same as HSRG)

USFWS Columbia Basin Hatchery Review Team: Lower Snake Assessments and Recommendations Reports–March 2011
22 Appendix A – AHA Output
Table A10. AHA output for Dworshak NFH B-run Summer Steelhead, North Fork Clearwater River
Population (Ctrl + Page Up/Down to Scroll)Species/Race Population Management Intent:
Harv&Hatchery Strategy:
Population Recovery Designation:
Ad. Capacity
% Kelt
Sm. Capacity
Ocean Surv Baseline SAR Vary? (Y/N) 0.098 0.018 0.048 0.018 0.048 0.018 0.048 0.018 0.048 0.018 0.048 0.018
Adult Passage
Adj. Capacity
Harv - Marine
Harv - L. Mainstem
Harv - U. Mainstem
Harv -Terminal
Total Exploitation Rate
Broodstock Composition
Type
Local Imported 484 484 484 484
1,500 1,500 1,500 1,500 1,500 1,500 1,500 1,500
Destination for HOR Returns
Productivity of Hatchery Fish
450
7Realized Spawning Composition
Relative Hatchery Optimum -> 80 80 80 80 80
Weir Factor ->
Relative Reproductive Success (HOS) -> 25% 25% 25% 25% 25%
Initial Fitness Factor (A) -> 0.81 0.81 0.81 0.81 0.81
Fitness Factor after 100 generations (B) -> 0.50 1.00 0.50 0.50 0.50
Average Fitness Factor (100 Generations) -> 0.50 0.99 0.50 0.50 0.50
Generations until average fitness is reached -> 12 30 12 12 12
Minimum Hatchery Program (% of BS Goal) -> Effective pHOS -> 1.00 Effective pHOS -> Effective pHOS -> 1.00 Effective pHOS -> 1.00 Effective pHOS -> 1.00
"Fitness Floor" -> 0.5 pNOB -> pNOB -> pNOB -> pNOB -> pNOB ->
Calculated Hatchery SAR ->
Calculated Natural SAR ->
Max Min Max Min Max Min Max Min Max Min
NOR Escapement 0 0 0 0 0 0 0 0 0 0
HoS Total Escapement (includes strays) 1,946 338 1,946 338 1,946 338 1,946 338
Harvest and Conservation
Segregated Hatchery + outplanting
0.010
0.01
0.010
1
0.49
1
N/A
Patterns
Patterns shown here are assigned to the population from
the AHA or ROL file. Red cells indicate patterns are not
assigned to this population/scenario in the rollup
application. The shown pattern needs to be added to the
application, or a different pattern should be assigned to
this population in the ROL/AHA file.
Current Hydro
Current Harvest
Current Hydro
Current Harvest
Current Habitat
Hydro ----->
Current Habitat
Subregion/SubbasinNatural Reproduction only
0.030
pNOB
Clearwater Summer Steelhead
Harvest and Conservation
Hatchery
10%
Harv
1,201,814
1.8%
y
10%
y
1.8%
Current Habitat
Current Hydro
N/A
1 1
0.010
35.0
0.010
Harvest and Conservation
Segregated Hatchery + outplanting
1.4%
Ave
y
N/A
1,201,814
HRT Preferred Alternative
Harvest and Conservation
y
637
0
100%
0.140
pNOB
Harv
pHOS pNOB
SegHarv
100%
pHOS
0.663
0.140 0.140
0.010 0.010
0.030
0.010
0.140 0.140
0.010
0.01 0
1
0.0100.010
y
0.49
Habitat ----->
1.4%
11
0
0.77
0.01 0
0.600
0.663
Recruits/Spawner
1.4%
Current Harvest
35.0Fitness? [Y / N]
1,201,814
0.030
100%
0.600
0.182
Seg
Strays
0
Ave Ave
0
637
None
PNI 100%
Seg
pHOS-Realized
Cons
% to Nat. Spawn. 90% 10%
pNOB-Goal
pHOSpNOB
35.0
90%
y
100%
Current Harvest
Harv
pHOS-Goal
1,201,814
Int/Seg/Step/None
Smolt Release
Seg
1.8%
Current Habitat
1.4%
637
90%
HSRG Solution
0.01
90%
0.663
0.600
0.1820.182
0.770.77
0.010 0.010
0
y
Harvest and Conservation
0.49
N/A
HRT Alternative #1
0
1
0.01
0.77
1
Segregated Hatchery + outplanting
0.600
0.01
0.140
00
0.010
0.140
0.010
1
1.00 0.49
0
y
1.00
% to Hatchery
Purpose
Export Goal/Realized
Cons/Harv/Both
Broodstock by Source
Brood Exported (from HOR Surplus)
Productivity (Adult)
Min NOR EscapeHabitatSmolt Productivity
5-Clearwater_NF Clearwater Summer
Steelhead (B-Run-Hatchery)
y
1
Historic
1
0.01 0
1
1
0.010
0.49
0.01
0.010
HORs 0.010
1
11
0.140
pHOS
0.140
0.182
0.030
0.663
pNOB
0.182
Hydro
Harvest
NORs
NORs
0.01Adjusted Productivity
NORs
Juv Passage Surv.
NORs
NORs HORs
HORs
0.010
HORs
0.030
HORs
0.010
0.140
0.010
0.600
637
1.8%
10%
Current Hydro
Current Harvest
Ave
y
0.663
pHOS
Current Hydro
Current Habitat
0
Ave
1.8%
Segregated Hatchery + outplanting
0.01
N/A
1
0
y
0.77
No HatcheryCurrent
0.01 0 00.01
0
35.0
All H Analyzer (AHA)
Harvest --->
Hatchery
-
0.20
0.40
0.60
0.80
1.00
- 0.20 0.40 0.60 0.80 1.00pNOB
pH
OS
.5
.9
.8
.7
.6
.4.3.2
PNI
.1
0
2,000
4,000
6,000
8,000
10,000
12,000
Ha
tch
ery
Ha
bita
t
Ma
rin
e
L. M
ain
ste
m
U.
Ma
inste
m
Te
rmin
al
0
2,000
4,000
6,000
8,000
10,000
12,000
Ha
tch
ery
Ha
bita
t
Ma
rin
e
L. M
ain
ste
m
U.
Ma
inste
m
Te
rmin
al
0
2,000
4,000
6,000
8,000
10,000
12,000
Ha
tch
ery
Ha
bita
t
Ma
rin
e
L.
Ma
inste
m
U.
Ma
inste
m
Te
rmin
al
0
2,000
4,000
6,000
8,000
10,000
12,000
Ha
tch
ery
Ha
bita
t
Ma
rin
e
L.
Ma
inste
m
U.
Ma
inste
m
Te
rmin
al
0
2,000
4,000
6,000
8,000
10,000
12,000
Ha
tch
ery
Ha
bita
t
Ma
rin
e
L. M
ain
ste
m
U.
Ma
inste
m
Te
rmin
al
Ha
tch
ery
Ha
bita
tM
ari
ne L.
U.
Te
rmin
al
Apply & Recalculate
Update

USFWS Columbia Basin Hatchery Review Team: Lower Snake Assessments and Recommendations Reports–March 2011
Appendix A – AHA Output 23
Table A11. AHA output for Clear Creek B-run Summer Steelhead, Middle Fork Clearwater River (Dworshak NFH)
Population (Ctrl + Page Up/Down to Scroll)Species/Race Population Management Intent:
Harv&Hatchery Strategy:
Population Recovery Designation:
Ad. Capacity
% Kelt
Sm. Capacity
Ocean Surv Baseline SAR Vary? (Y/N) 0.098 0.018 0.048 0.018 0.048 0.018 0.048 0.018 0.048 0.018 0.048 0.018
Adult Passage
Adj. Capacity
Harv - Marine
Harv - L. Mainstem
Harv - U. Mainstem
Harv -Terminal
Total Exploitation Rate
Broodstock Composition
Type
Local Imported 122 122 122 122
Destination for HOR Returns
Productivity of Hatchery Fish
738
9Realized Spawning Composition
Relative Hatchery Optimum -> 80 80 80 80 80
Weir Factor ->
Relative Reproductive Success (HOS) -> 25% 25% 25% 25% 25%
Initial Fitness Factor (A) -> 0.81 0.81 0.81 0.81 0.81
Fitness Factor after 100 generations (B) -> 0.50 1.00 0.50 0.50 0.50
Average Fitness Factor (100 Generations) -> 0.50 0.99 0.50 0.50 0.50
Generations until average fitness is reached -> 13 30 13 15 15
Minimum Hatchery Program (% of BS Goal) -> Effective pHOS -> 0.74 Effective pHOS -> Effective pHOS -> 0.81 Effective pHOS -> 0.56 Effective pHOS -> 0.56
"Fitness Floor" -> 0.5 pNOB -> pNOB -> pNOB -> pNOB -> pNOB ->
Calculated Hatchery SAR ->
Calculated Natural SAR ->
Max Min Max Min Max Min Max Min Max Min
NOR Escapement 153 22 109 12 167 25 114 13 114 13
HoS Total Escapement (includes strays) 1,541 267 2,697 468 490 85 490 85
Harvest mitigation
Segregated Hatchery
0.010
2.00
0.010
5,522
0.49
1
N/A
Patterns
Patterns shown here are assigned to the population from
the AHA or ROL file. Red cells indicate patterns are not
assigned to this population/scenario in the rollup
application. The shown pattern needs to be added to the
application, or a different pattern should be assigned to
this population in the ROL/AHA file.
Current Hydro
Current Harvest
Current Hydro
Current Harvest
Current Habitat
Hydro ----->
Current Habitat
Subregion/SubbasinSegregated Hatchery
0.030
pNOB
Clearwater Summer Steelhead
Harvest mitigation
Hatchery
10%
Harv
302,936
1.8%
y
10%
y
1.8%
Current Habitat
Current Hydro
N/A
110 110
0.010
35.0
0.010
Harvest mitigation
Segregated Hatchery
1.4%
Ave
y
N/A
302,936
HRT Preferred Alternative
Harvest mitigation
y
160
32
81%
0.140
pNOB
Harv
pHOS pNOB
SegHarv
56%
pHOS
0.663
0.140 0.140
0.010 0.010
0.030
0.010
0.140 0.140
0.010
2.00 100
1
0.0100.010
y
0.49
Habitat ----->
0.8%
5,522110
100
0.77
2.00 100
0.600
0.663
Recruits/Spawner
1.4%
Current Harvest
20.0Fitness? [Y / N]
302,936
0.030
56%
0.600
0.182
Seg
Strays
50
Ave Ave
32
160
None
PNI 74%
Seg
pHOS-Realized
Cons
% to Nat. Spawn. 45% 55%
pNOB-Goal
pHOSpNOB
35.0
45%
y
100%
Current Harvest
Harv
pHOS-Goal
302,936
Int/Seg/Step/None
Smolt Release
Seg
1.8%
Current Habitat
1.4%
883
90%
HSRG Solution
2.00
90%
0.663
0.600
0.1820.182
0.770.77
0.010 0.010
100
y
Harvest mitigation
0.49
N/A
HRT Alternative #1
100
1
2.00
0.77
5,522
Segregated Hatchery
0.600
2.00
0.140
100100
0.010
0.140
0.010
5,522
1.00 0.49
45
y
1.00
% to Hatchery
Purpose
Export Goal/Realized
Cons/Harv/Both
Broodstock by Source
Brood Exported (from HOR Surplus)
Productivity (Adult)
Min NOR EscapeHabitatSmolt Productivity
6A-Clearwater_Lower Clearwater Summer
Steelhead (B-Run-Hatchery)
y
5,522
Historic
2,500
2.00 100
50
1
0.010
0.49
2.00
0.010
HORs 0.010
1
110110
0.140
pHOS
0.140
0.182
0.030
0.663
pNOB
0.182
Hydro
Harvest
NORs
NORs
0.91Adjusted Productivity
NORs
Juv Passage Surv.
NORs
NORs HORs
HORs
0.010
HORs
0.030
HORs
0.010
0.140
0.010
0.600
504
1.8%
55%
Current Hydro
Current Harvest
Ave
y
0.663
pHOS
Current Hydro
Current Habitat
34
Ave
1.8%
Segregated Hatchery
2.00
N/A
1
100
y
0.77
No HatcheryCurrent
2.00 100 1002.00
45
35.0
All H Analyzer (AHA)
Harvest --->
Hatchery
-
0.20
0.40
0.60
0.80
1.00
- 0.20 0.40 0.60 0.80 1.00pNOB
pH
OS
.5
.9
.8
.7
.6
.4.3.2
PNI
.1
0
500
1,000
1,500
2,000
2,500
3,000
Ha
tch
ery
Ha
bita
t
Ma
rin
e
L. M
ain
ste
m
U.
Ma
inste
m
Te
rmin
al
0
500
1,000
1,500
2,000
2,500
3,000
Ha
tch
ery
Ha
bita
t
Ma
rin
e
L. M
ain
ste
m
U.
Ma
inste
m
Te
rmin
al
0
500
1,000
1,500
2,000
2,500
3,000
Ha
tch
ery
Ha
bita
t
Ma
rin
e
L.
Ma
inste
m
U.
Ma
inste
m
Te
rmin
al
0
500
1,000
1,500
2,000
2,500
3,000
Ha
tch
ery
Ha
bita
t
Ma
rin
e
L.
Ma
inste
m
U.
Ma
inste
m
Te
rmin
al
0
500
1,000
1,500
2,000
2,500
3,000
Ha
tch
ery
Ha
bita
t
Ma
rin
e
L. M
ain
ste
m
U.
Ma
inste
m
Te
rmin
al
Ha
tch
ery
Ha
bita
tM
ari
ne L.
U.
Te
rmin
al
Apply & Recalculate
Update

USFWS Columbia Basin Hatchery Review Team: Lower Snake Assessments and Recommendations Reports–March 2011
24 Appendix A – AHA Output
Table A12. AHA output for Lower South Fork Clearwater River B-run Summer Steelhead (Dworshak NFH and Clearwater FH)
Population (Ctrl + Page Up/Down to Scroll)Species/Race Population Management Intent:
Harv&Hatchery Strategy:
Population Recovery Designation:
Ad. Capacity
% Kelt
Sm. Capacity
Ocean Surv Baseline SAR Vary? (Y/N) 0.018 0.048 0.018 0.048 0.018 0.048 0.018 0.048 0.018 0.048 0.018
Adult Passage
Adj. Capacity
Harv - Marine
Harv - L. Mainstem
Harv - U. Mainstem
Harv -Terminal
Total Exploitation Rate
Broodstock Composition
Type
Local Imported 268 467 564 438
Destination for HOR Returns
Productivity of Hatchery Fish
449
3Realized Spawning Composition
Relative Hatchery Optimum -> 80 80 80 80 80
Weir Factor ->
Relative Reproductive Success (HOS) -> 25% 80% 25% 25% 25%
Initial Fitness Factor (A) -> 0.81 0.81 0.81 0.81 0.81
Fitness Factor after 100 generations (B) -> 0.50 1.00 0.50 0.50 0.50
Average Fitness Factor (100 Generations) -> 0.50 0.99 0.50 0.50 0.50
Generations until average fitness is reached -> 13 30 13 13 13
Minimum Hatchery Program (% of BS Goal) -> Effective pHOS -> 0.85 Effective pHOS -> Effective pHOS -> 0.90 Effective pHOS -> 0.91 Effective pHOS -> 0.89
"Fitness Floor" -> 0.5 pNOB -> pNOB -> pNOB -> pNOB -> pNOB ->
Calculated Hatchery SAR ->
Calculated Natural SAR ->
Max Min Max Min Max Min Max Min Max Min
NOR Escapement 573 86 136 12 613 97 623 101 608 96
HoS Total Escapement (includes strays) 11,594 2,013 19,509 3,388 23,189 4,027 18,122 3,147
Harvest
Segregated Hatchery
0.010
1.50
0.010
19,326
0.49
1
Stabilizing
Patterns
Patterns shown here are assigned to the population from
the AHA or ROL file. Red cells indicate patterns are not
assigned to this population/scenario in the rollup
application. The shown pattern needs to be added to the
application, or a different pattern should be assigned to
this population in the ROL/AHA file.
Current Hydro
Current Harvest
Current Hydro
Current Harvest
Current Habitat
Hydro ----->
Current Habitat
Subregion/SubbasinNatrual Reproduction only
0.030
pNOB
Clearwater Summer Steelhead
Harvest
Hatchery
100%
168
Harv
1,159,600
1.8%
y
100%
y
1.8%
Current Habitat
Current Hydro
Stabilizing
83 83
0.010
35.0
0.010
Harvest
Segregated Hatchery
1.4%
Ave
y
Stabilizing
1,087,592
HRT Preferred Alternative
Conservation
y
5,935
186
90%
0.140
pNOB
Harv
pHOS pNOB
SegHarv
89%
pHOS
0.663
0.140 0.140
0.010 0.010
0.030
0.010
0.140 0.140
0.010
1.50 350
1
0.0100.010
y
0.49
Habitat ----->
1.4%
19,32683
350
0.77
1.50 350
0.600
0.663
Recruits/Spawner
1.4%
Current Harvest
35.0Fitness? [Y / N]
1,400,458
0.030
91%
0.600
0.182
Seg
Strays
189
Ave Ave
193
7,594
None
PNI 85%
Seg
pHOS-Realized
Cons
% to Nat. Spawn. 100%
pNOB-Goal
pHOSpNOB
35.0y
100%
Current Harvest
Harv
pHOS-Goal
665,467
Int/Seg/Step/None
Smolt Release
Seg
240
1.8%
Current Habitat
1.4%
6,389
HSRG Solution
1.50
168
0.663
0.600
0.1820.182
0.770.77
0.010 0.010
350
y
Harvest
0.49
Stabilizing
HRT Alternative #1
350
1
1.50
0.77
19,326
Segregated Hatchery
0.600
1.50
0.140
350350
0.010
0.140
0.010
19,326
0.49
317
% to Hatchery
Purpose
Export Goal/Realized
Cons/Harv/Both
Broodstock by Source
Brood Exported (from HOR Surplus)
Productivity (Adult)
Min NOR EscapeHabitatSmolt Productivity
3-Clearwater_SF Clearwater Summer
Steelhead (B-Run)
y
19,326
Historic
17,500
1.50 350
75
1
0.010
0.49
1.50
0.010
HORs 0.010
1
8383
0.140
pHOS
0.140
0.182
0.030
0.663
pNOB
0.182
Hydro
Harvest
NORs
NORs
1.36Adjusted Productivity
NORs
Juv Passage Surv.
NORs
NORs HORs
HORs
0.010
HORs
0.030
HORs
0.010
0.140
0.010
0.600
3,796
268
1.8%
100%
Current Hydro
Current Harvest
Ave
y
0.663
pHOS
Current Hydro
Current Habitat
52
Ave
1.8%
Segregated Hatchery
1.50
Stabilizing
1
350
y
0.77
No HatcheryCurrent
1.50 350 3501.50
172
35.0
All H Analyzer (AHA)
Harvest --->
Hatchery
-
0.20
0.40
0.60
0.80
1.00
- 0.20 0.40 0.60 0.80 1.00pNOB
pH
OS
.5
.9
.8
.7
.6
.4.3.2
PNI
.1
0
2,000
4,000
6,000
8,000
10,000
12,000
Ha
tch
ery
Ha
bita
t
Ma
rin
e
L. M
ain
ste
m
U.
Ma
inste
m
Te
rmin
al
0
2,000
4,000
6,000
8,000
10,000
12,000
Ha
tch
ery
Ha
bita
t
Ma
rin
e
L. M
ain
ste
m
U.
Ma
inste
m
Te
rmin
al
0
2,000
4,000
6,000
8,000
10,000
12,000
Ha
tch
ery
Ha
bita
t
Ma
rin
e
L.
Ma
inste
m
U.
Ma
inste
m
Te
rmin
al
0
2,000
4,000
6,000
8,000
10,000
12,000
Ha
tch
ery
Ha
bita
t
Ma
rin
e
L.
Ma
inste
m
U.
Ma
inste
m
Te
rmin
al
0
2,000
4,000
6,000
8,000
10,000
12,000
Ha
tch
ery
Ha
bita
t
Ma
rin
e
L. M
ain
ste
m
U.
Ma
inste
m
Te
rmin
al
Ha
tch
ery
Ha
bita
tM
ari
ne L.
U.
Te
rmin
al
Apply & Recalculate
Update

USFWS Columbia Basin Hatchery Review Team: Lower Snake Assessments and Recommendations Reports–March 2011
Appendix A – AHA Output 25
Table A13. AHA output for Upper South Fork Clearwater River B-run Summer Steelhead (Dworshak NFH and Clearwater FH)
Population (Ctrl + Page Up/Down to Scroll)Species/Race Population Management Intent:
Harv&Hatchery Strategy:
Population Recovery Designation:
Ad. Capacity
% Kelt
Sm. Capacity
Ocean Surv Baseline SAR Vary? (Y/N) 0.018 0.048 0.018 0.048 0.018 0.048 0.018 0.048 0.018 0.048 0.018
Adult Passage
Adj. Capacity
Harv - Marine
Harv - L. Mainstem
Harv - U. Mainstem
Harv -Terminal
Total Exploitation Rate
Broodstock Composition
Type
Local Imported 296 50 50 50
300 300
Destination for HOR Returns
Productivity of Hatchery Fish
827
4Realized Spawning Composition
Relative Hatchery Optimum -> 80 80 80 80 80
Weir Factor ->
Relative Reproductive Success (HOS) -> 25% 80% 80% 80% 80%
Initial Fitness Factor (A) -> 0.81 0.81 0.81 0.81 0.81
Fitness Factor after 100 generations (B) -> 0.50 1.00 0.70 0.70 0.70
Average Fitness Factor (100 Generations) -> 0.50 0.99 0.71 0.71 0.71
Generations until average fitness is reached -> 13 30 35 35 35
Minimum Hatchery Program (% of BS Goal) -> Effective pHOS -> 0.90 Effective pHOS -> Effective pHOS -> 0.83 Effective pHOS -> 0.83 Effective pHOS -> 0.83
"Fitness Floor" -> 0.5 pNOB -> pNOB -> pNOB -> 0.50 pNOB -> 0.50 pNOB -> 0.50
Calculated Hatchery SAR ->
Calculated Natural SAR ->
Max Min Max Min Max Min Max Min Max Min
NOR Escapement 704 113 155 14 723 63 724 63 723 63
HoS Total Escapement (includes strays) 23,910 4,153 3,398 590 3,436 596 3,386 588
Conservation and Harvest
Integrated Hatchery
0.010
1.50
0.010
22,087
0.49
1
Contributing
Patterns
Patterns shown here are assigned to the population from
the AHA or ROL file. Red cells indicate patterns are not
assigned to this population/scenario in the rollup
application. The shown pattern needs to be added to the
application, or a different pattern should be assigned to
this population in the ROL/AHA file.
Current Hydro
Current Harvest
Current Hydro
Current Harvest
Current Habitat
Hydro ----->
Current Habitat
Subregion/SubbasinNatural Reproduction only
100%
0.030
pNOB
Clearwater Summer Steelhead
Conservation and Harvest
Hatchery
0.55
80%
58
Cons
123,906
1.8%
y
80%
y
1.8%
Current Habitat
Current Hydro
Contributing
83 83
0.010
35.0
100%
0.010
Conservation
Integrated Hatchery
1.4%
Ave
y
Contributing
123,906
HRT Preferred Alternative
Conservation
y
1,108
181
83%
0.140
pNOB
Cons
0.55
pHOS pNOB
IntCons
30%30%
83%
pHOS
0.326
0.140 0.140
0.010 0.010
0.030
0.010
0.140 0.140
0.010
1.50 400
1
0.0100.010
y
0.49
Habitat ----->
1.4%
22,08783
400
0.77
1.50 400
0.200
0.326
Recruits/Spawner
1.4%
Current Harvest
35.0Fitness? [Y / N]
123,906
0.030
0.5583%
100%
0.200
0.182
Int
Strays
181
Ave Ave
182
1,125
None
PNI 90%
Seg
pHOS-Realized
Cons
% to Nat. Spawn. 80%
pNOB-Goal
pHOSpNOB
30%
35.0
20%
y
100%
Current Harvest
Both
pHOS-Goal
734,993
Int/Seg/Step/None
Smolt Release
Int
61
1.8%
Current Habitat
1.4%
1,112
20%
HSRG Solution
1.50
74
20%
0.326
0.200
30%
0.1820.182
0.770.77
0.010 0.010
400
y
Conservation
0.49
Contributing
HRT Alternative #1
400
1
1.50
0.77
22,087
Integrated Hatchery
0.200
1.50
0.140
400400
0.010
0.140
0.010
22,087
0.49
362
% to Hatchery
Purpose
Export Goal/Realized
Cons/Harv/Both
Broodstock by Source
Brood Exported (from HOR Surplus)
Productivity (Adult)
Min NOR EscapeHabitatSmolt Productivity
3-Clearwater_SF Clearwater_Crooked River
Summer Steelhead (B-Run)
y
22,087
Historic
20,000
1.50 400
75
1
0.010
0.49
1.50
0.010
HORs 0.010
1
8383
0.140
pHOS
0.140
0.182
0.030
0.326
pNOB
0.182
Hydro
Harvest
NORs
NORs
1.36Adjusted Productivity
NORs
Juv Passage Surv.
NORs
NORs HORs
HORs
0.010
HORs
0.030
HORs
0.010
0.140
0.010
0.200
7,830
35
1.8%
100%
Current Hydro
Current Harvest
Ave
y
0.326
pHOS
Current Hydro
Current Habitat
59
Ave
1.8%
Segregated Hatchery
1.50
Contributing
1
400
y
0.77
No HatcheryCurrent
1.50 400 4001.50
217
35.0
All H Analyzer (AHA)
Harvest --->
Hatchery
-
0.20
0.40
0.60
0.80
1.00
- 0.20 0.40 0.60 0.80 1.00pNOB
pH
OS
.5
.9
.8
.7
.6
.4.3.2
PNI
.1
0
1,000
2,000
3,000
4,000
5,000
6,000
7,000
8,000
9,000
Ha
tch
ery
Ha
bita
t
Ma
rin
e
L. M
ain
ste
m
U.
Ma
inste
m
Te
rmin
al
0
1,000
2,000
3,000
4,000
5,000
6,000
7,000
8,000
9,000
Ha
tch
ery
Ha
bita
t
Ma
rin
e
L. M
ain
ste
m
U.
Ma
inste
m
Te
rmin
al
0
1,000
2,000
3,000
4,000
5,000
6,000
7,000
8,000
9,000
Ha
tch
ery
Ha
bita
t
Ma
rin
e
L.
Ma
inste
m
U.
Ma
inste
m
Te
rmin
al
0
1,000
2,000
3,000
4,000
5,000
6,000
7,000
8,000
9,000
Ha
tch
ery
Ha
bita
t
Ma
rin
e
L.
Ma
inste
m
U.
Ma
inste
m
Te
rmin
al
0
1,000
2,000
3,000
4,000
5,000
6,000
7,000
8,000
9,000
Ha
tch
ery
Ha
bita
t
Ma
rin
e
L. M
ain
ste
m
U.
Ma
inste
m
Te
rmin
al
Ha
tch
ery
Ha
bita
tM
ari
ne L.
U.
Te
rmin
al
Apply & Recalculate
Update

USFWS Columbia Basin Hatchery Review Team: Lower Snake Assessments and Recommendations Reports–March 2011
26 Appendix A – AHA Output
Table A14. AHA output for Lolo Creek A+B-run Summer Steelhead (Clearwater Fish Hatchery)
Population (Ctrl + Page Up/Down to Scroll)Species/Race Population Management Intent:
Harv&Hatchery Strategy:
Population Recovery Designation:
Ad. Capacity
% Kelt
Sm. Capacity
Ocean Surv Baseline SAR Vary? (Y/N) 0.098 0.018 0.048 0.018 0.048 0.018 0.048 0.018 0.048 0.018 0.048 0.018
Adult Passage
Adj. Capacity
Harv - Marine
Harv - L. Mainstem
Harv - U. Mainstem
Harv -Terminal
Total Exploitation Rate
Broodstock Composition
Type
Local Imported 20 20 20 20
Destination for HOR Returns
Productivity of Hatchery Fish
744
6Realized Spawning Composition
Relative Hatchery Optimum -> 80 80 80 80 80
Weir Factor ->
Relative Reproductive Success (HOS) -> 25% 80% 80% 80% 80%
Initial Fitness Factor (A) -> 0.81 0.81 0.81 0.81 0.81
Fitness Factor after 100 generations (B) -> 0.50 1.00 0.70 0.70 0.73
Average Fitness Factor (100 Generations) -> 0.50 0.99 0.71 0.71 0.74
Generations until average fitness is reached -> 14 30 35 35 31
Minimum Hatchery Program (% of BS Goal) -> Effective pHOS -> 0.68 Effective pHOS -> Effective pHOS -> 0.83 Effective pHOS -> 0.83 Effective pHOS -> 0.73
"Fitness Floor" -> 0.5 pNOB -> pNOB -> pNOB -> 0.50 pNOB -> 0.50 pNOB -> 0.50
Calculated Hatchery SAR ->
Calculated Natural SAR ->
Max Min Max Min Max Min Max Min Max Min
NOR Escapement 319 43 283 33 439 53 439 53 418 45
HoS Total Escapement (includes strays) 2,342 407 2,447 425 2,431 422 1,321 229
Harvest and Conservation
Integrated Hatchery + supplementation
0.010
2.00
0.010
11,043
0.49
1
Contributing
Patterns
Patterns shown here are assigned to the population from
the AHA or ROL file. Red cells indicate patterns are not
assigned to this population/scenario in the rollup
application. The shown pattern needs to be added to the
application, or a different pattern should be assigned to
this population in the ROL/AHA file.
Current Hydro
Current Harvest
Current Hydro
Current Harvest
Current Habitat
Hydro ----->
Current Habitat
Subregion/SubbasinNatural Reproduction only
100%
0.030
pNOB
Clearwater Summer Steelhead
Harvest and Conservation
Hatchery
0.55
50%
85
Cons
49,413
1.8%
y
100%
y
1.8%
Current Habitat
Current Hydro
Contributing
110 110
0.010
35.0
100%
0.010
Harvest and Conservation
Integrated Hatchery + supplementation
1.4%
Ave
y
Contributing
49,413
HRT Preferred Alternative
Conservation
y
432
112
83%
0.060
pNOB
Cons
0.55
pHOS pNOB
IntCons
30%30%
73%
pHOS
0.106
0.060 0.060
0.010 0.010
0.030
0.010
0.060 0.060
0.010
2.00 200
1
0.0100.010
y
0.49
Habitat ----->
1.4%
11,043110
200
0.77
2.00 200
0.030
0.106
Recruits/Spawner
1.4%
Current Harvest
35.0Fitness? [Y / N]
49,413
0.030
0.5883%
100%
0.030
0.106
Int
Strays
122
Ave Ave
122
796
None
PNI 68%
Seg
pHOS-Realized
None
% to Nat. Spawn. 10% 100%
pNOB-Goal
pHOSpNOB
30%
35.0y
100%
Current Harvest
Cons
pHOS-Goal
49,662
Int/Seg/Step/None
Smolt Release
Int
107
1.8%
Current Habitat
1.4%
801
50%
HSRG Solution
2.00
102
0.106
0.030
30%
0.1060.106
0.770.77
0.010 0.010
200
y
Harvest and Conservation
0.49
Contributing
HRT Alternative #1
200
1
2.00
0.77
11,043
Integrated Hatchery + supplementation
0.030
2.00
0.060
200200
0.010
0.060
0.010
11,043
1.00 0.49
181
y
1.00
% to Hatchery
Purpose
Export Goal/Realized
Cons/Harv/Both
Broodstock by Source
Brood Exported (from HOR Surplus)
Productivity (Adult)
Min NOR EscapeHabitatSmolt Productivity
4-Clearwater_Lolo Summer Steelhead (A+B-
Run)
y
11,043
Historic
10,000
2.00 200
100
1
0.010
0.49
2.00
0.010
HORs 0.010
1
110110
0.060
pHOS
0.060
0.106
0.030
0.106
pNOB
0.106
Hydro
Harvest
NORs
NORs
1.81Adjusted Productivity
NORs
Juv Passage Surv.
NORs
NORs HORs
HORs
0.010
HORs
0.030
HORs
0.010
0.060
0.010
0.030
767
139
1.8%
90%
Current Hydro
Current Harvest
Ave
y
0.106
pHOS
Current Hydro
Current Habitat
85
Ave
1.8%
Segregated Hatchery + supplementation
2.00
Contributing
1
200
y
0.77
No HatcheryCurrent
2.00 200 2002.00
92
35.0
All H Analyzer (AHA)
Harvest --->
Hatchery
-
0.20
0.40
0.60
0.80
1.00
- 0.20 0.40 0.60 0.80 1.00pNOB
pH
OS
.5
.9
.8
.7
.6
.4.3.2
PNI
.1
0
100
200
300
400
500
600
700
800
900
1,000
Ha
tch
ery
Ha
bita
t
Ma
rin
e
L. M
ain
ste
m
U.
Ma
inste
m
Te
rmin
al
0
100
200
300
400
500
600
700
800
900
1,000
Ha
tch
ery
Ha
bita
t
Ma
rin
e
L. M
ain
ste
m
U.
Ma
inste
m
Te
rmin
al
0
100
200
300
400
500
600
700
800
900
1,000
Ha
tch
ery
Ha
bita
t
Ma
rin
e
L.
Ma
inste
m
U.
Ma
inste
m
Te
rmin
al
0
100
200
300
400
500
600
700
800
900
1,000
Ha
tch
ery
Ha
bita
t
Ma
rin
e
L.
Ma
inste
m
U.
Ma
inste
m
Te
rmin
al
0
100
200
300
400
500
600
700
800
900
1,000
Ha
tch
ery
Ha
bita
t
Ma
rin
e
L. M
ain
ste
m
U.
Ma
inste
m
Te
rmin
al
Ha
tch
ery
Ha
bita
tM
ari
ne L.
U.
Te
rmin
al
Apply & Recalculate
Update

USFWS Columbia Basin Hatchery Review Team: Lower Snake Assessments and Recommendations Reports–March 2011
Appendix A – AHA Output 27
Table A15. AHA output for Lower Clearwater River A-run Summer Steelhead
Population (Ctrl + Page Up/Down to Scroll)Species/Race Population Management Intent:
Harv&Hatchery Strategy:
Population Recovery Designation:
Ad. Capacity
% Kelt
Sm. Capacity
Ocean Surv Baseline SAR Vary? (Y/N) 0.020 0.053 0.020 0.053 0.020 0.053 0.020 0.053 0.020 0.053 0.020
Adult Passage
Adj. Capacity
Harv - Marine
Harv - L. Mainstem
Harv - U. Mainstem
Harv -Terminal
Total Exploitation Rate
Broodstock Composition
Type
Local Imported
Destination for HOR Returns
Productivity of Hatchery Fish
447
8Realized Spawning Composition
Relative Hatchery Optimum -> 80 80 80 80 80
Weir Factor ->
Relative Reproductive Success (HOS) -> 25% 25% 25% 25% 25%
Initial Fitness Factor (A) -> 0.81 0.81 0.81 0.81 0.81
Fitness Factor after 100 generations (B) -> 0.91 1.00 0.86 0.95 0.95
Average Fitness Factor (100 Generations) -> 0.92 0.99 0.89 0.95 0.95
Generations until average fitness is reached -> 18 30 11 25 25
Minimum Hatchery Program (% of BS Goal) -> Effective pHOS -> 0.01 Effective pHOS -> Effective pHOS -> 0.02 Effective pHOS -> 0.01 Effective pHOS -> 0.01
"Fitness Floor" -> 0.5 pNOB -> pNOB -> pNOB -> pNOB -> pNOB ->
Calculated Hatchery SAR ->
Calculated Natural SAR ->
Max Min Max Min Max Min Max Min Max Min
NOR Escapement 3,501 528 3,695 567 3,393 504 3,585 546 3,585 546
HoS Total Escapement (includes strays) 176 31 234 41 123 21 123 21
Conservation
Natural Reproduction only
0.010
5.21
0.010
71,511
0.49
1
Primary
Patterns
Patterns shown here are assigned to the population from
the AHA or ROL file. Red cells indicate patterns are not
assigned to this population/scenario in the rollup
application. The shown pattern needs to be added to the
application, or a different pattern should be assigned to
this population in the ROL/AHA file.
Current Hydro
Current Harvest
Current Hydro
Current Harvest
Current Habitat
Hydro ----->
Current Habitat
Subregion/SubbasinNatural Reproduction only
0.030
pNOB
Clearwater Summer Steelhead
Conservation
Hatchery
100%
40
None
2.0%
y
100%
y
2.0%
Current Habitat
Current Hydro
Primary
261 261
0.010
35.0
0.010
Conservation
Natural Reproduction only
3.5%
Ave
y
Primary
HRT Preferred Alternative
Conservation
y
40
1,081
2%
0.060
pNOB
None
pHOS pNOB
NoneNone
5%5%
1%
pHOS
0.106
0.060 0.060
0.010 0.010
0.030
0.010
0.060 0.060
0.010
5.21 1,430
1
0.0100.010
y
0.49
Habitat ----->
3.5%
71,511261
1,430
0.77
5.21 1,430
0.030
0.106
Recruits/Spawner
3.5%
Current Harvest
35.0Fitness? [Y / N]
0.030
1%
0.030
0.106
None
Strays
1,025
Ave Ave
1,081
40
None
PNI 1%
None
pHOS-Realized
None
% to Nat. Spawn. 100%
pNOB-Goal
pHOSpNOB
5%
35.0y
100%
Current Harvest
None
pHOS-Goal
Int/Seg/Step/None
Smolt Release
None
76
2.0%
Current Habitat
3.5%
76
HSRG Solution
5.21
40
0.106
0.030
5%
0.1060.106
0.770.77
0.010 0.010
1,430
y
Conservation
0.49
Primary
HRT Alternative #1
1,430
1
5.21
0.77
71,511
Natural Reproduction only
0.030
5.21
0.060
1,4301,430
0.010
0.060
0.010
71,511
0.49
1,430
% to Hatchery
Purpose
Export Goal/Realized
Cons/Harv/Both
Broodstock by Source
Brood Exported (from HOR Surplus)
Productivity (Adult)
Min NOR EscapeHabitatSmolt Productivity
6-Clearwater_Lower Clearwater Summer
Steelhead (A-Run)
y
71,511
Historic
71,500
5.21 1,430
261
1
0.010
0.49
5.21
0.010
HORs 0.010
1
261261
0.060
pHOS
0.060
0.106
0.030
0.106
pNOB
0.106
Hydro
Harvest
NORs
NORs
5.21Adjusted Productivity
NORs
Juv Passage Surv.
NORs
NORs HORs
HORs
0.010
HORs
0.030
HORs
0.010
0.060
0.010
0.030
58
58
2.0%
100%
Current Hydro
Current Harvest
Ave
y
0.106
5%
pHOS
Current Hydro
Current Habitat
1,115
Ave
2.0%
Natural Reproduction only
5.21
Primary
1
1,430
y
0.77
No HatcheryCurrent
5.21 1,430 1,4305.21
1,056
35.0
All H Analyzer (AHA)
Harvest --->
Hatchery
-
0.20
0.40
0.60
0.80
1.00
- 0.20 0.40 0.60 0.80 1.00pNOB
pH
OS
.5
.9
.8
.7
.6
.4.3.2
PNI
.1
0
200
400
600
800
1,000
1,200
Ha
tch
ery
Ha
bita
t
Ma
rin
e
L. M
ain
ste
m
U.
Ma
inste
m
Te
rmin
al
0
200
400
600
800
1,000
1,200
Ha
tch
ery
Ha
bita
t
Ma
rin
e
L. M
ain
ste
m
U.
Ma
inste
m
Te
rmin
al
0
200
400
600
800
1,000
1,200
Ha
tch
ery
Ha
bita
t
Ma
rin
e
L.
Ma
inste
m
U.
Ma
inste
m
Te
rmin
al
0
200
400
600
800
1,000
1,200
Ha
tch
ery
Ha
bita
t
Ma
rin
e
L.
Ma
inste
m
U.
Ma
inste
m
Te
rmin
al
0
200
400
600
800
1,000
1,200
Ha
tch
ery
Ha
bita
t
Ma
rin
e
L. M
ain
ste
m
U.
Ma
inste
m
Te
rmin
al
Ha
tch
ery
Ha
bita
tM
ari
ne L.
U.
Te
rmin
al
Apply & Recalculate
Update
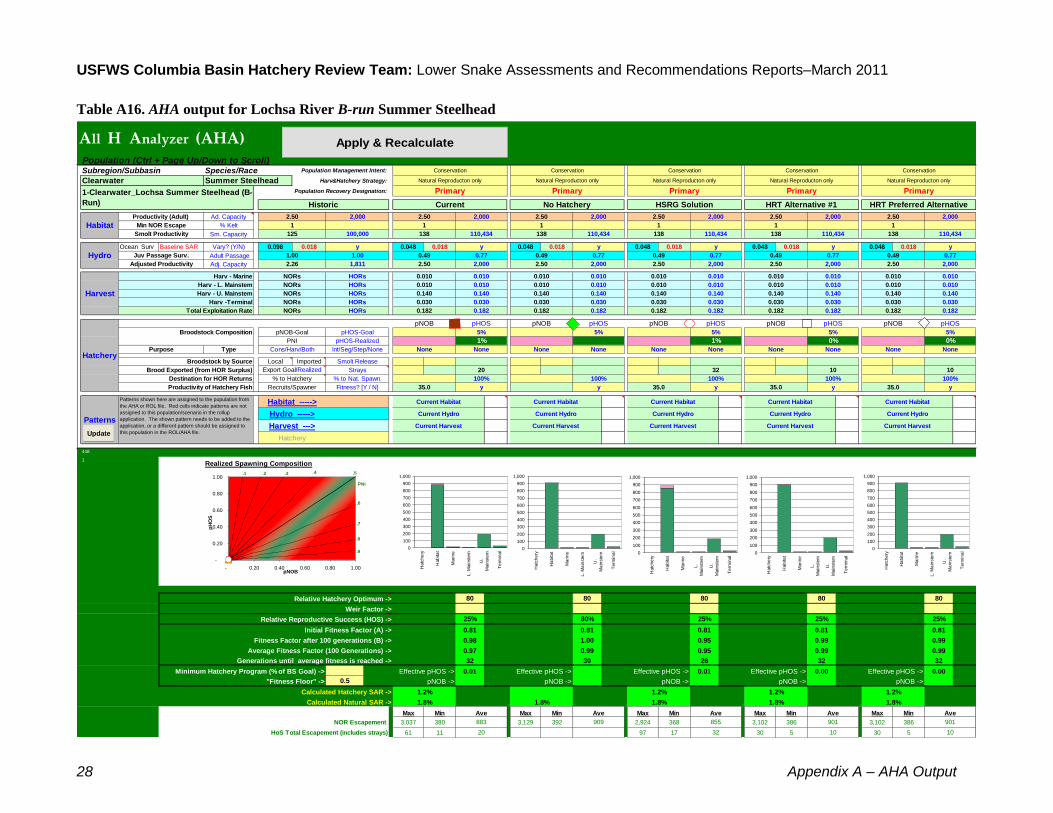
USFWS Columbia Basin Hatchery Review Team: Lower Snake Assessments and Recommendations Reports–March 2011
28 Appendix A – AHA Output
Table A16. AHA output for Lochsa River B-run Summer Steelhead
Population (Ctrl + Page Up/Down to Scroll)Species/Race Population Management Intent:
Harv&Hatchery Strategy:
Population Recovery Designation:
Ad. Capacity
% Kelt
Sm. Capacity
Ocean Surv Baseline SAR Vary? (Y/N) 0.098 0.018 0.048 0.018 0.048 0.018 0.048 0.018 0.048 0.018 0.048 0.018
Adult Passage
Adj. Capacity
Harv - Marine
Harv - L. Mainstem
Harv - U. Mainstem
Harv -Terminal
Total Exploitation Rate
Broodstock Composition
Type
Local Imported
Destination for HOR Returns
Productivity of Hatchery Fish
448
1Realized Spawning Composition
Relative Hatchery Optimum -> 80 80 80 80 80
Weir Factor ->
Relative Reproductive Success (HOS) -> 25% 80% 25% 25% 25%
Initial Fitness Factor (A) -> 0.81 0.81 0.81 0.81 0.81
Fitness Factor after 100 generations (B) -> 0.98 1.00 0.95 0.99 0.99
Average Fitness Factor (100 Generations) -> 0.97 0.99 0.95 0.99 0.99
Generations until average fitness is reached -> 32 30 26 32 32
Minimum Hatchery Program (% of BS Goal) -> Effective pHOS -> 0.01 Effective pHOS -> Effective pHOS -> 0.01 Effective pHOS -> 0.00 Effective pHOS -> 0.00
"Fitness Floor" -> 0.5 pNOB -> pNOB -> pNOB -> pNOB -> pNOB ->
Calculated Hatchery SAR ->
Calculated Natural SAR ->
Max Min Max Min Max Min Max Min Max Min
NOR Escapement 3,037 380 3,129 392 2,924 368 3,102 386 3,102 386
HoS Total Escapement (includes strays) 61 11 97 17 30 5 30 5
Conservation
Natural Reproducton only
0.010
2.50
0.010
110,434
0.49
1
Primary
Patterns
Patterns shown here are assigned to the population from
the AHA or ROL file. Red cells indicate patterns are not
assigned to this population/scenario in the rollup
application. The shown pattern needs to be added to the
application, or a different pattern should be assigned to
this population in the ROL/AHA file.
Current Hydro
Current Harvest
Current Hydro
Current Harvest
Current Habitat
Hydro ----->
Current Habitat
Subregion/SubbasinNatural Reproducton only
0.030
pNOB
Clearwater Summer Steelhead
Conservation
Hatchery
100%
10
None
1.8%
y
100%
y
1.8%
Current Habitat
Current Hydro
Primary
138 138
0.010
35.0
0.010
Conservation
Natural Reproducton only
1.2%
Ave
y
Primary
HRT Preferred Alternative
Conservation
y
10
901
1%
0.140
pNOB
None
pHOS pNOB
NoneNone
5%5%
0%
pHOS
0.182
0.140 0.140
0.010 0.010
0.030
0.010
0.140 0.140
0.010
2.50 2,000
1
0.0100.010
y
0.49
Habitat ----->
1.2%
110,434138
2,000
0.77
2.50 2,000
0.030
0.182
Recruits/Spawner
1.2%
Current Harvest
35.0Fitness? [Y / N]
0.030
0%
0.030
0.182
None
Strays
855
Ave Ave
901
10
None
PNI 1%
None
pHOS-Realized
None
% to Nat. Spawn. 100%
pNOB-Goal
pHOSpNOB
5%
35.0y
100%
Current Harvest
None
pHOS-Goal
Int/Seg/Step/None
Smolt Release
None
32
1.8%
Current Habitat
1.2%
32
HSRG Solution
2.50
10
0.182
0.030
5%
0.1820.182
0.770.77
0.010 0.010
2,000
y
Conservation
0.49
Primary
HRT Alternative #1
2,000
1
2.50
0.77
110,434
Natural Reproducton only
0.030
2.50
0.140
2,0002,000
0.010
0.140
0.010
110,434
1.00 0.49
1,811
y
1.00
% to Hatchery
Purpose
Export Goal/Realized
Cons/Harv/Both
Broodstock by Source
Brood Exported (from HOR Surplus)
Productivity (Adult)
Min NOR EscapeHabitatSmolt Productivity
1-Clearwater_Lochsa Summer Steelhead (B-
Run)
y
110,434
Historic
100,000
2.50 2,000
125
1
0.010
0.49
2.50
0.010
HORs 0.010
1
138138
0.140
pHOS
0.140
0.182
0.030
0.182
pNOB
0.182
Hydro
Harvest
NORs
NORs
2.26Adjusted Productivity
NORs
Juv Passage Surv.
NORs
NORs HORs
HORs
0.010
HORs
0.030
HORs
0.010
0.140
0.010
0.030
20
20
1.8%
100%
Current Hydro
Current Harvest
Ave
y
0.182
5%
pHOS
Current Hydro
Current Habitat
909
Ave
1.8%
Natural Reproducton only
2.50
Primary
1
2,000
y
0.77
No HatcheryCurrent
2.50 2,000 2,0002.50
883
35.0
All H Analyzer (AHA)
Harvest --->
Hatchery
-
0.20
0.40
0.60
0.80
1.00
- 0.20 0.40 0.60 0.80 1.00pNOB
pH
OS
.5
.9
.8
.7
.6
.4.3.2
PNI
.1
0
100
200
300
400
500
600
700
800
900
1,000
Ha
tch
ery
Ha
bita
t
Ma
rin
e
L. M
ain
ste
m
U.
Ma
inste
m
Te
rmin
al
0
100
200
300
400
500
600
700
800
900
1,000
Ha
tch
ery
Ha
bita
t
Ma
rin
e
L. M
ain
ste
m
U.
Ma
inste
m
Te
rmin
al
0
100
200
300
400
500
600
700
800
900
1,000
Ha
tch
ery
Ha
bita
t
Ma
rin
e
L.
Ma
inste
m
U.
Ma
inste
m
Te
rmin
al
0
100
200
300
400
500
600
700
800
900
1,000
Ha
tch
ery
Ha
bita
t
Ma
rin
e
L.
Ma
inste
m
U.
Ma
inste
m
Te
rmin
al
0
100
200
300
400
500
600
700
800
900
1,000
Ha
tch
ery
Ha
bita
t
Ma
rin
e
L. M
ain
ste
m
U.
Ma
inste
m
Te
rmin
al
Ha
tch
ery
Ha
bita
tM
ari
ne L.
U.
Te
rmin
al
Apply & Recalculate
Update

USFWS Columbia Basin Hatchery Review Team: Lower Snake Assessments and Recommendations Reports–March 2011
Appendix A – AHA Output 29
Table A17. AHA output for B-run Selway River Summer Steelhead
Population (Ctrl + Page Up/Down to Scroll)Species/Race Population Management Intent:
Harv&Hatchery Strategy:
Population Recovery Designation:
Ad. Capacity
% Kelt
Sm. Capacity
Ocean Surv Baseline SAR Vary? (Y/N) 0.098 0.018 0.048 0.018 0.048 0.018 0.048 0.018 0.048 0.018 0.048 0.018
Adult Passage
Adj. Capacity
Harv - Marine
Harv - L. Mainstem
Harv - U. Mainstem
Harv -Terminal
Total Exploitation Rate
Broodstock Composition
Type
Local Imported
Destination for HOR Returns
Productivity of Hatchery Fish
521
2Realized Spawning Composition
Relative Hatchery Optimum -> 80 80 80 80 80
Weir Factor ->
Relative Reproductive Success (HOS) -> 25% 25% 25% 25% 25%
Initial Fitness Factor (A) -> 0.81 0.81 0.81 0.81 0.81
Fitness Factor after 100 generations (B) -> 0.99 1.00 0.97 1.00 1.00
Average Fitness Factor (100 Generations) -> 0.98 0.99 0.96 0.99 0.99
Generations until average fitness is reached -> 33 30 30 32 32
Minimum Hatchery Program (% of BS Goal) -> Effective pHOS -> 0.00 Effective pHOS -> Effective pHOS -> 0.01 Effective pHOS -> 0.00 Effective pHOS -> 0.00
"Fitness Floor" -> 0.5 pNOB -> pNOB -> pNOB -> pNOB -> pNOB ->
Calculated Hatchery SAR ->
Calculated Natural SAR ->
Max Min Max Min Max Min Max Min Max Min
NOR Escapement 3,842 479 3,911 489 3,754 472 3,893 485 3,893 485
HoS Total Escapement (includes strays) 57 10 91 16 25 4 25 4
Conservation
Natural Reproduction only
0.010
2.50
0.010
138,046
0.49
1
Primary
Patterns
Patterns shown here are assigned to the population from
the AHA or ROL file. Red cells indicate patterns are not
assigned to this population/scenario in the rollup
application. The shown pattern needs to be added to the
application, or a different pattern should be assigned to
this population in the ROL/AHA file.
Current Hydro
Current Harvest
Current Hydro
Current Harvest
Current Habitat
Hydro ----->
Current Habitat
Subregion/SubbasinNatural Reproduction only
0.030
pNOB
Clearwater Summer Steelhead
Conservation
Hatchery
100%
8
None
1.8%
y
100%
y
1.8%
Current Habitat
Current Hydro
Primary
138 138
0.010
35.0
0.010
Conservation
Natural Reproduction only
1.2%
Ave
y
Primary
HRT Preferred Alternative
Conservation
y
8
1,130
1%
0.140
pNOB
None
pHOS pNOB
NoneNone
5%5%
0%
pHOS
0.182
0.140 0.140
0.010 0.010
0.030
0.010
0.140 0.140
0.010
2.50 2,500
1
0.0100.010
y
0.49
Habitat ----->
1.2%
138,046138
2,500
0.77
2.50 2,500
0.030
0.182
Recruits/Spawner
1.2%
Current Harvest
35.0Fitness? [Y / N]
0.030
0%
0.030
0.182
None
Strays
1,094
Ave Ave
1,130
8
None
PNI 0%
None
pHOS-Realized
None
% to Nat. Spawn. 100%
pNOB-Goal
pHOSpNOB
5%
35.0y
100%
Current Harvest
None
pHOS-Goal
Int/Seg/Step/None
Smolt Release
None
30
1.8%
Current Habitat
1.2%
30
HSRG Solution
2.50
8
0.182
0.030
5%
0.1820.182
0.770.77
0.010 0.010
2,500
y
Conservation
0.49
Primary
HRT Alternative #1
2,500
1
2.50
0.77
138,046
Natural Reproduction only
0.030
2.50
0.140
2,5002,500
0.010
0.140
0.010
138,046
1.00 0.49
2,264
y
1.00
% to Hatchery
Purpose
Export Goal/Realized
Cons/Harv/Both
Broodstock by Source
Brood Exported (from HOR Surplus)
Productivity (Adult)
Min NOR EscapeHabitatSmolt Productivity
2-Clearwater_Selway Summer Steelhead (B-
Run)
y
138,046
Historic
125,000
2.50 2,500
125
1
0.010
0.49
2.50
0.010
HORs 0.010
1
138138
0.140
pHOS
0.140
0.182
0.030
0.182
pNOB
0.182
Hydro
Harvest
NORs
NORs
2.26Adjusted Productivity
NORs
Juv Passage Surv.
NORs
NORs HORs
HORs
0.010
HORs
0.030
HORs
0.010
0.140
0.010
0.030
19
19
1.8%
100%
Current Hydro
Current Harvest
Ave
y
0.182
5%
pHOS
Current Hydro
Current Habitat
1,136
Ave
1.8%
Natural Reproduction only
2.50
Primary
1
2,500
y
0.77
No HatcheryCurrent
2.50 2,500 2,5002.50
1,116
35.0
All H Analyzer (AHA)
Harvest --->
Hatchery
-
0.20
0.40
0.60
0.80
1.00
- 0.20 0.40 0.60 0.80 1.00pNOB
pH
OS
.5
.9
.8
.7
.6
.4.3.2
PNI
.1
0
200
400
600
800
1,000
1,200
Ha
tch
ery
Ha
bita
t
Ma
rin
e
L. M
ain
ste
m
U.
Ma
inste
m
Te
rmin
al
0
200
400
600
800
1,000
1,200
Ha
tch
ery
Ha
bita
t
Ma
rin
e
L. M
ain
ste
m
U.
Ma
inste
m
Te
rmin
al
0
200
400
600
800
1,000
1,200
Ha
tch
ery
Ha
bita
t
Ma
rin
e
L.
Ma
inste
m
U.
Ma
inste
m
Te
rmin
al
0
200
400
600
800
1,000
1,200
Ha
tch
ery
Ha
bita
t
Ma
rin
e
L.
Ma
inste
m
U.
Ma
inste
m
Te
rmin
al
0
200
400
600
800
1,000
1,200
Ha
tch
ery
Ha
bita
t
Ma
rin
e
L. M
ain
ste
m
U.
Ma
inste
m
Te
rmin
al
Ha
tch
ery
Ha
bita
tM
ari
ne L.
U.
Te
rmin
al
Apply & Recalculate
Update

USFWS Columbia Basin Hatchery Review Team Lower Snake Federal Hatcheries Assessments and Recommendations Reports–March 2011
30 Appendix A – AHA Output
Tables A18-A39: AHA outputs for Salmon River Summer Steelhead

USFWS Columbia Basin Hatchery Review Team Lower Snake Federal Hatcheries Assessments and Recommendations Reports–March 2011
Appendix A – AHA Output 31
Parameters and assumptions for Salmon River steelhead
Steelhead smolts from several hatchery populations are currently released into the Salmon River
drainage. These hatchery populations include Sawtooth Hatchery steelhead (A-run), Pahsimeroi
Hatchery steelhead (A-run), Oxbow Hatchery steelhead (A-run), Dworshak NFH steelhead (B-run),
Squaw Creek B-run hatchery steelhead representing the offspring/descendants of Dworshak NFH
steelhead returning to Squaw Creek, and East Fork “Naturals” steelhead (A/B run) which are the
offspring/descendants of natural-origin steelhead trapped in the East Fork Salmon River. Each of these
steelhead stocks has characteristic mean female fecundities, mean egg-to-smolt survivals depending on
hatchery, mean smolt-to-adult survival rates, and mean numbers adult recruits per adult spawner (R/S).
Values of these various parameters for generating AHA Tables A18-A39 are presented in Table 5A.
Table 5A. Mean values of reproductive and survival parameters assumed in the AHA analyses
for hatchery-origin steelhead released within the Salmon River drainage (data obtained from the
HSRG). Some of the values below represent updated estimates obtained by the HRT.
Hatchery/
Release location
Population/Stock
Fecundity
(No. of
eggs)
Within-
hatchery
egg-to-smolt
survival
Salmon
River
smolt-to-
adult
survival (%)
Recruit/spawner
(R/S; adults)
Hagerman NFH, Magic Valley
FH, Niagara Springs FH/
Salmon River basin
Oxford, Pahsimeroi, and
Sawtooth Hatchery A-run
Steelhead
4,912
0.75
0.70%
12.9
Hagerman NFH, Magic Valley
FH/
Salmon River basin
Dworshak NFH B-run
Steelhead
6,848
0.56
0.14%
2.5
Clearwater FH/
Little Salmon River
Dworshak NFH B-run
Steelhead
6,848
0.75
0.14%
3.4
Magic Valley FH, Niagara
Springs FH/ Salmon River
basin
Localized B-run Steelhead
6,000
0.67
0.40%
7.8
Magic Valley FH/
E.F. Salmon River, Current
East Fork “Naturals”
steelhead
6,000
0.70
0.19%
4.0
Magic Valley FH/
Salmon River basin, under
HSRG
and HRT recommendations
East Fork “Naturals”
steelhead
6,000
0.70
0.34%
7.1

USFWS Columbia Basin Hatchery Review Team Lower Snake Federal Hatcheries Assessments and Recommendations Reports–March 2011
32 Appendix A – AHA Output
Current programs, HSRG solutions, and HRT alternatives
Tables A18-A39 simulate published HSRG solutions and two sets of HRT alternatives referred to as
HRT Alternatives A and HRT Alternatives B. HRT Alternatives A and B are identical except HRT
Alternative A models a localized hatchery population of B-run steelhead on the Pahsimeroi River,
whereas HRT Alternative B terminates all B-run hatchery programs and replaces those released
numbers of fish with A-run steelhead (Table 6A).
The HSRG solutions and the two HRT sets of alternatives modeled here terminate the annual transfer
and outplanting of Dworshak NFH B-run steelhead smolts in the East Fork Salmon River and at
Squaw Creek. Instead, the HSRG Solution and HRT Alternative “A” scenarios are based on the
development of localized hatchery populations of B-run steelhead for the upper Salmon River. The
HSRG Solution models this “localized” hatchery population for the East Fork Salmon River, assuming
construction of a new weir in the East Fork immediately upstream from its confluence with the
mainstem Salmon River. HRT Alternative A models a localized hatchery broodstock on the Pahsimeroi
River because trapping facilities are already in place there. In this context, the HSRG solution can be
viewed as a potential “long-term recommendation”, while HRT Alternative A can be viewed as a
“short-term recommendation”.
The HSRG Solution and HRT alternatives for the Little Salmon River hatchery programs maintain the
current release numbers of both A-run and Dworshak NFH B-run steelhead. However, the HRT is
recommending that Clearwater FH, rather than Hagerman NFH or Magic Valley FH, rear Dworshak
B-run steelhead released in the Little Salmon River because of the greater in-hatchery survivals and
recruit-per-spawners associated with rearing at Clearwater FH.
The HRT further recommends that all Sawtooth A-run steelhead be reared at Hagerman NFH and that
all Pahsimeroi A-run steelhead be reared at Magic Valley and Niagara Springs FH. Currently,
approximately 1.45M and 1.59M steelhead smolts are reared annually at Hagerman NFH and Magic
Valley FH, respectively. The “HSRG Solutions” in Tables A19-A39 assume that those numbers would
remain unchanged. The two sets of HRT alternatives would reduce those numbers slightly to 1.40 and
1.55M smolts, respectively. Further reductions may be necessary in response to declining water
supplies at both facilities.
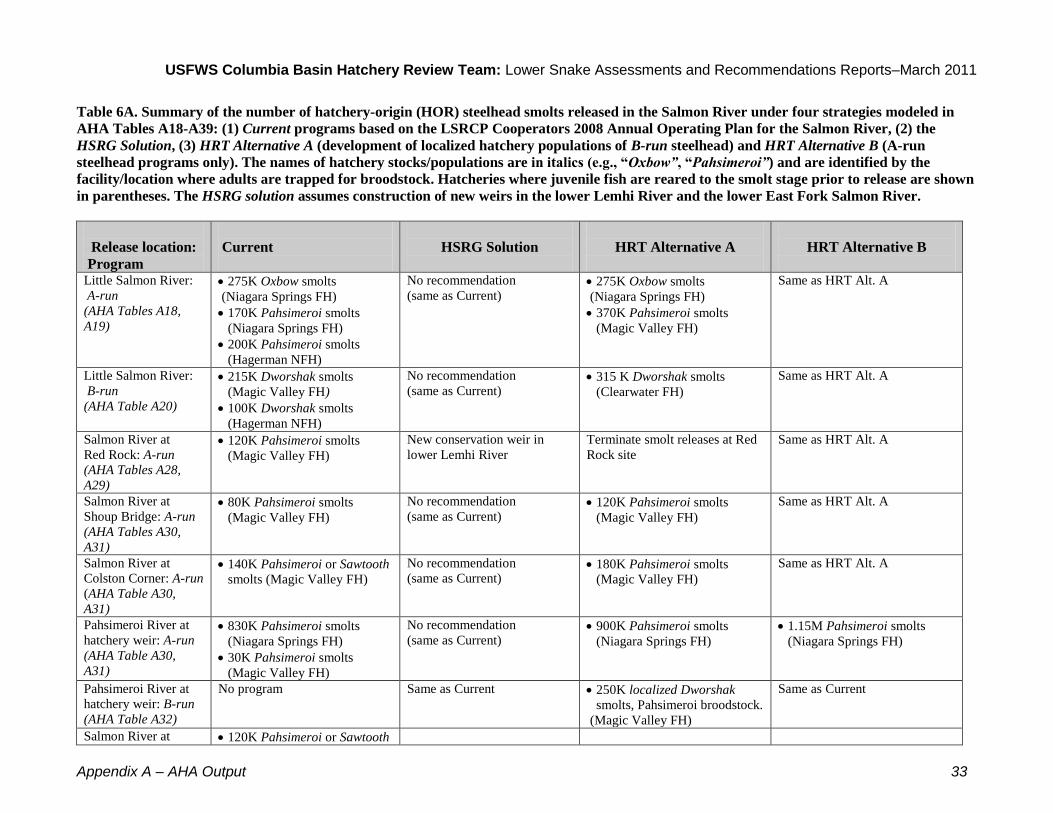
USFWS Columbia Basin Hatchery Review Team: Lower Snake Assessments and Recommendations Reports–March 2011
Appendix A – AHA Output 33
Table 6A. Summary of the number of hatchery-origin (HOR) steelhead smolts released in the Salmon River under four strategies modeled in
AHA Tables A18-A39: (1) Current programs based on the LSRCP Cooperators 2008 Annual Operating Plan for the Salmon River, (2) the
HSRG Solution, (3) HRT Alternative A (development of localized hatchery populations of B-run steelhead) and HRT Alternative B (A-run
steelhead programs only). The names of hatchery stocks/populations are in italics (e.g., “Oxbow”, “Pahsimeroi”) and are identified by the
facility/location where adults are trapped for broodstock. Hatcheries where juvenile fish are reared to the smolt stage prior to release are shown
in parentheses. The HSRG solution assumes construction of new weirs in the lower Lemhi River and the lower East Fork Salmon River.
Release location:
Program
Current
HSRG Solution
HRT Alternative A
HRT Alternative B
Little Salmon River:
A-run
(AHA Tables A18,
A19)
275K Oxbow smolts
(Niagara Springs FH)
170K Pahsimeroi smolts
(Niagara Springs FH)
200K Pahsimeroi smolts
(Hagerman NFH)
No recommendation
(same as Current)
275K Oxbow smolts
(Niagara Springs FH)
370K Pahsimeroi smolts
(Magic Valley FH)
Same as HRT Alt. A
Little Salmon River:
B-run
(AHA Table A20)
215K Dworshak smolts
(Magic Valley FH)
100K Dworshak smolts
(Hagerman NFH)
No recommendation
(same as Current) 315 K Dworshak smolts
(Clearwater FH)
Same as HRT Alt. A
Salmon River at
Red Rock: A-run
(AHA Tables A28,
A29)
120K Pahsimeroi smolts
(Magic Valley FH)
New conservation weir in
lower Lemhi River
Terminate smolt releases at Red
Rock site
Same as HRT Alt. A
Salmon River at
Shoup Bridge: A-run
(AHA Tables A30,
A31)
80K Pahsimeroi smolts
(Magic Valley FH)
No recommendation
(same as Current) 120K Pahsimeroi smolts
(Magic Valley FH)
Same as HRT Alt. A
Salmon River at
Colston Corner: A-run
(AHA Table A30,
A31)
140K Pahsimeroi or Sawtooth
smolts (Magic Valley FH)
No recommendation
(same as Current) 180K Pahsimeroi smolts
(Magic Valley FH)
Same as HRT Alt. A
Pahsimeroi River at
hatchery weir: A-run
(AHA Table A30,
A31)
830K Pahsimeroi smolts
(Niagara Springs FH)
30K Pahsimeroi smolts
(Magic Valley FH)
No recommendation
(same as Current) 900K Pahsimeroi smolts
(Niagara Springs FH)
1.15M Pahsimeroi smolts
(Niagara Springs FH)
Pahsimeroi River at
hatchery weir: B-run
(AHA Table A32)
No program Same as Current 250K localized Dworshak
smolts, Pahsimeroi broodstock.
(Magic Valley FH)
Same as Current
Salmon River at 120K Pahsimeroi or Sawtooth

USFWS Columbia Basin Hatchery Review Team: Lower Snake Assessments and Recommendations Reports–March 2011
34 Appendix A – AHA Output
McNabb Point
(AHA Table A33)
A-run smolts
(Magic Valley FH) 120K East Fork “F2” HOR
Naturals (Magic Valley FH)
Same as HSRG Solution Same as HSRG Solution
Salmon River at
Tunnel Rock
(AHA Table A33)
60K Pahsimeroi or Sawtooth
A-run smolts
(Magic Valley FH)
60K East Fork “F2” HOR
Naturals (Magic Valley FH)
Same as HSRG Solution
Same as HSRG Solution
E.F. Salmon River at
existing weir (RM
18):
E.F. “Naturals”
(AHA Table A34)
60K E.F. Naturals
(pNOB = 0.5)
(Magic Valley FH)
Terminate releases at existing
weir
150K E.F. Naturals
(pNOB = 0.75),
released upstream of weir
(Magic Valley FH)
Same as HSRG solution
E.F. Salmon River at
mouth (RM 1.0):
E.F. “Naturals”
(AHA Tables A33,
A34)
No program
Construct new weir at mouth
100K E.F. Naturals
(pNOB = 0.75)
(Magic Valley FH)
325K East Fork “F2” HOR
Naturals (Magic Valley FH)
Construct new weir at mouth
150K E.F. Naturals
(pNOB = 0.75)
(Magic Valley FH)
325K East Fork “F2” HOR
Naturals (Magic Valley FH)
E.F. Salmon River at
mouth (RM 1): B-run
(AHA Table A35)
225K Dworshak smolts
(Magic Valley FH)
100K Dworshak smolts
(Hagerman NFH)
Construct new weir at mouth
325K localized Dworshak
smolts, E.F. broodstock
(Magic Valley FH)
No program
No program
Squaw Creek and
Pond: B-run
(AHA Tables A36,
A37)
60K localized Dworshak
smolts, Squaw Cr. broodstock
(Magic Valley FH)
250K Dworshak smolts
(Magic Valley FH)
270K E.F. Salmon River
localized Dworshak smolts
(Magic Valley FH)
60K localized Dworshak
smolts, Squaw Cr. broodstock
(Magic Valley FH)
No program
Slate Creek: A-run
(AHA Tables A38,
A39)
90K Pahsimeroi smolts
(Magic Valley FH)
No recommendation
(same as Current) 90K Sawtooth smolts
(Hagerman NFH)
Same as HRT Alt. A
Yankee Fork,
Salmon River: A-run
(AHA Tables A38,
A39)
240K Sawtooth smolts
(Hagerman NFH)
90K Sawtooth smolts
(Magic Valley FH)
No recommendation
(same as Current)
330K Sawtooth smolts
(Hagerman NFH)
Same as HRT Alt. A
Valley Creek: A-run
(AHA Tables A38,
A39)
50K Sawtooth smolts
(Magic Valley FH)
No recommendation
(same as Current) 50K Sawtooth smolts
(Hagerman NFH)
Same as HRT Alt. A
Salmon River at
Sawtooth Hatchery
weir: A-run
(AHA Tables A38,
A39)
810K Sawtooth smolts
(Hagerman NFH)
No recommendation
(same as Current)
930K Sawtooth smolts
(Hagerman NFH)
Same as HRT Alt. A

USFWS Columbia Basin Hatchery Review Team: Lower Snake Assessments and Recommendations Reports–March 2011
Appendix A – AHA Output 35
Table A18. AHA output for Little Salmon River summer steelhead (A-run ). Hatchery influence on this population is from outplanted Dworshak
NFH steelhead (B-run), and outplanted Oxbow and Pahsimeroi Hatchery A-run steelhead (see Tables A19 and A20).
Population (Ctrl + Page Up/Down to Scroll)Species/Race Population Management Intent:
Harv&Hatchery Strategy:
Population Recovery Designation:
Ad. Capacity
% Kelt
Sm. Capacity
Ocean Surv Baseline SAR Vary? (Y/N) 0.098 0.020 0.053 0.020 0.053 0.020 0.053 0.020 0.053 0.020 0.053 0.020
Adult Passage
Adj. Capacity
Harv - Marine
Harv - L. Mainstem
Harv - U. Mainstem
Harv -Terminal
Total Exploitation Rate
Broodstock Composition
Type
Local Imported
Destination for HOR Returns
Productivity of Hatchery Fish
549
1Realized Spawning Composition
Relative Hatchery Optimum -> 80 80 80 80 80
Weir Factor ->
Relative Reproductive Success (HOS) -> 80% 80% 80% 80% 80%
Initial Fitness Factor (A) -> 0.81 0.81 0.81 0.81 0.81
Fitness Factor after 100 generations (B) -> 0.50 1.00 0.50 0.50 0.50
Average Fitness Factor (100 Generations) -> 0.50 0.99 0.50 0.50 0.50
Generations until average fitness is reached -> 14 30 14 14 14
Minimum Hatchery Program (% of BS Goal) -> Effective pHOS -> 0.62 Effective pHOS -> Effective pHOS -> 0.62 Effective pHOS -> 0.62 Effective pHOS -> 0.62
"Fitness Floor" -> 0.5 pNOB -> pNOB -> pNOB -> pNOB -> pNOB ->
Calculated Hatchery SAR ->
Calculated Natural SAR ->
Max Min Max Min Max Min Max Min Max Min
NOR Escapement 857 129 1,103 158 857 129 857 129 857 129
HoS Total Escapement (includes strays) 5,154 895 5,154 895 5,162 897 5,162 897
All H Analyzer (AHA)
Harvest --->
Hatchery
Stabilizing
1
474
y
0.77
Current
3.60
323
Ave
2.0%
Segregated Hatchery
3.60
No Hatchery
474 4743.60
258
0.106
pHOS
1,688
1,688
2.0%
100%
Current Hydro
Current Harvest
Ave
y
HORs
HORs
0.010
HORs
0.030
HORs
0.010
0.060
0.010
0.030
Hydro
Harvest
NORs
NORs
1.80Adjusted Productivity
NORs
Juv Passage Surv.
NORs
NORs
0.060
pHOS
0.060
0.106
0.030
0.106
pNOB
0.106
1
0.010
0.49
3.60
0.010
HORs 0.010
1
180180
12-Salmon_Little Salmon Summer
Steelhead (A-Run)
y
23,704
Historic
11,850
3.60 474
90
Productivity (Adult)
Min NOR EscapeHabitatSmolt Productivity
% to Hatchery
Purpose
Export Goal/Realized
Cons/Harv/Both
Broodstock by Source
Brood Exported (from HOR Surplus)
23,704
1.00 0.49
237
y
1.00
23,704
0.030
3.60
0.060
474474
0.010
0.060
0.010
0.060
474
y
Harvest
0.49
Stabilizing
HRT Alternatives A
474
1
3.60
0.770.770.77
0.010 0.010
HSRG Solution
3.60
1,691
0.106
0.030
0.1060.106
1,688
y
Int/Seg/Step/None
Smolt Release
100%% to Nat. Spawn. 100%
pNOB-Goal
pHOSpNOB
pHOS-Goal
None
PNI 62%
Seg
pHOS-Realized
ConsHarv
Strays
258
Ave Ave
258
1,691
0.030
62%
0.030
0.106
Recruits/Spawner
Current Harvest
Fitness? [Y / N]
Current Hydro
Current HabitatHabitat ----->
23,704180
474
0.77
3.60 474
0.030
0.106
0.010
y
0.49
3.60 474
1
0.060
0.010 0.010
0.010
62%
pHOS
0.106
pNOB
Conservation
y
Harvest
Segregated Hatchery
Stabilizing
HRT Alternatives B
Stabilizing
0.060
0.010
y
SegHarv
62%
0.060
pNOB
Harv
0.060
Seg
1,688
180
0.010
Ave
1,691
258
0.010
pHOS
Seg
0.030
0.010
2.0%
Current Habitat
100%
1,691
Harv
2.0%
y
Current Habitat
100%
2.0%
Current Habitat
Subregion/SubbasinNatural Reproduction only
0.030
pNOB
Salmon Summer Steelhead
Current Harvest
Harvest
Hatchery
Stabilizing
Patterns
Patterns shown here are assigned to the population from
the AHA or ROL file. Red cells indicate patterns are not
assigned to this population/scenario in the rollup
application. The shown pattern needs to be added to the
application, or a different pattern should be assigned to
this population in the ROL/AHA file.
Current Habitat
Hydro -----> Current Hydro
y
180
Current Hydro
Current Harvest
Current Hydro
Current Harvest
Segregated Hatchery
Harvest
Segregated Hatchery
0.010
3.60
0.010
23,704
0.49
1
-
0.20
0.40
0.60
0.80
1.00
- 0.20 0.40 0.60 0.80 1.00pNOB
pH
OS
.5
.9
.8
.7
.6
.4.3.2
PNI
.1
0
500
1,000
1,500
2,000
2,500
Ha
tch
ery
Ha
bita
t
Ma
rin
e
L. M
ain
ste
m
U.
Ma
inste
m
Te
rmin
al
0
500
1,000
1,500
2,000
2,500
Ha
tch
ery
Ha
bita
t
Ma
rin
e
L. M
ain
ste
m
U.
Ma
inste
m
Te
rmin
al
0
500
1,000
1,500
2,000
2,500
Ha
tch
ery
Ha
bita
t
Ma
rin
e
L.
Ma
inste
m
U.
Ma
inste
m
Te
rmin
al
0
500
1,000
1,500
2,000
2,500
Ha
tch
ery
Ha
bita
t
Ma
rin
e
L.
Ma
inste
m
U.
Ma
inste
m
Te
rmin
al
0
500
1,000
1,500
2,000
2,500
Ha
tch
ery
Ha
bita
t
Ma
rin
e
L. M
ain
ste
m
U.
Ma
inste
m
Te
rmin
al
Ha
tch
ery
Ha
bita
tM
ari
ne L.
U.
Te
rmin
al
Apply & Recalculate
Update

USFWS Columbia Basin Hatchery Review Team: Lower Snake Assessments and Recommendations Reports–March 2011
36 Appendix A – AHA Output
Table A19. AHA output for Oxbow and Pahsimeroi Hatchery A-run steelhead released into the Little Salmon River.
Population (Ctrl + Page Up/Down to Scroll)Species/Race Population Management Intent:
Harv&Hatchery Strategy: Segregated
Population Recovery Designation:
Ad. Capacity
% Kelt
Sm. Capacity
Ocean Surv Baseline SAR Vary? (Y/N) 0.092 0.020 0.053 0.020 0.053 0.020 0.053 0.020 0.053 0.020 0.053 0.020
Adult Passage
Adj. Capacity
Harv - Marine
Harv - L. Mainstem
Harv - U. Mainstem
Harv -Terminal
Total Exploitation Rate
Broodstock Composition
Type
Local Imported 350 350 350 350
Destination for HOR Returns
Productivity of Hatchery Fish
550
2Realized Spawning Composition
Relative Hatchery Optimum -> 80 80 80 80 80
Weir Factor ->
Relative Reproductive Success (HOS) -> 25% 25% 25% 25% 25%
Initial Fitness Factor (A) -> 0.81 0.81 0.81 0.81 0.81
Fitness Factor after 100 generations (B) -> 0.19 1.00 0.19 0.19 0.19
Average Fitness Factor (100 Generations) -> 0.24 0.99 0.24 0.24 0.24
Generations until average fitness is reached -> 43 30 43 43 43
Minimum Hatchery Program (% of BS Goal) -> Effective pHOS -> 1.00 Effective pHOS -> Effective pHOS -> 1.00 Effective pHOS -> 1.00 Effective pHOS -> 1.00
"Fitness Floor" -> pNOB -> pNOB -> pNOB -> pNOB -> pNOB ->
Calculated Hatchery SAR ->
Calculated Natural SAR ->
Max Min Max Min Max Min Max Min Max Min
NOR Escapement 0 0 0 0 0 0 0 0 0 0
HoS Total Escapement (includes strays) 5,669 984 5,669 984 5,669 984 5,669 984
All H Analyzer (AHA)
Harvest --->
Hatchery
12.9
Not listed - excluded from DPS
1
0
y
0.77
Current
0.00
0
Ave
2.0%
Segregated Hatchery - Outplanting
0.00
No Hatchery
0 00.00
0
0.631
pHOS
1,856
2.0%
100%
Current Hydro
Current Harvest
Ave
y
HORs
HORs
0.010
HORs
0.030
HORs
0.010
0.060
0.010
0.600
Hydro
Harvest
NORs
NORs
0.00Adjusted Productivity
NORs
Juv Passage Surv.
NORs
NORs
0.060
pHOS
0.060
0.106
0.030
0.631
pNOB
0.106
1
0.010
0.49
0.00
0.010
HORs 0.010
1
00
12A-Salmon_Little Salmon Summer
Steelhead (A-Run-Pahsimeroi-Oxbow-
Hatchery)
y
1
Historic
0
0.00 0
0
Productivity (Adult)
Min NOR EscapeHabitatSmolt Productivity
% to Hatchery
Purpose
Export Goal/Realized
Cons/Harv/Both
Broodstock by Source
Brood Exported (from HOR Surplus)
1
1.00 0.49
0
y
1.00
1
0.600
0.00
0.060
00
0.010
0.060
0.010
0.060
0
y
Harvest
0.49
Not listed - excluded from DPS
HRT Alternatives A
0
1
0.00
0.770.770.77
0.010 0.010
HSRG Solution
0.00
0.631
0.600
0.1060.106
1,856
12.9y
644,700
Int/Seg/Step/None
Smolt Release
100%% to Nat. Spawn. 100%
pNOB-Goal
pHOSpNOB
pHOS-Goal
None
PNI 100%
Seg
pHOS-Realized
ConsHarv
Strays
0
Ave Ave
0
1,856
0.030
100%
0.600
0.106
Recruits/Spawner
0.7%
Current Harvest
12.9Fitness? [Y / N]
Current Hydro
Current HabitatHabitat ----->
0.7%
10
0
0.77
0.00 0
0.600
0.631
0.010
y
0.49
0.00 0
1
0.060
0.010 0.010
0.010
100%
pHOS
0.631
pNOB
Conservation
y
Harvest
Segregated Hatchery - Outplanting
Not listed - excluded from DPS
HRT Alternatives B
N/A
0.060
0.010
y
644,700
SegHarv
100%
0.060
pNOB
Harv
0.060
Seg
0
0.010
0.7%
Ave
1,856
0
12.9
0.010
pHOS
644,700
Seg
0.030
0.010
2.0%
Current Habitat
0.7%
100%
Harv
644,700
2.0%
y
Current Habitat
100%
2.0%
Current Habitat
Subregion/SubbasinNatural Reproduction only
0.030
pNOB
Salmon Summer Steelhead
Current Harvest
Harvest
Hatchery
Not listed - excluded from DPS
Patterns
Patterns shown here are assigned to the population from
the AHA or ROL file. Red cells indicate patterns are not
assigned to this population/scenario in the rollup
application. The shown pattern needs to be added to the
application, or a different pattern should be assigned to
this population in the ROL/AHA file.
Current Habitat
Hydro -----> Current Hydro
y
0
Current Hydro
Current Harvest
Current Hydro
Current Harvest
Hatchery - Outplanting
Harvest
Segregated Hatchery - Outplanting
0.010
0.00
0.010
1
0.49
1
-
0.20
0.40
0.60
0.80
1.00
- 0.20 0.40 0.60 0.80 1.00pNOB
pH
OS
.5
.9
.8
.7
.6
.4.3.2
PNI
.1
0
500
1,000
1,500
2,000
2,500
3,000
Ha
tch
ery
Ha
bita
t
Ma
rin
e
L. M
ain
ste
m
U.
Ma
inste
m
Te
rmin
al
0
500
1,000
1,500
2,000
2,500
3,000
Ha
tch
ery
Ha
bita
t
Ma
rin
e
L. M
ain
ste
m
U.
Ma
inste
m
Te
rmin
al
0
500
1,000
1,500
2,000
2,500
3,000
Ha
tch
ery
Ha
bita
t
Ma
rin
e
L.
Ma
inste
m
U.
Ma
inste
m
Te
rmin
al
0
500
1,000
1,500
2,000
2,500
3,000
Ha
tch
ery
Ha
bita
t
Ma
rin
e
L.
Ma
inste
m
U.
Ma
inste
m
Te
rmin
al
0
500
1,000
1,500
2,000
2,500
3,000
Ha
tch
ery
Ha
bita
t
Ma
rin
e
L. M
ain
ste
m
U.
Ma
inste
m
Te
rmin
al
Ha
tch
ery
Ha
bita
tM
ari
ne L.
U.
Te
rmin
al
Apply & Recalculate
Update

USFWS Columbia Basin Hatchery Review Team: Lower Snake Assessments and Recommendations Reports–March 2011
Appendix A – AHA Output 37
Table A20. AHA output for Dworshak NFH steelhead (B-run ) released into the Little Salmon River.
Population (Ctrl + Page Up/Down to Scroll)Species/Race Population Management Intent:
Harv&Hatchery Strategy: Segregated
Population Recovery Designation:
Ad. Capacity
% Kelt
Sm. Capacity
Ocean Surv Baseline SAR Vary? (Y/N) 0.092 0.018 0.048 0.018 0.048 0.018 0.048 0.018 0.048 0.018 0.048 0.018
Adult Passage
Adj. Capacity
Harv - Marine
Harv - L. Mainstem
Harv - U. Mainstem
Harv -Terminal
Total Exploitation Rate
Broodstock Composition
Type
Local Imported 164 164 123 123
Destination for HOR Returns
Productivity of Hatchery Fish
791
3Realized Spawning Composition
Relative Hatchery Optimum -> 80 80 80 80 80
Weir Factor ->
Relative Reproductive Success (HOS) -> 25% 25% 25% 25% 25%
Initial Fitness Factor (A) -> 0.81 0.81 0.81 0.81 0.81
Fitness Factor after 100 generations (B) -> 0.19 1.00 0.19 0.19 0.19
Average Fitness Factor (100 Generations) -> 0.24 0.99 0.24 0.24 0.24
Generations until average fitness is reached -> 43 30 43 43 43
Minimum Hatchery Program (% of BS Goal) -> Effective pHOS -> 1.00 Effective pHOS -> Effective pHOS -> 1.00 Effective pHOS -> 1.00 Effective pHOS -> 1.00
"Fitness Floor" -> pNOB -> pNOB -> pNOB -> pNOB -> pNOB ->
Calculated Hatchery SAR ->
Calculated Natural SAR ->
Max Min Max Min Max Min Max Min Max Min
NOR Escapement 0 0 0 0 0 0 0 0 0 0
HoS Total Escapement (includes strays) 471 81 471 81 480 83 480 83
All H Analyzer (AHA)
Harvest --->
Hatchery
3.4
Not listed - excluded from DPS
1
0
y
0.77
Current
0.00
0
Ave
1.8%
Segregated Hatchery - Outplanting
0.00
No Hatchery
0 00.00
0
0.663
pHOS
154
1.8%
100%
Current Hydro
Current Harvest
Ave
y
HORs
HORs
0.010
HORs
0.030
HORs
0.010
0.140
0.010
0.600
Hydro
Harvest
NORs
NORs
0.00Adjusted Productivity
NORs
Juv Passage Surv.
NORs
NORs
0.140
pHOS
0.140
0.182
0.030
0.663
pNOB
0.182
1
0.010
0.49
0.00
0.010
HORs 0.010
1
00
12B-Salmon_Little Salmon Summer
Steelhead (B-Run-Dworshak-Hatchery)
y
1
Historic
0
0.00 0
0
Productivity (Adult)
Min NOR EscapeHabitatSmolt Productivity
% to Hatchery
Purpose
Export Goal/Realized
Cons/Harv/Both
Broodstock by Source
Brood Exported (from HOR Surplus)
1
1.00 0.49
0
y
1.00
1
0.600
0.00
0.140
00
0.010
0.140
0.010
0.140
0
y
Harvest
0.49
Not listed - excluded from DPS
HRT Alternatives A
0
1
0.00
0.770.770.77
0.010 0.010
HSRG Solution
0.00
0.663
0.600
0.1820.182
154
2.5y
314,460
Int/Seg/Step/None
Smolt Release
100%% to Nat. Spawn. 100%
pNOB-Goal
pHOSpNOB
pHOS-Goal
None
PNI 100%
Seg
pHOS-Realized
ConsHarv
Strays
0
Ave Ave
0
157
0.030
100%
0.600
0.182
Recruits/Spawner
0.1%
Current Harvest
2.5Fitness? [Y / N]
Current Hydro
Current HabitatHabitat ----->
0.1%
10
0
0.77
0.00 0
0.600
0.663
0.010
y
0.49
0.00 0
1
0.140
0.010 0.010
0.010
100%
pHOS
0.663
pNOB
Conservation
y
Harvest
Segregated Hatchery - Outplanting
Not listed - excluded from DPS
HRT Alternatives B
N/A
0.140
0.010
y
315,864
SegHarv
100%
0.140
pNOB
Harv
0.140
Seg
0
0.010
0.1%
Ave
157
0
3.4
0.010
pHOS
315,864
Seg
0.030
0.010
1.8%
Current Habitat
0.1%
100%
Harv
314,460
1.8%
y
Current Habitat
100%
1.8%
Current Habitat
Subregion/SubbasinNatural Reproduction only
0.030
pNOB
Salmon Summer Steelhead
Current Harvest
Harvest
Hatchery
Not listed - excluded from DPS
Patterns
Patterns shown here are assigned to the population from
the AHA or ROL file. Red cells indicate patterns are not
assigned to this population/scenario in the rollup
application. The shown pattern needs to be added to the
application, or a different pattern should be assigned to
this population in the ROL/AHA file.
Current Habitat
Hydro -----> Current Hydro
y
0
Current Hydro
Current Harvest
Current Hydro
Current Harvest
Hatchery - Outplanting
Harvest
Segregated Hatchery - Outplanting
0.010
0.00
0.010
1
0.49
1
-
0.20
0.40
0.60
0.80
1.00
- 0.20 0.40 0.60 0.80 1.00pNOB
pH
OS
.5
.9
.8
.7
.6
.4.3.2
PNI
.1
0
50
100
150
200
250
Ha
tch
ery
Ha
bita
t
Ma
rin
e
L. M
ain
ste
m
U.
Ma
inste
m
Te
rmin
al
0
50
100
150
200
250
Ha
tch
ery
Ha
bita
t
Ma
rin
e
L. M
ain
ste
m
U.
Ma
inste
m
Te
rmin
al
0
50
100
150
200
250
Ha
tch
ery
Ha
bita
t
Ma
rin
e
L.
Ma
inste
m
U.
Ma
inste
m
Te
rmin
al
0
50
100
150
200
250
Ha
tch
ery
Ha
bita
t
Ma
rin
e
L.
Ma
inste
m
U.
Ma
inste
m
Te
rmin
al
0
50
100
150
200
250
Ha
tch
ery
Ha
bita
t
Ma
rin
e
L. M
ain
ste
m
U.
Ma
inste
m
Te
rmin
al
Ha
tch
ery
Ha
bita
tM
ari
ne L.
U.
Te
rmin
al
Apply & Recalculate
Update

USFWS Columbia Basin Hatchery Review Team: Lower Snake Assessments and Recommendations Reports–March 2011
38 Appendix A – AHA Output
Table A21. AHA output for South Fork Salmon River steelhead (B-run ).
Population (Ctrl + Page Up/Down to Scroll)Species/Race Population Management Intent:
Harv&Hatchery Strategy:
Population Recovery Designation:
Ad. Capacity
% Kelt
Sm. Capacity
Ocean Surv Baseline SAR Vary? (Y/N) 0.092 0.018 0.048 0.018 0.048 0.018 0.048 0.018 0.048 0.018 0.048 0.018
Adult Passage
Adj. Capacity
Harv - Marine
Harv - L. Mainstem
Harv - U. Mainstem
Harv -Terminal
Total Exploitation Rate
Broodstock Composition
Type
Local Imported
Destination for HOR Returns
Productivity of Hatchery Fish
548
4Realized Spawning Composition
Relative Hatchery Optimum -> 80 80 80 80 80
Weir Factor ->
Relative Reproductive Success (HOS) -> 80% 80% 80% 80% 80%
Initial Fitness Factor (A) -> 0.81 0.81 0.81 0.81 0.81
Fitness Factor after 100 generations (B) -> 0.98 1.00 0.98 0.98 0.98
Average Fitness Factor (100 Generations) -> 0.97 0.99 0.97 0.97 0.97
Generations until average fitness is reached -> 31 30 31 31 31
Minimum Hatchery Program (% of BS Goal) -> Effective pHOS -> 0.01 Effective pHOS -> Effective pHOS -> 0.01 Effective pHOS -> 0.01 Effective pHOS -> 0.01
"Fitness Floor" -> 0.5 pNOB -> pNOB -> pNOB -> pNOB -> pNOB ->
Calculated Hatchery SAR ->
Calculated Natural SAR ->
Max Min Max Min Max Min Max Min Max Min
NOR Escapement 2,006 267 2,058 275 2,006 267 2,006 267 2,006 267
HoS Total Escapement (includes strays) 43 7 43 7 43 7 43 7
All H Analyzer (AHA)
Harvest --->
Hatchery
Primary
1
1,115
y
0.77
Current
3.00
594
Ave
1.8%
Natural Reproduction only
3.00
No Hatchery
1,115 1,1153.00
579
0.182
5%
pHOS
14
14
1.8%
100%
Current Hydro
Current Harvest
Ave
y
HORs
HORs
0.010
HORs
0.030
HORs
0.010
0.140
0.010
0.030
Hydro
Harvest
NORs
NORs
1.36Adjusted Productivity
NORs
Juv Passage Surv.
NORs
NORs
0.140
pHOS
0.140
0.182
0.030
0.182
pNOB
0.182
1
0.010
0.49
3.00
0.010
HORs 0.010
1
166166
13-Salmon_South Fork Summer Steelhead
(B-Run)
y
61,568
Historic
27,875
3.00 1,115
75
Productivity (Adult)
Min NOR EscapeHabitatSmolt Productivity
% to Hatchery
Purpose
Export Goal/Realized
Cons/Harv/Both
Broodstock by Source
Brood Exported (from HOR Surplus)
61,568
1.00 0.49
505
y
1.00
61,568
0.030
3.00
0.140
1,1151,115
0.010
0.140
0.010
0.140
1,115
y
Conservation
0.49
Primary
HRT Alternatives A
1,115
1
3.00
0.770.770.77
0.010 0.010
HSRG Solution
3.00
14
0.182
0.030
5%
0.1820.182
14
y
Int/Seg/Step/None
Smolt Release
100%% to Nat. Spawn. 100%
pNOB-Goal
pHOSpNOB
5%pHOS-Goal
None
PNI 1%
None
pHOS-Realized
ConsCons
Strays
579
Ave Ave
579
14
0.030
1%
0.030
0.182
5%
Recruits/Spawner
Current Harvest
Fitness? [Y / N]
Current Hydro
Current HabitatHabitat ----->
61,568166
1,115
0.77
3.00 1,115
0.030
0.182
0.010
y
0.49
3.00 1,115
1
0.140
0.010 0.010
0.010
1%
pHOS
0.182
pNOB
5%
Conservation
y
Conservation
Natural Reproduction only
Primary
HRT Alternatives B
Primary
0.140
0.010
y
NoneCons
1%
0.140
pNOB
Cons
0.140
None
14
166
0.010
Ave
14
579
0.010
pHOS
None
0.030
0.010
1.8%
Current Habitat
100%
14
Cons
1.8%
y
Current Habitat
100%
1.8%
Current Habitat
Subregion/SubbasinNatural Reproduction only
0.030
pNOB
Salmon Summer Steelhead
Current Harvest
Conservation
Hatchery
Primary
Patterns
Patterns shown here are assigned to the population from
the AHA or ROL file. Red cells indicate patterns are not
assigned to this population/scenario in the rollup
application. The shown pattern needs to be added to the
application, or a different pattern should be assigned to
this population in the ROL/AHA file.
Current Habitat
Hydro -----> Current Hydro
y
166
Current Hydro
Current Harvest
Current Hydro
Current Harvest
Natural Reproduction only
Conservation
Natural Reproduction only
0.010
3.00
0.010
61,568
0.49
1
-
0.20
0.40
0.60
0.80
1.00
- 0.20 0.40 0.60 0.80 1.00pNOB
pH
OS
.5
.9
.8
.7
.6
.4.3.2
PNI
.1
0
100
200
300
400
500
600
700
Ha
tch
ery
Ha
bita
t
Ma
rin
e
L. M
ain
ste
m
U.
Ma
inste
m
Te
rmin
al
0
100
200
300
400
500
600
700
Ha
tch
ery
Ha
bita
t
Ma
rin
e
L. M
ain
ste
m
U.
Ma
inste
m
Te
rmin
al
0
100
200
300
400
500
600
700
Ha
tch
ery
Ha
bita
t
Ma
rin
e
L.
Ma
inste
m
U.
Ma
inste
m
Te
rmin
al
0
100
200
300
400
500
600
700
Ha
tch
ery
Ha
bita
t
Ma
rin
e
L.
Ma
inste
m
U.
Ma
inste
m
Te
rmin
al
0
100
200
300
400
500
600
700
Ha
tch
ery
Ha
bita
t
Ma
rin
e
L. M
ain
ste
m
U.
Ma
inste
m
Te
rmin
al
Ha
tch
ery
Ha
bita
tM
ari
ne L.
U.
Te
rmin
al
Apply & Recalculate
Update

USFWS Columbia Basin Hatchery Review Team: Lower Snake Assessments and Recommendations Reports–March 2011
Appendix A – AHA Output 39
Table A22. AHA output for Secesh River steelhead (B-run ).
Population (Ctrl + Page Up/Down to Scroll)Species/Race Population Management Intent:
Harv&Hatchery Strategy:
Population Recovery Designation:
Ad. Capacity
% Kelt
Sm. Capacity
Ocean Surv Baseline SAR Vary? (Y/N) 0.098 0.018 0.048 0.018 0.048 0.018 0.048 0.018 0.048 0.018 0.048 0.018
Adult Passage
Adj. Capacity
Harv - Marine
Harv - L. Mainstem
Harv - U. Mainstem
Harv -Terminal
Total Exploitation Rate
Broodstock Composition
Type
Local Imported
Destination for HOR Returns
Productivity of Hatchery Fish
547
5Realized Spawning Composition
Relative Hatchery Optimum -> 80 80 80 80 80
Weir Factor ->
Relative Reproductive Success (HOS) -> 80% 80% 80% 80% 80%
Initial Fitness Factor (A) -> 0.81 0.81 0.81 0.81 0.81
Fitness Factor after 100 generations (B) -> 0.96 1.00 0.96 0.95 0.95
Average Fitness Factor (100 Generations) -> 0.95 0.99 0.95 0.95 0.95
Generations until average fitness is reached -> 26 30 26 26 26
Minimum Hatchery Program (% of BS Goal) -> Effective pHOS -> 0.01 Effective pHOS -> Effective pHOS -> 0.01 Effective pHOS -> 0.01 Effective pHOS -> 0.01
"Fitness Floor" -> 0.5 pNOB -> pNOB -> pNOB -> pNOB -> pNOB ->
Calculated Hatchery SAR ->
Calculated Natural SAR ->
Max Min Max Min Max Min Max Min Max Min
NOR Escapement 603 80 631 84 603 80 603 80 603 80
HoS Total Escapement (includes strays) 18 3 18 3 18 3 18 3
All H Analyzer (AHA)
Harvest --->
Hatchery
Primary
1
342
y
0.77
Current
3.00
182
Ave
1.8%
Natural Reproduction only
3.00
No Hatchery
342 3423.00
174
0.182
5%
pHOS
6
6
1.8%
100%
Current Hydro
Current Harvest
Ave
y
HORs
HORs
0.010
HORs
0.030
HORs
0.010
0.140
0.010
0.030
Hydro
Harvest
NORs
NORs
1.36Adjusted Productivity
NORs
Juv Passage Surv.
NORs
NORs
0.140
pHOS
0.140
0.182
0.030
0.182
pNOB
0.182
1
0.010
0.49
3.00
0.010
HORs 0.010
1
166166
14-Salmon_Secesh Summer Steelhead (B-
Run)
y
18,885
Historic
8,550
3.00 342
75
Productivity (Adult)
Min NOR EscapeHabitatSmolt Productivity
% to Hatchery
Purpose
Export Goal/Realized
Cons/Harv/Both
Broodstock by Source
Brood Exported (from HOR Surplus)
18,885
1.00 0.49
155
y
1.00
18,885
0.030
3.00
0.140
342342
0.010
0.140
0.010
0.140
342
y
Conservation
0.49
Primary
HRT Alternatives A
342
1
3.00
0.770.770.77
0.010 0.010
HSRG Solution
3.00
6
0.182
0.030
5%
0.1820.182
6
y
Int/Seg/Step/None
Smolt Release
100%% to Nat. Spawn. 100%
pNOB-Goal
pHOSpNOB
5%pHOS-Goal
None
PNI 1%
None
pHOS-Realized
ConsCons
Strays
174
Ave Ave
174
6
0.030
1%
0.030
0.182
5%
Recruits/Spawner
Current Harvest
Fitness? [Y / N]
Current Hydro
Current HabitatHabitat ----->
18,885166
342
0.77
3.00 342
0.030
0.182
0.010
y
0.49
3.00 342
1
0.140
0.010 0.010
0.010
1%
pHOS
0.182
pNOB
5%
Conservation
y
Conservation
Natural Reproduction only
Primary
HRT Alternatives B
Primary
0.140
0.010
y
NoneCons
1%
0.140
pNOB
Cons
0.140
None
6
166
0.010
Ave
6
174
0.010
pHOS
None
0.030
0.010
1.8%
Current Habitat
100%
6
Cons
1.8%
y
Current Habitat
100%
1.8%
Current Habitat
Subregion/SubbasinNatural Reproduction only
0.030
pNOB
Salmon Summer Steelhead
Current Harvest
Conservation
Hatchery
Primary
Patterns
Patterns shown here are assigned to the population from
the AHA or ROL file. Red cells indicate patterns are not
assigned to this population/scenario in the rollup
application. The shown pattern needs to be added to the
application, or a different pattern should be assigned to
this population in the ROL/AHA file.
Current Habitat
Hydro -----> Current Hydro
y
166
Current Hydro
Current Harvest
Current Hydro
Current Harvest
Natural Reproduction only
Conservation
Natural Reproduction only
0.010
3.00
0.010
18,885
0.49
1
-
0.20
0.40
0.60
0.80
1.00
- 0.20 0.40 0.60 0.80 1.00pNOB
pH
OS
.5
.9
.8
.7
.6
.4.3.2
PNI
.1
0
20
40
60
80
100
120
140
160
180
200
Ha
tch
ery
Ha
bita
t
Ma
rin
e
L. M
ain
ste
m
U.
Ma
inste
m
Te
rmin
al
0
20
40
60
80
100
120
140
160
180
200
Ha
tch
ery
Ha
bita
t
Ma
rin
e
L. M
ain
ste
m
U.
Ma
inste
m
Te
rmin
al
0
20
40
60
80
100
120
140
160
180
200
Ha
tch
ery
Ha
bita
t
Ma
rin
e
L.
Ma
inste
m
U.
Ma
inste
m
Te
rmin
al
0
20
40
60
80
100
120
140
160
180
200
Ha
tch
ery
Ha
bita
t
Ma
rin
e
L.
Ma
inste
m
U.
Ma
inste
m
Te
rmin
al
0
20
40
60
80
100
120
140
160
180
200
Ha
tch
ery
Ha
bita
t
Ma
rin
e
L. M
ain
ste
m
U.
Ma
inste
m
Te
rmin
al
Ha
tch
ery
Ha
bita
tM
ari
ne L.
U.
Te
rmin
al
Apply & Recalculate
Update

USFWS Columbia Basin Hatchery Review Team: Lower Snake Assessments and Recommendations Reports–March 2011
40 Appendix A – AHA Output
Table A23. AHA output for Chamberlain Creek steelhead (A-run ).
Population (Ctrl + Page Up/Down to Scroll)Species/Race Population Management Intent:
Harv&Hatchery Strategy:
Population Recovery Designation:
Ad. Capacity
% Kelt
Sm. Capacity
Ocean Surv Baseline SAR Vary? (Y/N) 0.092 0.020 0.053 0.020 0.053 0.020 0.053 0.020 0.053 0.020 0.053 0.020
Adult Passage
Adj. Capacity
Harv - Marine
Harv - L. Mainstem
Harv - U. Mainstem
Harv -Terminal
Total Exploitation Rate
Broodstock Composition
Type
Local Imported
Destination for HOR Returns
Productivity of Hatchery Fish
546
6Realized Spawning Composition
Relative Hatchery Optimum -> 80 80 80 80 80
Weir Factor ->
Relative Reproductive Success (HOS) -> 80% 80% 80% 80% 80%
Initial Fitness Factor (A) -> 0.81 0.81 0.81 0.81 0.81
Fitness Factor after 100 generations (B) -> 1.00 1.00 1.00 1.00 1.00
Average Fitness Factor (100 Generations) -> 0.99 0.99 0.99 0.99 0.99
Generations until average fitness is reached -> 32 30 32 32 32
Minimum Hatchery Program (% of BS Goal) -> Effective pHOS -> 0.00 Effective pHOS -> Effective pHOS -> 0.00 Effective pHOS -> 0.00 Effective pHOS -> 0.00
"Fitness Floor" -> 0.5 pNOB -> pNOB -> pNOB -> pNOB -> pNOB ->
Calculated Hatchery SAR ->
Calculated Natural SAR ->
Max Min Max Min Max Min Max Min Max Min
NOR Escapement 848 116 852 117 848 116 848 116 848 116
HoS Total Escapement (includes strays) 6 1 6 1 6 1 6 1
All H Analyzer (AHA)
Harvest --->
Hatchery
Primary
1
399
y
0.77
Current
3.00
247
Ave
2.0%
Natural Reproduction only
3.00
No Hatchery
399 3993.00
245
0.106
5%
pHOS
2
2
2.0%
100%
Current Hydro
Current Harvest
Ave
y
HORs
HORs
0.010
HORs
0.030
HORs
0.010
0.060
0.010
0.030
Hydro
Harvest
NORs
NORs
1.50Adjusted Productivity
NORs
Juv Passage Surv.
NORs
NORs
0.060
pHOS
0.060
0.106
0.030
0.106
pNOB
0.106
1
0.010
0.49
3.00
0.010
HORs 0.010
1
150150
15-Salmon_Chamberlain Summer
Steelhead (A-Run)
y
19,954
Historic
9,975
3.00 399
75
Productivity (Adult)
Min NOR EscapeHabitatSmolt Productivity
% to Hatchery
Purpose
Export Goal/Realized
Cons/Harv/Both
Broodstock by Source
Brood Exported (from HOR Surplus)
19,954
1.00 0.49
199
y
1.00
19,954
0.030
3.00
0.060
399399
0.010
0.060
0.010
0.060
399
y
Conservation
0.49
Primary
HRT Alternatives A
399
1
3.00
0.770.770.77
0.010 0.010
HSRG Solution
3.00
2
0.106
0.030
5%
0.1060.106
2
y
Int/Seg/Step/None
Smolt Release
100%% to Nat. Spawn. 100%
pNOB-Goal
pHOSpNOB
5%pHOS-Goal
None
PNI 0%
None
pHOS-Realized
ConsCons
Strays
245
Ave Ave
245
2
0.030
0%
0.030
0.106
5%
Recruits/Spawner
Current Harvest
Fitness? [Y / N]
Current Hydro
Current HabitatHabitat ----->
19,954150
399
0.77
3.00 399
0.030
0.106
0.010
y
0.49
3.00 399
1
0.060
0.010 0.010
0.010
0%
pHOS
0.106
pNOB
5%
Conservation
y
Conservation
Natural Reproduction only
Primary
HRT Alternatives B
Primary
0.060
0.010
y
NoneCons
0%
0.060
pNOB
Cons
0.060
None
2
150
0.010
Ave
2
245
0.010
pHOS
None
0.030
0.010
2.0%
Current Habitat
100%
2
Cons
2.0%
y
Current Habitat
100%
2.0%
Current Habitat
Subregion/SubbasinNatural Reproduction only
0.030
pNOB
Salmon Summer Steelhead
Current Harvest
Conservation
Hatchery
Primary
Patterns
Patterns shown here are assigned to the population from
the AHA or ROL file. Red cells indicate patterns are not
assigned to this population/scenario in the rollup
application. The shown pattern needs to be added to the
application, or a different pattern should be assigned to
this population in the ROL/AHA file.
Current Habitat
Hydro -----> Current Hydro
y
150
Current Hydro
Current Harvest
Current Hydro
Current Harvest
Natural Reproduction only
Conservation
Natural Reproduction only
0.010
3.00
0.010
19,954
0.49
1
-
0.20
0.40
0.60
0.80
1.00
- 0.20 0.40 0.60 0.80 1.00pNOB
pH
OS
.5
.9
.8
.7
.6
.4.3.2
PNI
.1
0
50
100
150
200
250
300
Ha
tch
ery
Ha
bita
t
Ma
rin
e
L. M
ain
ste
m
U.
Ma
inste
m
Te
rmin
al
0
50
100
150
200
250
300
Ha
tch
ery
Ha
bita
t
Ma
rin
e
L. M
ain
ste
m
U.
Ma
inste
m
Te
rmin
al
0
50
100
150
200
250
300
Ha
tch
ery
Ha
bita
t
Ma
rin
e
L.
Ma
inste
m
U.
Ma
inste
m
Te
rmin
al
0
50
100
150
200
250
300
Ha
tch
ery
Ha
bita
t
Ma
rin
e
L.
Ma
inste
m
U.
Ma
inste
m
Te
rmin
al
0
50
100
150
200
250
300
Ha
tch
ery
Ha
bita
t
Ma
rin
e
L. M
ain
ste
m
U.
Ma
inste
m
Te
rmin
al
Ha
tch
ery
Ha
bita
tM
ari
ne L.
U.
Te
rmin
al
Apply & Recalculate
Update

USFWS Columbia Basin Hatchery Review Team: Lower Snake Assessments and Recommendations Reports–March 2011
Appendix A – AHA Output 41
Table A24. AHA output for Lower Middle Fork Salmon River steelhead (B-run ).
Population (Ctrl + Page Up/Down to Scroll)Species/Race Population Management Intent:
Harv&Hatchery Strategy:
Population Recovery Designation:
Ad. Capacity
% Kelt
Sm. Capacity
Ocean Surv Baseline SAR Vary? (Y/N) 0.018 0.048 0.018 0.048 0.018 0.048 0.018 0.048 0.018 0.048 0.018
Adult Passage
Adj. Capacity
Harv - Marine
Harv - L. Mainstem
Harv - U. Mainstem
Harv -Terminal
Total Exploitation Rate
Broodstock Composition
Type
Local Imported
Destination for HOR Returns
Productivity of Hatchery Fish
544
7Realized Spawning Composition
Relative Hatchery Optimum -> 80 80 80 80 80
Weir Factor ->
Relative Reproductive Success (HOS) -> 80% 80% 80% 80% 80%
Initial Fitness Factor (A) -> 0.81 0.81 0.81 0.81 0.81
Fitness Factor after 100 generations (B) -> 0.99 1.00 0.99 0.99 0.99
Average Fitness Factor (100 Generations) -> 0.98 0.99 0.98 0.98 0.98
Generations until average fitness is reached -> 33 30 33 33 33
Minimum Hatchery Program (% of BS Goal) -> Effective pHOS -> 0.00 Effective pHOS -> Effective pHOS -> 0.00 Effective pHOS -> 0.00 Effective pHOS -> 0.00
"Fitness Floor" -> 0.5 pNOB -> pNOB -> pNOB -> pNOB -> pNOB ->
Calculated Hatchery SAR ->
Calculated Natural SAR ->
Max Min Max Min Max Min Max Min Max Min
NOR Escapement 2,450 305 2,483 311 2,450 305 2,449 305 2,449 305
HoS Total Escapement (includes strays) 31 5 31 5 31 5 31 5
All H Analyzer (AHA)
Harvest --->
Hatchery
Primary
1
1,587
Y
0.77
Current
2.50
721
Ave
1.8%
Natural Reproduction only
2.50
No Hatchery
1,587 1,5872.50
711
0.182
5%
pHOS
10
10
1.8%
100%
Current Hydro
Current Harvest
Ave
y
HORs
HORs
0.010
HORs
0.030
HORs
0.010
0.140
0.010
0.030
Hydro
Harvest
NORs
NORs
1.13Adjusted Productivity
NORs
Juv Passage Surv.
NORs
NORs
0.140
pHOS
0.140
0.182
0.030
0.182
pNOB
0.182
1
0.010
0.49
2.50
0.010
HORs 0.010
1
138138
16-Salmon_Lower Middle Fork Salmon
Summer Steelhead (B-Run)
Y
87,629
Historic
39,675
2.50 1,587
63
Productivity (Adult)
Min NOR EscapeHabitatSmolt Productivity
% to Hatchery
Purpose
Export Goal/Realized
Cons/Harv/Both
Broodstock by Source
Brood Exported (from HOR Surplus)
87,629
0.49
620
87,629
0.030
2.50
0.140
1,5871,587
0.010
0.140
0.010
0.140
1,587
Y
Conservation
0.49
Primary
HRT Alternatives A
1,587
1
2.50
0.770.770.77
0.010 0.010
HSRG Solution
2.50
10
0.182
0.030
5%
0.1820.182
10
y
Int/Seg/Step/None
Smolt Release
100%% to Nat. Spawn. 100%
pNOB-Goal
pHOSpNOB
5%pHOS-Goal
None
PNI 0%
None
pHOS-Realized
ConsCons
Strays
711
Ave Ave
711
10
0.030
0%
0.030
0.182
5%
Recruits/Spawner
Current Harvest
Fitness? [Y / N]
Current Hydro
Current HabitatHabitat ----->
87,629138
1,587
0.77
2.50 1,587
0.030
0.182
0.010
Y
0.49
2.50 1,587
1
0.140
0.010 0.010
0.010
0%
pHOS
0.182
pNOB
5%
Conservation
Y
Conservation
Natural Reproduction only
Primary
HRT Alternatives B
Primary
0.140
0.010
y
NoneCons
0%
0.140
pNOB
Cons
0.140
None
10
138
0.010
Ave
10
711
0.010
pHOS
None
0.030
0.010
1.8%
Current Habitat
100%
10
Cons
1.8%
y
Current Habitat
100%
1.8%
Current Habitat
Subregion/SubbasinNatural Reproduction only
0.030
pNOB
Salmon Summer Steelhead
Current Harvest
Conservation
Hatchery
Primary
Patterns
Patterns shown here are assigned to the population from
the AHA or ROL file. Red cells indicate patterns are not
assigned to this population/scenario in the rollup
application. The shown pattern needs to be added to the
application, or a different pattern should be assigned to
this population in the ROL/AHA file.
Current Habitat
Hydro -----> Current Hydro
y
138
Current Hydro
Current Harvest
Current Hydro
Current Harvest
Natural Reproduction only
Conservation
Natural Reproduction only
0.010
2.50
0.010
87,629
0.49
1
-
0.20
0.40
0.60
0.80
1.00
- 0.20 0.40 0.60 0.80 1.00pNOB
pH
OS
.5
.9
.8
.7
.6
.4.3.2
PNI
.1
0
100
200
300
400
500
600
700
800
Ha
tch
ery
Ha
bita
t
Ma
rin
e
L. M
ain
ste
m
U.
Ma
inste
m
Te
rmin
al
0
100
200
300
400
500
600
700
800
Ha
tch
ery
Ha
bita
t
Ma
rin
e
L. M
ain
ste
m
U.
Ma
inste
m
Te
rmin
al
0
100
200
300
400
500
600
700
800
Ha
tch
ery
Ha
bita
t
Ma
rin
e
L.
Ma
inste
m
U.
Ma
inste
m
Te
rmin
al
0
100
200
300
400
500
600
700
800
Ha
tch
ery
Ha
bita
t
Ma
rin
e
L.
Ma
inste
m
U.
Ma
inste
m
Te
rmin
al
0
100
200
300
400
500
600
700
800
Ha
tch
ery
Ha
bita
t
Ma
rin
e
L. M
ain
ste
m
U.
Ma
inste
m
Te
rmin
al
Ha
tch
ery
Ha
bita
tM
ari
ne L.
U.
Te
rmin
al
Apply & Recalculate
Update

USFWS Columbia Basin Hatchery Review Team: Lower Snake Assessments and Recommendations Reports–March 2011
42 Appendix A – AHA Output
Table A25. AHA output for Upper Middle Fork Salmon River steelhead (B-run ).
Population (Ctrl + Page Up/Down to Scroll)Species/Race Population Management Intent:
Harv&Hatchery Strategy:
Population Recovery Designation:
Ad. Capacity
% Kelt
Sm. Capacity
Ocean Surv Baseline SAR Vary? (Y/N) 0.092 0.018 0.048 0.018 0.048 0.018 0.048 0.018 0.048 0.018 0.048 0.018
Adult Passage
Adj. Capacity
Harv - Marine
Harv - L. Mainstem
Harv - U. Mainstem
Harv -Terminal
Total Exploitation Rate
Broodstock Composition
Type
Local Imported
Destination for HOR Returns
Productivity of Hatchery Fish
545
8Realized Spawning Composition
Relative Hatchery Optimum -> 80 80 80 80 80
Weir Factor ->
Relative Reproductive Success (HOS) -> 80% 80% 80% 80% 80%
Initial Fitness Factor (A) -> 0.81 0.81 0.81 0.81 0.81
Fitness Factor after 100 generations (B) -> 1.00 1.00 1.00 1.00 1.00
Average Fitness Factor (100 Generations) -> 0.99 0.99 0.99 0.99 0.99
Generations until average fitness is reached -> 30 30 30 30 30
Minimum Hatchery Program (% of BS Goal) -> Effective pHOS -> Effective pHOS -> Effective pHOS -> Effective pHOS -> Effective pHOS ->
"Fitness Floor" -> 0.5 pNOB -> pNOB -> pNOB -> pNOB -> pNOB ->
Calculated Hatchery SAR ->
Calculated Natural SAR ->
Max Min Max Min Max Min Max Min Max Min
NOR Escapement 2,608 326 2,608 326 2,608 326 2,608 326 2,608 326
HoS Total Escapement (includes strays)
All H Analyzer (AHA)
Harvest --->
Hatchery
Primary
1
1,667
y
0.77
Current
2.50
758
Ave
1.8%
Natural Reproduction only
2.50
No Hatchery
1,667 1,6672.50
758
0.182
5%
pHOS
1.8%
100%
Current Hydro
Current Harvest
Ave
y
HORs
HORs
0.010
HORs
0.030
HORs
0.010
0.140
0.010
0.030
Hydro
Harvest
NORs
NORs
1.13Adjusted Productivity
NORs
Juv Passage Surv.
NORs
NORs
0.140
pHOS
0.140
0.182
0.030
0.182
pNOB
0.182
1
0.010
0.49
2.50
0.010
HORs 0.010
1
138138
17-Salmon_Upper Middle Fork Salmon
Summer Steelhead (B-Run)
y
92,047
Historic
41,675
2.50 1,667
63
Productivity (Adult)
Min NOR EscapeHabitatSmolt Productivity
% to Hatchery
Purpose
Export Goal/Realized
Cons/Harv/Both
Broodstock by Source
Brood Exported (from HOR Surplus)
92,047
1.00 0.49
755
y
1.00
92,047
0.030
2.50
0.140
1,6671,667
0.010
0.140
0.010
0.140
1,667
y
Conservation
0.49
Primary
HRT Alternatives A
1,667
1
2.50
0.770.770.77
0.010 0.010
HSRG Solution
2.50
0.182
0.030
5%
0.1820.182
y
Int/Seg/Step/None
Smolt Release
100%% to Nat. Spawn. 100%
pNOB-Goal
pHOSpNOB
5%pHOS-Goal
None
PNI
None
pHOS-Realized
ConsCons
Strays
758
Ave Ave
758
0.0300.030
0.182
5%
Recruits/Spawner
Current Harvest
Fitness? [Y / N]
Current Hydro
Current HabitatHabitat ----->
92,047138
1,667
0.77
2.50 1,667
0.030
0.182
0.010
y
0.49
2.50 1,667
1
0.140
0.010 0.010
0.010
pHOS
0.182
pNOB
5%
Conservation
y
Conservation
Natural Reproduction only
Primary
HRT Alternatives B
Primary
0.140
0.010
y
NoneCons
0.140
pNOB
Cons
0.140
None
138
0.010
Ave
758
0.010
pHOS
None
0.030
0.010
1.8%
Current Habitat
100%
Cons
1.8%
y
Current Habitat
100%
1.8%
Current Habitat
Subregion/SubbasinNatural Reproduction only
0.030
pNOB
Salmon Summer Steelhead
Current Harvest
Conservation
Hatchery
Primary
Patterns
Patterns shown here are assigned to the population from
the AHA or ROL file. Red cells indicate patterns are not
assigned to this population/scenario in the rollup
application. The shown pattern needs to be added to the
application, or a different pattern should be assigned to
this population in the ROL/AHA file.
Current Habitat
Hydro -----> Current Hydro
y
138
Current Hydro
Current Harvest
Current Hydro
Current Harvest
Natural Reproduction only
Conservation
Natural Reproduction only
0.010
2.50
0.010
92,047
0.49
1
-
0.20
0.40
0.60
0.80
1.00
- 0.20 0.40 0.60 0.80 1.00pNOB
pH
OS
.5
.9
.8
.7
.6
.4.3.2
PNI
.1
0
100
200
300
400
500
600
700
800
Ha
tch
ery
Ha
bita
t
Ma
rin
e
L. M
ain
ste
m
U.
Ma
inste
m
Te
rmin
al
0
100
200
300
400
500
600
700
800
Ha
tch
ery
Ha
bita
t
Ma
rin
e
L. M
ain
ste
m
U.
Ma
inste
m
Te
rmin
al
0
100
200
300
400
500
600
700
800
Ha
tch
ery
Ha
bita
t
Ma
rin
e
L.
Ma
inste
m
U.
Ma
inste
m
Te
rmin
al
0
100
200
300
400
500
600
700
800
Ha
tch
ery
Ha
bita
t
Ma
rin
e
L.
Ma
inste
m
U.
Ma
inste
m
Te
rmin
al
0
100
200
300
400
500
600
700
800
Ha
tch
ery
Ha
bita
t
Ma
rin
e
L. M
ain
ste
m
U.
Ma
inste
m
Te
rmin
al
Ha
tch
ery
Ha
bita
tM
ari
ne L.
U.
Te
rmin
al
Apply & Recalculate
Update
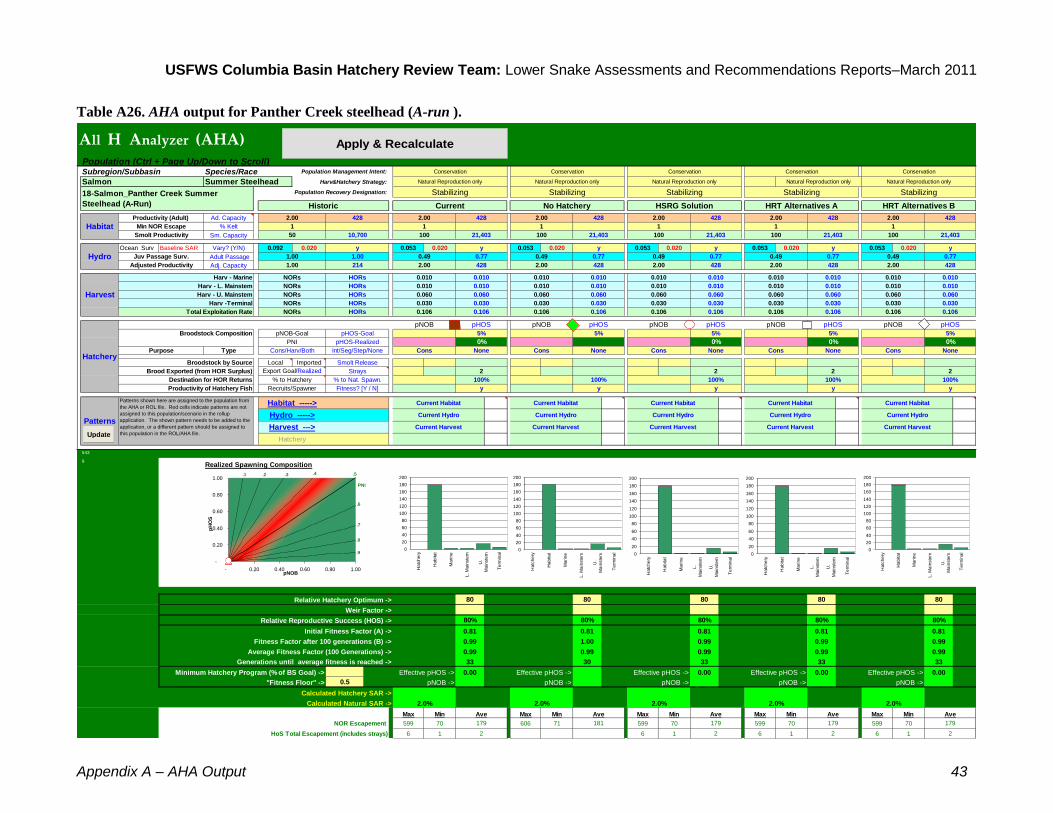
USFWS Columbia Basin Hatchery Review Team: Lower Snake Assessments and Recommendations Reports–March 2011
Appendix A – AHA Output 43
Table A26. AHA output for Panther Creek steelhead (A-run ).
Population (Ctrl + Page Up/Down to Scroll)Species/Race Population Management Intent:
Harv&Hatchery Strategy:
Population Recovery Designation:
Ad. Capacity
% Kelt
Sm. Capacity
Ocean Surv Baseline SAR Vary? (Y/N) 0.092 0.020 0.053 0.020 0.053 0.020 0.053 0.020 0.053 0.020 0.053 0.020
Adult Passage
Adj. Capacity
Harv - Marine
Harv - L. Mainstem
Harv - U. Mainstem
Harv -Terminal
Total Exploitation Rate
Broodstock Composition
Type
Local Imported
Destination for HOR Returns
Productivity of Hatchery Fish
543
9Realized Spawning Composition
Relative Hatchery Optimum -> 80 80 80 80 80
Weir Factor ->
Relative Reproductive Success (HOS) -> 80% 80% 80% 80% 80%
Initial Fitness Factor (A) -> 0.81 0.81 0.81 0.81 0.81
Fitness Factor after 100 generations (B) -> 0.99 1.00 0.99 0.99 0.99
Average Fitness Factor (100 Generations) -> 0.99 0.99 0.99 0.99 0.99
Generations until average fitness is reached -> 33 30 33 33 33
Minimum Hatchery Program (% of BS Goal) -> Effective pHOS -> 0.00 Effective pHOS -> Effective pHOS -> 0.00 Effective pHOS -> 0.00 Effective pHOS -> 0.00
"Fitness Floor" -> 0.5 pNOB -> pNOB -> pNOB -> pNOB -> pNOB ->
Calculated Hatchery SAR ->
Calculated Natural SAR ->
Max Min Max Min Max Min Max Min Max Min
NOR Escapement 599 70 606 71 599 70 599 70 599 70
HoS Total Escapement (includes strays) 6 1 6 1 6 1 6 1
All H Analyzer (AHA)
Harvest --->
Hatchery
Stabilizing
1
428
y
0.77
Current
2.00
181
Ave
2.0%
Natural Reproduction only
2.00
No Hatchery
428 4282.00
179
0.106
5%
pHOS
2
2
2.0%
100%
Current Hydro
Current Harvest
Ave
y
HORs
HORs
0.010
HORs
0.030
HORs
0.010
0.060
0.010
0.030
Hydro
Harvest
NORs
NORs
1.00Adjusted Productivity
NORs
Juv Passage Surv.
NORs
NORs
0.060
pHOS
0.060
0.106
0.030
0.106
pNOB
0.106
1
0.010
0.49
2.00
0.010
HORs 0.010
1
100100
18-Salmon_Panther Creek Summer
Steelhead (A-Run)
y
21,403
Historic
10,700
2.00 428
50
Productivity (Adult)
Min NOR EscapeHabitatSmolt Productivity
% to Hatchery
Purpose
Export Goal/Realized
Cons/Harv/Both
Broodstock by Source
Brood Exported (from HOR Surplus)
21,403
1.00 0.49
214
y
1.00
21,403
0.030
2.00
0.060
428428
0.010
0.060
0.010
0.060
428
y
Conservation
0.49
Stabilizing
HRT Alternatives A
428
1
2.00
0.770.770.77
0.010 0.010
HSRG Solution
2.00
2
0.106
0.030
5%
0.1060.106
2
y
Int/Seg/Step/None
Smolt Release
100%% to Nat. Spawn. 100%
pNOB-Goal
pHOSpNOB
5%pHOS-Goal
None
PNI 0%
None
pHOS-Realized
ConsCons
Strays
179
Ave Ave
179
2
0.030
0%
0.030
0.106
5%
Recruits/Spawner
Current Harvest
Fitness? [Y / N]
Current Hydro
Current HabitatHabitat ----->
21,403100
428
0.77
2.00 428
0.030
0.106
0.010
y
0.49
2.00 428
1
0.060
0.010 0.010
0.010
0%
pHOS
0.106
pNOB
5%
Conservation
y
Conservation
Natural Reproduction only
Stabilizing
HRT Alternatives B
Stabilizing
0.060
0.010
y
NoneCons
0%
0.060
pNOB
Cons
0.060
None
2
100
0.010
Ave
2
179
0.010
pHOS
None
0.030
0.010
2.0%
Current Habitat
100%
2
Cons
2.0%
y
Current Habitat
100%
2.0%
Current Habitat
Subregion/SubbasinNatural Reproduction only
0.030
pNOB
Salmon Summer Steelhead
Current Harvest
Conservation
Hatchery
Stabilizing
Patterns
Patterns shown here are assigned to the population from
the AHA or ROL file. Red cells indicate patterns are not
assigned to this population/scenario in the rollup
application. The shown pattern needs to be added to the
application, or a different pattern should be assigned to
this population in the ROL/AHA file.
Current Habitat
Hydro -----> Current Hydro
y
100
Current Hydro
Current Harvest
Current Hydro
Current Harvest
Natural Reproduction only
Conservation
Natural Reproduction only
0.010
2.00
0.010
21,403
0.49
1
-
0.20
0.40
0.60
0.80
1.00
- 0.20 0.40 0.60 0.80 1.00pNOB
pH
OS
.5
.9
.8
.7
.6
.4.3.2
PNI
.1
0
20
40
60
80
100
120
140
160
180
200
Ha
tch
ery
Ha
bita
t
Ma
rin
e
L. M
ain
ste
m
U.
Ma
inste
m
Te
rmin
al
0
20
40
60
80
100
120
140
160
180
200
Ha
tch
ery
Ha
bita
t
Ma
rin
e
L. M
ain
ste
m
U.
Ma
inste
m
Te
rmin
al
0
20
40
60
80
100
120
140
160
180
200
Ha
tch
ery
Ha
bita
t
Ma
rin
e
L.
Ma
inste
m
U.
Ma
inste
m
Te
rmin
al
0
20
40
60
80
100
120
140
160
180
200
Ha
tch
ery
Ha
bita
t
Ma
rin
e
L.
Ma
inste
m
U.
Ma
inste
m
Te
rmin
al
0
20
40
60
80
100
120
140
160
180
200
Ha
tch
ery
Ha
bita
t
Ma
rin
e
L. M
ain
ste
m
U.
Ma
inste
m
Te
rmin
al
Ha
tch
ery
Ha
bita
tM
ari
ne L.
U.
Te
rmin
al
Apply & Recalculate
Update
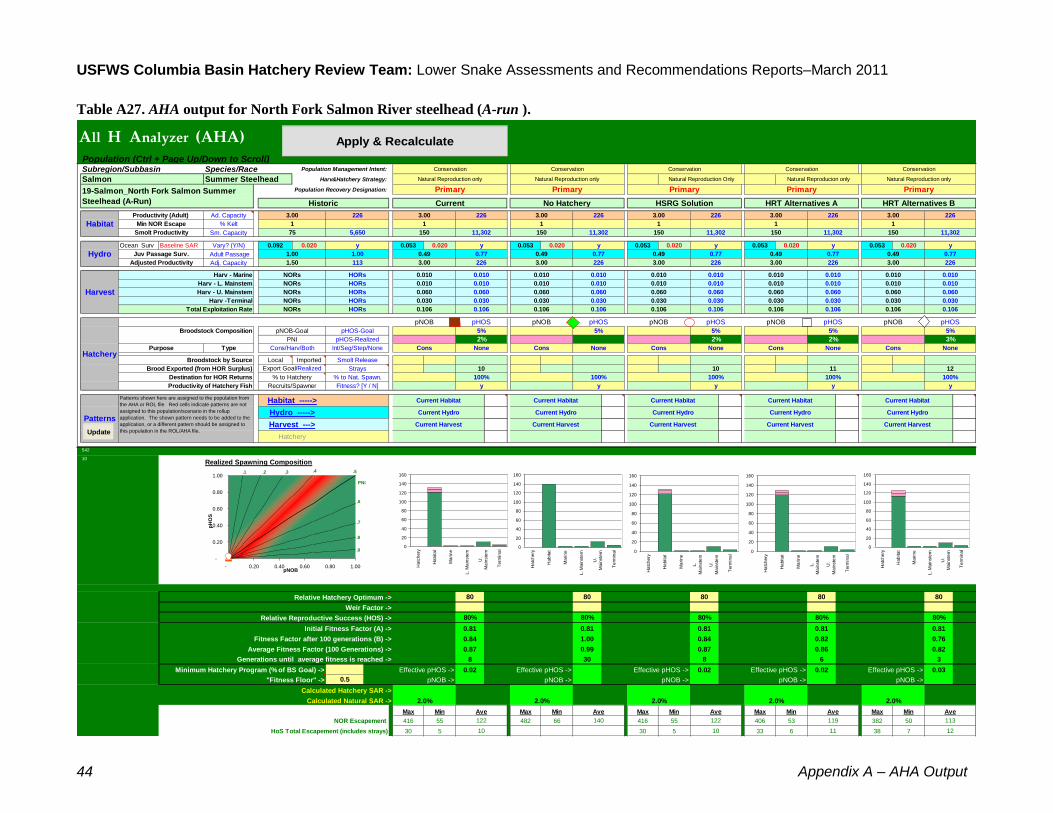
USFWS Columbia Basin Hatchery Review Team: Lower Snake Assessments and Recommendations Reports–March 2011
44 Appendix A – AHA Output
Table A27. AHA output for North Fork Salmon River steelhead (A-run ).
Population (Ctrl + Page Up/Down to Scroll)Species/Race Population Management Intent:
Harv&Hatchery Strategy:
Population Recovery Designation:
Ad. Capacity
% Kelt
Sm. Capacity
Ocean Surv Baseline SAR Vary? (Y/N) 0.092 0.020 0.053 0.020 0.053 0.020 0.053 0.020 0.053 0.020 0.053 0.020
Adult Passage
Adj. Capacity
Harv - Marine
Harv - L. Mainstem
Harv - U. Mainstem
Harv -Terminal
Total Exploitation Rate
Broodstock Composition
Type
Local Imported
Destination for HOR Returns
Productivity of Hatchery Fish
542
10Realized Spawning Composition
Relative Hatchery Optimum -> 80 80 80 80 80
Weir Factor ->
Relative Reproductive Success (HOS) -> 80% 80% 80% 80% 80%
Initial Fitness Factor (A) -> 0.81 0.81 0.81 0.81 0.81
Fitness Factor after 100 generations (B) -> 0.84 1.00 0.84 0.82 0.76
Average Fitness Factor (100 Generations) -> 0.87 0.99 0.87 0.86 0.82
Generations until average fitness is reached -> 8 30 8 6 3
Minimum Hatchery Program (% of BS Goal) -> Effective pHOS -> 0.02 Effective pHOS -> Effective pHOS -> 0.02 Effective pHOS -> 0.02 Effective pHOS -> 0.03
"Fitness Floor" -> 0.5 pNOB -> pNOB -> pNOB -> pNOB -> pNOB ->
Calculated Hatchery SAR ->
Calculated Natural SAR ->
Max Min Max Min Max Min Max Min Max Min
NOR Escapement 416 55 482 66 416 55 406 53 382 50
HoS Total Escapement (includes strays) 30 5 30 5 33 6 38 7
1
Natural Reproducion only
Current Hydro
Current Harvest
Current Hydro
Current HarvestCurrent Harvest
Conservation
Hatchery
Primary
Patterns
Patterns shown here are assigned to the population from
the AHA or ROL file. Red cells indicate patterns are not
assigned to this population/scenario in the rollup
application. The shown pattern needs to be added to the
application, or a different pattern should be assigned to
this population in the ROL/AHA file.
Current Habitat
Hydro -----> Current Hydro
y
Current Habitat
Subregion/SubbasinNatural Reproduction only
0.030
pNOB
Salmon Summer Steelhead
150
Conservation
12
Cons
2.0%
y
Current Habitat
100%
2.0%
0.030
0.010
2.0%
Current Habitat
0.010
pHOS
None
0.010
0.010
Ave
12
113
2%
0.060
pNOB
Cons
0.060
None
10
NoneCons
100%
Conservation
y
Conservation
Natural Reproduction only
Primary
HRT Alternatives B
Primary
15011,302
3%
pHOS
0.106
pNOB
5%
0.010 0.010
0.010
0.060
3.00 226
1
0.030
0.106
0.010
y
0.060
11,302150
226
0.77
3.00 226
0.49
Recruits/Spawner
Current Harvest
Fitness? [Y / N]
Current Hydro
Current HabitatHabitat ----->
0.030
2%
0.030
0.106
5%
122
Ave Ave
119
None
2%
None Cons
100%
pNOB-Goal
pHOSpNOB
5%pHOS-Goal
Int/Seg/Step/None
Smolt Release
% to Nat. Spawn.
pHOS-Realized
Cons
Strays
y
100%
10 11
HSRG Solution
3.00
11
0.106
0.030
5%
0.1060.106
0.770.77
0.010 0.010
0.010
3.00
0.010
0.49
226
y
Conservation
0.49
Primary
HRT Alternatives A
226
1
3.00
0.77
11,302
0.030
3.00
0.060
226226
0.010
0.060
0.010
0.060
PNI
Hydro
11,302
1.00 0.49
113
y
1.00
% to Hatchery
Purpose
Export Goal/Realized
Cons/Harv/Both
Broodstock by Source
Brood Exported (from HOR Surplus)
Productivity (Adult)
Min NOR EscapeHabitatSmolt Productivity
19-Salmon_North Fork Salmon Summer
Steelhead (A-Run)
y
11,302
Historic
5,650
3.00 226
75
1
0.010
0.49
3.00
0.010
HORs 0.010
1
150150
0.060
0.106
0.030
0.106
0.060Harvest
NORs
NORs
1.50Adjusted Productivity
NORs
Juv Passage Surv.
NORs
NORs
0.010
0.010
0.030
0.060
10
10
pHOSpNOB
0.106
2.0%
100%
Current Hydro
Current Harvest
Ave
y
0.106
5%
pHOS
140
Ave
2.0%
Natural Reproduction only
3.00
No Hatchery
226 2263.00
122
Primary
1
226
y
0.77
Current
3.00
y
Natural Reproduction Only
All H Analyzer (AHA)
Harvest --->
Hatchery
HORs
HORs
0.010
HORs
0.030
HORs
-
0.20
0.40
0.60
0.80
1.00
- 0.20 0.40 0.60 0.80 1.00pNOB
pH
OS
.5
.9
.8
.7
.6
.4.3.2
PNI
.1
0
20
40
60
80
100
120
140
160
Ha
tch
ery
Ha
bita
t
Ma
rin
e
L. M
ain
ste
m
U.
Ma
inste
m
Te
rmin
al
0
20
40
60
80
100
120
140
160
Ha
tch
ery
Ha
bita
t
Ma
rin
e
L. M
ain
ste
m
U.
Ma
inste
m
Te
rmin
al
0
20
40
60
80
100
120
140
160
Ha
tch
ery
Ha
bita
t
Ma
rin
e
L.
Ma
inste
m
U.
Ma
inste
m
Te
rmin
al
0
20
40
60
80
100
120
140
160
Ha
tch
ery
Ha
bita
t
Ma
rin
e
L.
Ma
inste
m
U.
Ma
inste
m
Te
rmin
al
0
20
40
60
80
100
120
140
160
Ha
tch
ery
Ha
bita
t
Ma
rin
e
L. M
ain
ste
m
U.
Ma
inste
m
Te
rmin
al
Ha
tch
ery
Ha
bita
tM
ari
ne L.
U.
Te
rmin
al
Apply & Recalculate
Update
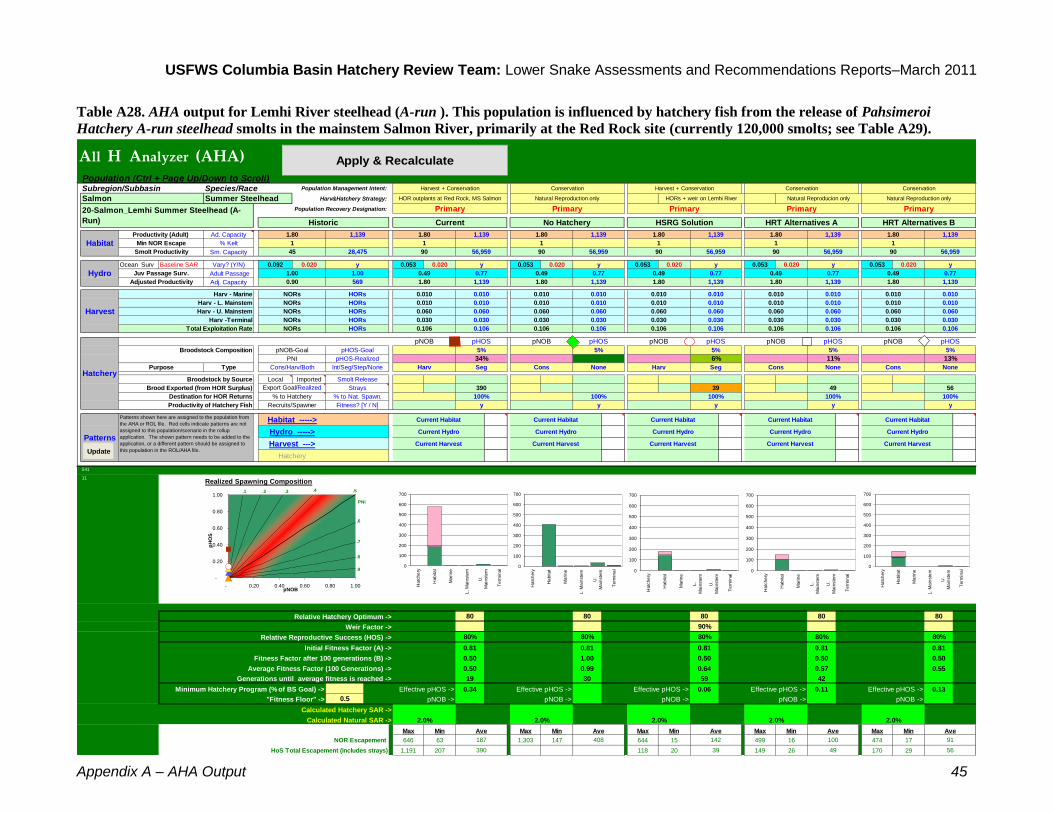
USFWS Columbia Basin Hatchery Review Team: Lower Snake Assessments and Recommendations Reports–March 2011
Appendix A – AHA Output 45
Table A28. AHA output for Lemhi River steelhead (A-run ). This population is influenced by hatchery fish from the release of Pahsimeroi
Hatchery A-run steelhead smolts in the mainstem Salmon River, primarily at the Red Rock site (currently 120,000 smolts; see Table A29).
Population (Ctrl + Page Up/Down to Scroll)Species/Race Population Management Intent:
Harv&Hatchery Strategy:
Population Recovery Designation:
Ad. Capacity
% Kelt
Sm. Capacity
Ocean Surv Baseline SAR Vary? (Y/N) 0.092 0.020 0.053 0.020 0.053 0.020 0.053 0.020 0.053 0.020 0.053 0.020
Adult Passage
Adj. Capacity
Harv - Marine
Harv - L. Mainstem
Harv - U. Mainstem
Harv -Terminal
Total Exploitation Rate
Broodstock Composition
Type
Local Imported
Destination for HOR Returns
Productivity of Hatchery Fish
541
11Realized Spawning Composition
Relative Hatchery Optimum -> 80 80 80 80 80
Weir Factor -> 90%
Relative Reproductive Success (HOS) -> 80% 80% 80% 80% 80%
Initial Fitness Factor (A) -> 0.81 0.81 0.81 0.81 0.81
Fitness Factor after 100 generations (B) -> 0.50 1.00 0.50 0.50 0.50
Average Fitness Factor (100 Generations) -> 0.50 0.99 0.64 0.57 0.55
Generations until average fitness is reached -> 19 30 59 42
Minimum Hatchery Program (% of BS Goal) -> Effective pHOS -> 0.34 Effective pHOS -> Effective pHOS -> 0.06 Effective pHOS -> 0.11 Effective pHOS -> 0.13
"Fitness Floor" -> 0.5 pNOB -> pNOB -> pNOB -> pNOB -> pNOB ->
Calculated Hatchery SAR ->
Calculated Natural SAR ->
Max Min Max Min Max Min Max Min Max Min
NOR Escapement 646 63 1,303 147 644 15 499 16 474 17
HoS Total Escapement (includes strays) 1,191 207 118 20 149 26 170 29
1
Natural Reproducion only
Current Hydro
Current Harvest
Current Hydro
Current HarvestCurrent Harvest
Harvest + Conservation
Hatchery
Primary
Patterns
Patterns shown here are assigned to the population from
the AHA or ROL file. Red cells indicate patterns are not
assigned to this population/scenario in the rollup
application. The shown pattern needs to be added to the
application, or a different pattern should be assigned to
this population in the ROL/AHA file.
Current Habitat
Hydro -----> Current Hydro
y
Current Habitat
Subregion/SubbasinNatural Reproduction only
0.030
pNOB
Salmon Summer Steelhead
90
Harvest + Conservation
56
Harv
2.0%
y
Current Habitat
100%
2.0%
0.030
0.010
2.0%
Current Habitat
0.010
pHOS
None
0.010
0.010
Ave
56
91
6%
0.060
pNOB
Cons
0.060
Seg
39
NoneCons
100%
Conservation
y
Conservation
Natural Reproduction only
Primary
HRT Alternatives B
Primary
9056,959
13%
pHOS
0.106
pNOB
5%
0.010 0.010
0.010
0.060
1.80 1,139
1
0.030
0.106
0.010
y
0.060
56,95990
1,139
0.77
1.80 1,139
0.49
Recruits/Spawner
Current Harvest
Fitness? [Y / N]
Current Hydro
Current HabitatHabitat ----->
0.030
11%
0.030
0.106
5%
142
Ave Ave
100
None
34%
Seg Cons
100%
pNOB-Goal
pHOSpNOB
5%pHOS-Goal
Int/Seg/Step/None
Smolt Release
% to Nat. Spawn.
pHOS-Realized
Harv
Strays
y
100%
39 49
HSRG Solution
1.80
49
0.106
0.030
5%
0.1060.106
0.770.77
0.010 0.010
0.010
1.80
0.010
0.49
1,139
y
Conservation
0.49
Primary
HRT Alternatives A
1,139
1
1.80
0.77
56,959
0.030
1.80
0.060
1,1391,139
0.010
0.060
0.010
0.060
PNI
Hydro
56,959
1.00 0.49
569
y
1.00
% to Hatchery
Purpose
Export Goal/Realized
Cons/Harv/Both
Broodstock by Source
Brood Exported (from HOR Surplus)
Productivity (Adult)
Min NOR EscapeHabitatSmolt Productivity
20-Salmon_Lemhi Summer Steelhead (A-
Run)
y
56,959
Historic
28,475
1.80 1,139
45
1
0.010
0.49
1.80
0.010
HORs 0.010
1
9090
0.060
0.106
0.030
0.106
0.060Harvest
NORs
NORs
0.90Adjusted Productivity
NORs
Juv Passage Surv.
NORs
NORs
0.010
0.010
0.030
0.060
390
390
pHOSpNOB
0.106
2.0%
100%
Current Hydro
Current Harvest
Ave
y
0.106
5%
pHOS
408
Ave
2.0%
HOR outplants at Red Rock, MS Salmon
1.80
No Hatchery
1,139 1,1391.80
187
Primary
1
1,139
y
0.77
Current
1.80
y
HORs + weir on Lemhi River
All H Analyzer (AHA)
Harvest --->
Hatchery
HORs
HORs
0.010
HORs
0.030
HORs
-
0.20
0.40
0.60
0.80
1.00
- 0.20 0.40 0.60 0.80 1.00pNOB
pH
OS
.5
.9
.8
.7
.6
.4.3.2
PNI
.1
0
100
200
300
400
500
600
700
Ha
tch
ery
Ha
bita
t
Ma
rin
e
L. M
ain
ste
m
U.
Ma
inste
m
Te
rmin
al
0
100
200
300
400
500
600
700
Ha
tch
ery
Ha
bita
t
Ma
rin
e
L. M
ain
ste
m
U.
Ma
inste
m
Te
rmin
al
0
100
200
300
400
500
600
700
Ha
tch
ery
Ha
bita
t
Ma
rin
e
L.
Ma
inste
m
U.
Ma
inste
m
Te
rmin
al
0
100
200
300
400
500
600
700
Ha
tch
ery
Ha
bita
t
Ma
rin
e
L.
Ma
inste
m
U.
Ma
inste
m
Te
rmin
al
0
100
200
300
400
500
600
700
Ha
tch
ery
Ha
bita
t
Ma
rin
e
L. M
ain
ste
m
U.
Ma
inste
m
Te
rmin
al
Ha
tch
ery
Ha
bita
tM
ari
ne L.
U.
Te
rmin
al
Apply & Recalculate
Update

USFWS Columbia Basin Hatchery Review Team: Lower Snake Assessments and Recommendations Reports–March 2011
46 Appendix A – AHA Output
Table A29. AHA output for Pahsimeroi Hatchery A-run steelhead released/outplanted in the mainstem Salmon River at Red Rock site,
downstream from the mouth of the Lemhi River.
Population (Ctrl + Page Up/Down to Scroll)Species/Race Population Management Intent:
Harv&Hatchery Strategy:
Population Recovery Designation:
Ad. Capacity
% Kelt
Sm. Capacity
Ocean Surv Baseline SAR Vary? (Y/N) 0.092 0.020 0.053 0.020 0.053 0.020 0.053 0.020 0.053 0.020 0.053 0.020
Adult Passage
Adj. Capacity
Harv - Marine
Harv - L. Mainstem
Harv - U. Mainstem
Harv -Terminal
Total Exploitation Rate
Broodstock Composition
Type
Local Imported 65 65
Destination for HOR Returns
Productivity of Hatchery Fish
790
12Realized Spawning Composition
Relative Hatchery Optimum -> 80 80 80 80 80
Weir Factor ->
Relative Reproductive Success (HOS) -> 25% 25% 25% 25% 25%
Initial Fitness Factor (A) -> 0.81 0.81 0.81 0.81 0.81
Fitness Factor after 100 generations (B) -> 0.50 1.00 0.50 1.00 1.00
Average Fitness Factor (100 Generations) -> 0.50 0.99 0.50 0.99 0.99
Generations until average fitness is reached -> 12 30 12 30 30
Minimum Hatchery Program (% of BS Goal) -> Effective pHOS -> 1.00 Effective pHOS -> Effective pHOS -> 1.00 Effective pHOS -> Effective pHOS ->
"Fitness Floor" -> 0.5 pNOB -> pNOB -> pNOB -> pNOB -> pNOB ->
Calculated Hatchery SAR ->
Calculated Natural SAR ->
Max Min Max Min Max Min Max Min Max Min
NOR Escapement 0 0 0 0 0 0 0 0 0 0
HoS Total Escapement (includes strays) 1,052 182 1,052 182
1
Natural Reproduction only
Current Hydro
Current Harvest
Current Hydro
Current HarvestCurrent Harvest
Harvest
Hatchery
Not listed; excluded from DPS
Patterns
Patterns shown here are assigned to the population from
the AHA or ROL file. Red cells indicate patterns are not
assigned to this population/scenario in the rollup
application. The shown pattern needs to be added to the
application, or a different pattern should be assigned to
this population in the ROL/AHA file.
Current Habitat
Hydro -----> Current Hydro
y
Current Habitat
Subregion/SubbasinNatural Reproduction only
0.030
pNOB
Salmon Summer Steelhead
0
Harvest
Harv
119,730
2.0%
y
Current Habitat
100%
2.0%
0.030
0.010
2.0%
Current Habitat
0.010
pHOS
None
0.010
0.010
Ave
0
100%
0.060
pNOB
Cons
0.060
Seg NoneCons
100%
Conservation
y
Conservation
Natural Reproduction only
N/A
HRT Alternatives B
N/A
01
pHOS
0.631
pNOB
0.010 0.010
0.010
0.060
0.00 0
1
0.600
0.631
0.010
y
0.060
10
0
0.77
0.00 0
0.49
Recruits/Spawner
0.7%
Current Harvest
12.9Fitness? [Y / N]
Current Hydro
Current HabitatHabitat ----->
0.0300.600
0.106
0
Ave Ave
0
None
100%
Seg Cons
100%
pNOB-Goal
pHOSpNOB
pHOS-Goal
Int/Seg/Step/None
Smolt Release
% to Nat. Spawn.
pHOS-Realized
Harv
Strays
12.9y
100%
344
HSRG Solution
0.00
0.631
0.600
0.1060.106
0.770.77
0.010 0.010
0.010
0.00
0.010
0.49
0
y
Conservation
0.49
N/A
HRT Alternatives A
0
1
0.00
0.77
1
0.600
0.00
0.060
00
0.010
0.060
0.010
0.060
PNI
Hydro
1
1.00 0.49
0
y
1.00
% to Hatchery
Purpose
Export Goal/Realized
Cons/Harv/Both
Broodstock by Source
Brood Exported (from HOR Surplus)
Productivity (Adult)
Min NOR EscapeHabitatSmolt Productivity
20A-Salmon_Lemhi Summer Steelhead (A-
Run-Pahsimeroi Hatchery)
y
1
Historic
0
0.00 0
0
1
0.010
0.49
0.00
0.010
HORs 0.010
1
00
0.060
0.106
0.030
0.631
0.060Harvest
NORs
NORs
0.00Adjusted Productivity
NORs
Juv Passage Surv.
NORs
NORs
0.010
0.010
0.600
0.060
344
pHOSpNOB
0.106
119,730
0.7%
2.0%
100%
Current Hydro
Current Harvest
Ave
y
0.631
pHOS
0
Ave
2.0%
HOR outplants at Red Rock
0.00
No Hatchery
0 00.00
0
Not listed; excluded from DPS
1
0
y
0.77
Current
0.00
y
HORs + weir on Lemhi River
All H Analyzer (AHA)
Harvest --->
Hatchery
HORs
HORs
0.010
HORs
0.030
HORs
-
0.20
0.40
0.60
0.80
1.00
- 0.20 0.40 0.60 0.80 1.00pNOB
pH
OS
.5
.9
.8
.7
.6
.4.3.2
PNI
.1
0
100
200
300
400
500
600
Ha
tch
ery
Ha
bita
t
Ma
rin
e
L. M
ain
ste
m
U.
Ma
inste
m
Te
rmin
al
0
100
200
300
400
500
600
Ha
tch
ery
Ha
bita
t
Ma
rin
e
L. M
ain
ste
m
U.
Ma
inste
m
Te
rmin
al
0
100
200
300
400
500
600
Ha
tch
ery
Ha
bita
t
Ma
rin
e
L.
Ma
inste
m
U.
Ma
inste
m
Te
rmin
al
0
100
200
300
400
500
600
Ha
tch
ery
Ha
bita
t
Ma
rin
e
L.
Ma
inste
m
U.
Ma
inste
m
Te
rmin
al
0
100
200
300
400
500
600
Ha
tch
ery
Ha
bita
t
Ma
rin
e
L. M
ain
ste
m
U.
Ma
inste
m
Te
rmin
al
Ha
tch
ery
Ha
bita
tM
ari
ne L.
U.
Te
rmin
al
Apply & Recalculate
Update

USFWS Columbia Basin Hatchery Review Team: Lower Snake Assessments and Recommendations Reports–March 2011
Appendix A – AHA Output 47
Table A30. AHA output for Pahsimeroi River steelhead (A-run). This population is influenced primarily by the release of Pahsimeroi Hatchery
A-run steelhead smolts at the hatchery weir on the Pahsimeroi River.
Population (Ctrl + Page Up/Down to Scroll)Species/Race Population Management Intent:
Harv&Hatchery Strategy:
Population Recovery Designation:
Ad. Capacity
% Kelt
Sm. Capacity
Ocean Surv Baseline SAR Vary? (Y/N) 0.098 0.020 0.053 0.020 0.053 0.020 0.053 0.020 0.053 0.020 0.053 0.020
Adult Passage
Adj. Capacity
Harv - Marine
Harv - L. Mainstem
Harv - U. Mainstem
Harv -Terminal
Total Exploitation Rate
Broodstock Composition
Type
Local Imported
Destination for HOR Returns
Productivity of Hatchery Fish
464
13Realized Spawning Composition
Relative Hatchery Optimum -> 80 80 80 80 80
Weir Factor ->
Relative Reproductive Success (HOS) -> 80% 80% 80% 80% 80%
Initial Fitness Factor (A) -> 0.81 0.81 0.81 0.81 0.81
Fitness Factor after 100 generations (B) -> 0.50 1.00 0.50 0.50 0.50
Average Fitness Factor (100 Generations) -> 0.51 0.99 0.51 0.51 0.50
Generations until average fitness is reached -> 27 30 27 26 22
Minimum Hatchery Program (% of BS Goal) -> Effective pHOS -> 0.25 Effective pHOS -> Effective pHOS -> 0.25 Effective pHOS -> 0.26 Effective pHOS -> 0.27
"Fitness Floor" -> 0.5 pNOB -> pNOB -> pNOB -> pNOB -> pNOB ->
Calculated Hatchery SAR ->
Calculated Natural SAR ->
Max Min Max Min Max Min Max Min Max Min
NOR Escapement 204 17 929 101 208 17 203 18 226 21
HoS Total Escapement (includes strays) 262 45 250 44 285 49 331 58
1
Segregated Hatchery
Current Hydro
Current Harvest
Current Hydro
Current HarvestCurrent Harvest
Conservation and Harvest
Hatchery
Contributing
Patterns
Patterns shown here are assigned to the population from
the AHA or ROL file. Red cells indicate patterns are not
assigned to this population/scenario in the rollup
application. The shown pattern needs to be added to the
application, or a different pattern should be assigned to
this population in the ROL/AHA file.
Current Habitat
Hydro -----> Current Hydro
y
Current Habitat
Subregion/SubbasinNatural Reproduction only
0.030
pNOB
Salmon Summer Steelhead
83
Conservation and Harvest
109
Both
2.0%
y
Current Habitat
100%
2.0%
0.030
0.010
2.0%
Current Habitat
0.010
pHOS
None
0.010
0.010
Ave
109
72
25%
0.060
pNOB
Both
0.060
None
82
NoneBoth
100%
Conservation
y
Conservation and Harvest
Segregated Hatchery
Contributing
HRT Alternatives B
Contributing
8351,459
27%
pHOS
0.106
pNOB
10%
0.010 0.010
0.010
0.060
1.65 1,029
1
0.030
0.106
0.010
y
0.060
51,45983
1,029
0.77
1.65 1,029
0.49
Recruits/Spawner
Current Harvest
Fitness? [Y / N]
Current Hydro
Current HabitatHabitat ----->
0.030
26%
0.030
0.106
10%
61
Ave Ave
66
None
25%
None Cons
100%
pNOB-Goal
pHOSpNOB
10%pHOS-Goal
Int/Seg/Step/None
Smolt Release
% to Nat. Spawn.
pHOS-Realized
Both
Strays
y
100%
82 93
HSRG Solution
1.65
93
0.106
0.030
10%
0.1060.106
0.770.77
0.010 0.010
0.010
1.65
0.010
0.49
1,029
y
Conservation and Harvest
0.49
Contributing
HRT Alternatives A
1,029
1
1.65
0.77
51,459
0.030
1.65
0.060
1,0291,029
0.010
0.060
0.010
0.060
PNI
Hydro
51,459
1.00 0.49
514
y
1.00
% to Hatchery
Purpose
Export Goal/Realized
Cons/Harv/Both
Broodstock by Source
Brood Exported (from HOR Surplus)
Productivity (Adult)
Min NOR EscapeHabitatSmolt Productivity
21-Salmon_Pahsimeroi Summer Steelhead
(A-Run)
y
51,459
Historic
25,725
1.65 1,029
41
1
0.010
0.49
1.65
0.010
HORs 0.010
1
8383
0.060
0.106
0.030
0.106
0.060Harvest
NORs
NORs
0.82Adjusted Productivity
NORs
Juv Passage Surv.
NORs
NORs
0.010
0.010
0.030
0.060
86
86
pHOSpNOB
0.106
2.0%
100%
Current Hydro
Current Harvest
Ave
y
0.106
10%
pHOS
309
Ave
2.0%
Segregated Hatchery
1.65
No Hatchery
1,029 1,0291.65
63
Contributing
1
1,029
y
0.77
Current
1.65
y
Segregated Hatchery
All H Analyzer (AHA)
Harvest --->
Hatchery
HORs
HORs
0.010
HORs
0.030
HORs
-
0.20
0.40
0.60
0.80
1.00
- 0.20 0.40 0.60 0.80 1.00pNOB
pH
OS
.5
.9
.8
.7
.6
.4.3.2
PNI
.1
0
50
100
150
200
250
300
350
Ha
tch
ery
Ha
bita
t
Ma
rin
e
L. M
ain
ste
m
U.
Ma
inste
m
Te
rmin
al
0
50
100
150
200
250
300
350
Ha
tch
ery
Ha
bita
t
Ma
rin
e
L. M
ain
ste
m
U.
Ma
inste
m
Te
rmin
al
0
50
100
150
200
250
300
350
Ha
tch
ery
Ha
bita
t
Ma
rin
e
L.
Ma
inste
m
U.
Ma
inste
m
Te
rmin
al
0
50
100
150
200
250
300
350
Ha
tch
ery
Ha
bita
t
Ma
rin
e
L.
Ma
inste
m
U.
Ma
inste
m
Te
rmin
al
0
50
100
150
200
250
300
350
Ha
tch
ery
Ha
bita
t
Ma
rin
e
L. M
ain
ste
m
U.
Ma
inste
m
Te
rmin
al
Ha
tch
ery
Ha
bita
tM
ari
ne L.
U.
Te
rmin
al
Apply & Recalculate
Update
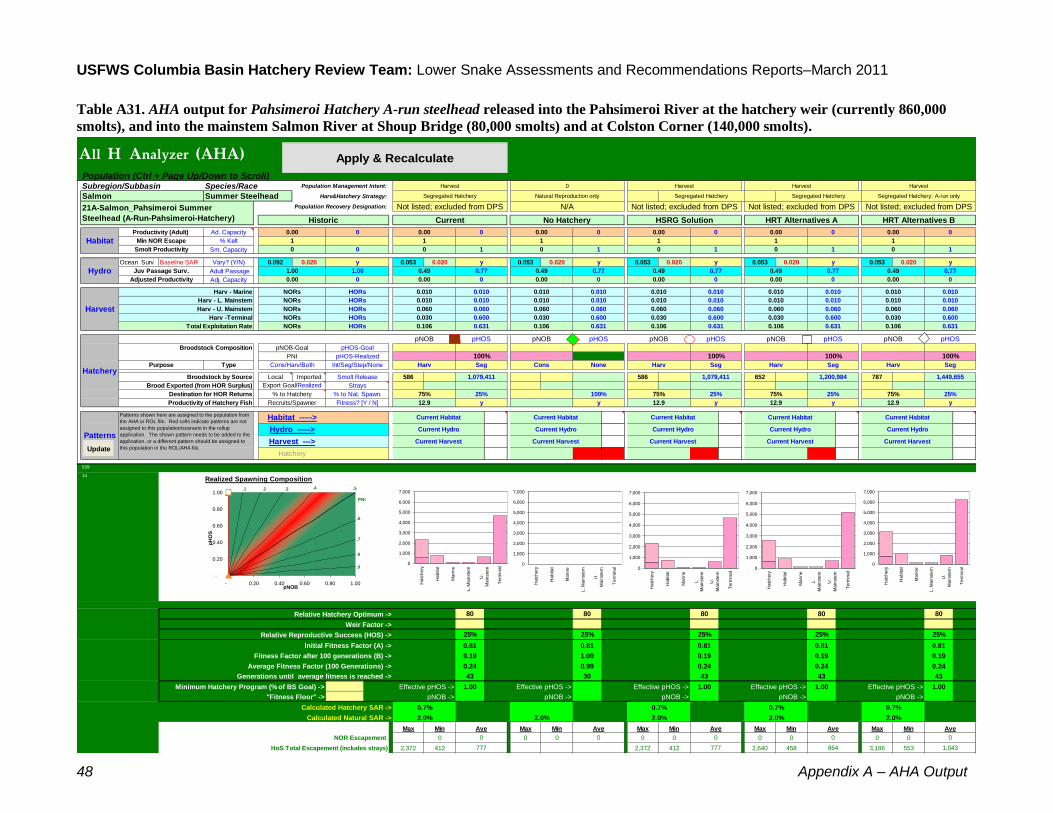
USFWS Columbia Basin Hatchery Review Team: Lower Snake Assessments and Recommendations Reports–March 2011
48 Appendix A – AHA Output
Table A31. AHA output for Pahsimeroi Hatchery A-run steelhead released into the Pahsimeroi River at the hatchery weir (currently 860,000
smolts), and into the mainstem Salmon River at Shoup Bridge (80,000 smolts) and at Colston Corner (140,000 smolts).
Population (Ctrl + Page Up/Down to Scroll)Species/Race Population Management Intent:
Harv&Hatchery Strategy:
Population Recovery Designation:
Ad. Capacity
% Kelt
Sm. Capacity
Ocean Surv Baseline SAR Vary? (Y/N) 0.092 0.020 0.053 0.020 0.053 0.020 0.053 0.020 0.053 0.020 0.053 0.020
Adult Passage
Adj. Capacity
Harv - Marine
Harv - L. Mainstem
Harv - U. Mainstem
Harv -Terminal
Total Exploitation Rate
Broodstock Composition
Type
Local Imported 586 586 652 787
Destination for HOR Returns
Productivity of Hatchery Fish
539
14Realized Spawning Composition
Relative Hatchery Optimum -> 80 80 80 80 80
Weir Factor ->
Relative Reproductive Success (HOS) -> 25% 25% 25% 25% 25%
Initial Fitness Factor (A) -> 0.81 0.81 0.81 0.81 0.81
Fitness Factor after 100 generations (B) -> 0.19 1.00 0.19 0.19 0.19
Average Fitness Factor (100 Generations) -> 0.24 0.99 0.24 0.24 0.24
Generations until average fitness is reached -> 43 30 43 43 43
Minimum Hatchery Program (% of BS Goal) -> Effective pHOS -> 1.00 Effective pHOS -> Effective pHOS -> 1.00 Effective pHOS -> 1.00 Effective pHOS -> 1.00
"Fitness Floor" -> pNOB -> pNOB -> pNOB -> pNOB -> pNOB ->
Calculated Hatchery SAR ->
Calculated Natural SAR ->
Max Min Max Min Max Min Max Min Max Min
NOR Escapement 0 0 0 0 0 0 0 0 0 0
HoS Total Escapement (includes strays) 2,372 412 2,372 412 2,640 458 3,186 553
1
Segregated Hatchery
Current Hydro
Current Harvest
Current Hydro
Current HarvestCurrent Harvest
Harvest
Hatchery
Not listed; excluded from DPS
Patterns
Patterns shown here are assigned to the population from
the AHA or ROL file. Red cells indicate patterns are not
assigned to this population/scenario in the rollup
application. The shown pattern needs to be added to the
application, or a different pattern should be assigned to
this population in the ROL/AHA file.
Current Habitat
Hydro -----> Current Hydro
y
Current Habitat
Subregion/SubbasinNatural Reproduction only
0.030
pNOB
Salmon Summer Steelhead
0
Harvest
Harv
1,079,411
2.0%
y
Current Habitat
25%
2.0%
0.030
0.010
2.0%
Current Habitat
0.7%
0.010
pHOS
1,200,984
Seg
0.010
0.010
0.7%
Ave
1,043
0
12.9
100%
0.060
pNOB
Harv
0.060
Seg
1,449,655
SegHarv
75% 25%
0
y
Harvest
Segregated Hatchery: A-run only
Not listed; excluded from DPS
HRT Alternatives B
N/A
01
100%
pHOS
0.631
pNOB
0.010 0.010
0.010
0.060
0.00 0
1
0.600
0.631
0.010
y
0.060
10
0
0.77
0.00 0
0.49
Recruits/Spawner
0.7%
Current Harvest
12.9Fitness? [Y / N]
Current Hydro
Current HabitatHabitat ----->
0.030
100%
0.600
0.106
0
Ave Ave
0
None
100%
Seg Cons
25%
pNOB-Goal
pHOSpNOB
pHOS-Goal
Int/Seg/Step/None
Smolt Release
% to Nat. Spawn. 75%
pHOS-Realized
Harv
Strays
12.9
75%
y
100%
777 864
HSRG Solution
0.00
75%
0.631
0.600
0.1060.106
0.770.77
0.010 0.010
0.010
0.00
0.010
0.49
0
y
Harvest
0.49
Not listed; excluded from DPS
HRT Alternatives A
0
1
0.00
0.77
1
0.600
0.00
0.060
00
0.010
0.060
0.010
0.060
PNI
Hydro
1
1.00 0.49
0
y
1.00
% to Hatchery
Purpose
Export Goal/Realized
Cons/Harv/Both
Broodstock by Source
Brood Exported (from HOR Surplus)
Productivity (Adult)
Min NOR EscapeHabitatSmolt Productivity
21A-Salmon_Pahsimeroi Summer
Steelhead (A-Run-Pahsimeroi-Hatchery)
y
1
Historic
0
0.00 0
0
1
0.010
0.49
0.00
0.010
HORs 0.010
1
00
0.060
0.106
0.030
0.631
0.060Harvest
NORs
NORs
0.00Adjusted Productivity
NORs
Juv Passage Surv.
NORs
NORs
0.010
0.010
0.600
0.060
777
pHOSpNOB
0.106
1,079,411
0.7%
2.0%
25%
Current Hydro
Current Harvest
Ave
y
0.631
pHOS
0
Ave
2.0%
Segregated Hatchery
0.00
No Hatchery
0 00.00
0
Not listed; excluded from DPS
1
0
y
0.77
Current
0.00
12.9 y
Segregated Hatchery
All H Analyzer (AHA)
Harvest --->
Hatchery
HORs
HORs
0.010
HORs
0.030
HORs
-
0.20
0.40
0.60
0.80
1.00
- 0.20 0.40 0.60 0.80 1.00pNOB
pH
OS
.5
.9
.8
.7
.6
.4.3.2
PNI
.1
0
1,000
2,000
3,000
4,000
5,000
6,000
7,000
Ha
tch
ery
Ha
bita
t
Ma
rin
e
L. M
ain
ste
m
U.
Ma
inste
m
Te
rmin
al
0
1,000
2,000
3,000
4,000
5,000
6,000
7,000
Ha
tch
ery
Ha
bita
t
Ma
rin
e
L. M
ain
ste
m
U.
Ma
inste
m
Te
rmin
al
0
1,000
2,000
3,000
4,000
5,000
6,000
7,000
Ha
tch
ery
Ha
bita
t
Ma
rin
e
L.
Ma
inste
m
U.
Ma
inste
m
Te
rmin
al
0
1,000
2,000
3,000
4,000
5,000
6,000
7,000
Ha
tch
ery
Ha
bita
t
Ma
rin
e
L.
Ma
inste
m
U.
Ma
inste
m
Te
rmin
al
0
1,000
2,000
3,000
4,000
5,000
6,000
7,000
Ha
tch
ery
Ha
bita
t
Ma
rin
e
L. M
ain
ste
m
U.
Ma
inste
m
Te
rmin
al
Ha
tch
ery
Ha
bita
tM
ari
ne L.
U.
Te
rmin
al
Apply & Recalculate
Update

USFWS Columbia Basin Hatchery Review Team: Lower Snake Assessments and Recommendations Reports–March 2011
Appendix A – AHA Output 49
Table A32. AHA output for localized B-run summer steelhead smolts (derived from Dworshak NFH stock) released into the Pahsimeroi River.
The modeled program represents an annual release of 250,000 smolts derived from adult fish returning to the weir on the Pahsimeroi River.
Population (Ctrl + Page Up/Down to Scroll)Species/Race Population Management Intent:
Harv&Hatchery Strategy:
Population Recovery Designation:
Ad. Capacity
% Kelt
Sm. Capacity
Ocean Surv Baseline SAR Vary? (Y/N) 0.092 0.020 0.048 0.018 0.048 0.018 0.048 0.018 0.048 0.018 0.048 0.018
Adult Passage
Adj. Capacity
Harv - Marine
Harv - L. Mainstem
Harv - U. Mainstem
Harv -Terminal
Total Exploitation Rate
Broodstock Composition
Type
Local Imported 124
Destination for HOR Returns
Productivity of Hatchery Fish
950
15Realized Spawning Composition
Relative Hatchery Optimum -> 80 80 80 80 80
Weir Factor ->
Relative Reproductive Success (HOS) -> 25% 25% 25% 25% 25%
Initial Fitness Factor (A) -> 0.81 0.81 0.81 0.81 0.81
Fitness Factor after 100 generations (B) -> 1.00 1.00 1.00 0.19 1.00
Average Fitness Factor (100 Generations) -> 0.99 0.99 0.99 0.24 0.99
Generations until average fitness is reached -> 30 30 30 43 30
Minimum Hatchery Program (% of BS Goal) -> Effective pHOS -> Effective pHOS -> Effective pHOS -> Effective pHOS -> 1.00 Effective pHOS ->
"Fitness Floor" -> pNOB -> pNOB -> pNOB -> pNOB -> pNOB ->
Calculated Hatchery SAR ->
Calculated Natural SAR ->
Max Min Max Min Max Min Max Min Max Min
NOR Escapement 0 0 0 0 0 0 0 0 0 0
HoS Total Escapement (includes strays) 100 17
1
Segregated Hatchery
Current Hydro
Current Harvest
Current Hydro
Current HarvestCurrent Harvest
Harvest
Hatchery
N/A
Patterns
Patterns shown here are assigned to the population from
the AHA or ROL file. Red cells indicate patterns are not
assigned to this population/scenario in the rollup
application. The shown pattern needs to be added to the
application, or a different pattern should be assigned to
this population in the ROL/AHA file.
Current Habitat
Hydro -----> Current Hydro
y
Current Habitat
Subregion/SubbasinNatural Reproduction only
0.030
pNOB
Salmon Summer Steelhead
0
Harvest
Harv
1.8%
y
Current Habitat
10%
1.8%
0.030
0.010
1.8%
Current Habitat
0.4%
0.010
pHOS
249,240
Seg
0.010
0.010
Ave
0
7.1
0.140
pNOB
Harv
0.140
None NoneHarv
100%
Conservation
y
Harvest
No B-run program in upper Salmon Riv.
N/A
HRT Alternatives B
N/A
01
pHOS
0.663
pNOB
0.010 0.010
0.010
0.140
0.00 0
1
0.600
0.663
0.010
y
0.140
10
0
0.77
0.00 0
0.49
Recruits/Spawner
Current Harvest
Fitness? [Y / N]
Current Hydro
Current HabitatHabitat ----->
0.030
100%
0.600
0.182
0
Ave Ave
0
NoneNone Cons
100%
pNOB-Goal
pHOSpNOB
pHOS-Goal
Int/Seg/Step/None
Smolt Release
% to Nat. Spawn.
pHOS-Realized
Harv
Strays
y
100%
32
HSRG Solution
0.00
90%
0.663
0.600
0.1820.182
0.770.77
0.010 0.010
0.010
0.00
0.010
0.49
0
y
Harvest
0.49
Not listed; excluded from DPS
HRT Alternatives A
0
1
0.00
0.77
1
0.600
0.00
0.140
00
0.010
0.140
0.010
0.140
PNI
Hydro
1
1.00 0.49
0
y
1.00
% to Hatchery
Purpose
Export Goal/Realized
Cons/Harv/Both
Broodstock by Source
Brood Exported (from HOR Surplus)
Productivity (Adult)
Min NOR EscapeHabitatSmolt Productivity
21B-Salmon_Pahsimeroi Summer
Steelhead (B-Run-Pahsimeroi-Hatchery)
y
1
Historic
0
0.00 0
0
1
0.010
0.49
0.00
0.010
HORs 0.010
1
00
0.140
0.182
0.030
0.663
0.140Harvest
NORs
NORs
0.00Adjusted Productivity
NORs
Juv Passage Surv.
NORs
NORs
0.010
0.010
0.600
0.140
pHOSpNOB
0.182
1.8%
100%
Current Hydro
Current Harvest
Ave
y
0.663
pHOS
0
Ave
1.8%
B-run outplants elsewhere in Salmon Riv.
0.00
No Hatchery
0 00.00
0
N/A
1
0
y
0.77
Current
0.00
y
B-run program in E.F.
All H Analyzer (AHA)
Harvest --->
Hatchery
HORs
HORs
0.010
HORs
0.030
HORs
-
0.20
0.40
0.60
0.80
1.00
- 0.20 0.40 0.60 0.80 1.00pNOB
pH
OS
.5
.9
.8
.7
.6
.4.3.2
PNI
.1
0
100
200
300
400
500
600
700
Ha
tch
ery
Ha
bita
t
Ma
rin
e
L. M
ain
ste
m
U.
Ma
inste
m
Te
rmin
al
0
100
200
300
400
500
600
700
Ha
tch
ery
Ha
bita
t
Ma
rin
e
L. M
ain
ste
m
U.
Ma
inste
m
Te
rmin
al
0
100
200
300
400
500
600
700
Ha
tch
ery
Ha
bita
t
Ma
rin
e
L.
Ma
inste
m
U.
Ma
inste
m
Te
rmin
al
0
100
200
300
400
500
600
700
Ha
tch
ery
Ha
bita
t
Ma
rin
e
L.
Ma
inste
m
U.
Ma
inste
m
Te
rmin
al
0
100
200
300
400
500
600
700
Ha
tch
ery
Ha
bita
t
Ma
rin
e
L. M
ain
ste
m
U.
Ma
inste
m
Te
rmin
al
Ha
tch
ery
Ha
bita
tM
ari
ne L.
U.
Te
rmin
al
Apply & Recalculate
Update
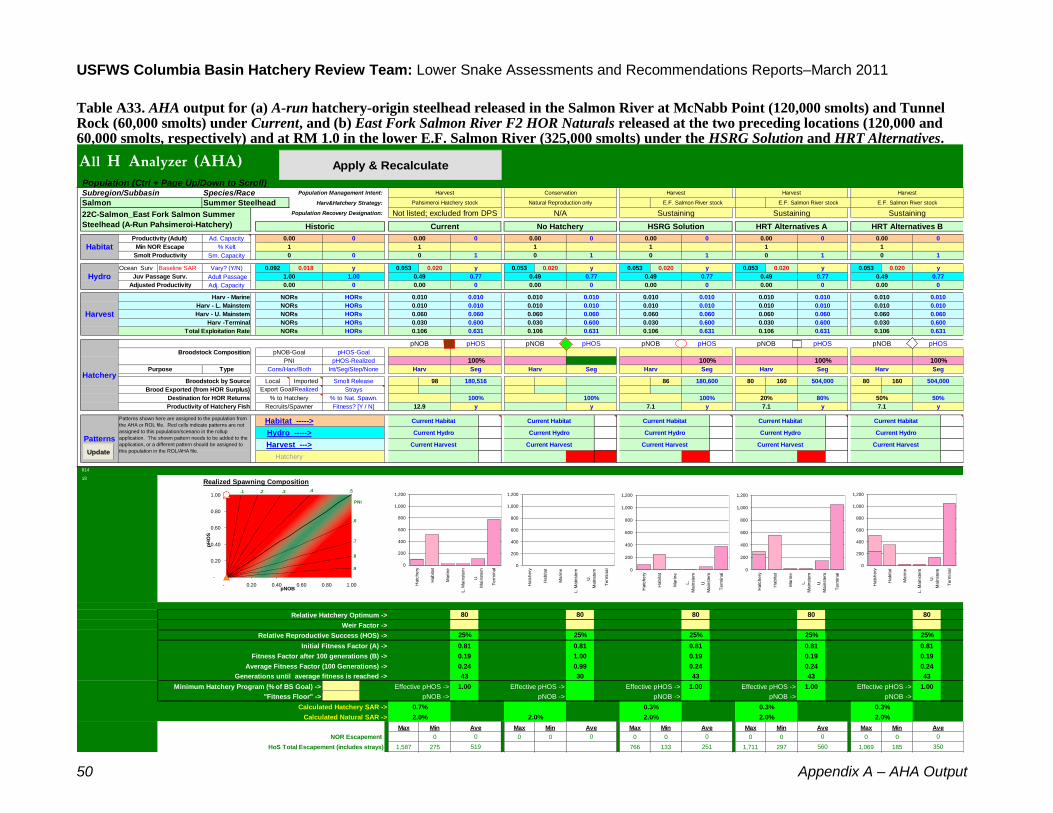
USFWS Columbia Basin Hatchery Review Team: Lower Snake Assessments and Recommendations Reports–March 2011
50 Appendix A – AHA Output
Table A33. AHA output for (a) A-run hatchery-origin steelhead released in the Salmon River at McNabb Point (120,000 smolts) and Tunnel Rock (60,000 smolts) under Current, and (b) East Fork Salmon River F2 HOR Naturals released at the two preceding locations (120,000 and 60,000 smolts, respectively) and at RM 1.0 in the lower E.F. Salmon River (325,000 smolts) under the HSRG Solution and HRT Alternatives.
Population (Ctrl + Page Up/Down to Scroll)Species/Race Population Management Intent:
Harv&Hatchery Strategy:
Population Recovery Designation:
Ad. Capacity
% Kelt
Sm. Capacity
Ocean Surv Baseline SAR Vary? (Y/N) 0.092 0.018 0.053 0.020 0.053 0.020 0.053 0.020 0.053 0.020 0.053 0.020
Adult Passage
Adj. Capacity
Harv - Marine
Harv - L. Mainstem
Harv - U. Mainstem
Harv -Terminal
Total Exploitation Rate
Broodstock Composition
Type
Local Imported 98 86 80 160 80 160
Destination for HOR Returns
Productivity of Hatchery Fish
814
18Realized Spawning Composition
Relative Hatchery Optimum -> 80 80 80 80 80
Weir Factor ->
Relative Reproductive Success (HOS) -> 25% 25% 25% 25% 25%
Initial Fitness Factor (A) -> 0.81 0.81 0.81 0.81 0.81
Fitness Factor after 100 generations (B) -> 0.19 1.00 0.19 0.19 0.19
Average Fitness Factor (100 Generations) -> 0.24 0.99 0.24 0.24 0.24
Generations until average fitness is reached -> 43 30 43 43 43
Minimum Hatchery Program (% of BS Goal) -> Effective pHOS -> 1.00 Effective pHOS -> Effective pHOS -> 1.00 Effective pHOS -> 1.00 Effective pHOS -> 1.00
"Fitness Floor" -> pNOB -> pNOB -> pNOB -> pNOB -> pNOB ->
Calculated Hatchery SAR ->
Calculated Natural SAR ->
Max Min Max Min Max Min Max Min Max Min
NOR Escapement 0 0 0 0 0 0 0 0 0 0
HoS Total Escapement (includes strays) 1,587 275 766 133 1,711 297 1,069 185
E.F. Salmon River stock
All H Analyzer (AHA)
Harvest --->
Hatchery
HORs
HORs
0.010
HORs
0.030
HORs
7.1 y
Not listed; excluded from DPS
1
0
y
0.77
Current
0.00
0
Ave
2.0%
Pahsimeroi Hatchery stock
0.00
No Hatchery
0 00.00
0
0.631
pHOS
2.0%
100%
Current Hydro
Current Harvest
Ave
y
0.010
0.600
0.060
519
pHOSpNOB
0.106
180,516
0.7%
Juv Passage Surv.
NORs
NORs
0.010
NORs
0.00Adjusted Productivity
NORs
0.060
0.106
0.030
0.631
0.060
1
0.010
0.49
0.00
0.010
HORs 0.010
1
00
22C-Salmon_East Fork Salmon Summer
Steelhead (A-Run Pahsimeroi-Hatchery)
y
1
Historic
0
0.00 0
0
Productivity (Adult)
Min NOR EscapeHabitatSmolt Productivity
% to Hatchery
Purpose
Export Goal/Realized
Cons/Harv/Both
Broodstock by Source
Brood Exported (from HOR Surplus)
PNI
Hydro
1
1.00 0.49
0
y
1.00
Harvest
NORs
0.600
0.00
0.060
00
0.010
0.060
0.010
0
y
Harvest
0.49
Sustaining
HRT Alternatives A
0
1
0.00
0.770.770.77
0.010 0.010
0.010
0.00
0.010
0.49
HSRG Solution
0.00
20%
0.631
0.600
0.1060.106
251 560
7.1y
100%
Int/Seg/Step/None
Smolt Release
% to Nat. Spawn.
pHOS-Realized
Harv
Strays
100%
pNOB-Goal
pHOSpNOB
pHOS-Goal
Seg
100%
Seg Harv
0
Ave Ave
0
0.030
100%
0.600
0.106
Recruits/Spawner
0.3%
Current Harvest
12.9Fitness? [Y / N]
Current Hydro
Current HabitatHabitat ----->
10
0
0.77
0.00 0
0.49
1
0.600
0.631
0.010
y
0.060
0.00 0
1
0.010 0.010
0.010
0.060
100%
pHOS
0.631
pNOB
Conservation
y
Harvest
E.F. Salmon River stock
Sustaining
HRT Alternatives B
N/A
01
504,000
SegHarv
50% 50%
100%
0.060
pNOB
Harv
0.060
Seg
0.010
0.3%
Ave
350
0
7.1
0.010
pHOS
504,000
Seg
0.010
0.060
0.030
0.010
2.0%
Current Habitat
0.3%
Harv
180,600
2.0%
y
Current Habitat
80%
2.0%
Current Habitat
Subregion/SubbasinNatural Reproduction only
0.030
pNOB
Salmon Summer Steelhead
0
Harvest
Current Harvest
Harvest
Hatchery
Sustaining
Patterns
Patterns shown here are assigned to the population from
the AHA or ROL file. Red cells indicate patterns are not
assigned to this population/scenario in the rollup
application. The shown pattern needs to be added to the
application, or a different pattern should be assigned to
this population in the ROL/AHA file.
Current Habitat
Hydro -----> Current Hydro
y
1
E.F. Salmon River stock
Current Hydro
Current Harvest
Current Hydro
Current Harvest
-
0.20
0.40
0.60
0.80
1.00
- 0.20 0.40 0.60 0.80 1.00pNOB
pH
OS
.5
.9
.8
.7
.6
.4.3.2
PNI
.1
0
200
400
600
800
1,000
1,200
Ha
tch
ery
Ha
bita
t
Ma
rin
e
L. M
ain
ste
m
U.
Ma
inste
m
Te
rmin
al
0
200
400
600
800
1,000
1,200
Ha
tch
ery
Ha
bita
t
Ma
rin
e
L. M
ain
ste
m
U.
Ma
inste
m
Te
rmin
al
0
200
400
600
800
1,000
1,200
Ha
tch
ery
Ha
bita
t
Ma
rin
e
L.
Ma
inste
m
U.
Ma
inste
m
Te
rmin
al
0
200
400
600
800
1,000
1,200
Ha
tch
ery
Ha
bita
t
Ma
rin
e
L.
Ma
inste
m
U.
Ma
inste
m
Te
rmin
al
0
200
400
600
800
1,000
1,200
Ha
tch
ery
Ha
bita
t
Ma
rin
e
L. M
ain
ste
m
U.
Ma
inste
m
Te
rmin
al
Ha
tch
ery
Ha
bita
tM
ari
ne L.
U.
Te
rmin
al
Apply & Recalculate
Update

USFWS Columbia Basin Hatchery Review Team: Lower Snake Assessments and Recommendations Reports–March 2011
Appendix A – AHA Output 51
Table A34. AHA output for East Fork Salmon River steelhead (A/B-run). The HSRG solution and HRT Alternative B assume construction of a new weir at RM 1.0 in the East Fork Salmon River. HRT Alternative A assumes releases are moved upstream of the current weir at RM 18.
Population (Ctrl + Page Up/Down to Scroll)Species/Race Population Management Intent:
Harv&Hatchery Strategy:
Population Recovery Designation:
Ad. Capacity
% Kelt
Sm. Capacity
Ocean Surv Baseline SAR Vary? (Y/N) 0.092 0.020 0.053 0.020 0.053 0.020 0.053 0.020 0.053 0.020 0.053 0.020
Adult Passage
Adj. Capacity
Harv - Marine
Harv - L. Mainstem
Harv - U. Mainstem
Harv -Terminal
Total Exploitation Rate
Broodstock Composition
Type
Local Imported 29 48 72 72
86 86 160 160 160 160
Destination for HOR Returns
Productivity of Hatchery Fish
467
16Realized Spawning Composition
Relative Hatchery Optimum -> 80 80 80 80 80
Weir Factor ->
Relative Reproductive Success (HOS) -> 80% 80% 80% 80% 80%
Initial Fitness Factor (A) -> 0.81 0.81 0.81 0.81 0.81
Fitness Factor after 100 generations (B) -> 0.67 1.00 0.79 0.73 0.73
Average Fitness Factor (100 Generations) -> 0.70 0.99 0.80 0.74 0.75
Generations until average fitness is reached -> 38 30 9 29 28
Minimum Hatchery Program (% of BS Goal) -> Effective pHOS -> 0.44 Effective pHOS -> Effective pHOS -> 0.39 Effective pHOS -> 0.53 Effective pHOS -> 0.51
"Fitness Floor" -> 0.5 pNOB -> 0.25 pNOB -> pNOB -> 0.38 pNOB -> 0.38 pNOB -> 0.38
Calculated Hatchery SAR ->
Calculated Natural SAR ->
Max Min Max Min Max Min Max Min Max Min
NOR Escapement 969 88 407 35 789 42 1,138 69 1,056 56
HoS Total Escapement (includes strays) 1,965 340 1,058 184 2,135 370 1,613 279
1
Stepping Stone Hatchery Program
Current Hydro
Current Harvest
Current Hydro
Current HarvestCurrent Harvest
Conservation
Hatchery
Primary
Patterns
Patterns shown here are assigned to the population from
the AHA or ROL file. Red cells indicate patterns are not
assigned to this population/scenario in the rollup
application. The shown pattern needs to be added to the
application, or a different pattern should be assigned to
this population in the ROL/AHA file.
Current Habitat
Hydro -----> Current Hydro
y
Current Habitat
Subregion/SubbasinNatural repreduction only
75%
0.030
pNOB
Salmon Summer Steelhead
75
Conservation + Harvest
295
Cons
100,800
2.0%
y
Current Habitat
50%
2.0%
0.030
0.010
2.0%
Current Habitat
0.3%
0.010
pHOS
151,200
Int
0.010
0.010
0.3%
Ave
528
250
7.1
75%
39%
0.140
pNOB
Cons
0.59
0.140
Int
269
151,200
IntCons
50% 50%
Conservation
y
Conservation + Harvest
Stepping Stone Hatchery Program
Primary
HRT Alternatives B
Primary
7552,408
51%
pHOS
0.182
pNOB
30%
0.010 0.010
0.010
0.140
1.50 1,048
1
0.030
0.182
0.010
y
0.140
52,40875
1,048
0.77
1.50 1,048
0.49
Recruits/Spawner
0.3%
Current Harvest
4.0Fitness? [Y / N]
Current Hydro
Current HabitatHabitat ----->
0.030
0.6053%
75%
0.030
0.182
30%
202
Ave Ave
272
None
44%
Int None
25%
pNOB-Goal
0.53
pHOSpNOB
30%
0.66
pHOS-Goal
Int/Seg/Step/None
Smolt Release
50%
% to Nat. Spawn. 20%
pHOS-Realized
Cons
Strays
7.1
75%
y
100%
346 699
HSRG Solution
1.50
466
50%
0.182
0.030
30%
0.1820.182
0.770.77
0.010 0.010
0.010
1.50
0.010
0.49
1,048
y
Conservation + Harvest
0.49
Primary
HRT Alternatives A
1,048
1
1.50
0.77
52,408
0.030
1.50
0.140
1,0481,048
0.010
0.140
0.010
0.140
PNI
Hydro
52,408
1.00 0.49
524
y
1.00
% to Hatchery
Purpose
Export Goal/Realized
Cons/Harv/Both
Broodstock by Source
Brood Exported (from HOR Surplus)
Productivity (Adult)
Min NOR EscapeHabitatSmolt Productivity
22-Salmon_East Fork Salmon Summer
Steelhead
y
52,408
Historic
26,200
1.50 1,048
38
1
0.010
0.49
1.50
0.010
HORs 0.010
1
7575
0.140
0.182
0.030
0.182
0.140Harvest
NORs
NORs
0.75Adjusted Productivity
NORs
Juv Passage Surv.
NORs
NORs
0.010
0.010
0.030
0.140
643
559
pHOSpNOB
0.182
60,900
0.2%
2.0%
80%
Current Hydro
Current Harvest
Ave
y
0.182
30%
pHOS
155
Ave
2.0%
Integrated Hatchery
1.50
No Hatchery
1,048 1,0481.50
262
Primary
1
1,048
y
0.77
Current
1.50
7.1 y
Stepping Stone Hatchery Program
All H Analyzer (AHA)
Harvest --->
Hatchery
HORs
HORs
0.010
HORs
0.030
HORs
-
0.20
0.40
0.60
0.80
1.00
- 0.20 0.40 0.60 0.80 1.00pNOB
pH
OS
.5
.9
.8
.7
.6
.4.3.2
PNI
.1
0
200
400
600
800
1,000
1,200
Ha
tch
ery
Ha
bita
t
Ma
rin
e
L. M
ain
ste
m
U.
Ma
inste
m
Te
rmin
al
0
200
400
600
800
1,000
1,200
Ha
tch
ery
Ha
bita
t
Ma
rin
e
L. M
ain
ste
m
U.
Ma
inste
m
Te
rmin
al
0
200
400
600
800
1,000
1,200
Ha
tch
ery
Ha
bita
t
Ma
rin
e
L.
Ma
inste
m
U.
Ma
inste
m
Te
rmin
al
0
200
400
600
800
1,000
1,200
Ha
tch
ery
Ha
bita
t
Ma
rin
e
L.
Ma
inste
m
U.
Ma
inste
m
Te
rmin
al
0
200
400
600
800
1,000
1,200
Ha
tch
ery
Ha
bita
t
Ma
rin
e
L. M
ain
ste
m
U.
Ma
inste
m
Te
rmin
al
Ha
tch
ery
Ha
bita
tM
ari
ne L.
U.
Te
rmin
al
Apply & Recalculate
Update

USFWS Columbia Basin Hatchery Review Team: Lower Snake Assessments and Recommendations Reports–March 2011
52 Appendix A – AHA Output
Table A35. AHA output for (a) Dworshak NFH B-run steelhead outplanted into East Fork Salmon River (Current) and (b) a localized B-run
hatchery steelhead population (derived from Dworshak NFH fish) after construction of a new weir in the lower East Fork (HSRG Solution).
Population (Ctrl + Page Up/Down to Scroll)Species/Race Population Management Intent:
Harv&Hatchery Strategy:
Population Recovery Designation:
Ad. Capacity
% Kelt
Sm. Capacity
Ocean Surv Baseline SAR Vary? (Y/N) 0.092 0.018 0.048 0.018 0.048 0.018 0.048 0.018 0.048 0.018 0.048 0.018
Adult Passage
Adj. Capacity
Harv - Marine
Harv - L. Mainstem
Harv - U. Mainstem
Harv -Terminal
Total Exploitation Rate
Broodstock Composition
Type
Local Imported 170 162
134 134
Destination for HOR Returns
Productivity of Hatchery Fish
792
17Realized Spawning Composition
Relative Hatchery Optimum -> 80 80 80 80 80
Weir Factor ->
Relative Reproductive Success (HOS) -> 25% 25% 25% 25% 25%
Initial Fitness Factor (A) -> 0.81 0.81 0.81 0.81 0.81
Fitness Factor after 100 generations (B) -> 0.50 1.00 0.50 1.00 1.00
Average Fitness Factor (100 Generations) -> 0.50 0.99 0.50 0.99 0.99
Generations until average fitness is reached -> 12 30 12 30 30
Minimum Hatchery Program (% of BS Goal) -> Effective pHOS -> 1.00 Effective pHOS -> Effective pHOS -> 1.00 Effective pHOS -> Effective pHOS ->
"Fitness Floor" -> 0.5 pNOB -> pNOB -> pNOB -> pNOB -> pNOB ->
Calculated Hatchery SAR ->
Calculated Natural SAR ->
Max Min Max Min Max Min Max Min Max Min
NOR Escapement 0 0 0 0 0 0 0 0 0 0
HoS Total Escapement (includes strays) 488 84 132 22
Localized B-run stock with new weir
All H Analyzer (AHA)
Harvest --->
Hatchery
HORs
HORs
0.010
HORs
0.030
HORs
7.1 y
N/A
1
0
y
0.77
Current
0.00
0
Ave
1.8%
Outplants from Dworshak NFH
0.00
No Hatchery
0 00.00
0
0.663
pHOS
1.8%
100%
Current Hydro
Current Harvest
Ave
y
0.010
0.600
0.140
159
pHOSpNOB
0.182
325,965
0.1%
Juv Passage Surv.
NORs
NORs
0.010
NORs
0.00Adjusted Productivity
NORs
0.140
0.182
0.030
0.663
0.140
1
0.010
0.49
0.00
0.010
HORs 0.010
1
00
22B-Salmon_East Fork Salmon Summer
Steelhead (B-Run Dworshak-Hatchery)
y
1
Historic
0
0.00 0
0
Productivity (Adult)
Min NOR EscapeHabitatSmolt Productivity
% to Hatchery
Purpose
Export Goal/Realized
Cons/Harv/Both
Broodstock by Source
Brood Exported (from HOR Surplus)
PNI
Hydro
1
1.00 0.49
0
y
1.00
Harvest
NORs
0.600
0.00
0.140
00
0.010
0.140
0.010
0
y
Harvest
0.49
N/A
HRT Alternatives A
0
1
0.00
0.770.770.77
0.010 0.010
0.010
0.00
0.010
0.49
HSRG Solution
0.00
0.663
0.600
0.1820.182
43
7.1
90%
y
100%
Int/Seg/Step/None
Smolt Release
% to Nat. Spawn.
pHOS-Realized
Harv
Strays
10%
pNOB-Goal
pHOSpNOB
pHOS-Goal
Seg
100%
Seg Harv
0
Ave Ave
0
0.0300.600
0.182
Recruits/Spawner
0.4%
Current Harvest
2.5Fitness? [Y / N]
Current Hydro
Current HabitatHabitat ----->
10
0
0.77
0.00 0
0.49
1
0.600
0.663
0.010
y
0.140
0.00 0
1
0.010 0.010
0.010
0.140
pHOS
0.663
pNOB
Conservation
y
Harvest
No B-run hatchery program in upper Snake River
N/A
HRT Alternatives B
N/A
01
SegHarv
100%
100%
0.140
pNOB
Harv
0.140
Seg
0.010
0.4%
Ave
0
7.1
0.010
pHOS
Seg
0.010
0.140
0.030
0.010
1.8%
Current Habitat
0.4%
Harv
325,620
1.8%
y
Current Habitat
100%
1.8%
Current Habitat
Subregion/SubbasinNatural Reproduction only
0.030
pNOB
Salmon Summer Steelhead
0
Harvest
Current Harvest
Harvest
Hatchery
N/A
Patterns
Patterns shown here are assigned to the population from
the AHA or ROL file. Red cells indicate patterns are not
assigned to this population/scenario in the rollup
application. The shown pattern needs to be added to the
application, or a different pattern should be assigned to
this population in the ROL/AHA file.
Current Habitat
Hydro -----> Current Hydro
y
1
Localized B-run stock at Pahsimeroi FH
Current Hydro
Current Harvest
Current Hydro
Current Harvest
-
0.20
0.40
0.60
0.80
1.00
- 0.20 0.40 0.60 0.80 1.00pNOB
pH
OS
.5
.9
.8
.7
.6
.4.3.2
PNI
.1
0
100
200
300
400
500
600
700
Ha
tch
ery
Ha
bita
t
Ma
rin
e
L. M
ain
ste
m
U.
Ma
inste
m
Te
rmin
al
0
100
200
300
400
500
600
700
Ha
tch
ery
Ha
bita
t
Ma
rin
e
L. M
ain
ste
m
U.
Ma
inste
m
Te
rmin
al
0
100
200
300
400
500
600
700
Ha
tch
ery
Ha
bita
t
Ma
rin
e
L.
Ma
inste
m
U.
Ma
inste
m
Te
rmin
al
0
100
200
300
400
500
600
700
Ha
tch
ery
Ha
bita
t
Ma
rin
e
L.
Ma
inste
m
U.
Ma
inste
m
Te
rmin
al
0
100
200
300
400
500
600
700
Ha
tch
ery
Ha
bita
t
Ma
rin
e
L. M
ain
ste
m
U.
Ma
inste
m
Te
rmin
al
Ha
tch
ery
Ha
bita
tM
ari
ne L.
U.
Te
rmin
al
Apply & Recalculate
Update

USFWS Columbia Basin Hatchery Review Team: Lower Snake Assessments and Recommendations Reports–March 2011
Appendix A – AHA Output 53
Table A36. AHA output for localized B-run hatchery steelhead released into Squaw Creek. The HSRG Solution imports localized B-run steelhead
annually from a new B-run hatchery population propagated from adults that return to the East Fork Salmon River.
Population (Ctrl + Page Up/Down to Scroll)Species/Race Population Management Intent:
Harv&Hatchery Strategy: Local Local
Population Recovery Designation:
Ad. Capacity
% Kelt
Sm. Capacity
Ocean Surv Baseline SAR Vary? (Y/N) 0.092 0.018 0.048 0.018 0.048 0.018 0.048 0.018 0.048 0.018 0.048 0.018
Adult Passage
Adj. Capacity
Harv - Marine
Harv - L. Mainstem
Harv - U. Mainstem
Harv -Terminal
Total Exploitation Rate
Broodstock Composition
Type
Local Imported 30 134 30
Destination for HOR Returns
Productivity of Hatchery Fish
793
22Realized Spawning Composition
Relative Hatchery Optimum -> 80 80 80 80 80
Weir Factor ->
Relative Reproductive Success (HOS) -> 25% 25% 25% 25% 25%
Initial Fitness Factor (A) -> 0.81 0.81 0.81 0.81 0.81
Fitness Factor after 100 generations (B) -> 0.19 1.00 0.19 0.19 1.00
Average Fitness Factor (100 Generations) -> 0.24 0.99 0.24 0.24 0.99
Generations until average fitness is reached -> 43 30 43 43 30
Minimum Hatchery Program (% of BS Goal) -> Effective pHOS -> 1.00 Effective pHOS -> Effective pHOS -> 1.00 Effective pHOS -> 1.00 Effective pHOS ->
"Fitness Floor" -> pNOB -> pNOB -> pNOB -> pNOB -> pNOB ->
Calculated Hatchery SAR ->
Calculated Natural SAR ->
Max Min Max Min Max Min Max Min Max Min
NOR Escapement 0 0 0 0 0 0 0 0 0 0
HoS Total Escapement (includes strays) 183 29 1,092 189 183 29
1
Broodstock at Pahsimeroi FH
Current Hydro
Current Harvest
Current Hydro
Current HarvestCurrent Harvest
Harvest
Hatchery
Not listed; excluded from DPS
Patterns
Patterns shown here are assigned to the population from
the AHA or ROL file. Red cells indicate patterns are not
assigned to this population/scenario in the rollup
application. The shown pattern needs to be added to the
application, or a different pattern should be assigned to
this population in the ROL/AHA file.
Current Habitat
Hydro -----> Current Hydro
y
Current Habitat
Subregion/SubbasinNatural Reproduction only
0.030
pNOB
Salmon Summer Steelhead
1
Harvest
Harv
269,340
1.8%
y
Current Habitat
75%
1.8% 1.8%
Current Habitat
0.4%
7.1
0.010
pHOS
59,153
Seg
0.010
0.140
0.030
0.010
0.4%
Ave
0
100%
0.140
pNOB
Harv
0.140
Seg NoneHarv
25% 75%
Conservation
y
Harvest
No B-run program in upper Salmon River
N/A
HRT Alternatives B
N/A
11
pHOS
0.663
pNOB
0.010 0.010
0.010
0.140
0.01 0
1
0.600
0.663
0.010
y
0.140
11
0
0.77
0.01 0
0.49
1
Recruits/Spawner
0.4%
Current Harvest
7.1Fitness? [Y / N]
Current Hydro
Current HabitatHabitat ----->
0.030
100%
0.600
0.182
0
Ave Ave
0
None
100%
Seg Cons
100%
pNOB-Goal
pHOSpNOB
pHOS-Goal
Int/Seg/Step/None
Smolt Release
% to Nat. Spawn. 25%
pHOS-Realized
Harv
Strays
7.1y
100%
357 59
HSRG Solution
0.01
25%
0.663
0.600
0.1820.182
0.770.77
0.010 0.010
0.010
0.01
0.010
0.49
0
y
Harvest
0.49
Not listed; excluded from DPS
HRT Alternatives A
0
1
0.01
0.77
0.600
0.01
0.140
00
0.010
0.140
0.010 0.010
PNI
Hydro
1
1.00 0.49
0
y
1.00
Harvest
NORs
% to Hatchery
Purpose
Export Goal/Realized
Cons/Harv/Both
Broodstock by Source
Brood Exported (from HOR Surplus)
Productivity (Adult)
Min NOR EscapeHabitatSmolt Productivity
23C-Salmon_Upper Salmon Summer
Steelhead (Upper Salmon B-Run Program)
y
1
Historic
0
0.01 0
0
1
0.010
0.49
0.01
0.010
HORs 0.010
1
11
0.140
0.182
0.030
0.663
0.140
Juv Passage Surv.
NORs
NORs
0.010
NORs
0.00Adjusted Productivity
NORs
0.010
0.600
0.140
59
pHOSpNOB
0.182
59,153
0.4%
1.8%
75%
Current Hydro
Current Harvest
Ave
y
0.663
pHOS
0
Ave
1.8%
Local Segregated Broodstock
0.01
No Hatchery
0 00.01
0
Not listed; excluded from DPS
1
0
y
0.77
Current
0.01
7.1 y
broodstock at E.F. Salmon R.
All H Analyzer (AHA)
Harvest --->
Hatchery
HORs
HORs
0.010
HORs
0.030
HORs
-
0.20
0.40
0.60
0.80
1.00
- 0.20 0.40 0.60 0.80 1.00pNOB
pH
OS
.5
.9
.8
.7
.6
.4.3.2
PNI
.1
0
100
200
300
400
500
600
Ha
tch
ery
Ha
bita
t
Ma
rin
e
L. M
ain
ste
m
U.
Ma
inste
m
Te
rmin
al
0
100
200
300
400
500
600
Ha
tch
ery
Ha
bita
t
Ma
rin
e
L. M
ain
ste
m
U.
Ma
inste
m
Te
rmin
al
0
100
200
300
400
500
600
Ha
tch
ery
Ha
bita
t
Ma
rin
e
L.
Ma
inste
m
U.
Ma
inste
m
Te
rmin
al
0
100
200
300
400
500
600
Ha
tch
ery
Ha
bita
t
Ma
rin
e
L.
Ma
inste
m
U.
Ma
inste
m
Te
rmin
al
0
100
200
300
400
500
600
Ha
tch
ery
Ha
bita
t
Ma
rin
e
L. M
ain
ste
m
U.
Ma
inste
m
Te
rmin
al
Ha
tch
ery
Ha
bita
tM
ari
ne L.
U.
Te
rmin
al
Apply & Recalculate
Update

USFWS Columbia Basin Hatchery Review Team: Lower Snake Assessments and Recommendations Reports–March 2011
54 Appendix A – AHA Output
Table A37. AHA output for Dworshak NFH B-run steelhead outplanted into Squaw Creek. The HSRG Solution and HRT Alternative A would
terminate these outplants (as would HRT Alternative B) and develop a localized hatchery population at the upper Salmon River basin.
Population (Ctrl + Page Up/Down to Scroll)Species/Race Population Management Intent:
Harv&Hatchery Strategy:
Population Recovery Designation:
Ad. Capacity
% Kelt
Sm. Capacity
Ocean Surv Baseline SAR Vary? (Y/N) 0.092 0.018 0.048 0.018 0.048 0.018 0.048 0.018 0.048 0.018 0.048 0.018
Adult Passage
Adj. Capacity
Harv - Marine
Harv - L. Mainstem
Harv - U. Mainstem
Harv -Terminal
Total Exploitation Rate
Broodstock Composition
Type
Local Imported 130
Destination for HOR Returns
Productivity of Hatchery Fish
466
21Realized Spawning Composition
Relative Hatchery Optimum -> 80 80 80 80 80
Weir Factor ->
Relative Reproductive Success (HOS) -> 25% 25% 25% 25% 25%
Initial Fitness Factor (A) -> 0.81 0.81 0.81 0.81 0.81
Fitness Factor after 100 generations (B) -> 0.19 1.00 1.00 1.00 1.00
Average Fitness Factor (100 Generations) -> 0.24 0.99 0.99 0.99 0.99
Generations until average fitness is reached -> 43 30 30 30 30
Minimum Hatchery Program (% of BS Goal) -> Effective pHOS -> 1.00 Effective pHOS -> Effective pHOS -> Effective pHOS -> Effective pHOS ->
"Fitness Floor" -> pNOB -> pNOB -> pNOB -> pNOB -> pNOB ->
Calculated Hatchery SAR ->
Calculated Natural SAR ->
Max Min Max Min Max Min Max Min Max Min
NOR Escapement 0 0 0 0 0 0 0 0 0 0
HoS Total Escapement (includes strays) 280 48
1
Local Broodstock at Pahsimeroi FH
Current Hydro
Current Harvest
Current Hydro
Current HarvestCurrent Harvest
Harvest
Hatchery
N/A
Patterns
Patterns shown here are assigned to the population from
the AHA or ROL file. Red cells indicate patterns are not
assigned to this population/scenario in the rollup
application. The shown pattern needs to be added to the
application, or a different pattern should be assigned to
this population in the ROL/AHA file.
Current Habitat
Hydro -----> Current Hydro
y
Current Habitat
Subregion/SubbasinNatural Reproduction only
0.030
pNOB
Salmon Summer Steelhead
1
Harvest
Harv
1.8%
y
Current Habitat
100%
1.8% 1.8%
Current Habitat
0.1%
2.5
0.010
pHOS
None
0.010
0.140
0.030
0.010
0.1%
Ave
0
0.140
pNOB
Harv
0.140
None NoneHarv
100%
Conservation
y
Harvest
No B-run steelhead program in upper Salmon River
N/A
HRT Alternatives B
N/A
11
pHOS
0.663
pNOB
0.010 0.010
0.010
0.140
0.01 0
1
0.600
0.663
0.010
y
0.140
11
0
0.77
0.01 0
0.49
1
Recruits/Spawner
0.1%
Current Harvest
2.5Fitness? [Y / N]
Current Hydro
Current HabitatHabitat ----->
0.0300.600
0.182
0
Ave Ave
0
None
100%
Seg Cons
100%
pNOB-Goal
pHOSpNOB
pHOS-Goal
Int/Seg/Step/None
Smolt Release
% to Nat. Spawn. 25%
pHOS-Realized
Harv
Strays
2.5y
100%
HSRG Solution
0.01
0.663
0.600
0.1820.182
0.770.77
0.010 0.010
0.010
0.01
0.010
0.49
0
y
Harvest
0.49
N/A
HRT Alternatives A
0
1
0.01
0.77
0.600
0.01
0.140
00
0.010
0.140
0.010 0.010
PNI
Hydro
1
1.00 0.49
0
y
1.00
Harvest
NORs
% to Hatchery
Purpose
Export Goal/Realized
Cons/Harv/Both
Broodstock by Source
Brood Exported (from HOR Surplus)
Productivity (Adult)
Min NOR EscapeHabitatSmolt Productivity
23B-Salmon_Upper Salmon Summer
Steelhead (B-Run Dworshak-Hatchery)
y
1
Historic
0
0.01 0
0
1
0.010
0.49
0.01
0.010
HORs 0.010
1
11
0.140
0.182
0.030
0.663
0.140
Juv Passage Surv.
NORs
NORs
0.010
NORs
0.00Adjusted Productivity
NORs
0.010
0.600
0.140
91
pHOSpNOB
0.182
249,267
0.1%
1.8%
75%
Current Hydro
Current Harvest
Ave
y
0.663
pHOS
0
Ave
1.8%
Outplanting from Dworshak NFH
0.01
No Hatchery
0 00.01
0
N/A
1
0
y
0.77
Current
0.01
2.5 y
Local broodstock at E.F. Salmon R.
All H Analyzer (AHA)
Harvest --->
Hatchery
HORs
HORs
0.010
HORs
0.030
HORs
-
0.20
0.40
0.60
0.80
1.00
- 0.20 0.40 0.60 0.80 1.00pNOB
pH
OS
.5
.9
.8
.7
.6
.4.3.2
PNI
.1
0
20
40
60
80
100
120
140
160
180
200
Ha
tch
ery
Ha
bita
t
Ma
rin
e
L. M
ain
ste
m
U.
Ma
inste
m
Te
rmin
al
0
20
40
60
80
100
120
140
160
180
200
Ha
tch
ery
Ha
bita
t
Ma
rin
e
L. M
ain
ste
m
U.
Ma
inste
m
Te
rmin
al
0
20
40
60
80
100
120
140
160
180
200
Ha
tch
ery
Ha
bita
t
Ma
rin
e
L.
Ma
inste
m
U.
Ma
inste
m
Te
rmin
al
0
20
40
60
80
100
120
140
160
180
200
Ha
tch
ery
Ha
bita
t
Ma
rin
e
L.
Ma
inste
m
U.
Ma
inste
m
Te
rmin
al
0
20
40
60
80
100
120
140
160
180
200
Ha
tch
ery
Ha
bita
t
Ma
rin
e
L. M
ain
ste
m
U.
Ma
inste
m
Te
rmin
al
Ha
tch
ery
Ha
bita
tM
ari
ne L.
U.
Te
rmin
al
Apply & Recalculate
Update

USFWS Columbia Basin Hatchery Review Team: Lower Snake Assessments and Recommendations Reports–March 2011
Appendix A – AHA Output 55
Table A38. AHA output for upper Salmon River steelhead (A-run ) including Yankee Fork, Valley Creek, Slate Creek, and Squaw Creek.
Population (Ctrl + Page Up/Down to Scroll)Species/Race Population Management Intent:
Harv&Hatchery Strategy:
Population Recovery Designation:
Ad. Capacity
% Kelt
Sm. Capacity
Ocean Surv Baseline SAR Vary? (Y/N) 0.092 0.020 0.053 0.020 0.053 0.020 0.053 0.020 0.053 0.020 0.053 0.020
Adult Passage
Adj. Capacity
Harv - Marine
Harv - L. Mainstem
Harv - U. Mainstem
Harv -Terminal
Total Exploitation Rate
Broodstock Composition
Type
Local Imported
Destination for HOR Returns
Productivity of Hatchery Fish
540
19Realized Spawning Composition
Relative Hatchery Optimum -> 80 80 80 80 80
Weir Factor -> 25% 25%
Relative Reproductive Success (HOS) -> 80% 80% 80% 80% 80%
Initial Fitness Factor (A) -> 0.81 0.81 0.81 0.81 0.81
Fitness Factor after 100 generations (B) -> 0.50 1.00 0.50 0.50 0.50
Average Fitness Factor (100 Generations) -> 0.50 0.99 0.50 0.50 0.50
Generations until average fitness is reached -> 17 30 17 17 18
Minimum Hatchery Program (% of BS Goal) -> Effective pHOS -> 0.45 Effective pHOS -> Effective pHOS -> 0.44 Effective pHOS -> 0.45 Effective pHOS -> 0.41
"Fitness Floor" -> 0.5 pNOB -> pNOB -> pNOB -> pNOB -> pNOB ->
Calculated Hatchery SAR ->
Calculated Natural SAR ->
Max Min Max Min Max Min Max Min Max Min
NOR Escapement 802 77 821 84 744 71 794 76 592 55
HoS Total Escapement (includes strays) 2,221 386 1,980 344 2,136 371 1,350 234
1
Segregated Hatchery
Current Hydro
Current Harvest
Current Hydro
Current HarvestCurrent Harvest
Harvest and Conservation
Hatchery
Stabilizing
Patterns
Patterns shown here are assigned to the population from
the AHA or ROL file. Red cells indicate patterns are not
assigned to this population/scenario in the rollup
application. The shown pattern needs to be added to the
application, or a different pattern should be assigned to
this population in the ROL/AHA file.
Current Habitat
Hydro -----> Current Hydro
y
Current Habitat
Subregion/SubbasinNatural Reproduction only
0.030
pNOB
Salmon Summer Steelhead
75
Harvest and Conservation
442
Both
2.0%
y
Current Habitat
100%
2.0% 2.0%
Current Habitat
0.010
pHOS
Seg
0.010
0.060
0.030
0.010
Ave
442
170
44%
0.060
pNOB
Both
0.060
Seg
648
SegBoth
100%
Conservation
y
Harvest and Conservation
Segregated Hatchery
Stabilizing
HRT Alternatives B
Stabilizing
7564,168
41%
pHOS
0.106
pNOB
0.010 0.010
0.010
0.060
1.50 1,283
1
0.030
0.106
0.010
y
0.060
64,16875
1,283
0.77
1.50 1,283
0.49
64,168
Recruits/Spawner
Current Harvest
Fitness? [Y / N]
Current Hydro
Current HabitatHabitat ----->
0.030
45%
0.030
0.106
208
Ave Ave
221
None
45%
Seg Cons
100%
pNOB-Goal
pHOSpNOB
pHOS-Goal
Int/Seg/Step/None
Smolt Release
% to Nat. Spawn.
pHOS-Realized
Both
Strays
y
100%
648 699
HSRG Solution
1.50
699
0.106
0.030
0.1060.106
0.770.77
0.010 0.010
0.010
1.50
0.010
0.49
1,283
y
Harvest and Conservation
0.49
Stabilizing
HRT Alternatives A
1,283
1
1.50
0.77
0.030
1.50
0.060
1,2831,283
0.010
0.060
0.010 0.010
PNI
Hydro
64,168
1.00 0.49
641
y
1.00
Harvest
NORs
% to Hatchery
Purpose
Export Goal/Realized
Cons/Harv/Both
Broodstock by Source
Brood Exported (from HOR Surplus)
Productivity (Adult)
Min NOR EscapeHabitatSmolt Productivity
23-Salmon_Upper Salmon Summer
Steelhead (A-Run)
y
64,168
Historic
32,075
1.50 1,283
38
1
0.010
0.49
1.50
0.010
HORs 0.010
1
7575
0.060
0.106
0.030
0.106
0.060
Juv Passage Surv.
NORs
NORs
0.010
NORs
0.75Adjusted Productivity
NORs
0.010
0.030
0.060
727
727
pHOSpNOB
0.106
2.0%
100%
Current Hydro
Current Harvest
Ave
y
0.106
pHOS
297
Ave
2.0%
Segregated Hatchery
1.50
No Hatchery
1,283 1,2831.50
223
Stabilizing
1
1,283
y
0.77
Current
1.50
y
Segregated Hatchery
All H Analyzer (AHA)
Harvest --->
Hatchery
HORs
HORs
0.010
HORs
0.030
HORs
-
0.20
0.40
0.60
0.80
1.00
- 0.20 0.40 0.60 0.80 1.00pNOB
pH
OS
.5
.9
.8
.7
.6
.4.3.2
PNI
.1
0
100
200
300
400
500
600
700
800
900
1,000
Ha
tch
ery
Ha
bita
t
Ma
rin
e
L. M
ain
ste
m
U.
Ma
inste
m
Te
rmin
al
0
100
200
300
400
500
600
700
800
900
1,000
Ha
tch
ery
Ha
bita
t
Ma
rin
e
L. M
ain
ste
m
U.
Ma
inste
m
Te
rmin
al
0
100
200
300
400
500
600
700
800
900
1,000
Ha
tch
ery
Ha
bita
t
Ma
rin
e
L.
Ma
inste
m
U.
Ma
inste
m
Te
rmin
al
0
100
200
300
400
500
600
700
800
900
1,000
Ha
tch
ery
Ha
bita
t
Ma
rin
e
L.
Ma
inste
m
U.
Ma
inste
m
Te
rmin
al
0
100
200
300
400
500
600
700
800
900
1,000
Ha
tch
ery
Ha
bita
t
Ma
rin
e
L. M
ain
ste
m
U.
Ma
inste
m
Te
rmin
al
Ha
tch
ery
Ha
bita
tM
ari
ne L.
U.
Te
rmin
al
Apply & Recalculate
Update

USFWS Columbia Basin Hatchery Review Team: Lower Snake Assessments and Recommendations Reports–March 2011
56 Appendix A – AHA Output
Table A39. AHA output for Sawtooth Hatchery A-run steelhead released into the upper Salmon River at the Sawtooth FH weir (currently
810,000 smolts), Yankee Fork (330,000 smolts), Slate Creek (90,000 smolts), and Valley Creek (50,000 smolts).
Population (Ctrl + Page Up/Down to Scroll)Species/Race Population Management Intent:
Harv&Hatchery Strategy:
Population Recovery Designation:
Ad. Capacity
% Kelt
Sm. Capacity
Ocean Surv Baseline SAR Vary? (Y/N) 0.092 0.020 0.053 0.020 0.053 0.020 0.053 0.020 0.053 0.020 0.053 0.020
Adult Passage
Adj. Capacity
Harv - Marine
Harv - L. Mainstem
Harv - U. Mainstem
Harv -Terminal
Total Exploitation Rate
Broodstock Composition
Type
Local Imported 695 695 760 760
Destination for HOR Returns
Productivity of Hatchery Fish
465
20Realized Spawning Composition
Relative Hatchery Optimum -> 80 80 80 80 80
Weir Factor ->
Relative Reproductive Success (HOS) -> 25% 25% 25% 25% 25%
Initial Fitness Factor (A) -> 0.81 0.81 0.81 0.81 0.81
Fitness Factor after 100 generations (B) -> 0.50 1.00 0.50 0.50 0.50
Average Fitness Factor (100 Generations) -> 0.50 0.99 0.50 0.50 0.50
Generations until average fitness is reached -> 12 30 12 12 12
Minimum Hatchery Program (% of BS Goal) -> Effective pHOS -> 1.00 Effective pHOS -> Effective pHOS -> 1.00 Effective pHOS -> 1.00 Effective pHOS -> 1.00
"Fitness Floor" -> 0.5 pNOB -> pNOB -> pNOB -> pNOB -> pNOB ->
Calculated Hatchery SAR ->
Calculated Natural SAR ->
Max Min Max Min Max Min Max Min Max Min
NOR Escapement 0 0 0 0 0 0 0 0 0 0
HoS Total Escapement (includes strays) 3,375 586 3,375 586 3,691 641 2,460 427
1
Sawtooth Hatchery stock only
Current Hydro
Current Harvest
Current Hydro
Current HarvestCurrent Harvest
Harvest and Conservation
Hatchery
Not listed; excluded from DPS
Patterns
Patterns shown here are assigned to the population from
the AHA or ROL file. Red cells indicate patterns are not
assigned to this population/scenario in the rollup
application. The shown pattern needs to be added to the
application, or a different pattern should be assigned to
this population in the ROL/AHA file.
Current Habitat
Hydro -----> Current Hydro
y
Current Habitat
Subregion/SubbasinNatural Reproduction only
0.030
pNOB
Salmon Summer Steelhead
1
Harvest and Conservation
Harv
1,280,191
2.0%
y
Current Habitat
30%
2.0% 2.0%
Current Habitat
0.7%
12.9
0.010
pHOS
1,399,920
Seg
0.010
0.060
0.030
0.010
0.7%
Ave
806
0
100%
0.060
pNOB
Harv
0.060
Seg
1,399,920
SegHarv
80% 20%
Conservation
y
Harvest and Conservation
Sawtooth Hatchery stock only
Not listed; excluded from DPS
HRT Alternatives B
N/A
11
100%
pHOS
0.631
pNOB
0.010 0.010
0.010
0.060
0.01 0
1
0.600
0.631
0.010
y
0.060
11
0
0.77
0.01 0
0.49
1
Recruits/Spawner
0.7%
Current Harvest
12.9Fitness? [Y / N]
Current Hydro
Current HabitatHabitat ----->
0.030
100%
0.600
0.106
0
Ave Ave
0
None
100%
Seg Cons
30%
pNOB-Goal
pHOSpNOB
pHOS-Goal
Int/Seg/Step/None
Smolt Release
% to Nat. Spawn. 70%
pHOS-Realized
Harv
Strays
12.9
70%
y
100%
1,105 1,209
HSRG Solution
0.01
70%
0.631
0.600
0.1060.106
0.770.77
0.010 0.010
0.010
0.01
0.010
0.49
0
y
Harvest and Conservation
0.49
Not listed; excluded from DPS
HRT Alternatives A
0
1
0.01
0.77
0.600
0.01
0.060
00
0.010
0.060
0.010 0.010
PNI
Hydro
1
1.00 0.49
0
y
1.00
Harvest
NORs
% to Hatchery
Purpose
Export Goal/Realized
Cons/Harv/Both
Broodstock by Source
Brood Exported (from HOR Surplus)
Productivity (Adult)
Min NOR EscapeHabitatSmolt Productivity
23A-Salmon_Upper Salmon Summer
Steelhead (A-Run Sawtooth-Pahsimeroi-
Hatchery)
y
1
Historic
0
0.01 0
0
1
0.010
0.49
0.01
0.010
HORs 0.010
1
11
0.060
0.106
0.030
0.631
0.060
Juv Passage Surv.
NORs
NORs
0.010
NORs
0.00Adjusted Productivity
NORs
0.010
0.600
0.060
1,105
pHOSpNOB
0.106
1,280,191
0.7%
2.0%
30%
Current Hydro
Current Harvest
Ave
y
0.631
pHOS
0
Ave
2.0%
Sawtooth/Pahsimeroi Hatchery stocks
0.01
No Hatchery
0 00.01
0
Not listed; excluded from DPS
1
0
y
0.77
Current
0.01
12.9 y
Sawtooth/Pahsimeroi Hatchery stocks
All H Analyzer (AHA)
Harvest --->
Hatchery
HORs
HORs
0.010
HORs
0.030
HORs
-
0.20
0.40
0.60
0.80
1.00
- 0.20 0.40 0.60 0.80 1.00pNOB
pH
OS
.5
.9
.8
.7
.6
.4.3.2
PNI
.1
0
1,000
2,000
3,000
4,000
5,000
6,000
7,000
Ha
tch
ery
Ha
bita
t
Ma
rin
e
L. M
ain
ste
m
U.
Ma
inste
m
Te
rmin
al
0
1,000
2,000
3,000
4,000
5,000
6,000
7,000
Ha
tch
ery
Ha
bita
t
Ma
rin
e
L. M
ain
ste
m
U.
Ma
inste
m
Te
rmin
al
0
1,000
2,000
3,000
4,000
5,000
6,000
7,000
Ha
tch
ery
Ha
bita
t
Ma
rin
e
L.
Ma
inste
m
U.
Ma
inste
m
Te
rmin
al
0
1,000
2,000
3,000
4,000
5,000
6,000
7,000
Ha
tch
ery
Ha
bita
t
Ma
rin
e
L.
Ma
inste
m
U.
Ma
inste
m
Te
rmin
al
0
1,000
2,000
3,000
4,000
5,000
6,000
7,000
Ha
tch
ery
Ha
bita
t
Ma
rin
e
L. M
ain
ste
m
U.
Ma
inste
m
Te
rmin
al
Ha
tch
ery
Ha
bita
tM
ari
ne L.
U.
Te
rmin
al
Apply & Recalculate
Update
USFWS Columbia Basin Hatchery Review Team Lower Snake Federal Hatcheries Assessments and Recommendations Reports–March 2011
Appendix A – AHA Output 57
Table A40-A45: AHA outputs for the South Fork Salmon River Major
Population Group (MPG) of spring/summer Chinook salmon

USFWS Columbia Basin Hatchery Review Team Lower Snake Federal Hatcheries Assessments and Recommendations Reports–March 2011
58 Appendix A – AHA Output
Parameters and assumptions for spring/summer Chinook in the South Fork Salmon River The South Fork Salmon River MPG for spring/summer Chinook includes the Little Salmon River and
Rapid River watersheds, the South Fork Salmon River and tributaries, and the intervening section of
the mainstem Salmon River. Hatchery programs currently operate on Rapid River (Rapid River
Hatchery Spring Chinook), the South Fork Salmon River, and Johnson Creek, a tributary to the East
Fork of the South Fork Salmon River.
Table 7A. Mean values of reproductive and survival parameters assumed in the AHA analyses
for hatchery-origin spring/summer Chinook released within the South Fork Salmon River MPG.
Parameter values were obtained from the HSRG as provided by IDFG.
Hatchery/
Release location
Population/Stock
Fecundity
(No. of
eggs)
Within-
hatchery
egg-to-smolt
survival
Salmon
River
smolt-to-
adult
survival (%)
Recruit/spawner
(R/S; adults)
Rapid River FH
Rapid River Hatchery Spring
Chinook
4,100
0.85
0.47%
6.0
McCall Hatchery/
South Fork Salmon River
South Fork Salmon River
Summer
Chinook
4,300
0.80
0.73%
6.0
McCall Hatchery/
Johnson Creek
Johnson Creek Summer
Chinook
4,300
0.85
0.45%
6.0
Current programs, HSRG solutions, and HRT alternatives
Of the three principal hatchery programs conducted within the South Fork Salmon River MPG, the
HRT reviewed only the South Fork Salmon River summer Chinook program that operates under the
LSRCP. AHA analyses for Rapid River Hatchery Spring Chinook and Johnson Creek Summer
Chinook represent those reported by the HSRG. The HRT specifically modeled HRT Alternatives 2, 4,
and 5 for the South Fork Salmon River Summer Chinook program.
Alternative 2 represents an integrated hatchery program where the current program would be
transitioned from the current segregated program (1.0M smolts, PNI = 0) to an integrated program that
would include natural-origin fish in the broodstock (pNOB = 50%) to achieve a value of PNI > 0.5.
The HRT assumed that the current location of the weir is capable of trapping only 50% of returning
hatchery-origin adults relative to the total available spawning habitat available in the South Fork
Salmon River (i.e., Poverty Flats downstream of the weir and Stolle Meadows upstream of the weir).
Based on the productivity and capacity parameters of the Beverton-Holt curve (r = R/Smax = 3.0 and C
= max. number of adult recruits = 2,140 adults), the HRT’s analysis indicates that the South Fork
Salmon River could support an integrated hatchery program with a maximum release of 490,000

USFWS Columbia Basin Hatchery Review Team Lower Snake Federal Hatcheries Assessments and Recommendations Reports–March 2011
Appendix A – AHA Output 59
hatchery-origin smolts for the entire S.F. population to maintain PNI > 0.5, a reduction of
approximately 50% from the current program. The program would include (a) the trapping and
spawning of approximately 500 adults for producing 490,000 smolts and (b) the spawning of
approximately 300 additional adults (n=294 “exported” adults assuming a 2:1 male:female sex ratio)
to yield 300,000 eyed eggs for the Dollar Creek egg-box program of the Shoshone-Bannock Tribes.
Alternative 4 represents a “stepping-stone” hatchery program composed of two broodstocks each year.
The first broodstock would be integrated with the natural population that spawns in Stolle Meadows
upstream of the weir. Smolt offspring of this first broodstock would be tagged but not marked (no
adipose fin clip) at the time of release. The second broodstock would use hatchery-origin adults from
the first broodstock to produce F2 hatchery-origin fish for harvest. The AHA analyses suggest that the
first integrated broodstock could yield 175,000 smolts with pNOB = 0.5 . The second broodstock
would yield 825,000 smolts that would be marked with an adipose fin clip. Adult returns from this
second broodstock would be sufficient to provide 300,000 eyed eggs (approximately 200 adults,
assuming a 1:1 sex ratio) for the Dollar Creek egg box program. The HRT assumed that the current
weir is capable of trapping 90% of all hatchery-origin adults intercepted at the weir relative to the
naturally spawning population upstream of the weir. Alternative 4 is the HRT’s “preferred alternative”.
Alternative 5 is similar to Alternative 4 except the first broodstock of the stepping stone program
would be integrated relative to the entire naturally spawning population in the South Fork (i.e., Stolle
Meadows and Poverty Flat). HRT Alternative 5 and the HSRG Solution are similar except (a) the
HSRG assumed a female fecundity of 4,700 eggs compared to the assumption of 4,300 eggs by the
HRT, (b) the HSRG assumed that the current weir could trap 95% of returning hatchery-origin adults,
whereas the HRT assumed only 50% of returning adults could be trapped relative to the entire S.F.
Salmon River (i.e., 50% of the adults spawn downstream of the current weir), and (c) the HSRG was
able to achieve desired values of PNI with pNOB = 30%, whereas the HRT analysis indicates a
required value of pNOB = 67% because of the large numbers of hatchery-origin fish that would be
expected to spawn downstream of the weir, thus inflating the expected value of pHOS. These latter
analyses yield a release of 250,000 unmarked (but tagged) smolts from the first “integrated”
broodstock and 750,000 marked smolts from the second “production” broodstock.

USFWS Columbia Basin Hatchery Review Team Lower Snake Federal Hatcheries Assessments and Recommendations Reports–March 2011
60 Appendix A – AHA Output
Table 8A. Summary of the number of hatchery-origin (HOR) spring/summer Chinook smolts released into the geographic area of the South
Fork Salmon River Major Population Group (MPG) under four strategies modeled in AHA Tables A40-A45: (1) Current programs based on the
LSRCP Cooperators 2008 Annual Operating Plan for the Salmon River, (2) HRT Alternative 5 which is similar to the HSRG Solution, (3) HRT
Alternative 1 (current programs with implementation of HRT recommendations), and (4) HRT Alternative 4, which is the HRT’s “preferred
alternative”. The names of hatchery stocks/populations are in italics (e.g., “Rapid River”) and are identified by the facility/location where adults
are trapped for broodstock.
Release location
(Hatchery)
Current
S.F. Salmon River
HRT Alternative 5
(HSRG Solution)
S.F. Salmon River,
HRT Alternative 2
S.F. Salmon River,
HRT Alternative 4
Rapid River
(Rapid River FH)
(AHA Tables A40, A41)
2.7M Rapid River Hatchery
smolts
No recommendation
(same as Current)
No recommendation
(same as Current)
No recommendation
(same as Current)
S.F. Salmon River
(McCall FH)
(AHA Tables A42, A43;
see also AHA Table A44)
1.0M SF Salmon River
smolts (pNOB = 0)
300K SF Salmon River eyed
eggs to Shoshone-Bannock
Tribes for egg box program
250K SF Salmon River
smolts (pNOB = 0.67)
750K SF Salmon River F2
smolts (pNOB = 0)
300K SF Salmon River F2
eyed eggs to Shoshone-
Bannock Tribes for egg box
program
490K S.F. Salmon River
smolts (pNOB = 0.5)
300K SF Salmon River eyed
eggs to Shoshone-Bannock
Tribes for egg box program
175K SF Salmon River smolts
(pNOB = 0.5)
825K SF Salmon River F2
smolts (pNOB = 0)
300K SF Salmon River F2
eyed eggs to Shoshone-
Bannock Tribes for egg box
program
Johnson Creek
(McCall FH)
(AHA Table A45)
100K Johnson Cr. smolts
No recommendation
(same as Current)
No recommendation
(same as Current)
No recommendation
(same as Current)

USFWS Columbia Basin Hatchery Review Team: Lower Snake Assessments and Recommendations Reports–March 2011
Appendix A – AHA Output 61
Table A40: AHA output for spring/summer Chinook in the Little Salmon River. Rapid River Hatchery Spring Chinook are modeled in Table
A41. HRT Alternatives refer to the South Fork Salmon River summer Chinook program.
Population (Ctrl + Page Up/Down to Scroll)Species/Race Population Management Intent:
Harv&Hatchery Strategy:
Population Recovery Designation:
Ad. Capacity
% Kelt
Sm. Capacity
Ocean Surv Baseline SAR Vary? (Y/N) 0.098 0.040 0.029 0.008 0.029 0.008 0.029 0.008 0.029 0.008 0.029 0.008
Adult Passage
Adj. Capacity
Harv - Marine
Harv - L. Mainstem
Harv - U. Mainstem
Harv -Terminal
Total Exploitation Rate
Broodstock Composition
Type
Local Imported
Destination for HOR Returns
Productivity of Hatchery Fish
522
1Realized Spawning Composition
Relative Hatchery Optimum -> 80 80 80 80 80
Weir Factor ->
Relative Reproductive Success (HOS) -> 80% 80% 80% 80% 80%
Initial Fitness Factor (A) -> 0.81 0.81 0.81 0.81 0.81
Fitness Factor after 100 generations (B) -> 0.50 1.00 0.50 0.50 0.50
Average Fitness Factor (100 Generations) -> 0.50 0.99 0.50 0.50 0.50
Generations until average fitness is reached -> 15 30 15 15 15
Minimum Hatchery Program (% of BS Goal) -> Effective pHOS -> 0.59 Effective pHOS -> Effective pHOS -> 0.59 Effective pHOS -> 0.59 Effective pHOS -> 0.59
"Fitness Floor" -> 0.5 pNOB -> pNOB -> pNOB -> pNOB -> pNOB ->
Calculated Hatchery SAR ->
Calculated Natural SAR ->
Max Min Max Min Max Min Max Min Max Min
NOR Escapement 994 100 261 14 986 99 983 99 974 98
HoS Total Escapement (includes strays) 1,479 257 1,457 253 1,448 252 1,424 247
All H Analyzer (AHA)
Harvest --->
Hatchery
268
No HatcheryCurrent
1.30 1,250 1,2501.30
Segregated Hatchery
1.30
Stabilizing
1
1,250
y
0.82
Current Hydro
Current Habitat
86
Ave
0.8%
0.581
pHOS
484
484
0.8%
100%
Current Hydro
Current Harvest
Ave
y
HORs
HORs
0.010
HORs
0.080
HORs
0.010
0.080
0.080
0.500
Hydro
Harvest
NORs
NORs
1.30Adjusted Productivity
NORs
Juv Passage Surv.
NORs
NORs
0.050
pHOS
0.050
0.152
0.080
0.581
pNOB
0.152
1
0.020
0.34
1.30
0.020
HORs 0.010
1
161161
10-Salmon_Little Salmon Spring-Summer
Chinook
y
154,603
Historic
31,250
1.30 1,250
33
Productivity (Adult)
Min NOR EscapeHabitatSmolt Productivity
% to Hatchery
Purpose
Export Goal/Realized
Cons/Harv/Both
Broodstock by Source
Brood Exported (from HOR Surplus)
154,603
1.00 0.34
1,250
y
1.00
154,603
Segregated Hatchery
0.500
1.30
0.050
1,2501,250
0.080
0.080
0.010
1,250
y
Harvest
0.34
Stabilizing
HRT Alternative 2
1,250
1
1.30
0.82
0.1520.152
0.820.82
0.020 0.080
HRT Alt. 5; HSRG Sol.
1.30
474
0.581
0.500
477
0.8%
Current Habitat
HSRG Harvest
Harv
pHOS-Goal
Int/Seg/Step/None
Smolt Release
None
477
y
100%% to Nat. Spawn. 100%
pNOB-Goal
pHOSpNOB
None
PNI 59%
None
pHOS-Realized
Cons
Strays
266
Ave Ave
265
474
0.080
59%
0.500
0.152
None
Recruits/Spawner
Current Harvest
Fitness? [Y / N]
Habitat ----->
154,603161
1,250
0.82
1.30 1,250
0.500
0.581
0.0100.010
y
0.34
1.30 1,250
1
0.581
0.050 0.080
0.020 0.080
0.080
0.020
0.080 0.050
0.080
pHOS pNOB
NoneHarv
59%
pHOS
Conservation
y
466
263
59%
0.080
pNOB
Harv
Harvest
Segregated Hatchery
Ave
y
Stabilizing
HRT Alternative 4
Stabilizing
161 161
0.010 0.010
Harv
0.8%
y
100%
y
0.8%
Current Habitat
Current Hydro
100%
466
Subregion/SubbasinNatural Reproduction only
0.080
pNOB
S.F. Salmon R Spring Chinook
Harvest
Hatchery
Patterns
Patterns shown here are assigned to the population from
the AHA or ROL file. Red cells indicate patterns are not
assigned to this population/scenario in the rollup
application. The shown pattern needs to be added to the
application, or a different pattern should be assigned to
this population in the ROL/AHA file.
Current Hydro
Current Harvest
Current Hydro
HSRG Harvest
Current Habitat
Hydro ----->
HRT Alt-B
Harvest
Segregated Hatchery
0.010
1.30
0.010
154,603
0.34
1
Stabilizing
-
0.20
0.40
0.60
0.80
1.00
- 0.20 0.40 0.60 0.80 1.00pNOB
pH
OS
.5
.9
.8
.7
.6
.4.3.2
PNI
.1
0
100
200
300
400
500
600
700
800
Ha
tch
ery
Ha
bita
t
Ma
rin
e
L. M
ain
ste
m
U.
Ma
inste
m
Te
rmin
al
0
100
200
300
400
500
600
700
800
Ha
tch
ery
Ha
bita
t
Ma
rin
e
L. M
ain
ste
m
U.
Ma
inste
m
Te
rmin
al
0
100
200
300
400
500
600
700
800
Ha
tch
ery
Ha
bita
t
Ma
rin
e
L.
Ma
inste
m
U.
Ma
inste
m
Te
rmin
al
0
100
200
300
400
500
600
700
800
Ha
tch
ery
Ha
bita
t
Ma
rin
e
L.
Ma
inste
m
U.
Ma
inste
m
Te
rmin
al
0
100
200
300
400
500
600
700
800
Ha
tch
ery
Ha
bita
t
Ma
rin
e
L. M
ain
ste
m
U.
Ma
inste
m
Te
rmin
al
Ha
tch
ery
Ha
bita
tM
ari
ne L.
U.
Te
rmin
al
Apply & Recalculate
Update

USFWS Columbia Basin Hatchery Review Team: Lower Snake Assessments and Recommendations Reports–March 2011
62 Appendix A – AHA Output
Table A41. AHA output for Rapid River Hatchery Spring Chinook released at the hatchery into the Rapid River (see also Table A40). HRT
Alternatives refer to the South Fork Salmon River summer Chinook program.
Population (Ctrl + Page Up/Down to Scroll)Species/Race Population Management Intent:
Harv&Hatchery Strategy:
Population Recovery Designation:
Ad. Capacity
% Kelt
Sm. Capacity
Ocean Surv Baseline SAR Vary? (Y/N) 0.098 0.040 0.029 0.008 0.029 0.008 0.029 0.008 0.029 0.008 0.029 0.008
Adult Passage
Adj. Capacity
Harv - Marine
Harv - L. Mainstem
Harv - U. Mainstem
Harv -Terminal
Total Exploitation Rate
Broodstock Composition
Type
Local Imported 1,745 1,745 1,745 1,745
220 220 220 220 220 220 220 220
Destination for HOR Returns
Productivity of Hatchery Fish
455
2Realized Spawning Composition
Relative Hatchery Optimum -> 80 80 80 80 80
Weir Factor ->
Relative Reproductive Success (HOS) -> 80% 80% 80% 80% 80%
Initial Fitness Factor (A) -> 0.81 0.81 0.81 0.81 0.81
Fitness Factor after 100 generations (B) -> 0.19 1.00 0.19 0.19 0.19
Average Fitness Factor (100 Generations) -> 0.24 0.99 0.24 0.24 0.24
Generations until average fitness is reached -> 43 30 43 43 43
Minimum Hatchery Program (% of BS Goal) -> Effective pHOS -> 1.00 Effective pHOS -> Effective pHOS -> 1.00 Effective pHOS -> 1.00 Effective pHOS -> 1.00
"Fitness Floor" -> pNOB -> pNOB -> pNOB -> pNOB -> pNOB ->
Calculated Hatchery SAR ->
Calculated Natural SAR ->
Max Min Max Min Max Min Max Min Max Min
NOR Escapement 0 0 0 0 0 0 0 0 0 0
HoS Total Escapement (includes strays) 1,494 259 1,494 259 1,494 259 1,494 259
All H Analyzer (AHA)
Harvest --->
Hatchery
6.0
0
No HatcheryCurrent
0.01 0 00.01
Segregated Hatchery
0.01
N/A
1
0
y
0.82
Current Hydro
Current Habitat
0
Ave
0.8%
0.581
pHOS
489
0.8%
10%
Current Hydro
Current Harvest
Ave
y
HORs
HORs
0.010
HORs
0.080
HORs
0.010
0.080
0.080
0.500
Hydro
Harvest
NORs
NORs
0.01Adjusted Productivity
NORs
Juv Passage Surv.
NORs
NORs
0.050
pHOS
0.050
0.152
0.080
0.581
pNOB
0.152
1
0.020
0.34
0.01
0.020
HORs 0.010
1
11
10A-Salmon_Little Salmon Spring Chinook
(Rapid River-Hatchery)
y
1
Historic
0
0.01 0
0
Productivity (Adult)
Min NOR EscapeHabitatSmolt Productivity
% to Hatchery
Purpose
Export Goal/Realized
Cons/Harv/Both
Broodstock by Source
Brood Exported (from HOR Surplus)
1
1.00 0.34
0
y
1.00
1
Segregated Hatchery
0.500
0.01
0.050
00
0.080
0.080
0.010
0
y
Harvest
0.34
N/A
HRT Alternative 2
0
1
0.01
0.82
0.1520.152
0.820.82
0.020 0.080
90%
HRT Alt. 5; HSRG Sol.
0.01
90%
0.581
0.500
489
0.8%
Current Habitat
0.4%
HSRG Harvest
Harv
pHOS-Goal
2,736,596
Int/Seg/Step/None
Smolt Release
Seg
6.0 6.0
90%
y
100%% to Nat. Spawn. 90% 10%
pNOB-Goal
pHOSpNOB
None
PNI 100%
Seg
pHOS-Realized
Cons
Strays
0
Ave Ave
0
489
2,736,596
0.080
100%
0.500
0.152
Seg
Recruits/Spawner
0.4% 0.4%
Current Harvest
6.0Fitness? [Y / N]
Habitat ----->
0.4%
11
0
0.82
0.01 0
0.500
0.581
0.0100.010
y
0.34
0.01 0
1
0.581
0.050 0.080
0.020 0.080
0.080
0.020
0.080 0.050
0.080
pHOS pNOB
SegHarv
100%
pHOS
Conservation
y
489
0
100%
0.080
pNOB
Harv
Harvest
Segregated Hatchery
0.4%
Ave
y
N/A
2,736,596
HRT Alternative 4
N/A
1 1
0.010
6.0
0.010
Harv
2,736,596
0.8%
y
10%
y
0.8%
Current Habitat
Current Hydro
10%
Subregion/SubbasinNatural Reproduction only
0.080
pNOB
S.F. Salmon R Spring Chinook
Harvest
Hatchery
Patterns
Patterns shown here are assigned to the population from
the AHA or ROL file. Red cells indicate patterns are not
assigned to this population/scenario in the rollup
application. The shown pattern needs to be added to the
application, or a different pattern should be assigned to
this population in the ROL/AHA file.
Current Hydro
Current Harvest
Current Hydro
HSRG Harvest
Current Habitat
Hydro ----->
HRT Alt-B
Harvest
Segregated Hatchery
0.010
0.01
0.010
1
0.34
1
N/A
-
0.20
0.40
0.60
0.80
1.00
- 0.20 0.40 0.60 0.80 1.00pNOB
pH
OS
.5
.9
.8
.7
.6
.4.3.2
PNI
.1
0
1,000
2,000
3,000
4,000
5,000
6,000
Ha
tch
ery
Ha
bita
t
Ma
rin
e
L. M
ain
ste
m
U.
Ma
inste
m
Te
rmin
al
0
1,000
2,000
3,000
4,000
5,000
6,000
Ha
tch
ery
Ha
bita
t
Ma
rin
e
L. M
ain
ste
m
U.
Ma
inste
m
Te
rmin
al
0
1,000
2,000
3,000
4,000
5,000
6,000
Ha
tch
ery
Ha
bita
t
Ma
rin
e
L.
Ma
inste
m
U.
Ma
inste
m
Te
rmin
al
0
1,000
2,000
3,000
4,000
5,000
6,000
Ha
tch
ery
Ha
bita
t
Ma
rin
e
L.
Ma
inste
m
U.
Ma
inste
m
Te
rmin
al
0
1,000
2,000
3,000
4,000
5,000
6,000
Ha
tch
ery
Ha
bita
t
Ma
rin
e
L. M
ain
ste
m
U.
Ma
inste
m
Te
rmin
al
Ha
tch
ery
Ha
bita
tM
ari
ne L.
U.
Te
rmin
al
Apply & Recalculate
Update

USFWS Columbia Basin Hatchery Review Team: Lower Snake Assessments and Recommendations Reports–March 2011
Appendix A – AHA Output 63
Table A42. AHA output for South Fork Salmon River summer Chinook. The HSRG solution and HRT Alternative 5 are essentially identical.
HRT Alternatives 4 and 5 represent “stepping-stone” programs. Outputs for the “production” broodstocks are presented in Table A43.
Population (Ctrl + Page Up/Down to Scroll)Species/Race Population Management Intent:
Harv&Hatchery Strategy:
Population Recovery Designation:
Ad. Capacity
% Kelt
Sm. Capacity
Ocean Surv Baseline SAR Vary? (Y/N) 0.098 0.010 0.029 0.008 0.029 0.008 0.029 0.008 0.029 0.008 0.029 0.008
Adult Passage
Adj. Capacity
Harv - Marine
Harv - L. Mainstem
Harv - U. Mainstem
Harv -Terminal
Total Exploitation Rate
Broodstock Composition
Type
Local Imported 979 245 480 172
294 294 485 485 294 294 533 533
Destination for HOR Returns
Productivity of Hatchery Fish
459
3Realized Spawning Composition
Relative Hatchery Optimum -> 80 80 80 80 80
Weir Factor ->
Relative Reproductive Success (HOS) -> 80% 80% 80% 80% 80%
Initial Fitness Factor (A) -> 0.81 0.81 0.81 0.81 0.81
Fitness Factor after 100 generations (B) -> 0.50 1.00 0.70 0.63 0.73
Average Fitness Factor (100 Generations) -> 0.50 0.99 0.71 0.66 0.74
Generations until average fitness is reached -> 15 30 31 38 31
Minimum Hatchery Program (% of BS Goal) -> Effective pHOS -> 0.60 Effective pHOS -> Effective pHOS -> 0.55 Effective pHOS -> 0.50 Effective pHOS -> 0.36
"Fitness Floor" -> 0.5 pNOB -> pNOB -> pNOB -> 0.33 pNOB -> 0.25 pNOB -> 0.25
Calculated Hatchery SAR ->
Calculated Natural SAR ->
Max Min Max Min Max Min Max Min Max Min
NOR Escapement 3,432 487 4,218 570 4,001 423 3,261 195 1,714 138
HoS Total Escapement (includes strays) 5,879 1,021 4,898 850 2,887 501 915 158
All H Analyzer (AHA)
Harvest --->
Hatchery
6.0
1,008
No HatcheryCurrent
3.00 2,150 2,1503.00
Segregated Hatchery
3.00
Primary
1
2,150
y
0.82
Current Hydro
Current Habitat
1,218
Ave
0.8%
0.413
pHOS
1,925
3
0.8%
50%
Current Hydro
Current Harvest
Ave
y
HORs
HORs
0.010
HORs
0.080
HORs
0.010
0.080
0.080
0.300
Hydro
Harvest
NORs
NORs
3.00Adjusted Productivity
NORs
Juv Passage Surv.
NORs
NORs
0.050
pHOS
0.050
0.152
0.080
0.413
pNOB
0.152
1
0.020
0.34
3.00
0.020
HORs 0.010
1
371371
11-Salmon_SF Salmon Summer Chinook
y
265,918
Historic
215,000
3.00 2,150
300
Productivity (Adult)
Min NOR EscapeHabitatSmolt Productivity
% to Hatchery
Purpose
Export Goal/Realized
Cons/Harv/Both
Broodstock by Source
Brood Exported (from HOR Surplus)
265,918
1.00 0.34
2,150
y
1.00
265,918
Integrated Hatchery
0.300
3.00
0.050
2,1502,150
0.080
0.080
0.010
2,150
y
Conservation and Harvest
0.34
Primary
HRT Alternative 2
2,150
1
3.00
0.82
0.1520.152
0.820.82
0.020 0.020
90%
HRT Alt. 5; HSRG Sol.
3.00
3
50%
0.152
0.080
1,604
0.8%
Current Habitat
0.6%
HSRG Harvest
Harv
pHOS-Goal
1,000,224
Int/Seg/Step/None
Smolt Release
Int
909
6.0
50%
y
100%% to Nat. Spawn. 50% 50%
pNOB-Goal
pHOSpNOB
None
PNI 60%
Seg
pHOS-Realized
Cons
Strays
1,066
Ave Ave
759
945
490,406
0.080
0.5850%
50%
0.300
0.152
Int
Recruits/Spawner
0.6%
Current Harvest
6.0Fitness? [Y / N]
Habitat ----->
0.6%
132,959371
2,150
0.82
3.00 1,075
0.080
0.152
0.0100.010
y
0.34
3.00 1,075
1
0.413
0.050 0.050
0.020 0.020
0.080
0.020
0.080 0.050
0.080
pHOS pNOB
IntCons
36%
pHOS
Conservation
y
299
426
55%
0.050
pNOB
Both
0.50
Conservation
Stepping Stone Hatchery
0.6%
Ave
y
Primary
175,729
HRT Alternative 4
Primary
371 371
0.010
6.0
50%
0.010
Cons
250,235
0.8%
y
50%
y
0.8%
Current Habitat
Current Hydro
10%
202
Subregion/SubbasinNatural Reproduction only
67%
0.080
pNOB
S.F. Salmon R Spring Chinook
Harvest and Conservation
Hatchery
0.55
Patterns
Patterns shown here are assigned to the population from
the AHA or ROL file. Red cells indicate patterns are not
assigned to this population/scenario in the rollup
application. The shown pattern needs to be added to the
application, or a different pattern should be assigned to
this population in the ROL/AHA file.
Current Hydro
Current Harvest
Current Hydro
HSRG Harvest
Current Habitat
Hydro ----->
HRT Alt-B
Conservation
Stepping Stone Hatchery
0.010
3.00
0.010
265,918
0.34
1
Primary
-
0.20
0.40
0.60
0.80
1.00
- 0.20 0.40 0.60 0.80 1.00pNOB
pH
OS
.5
.9
.8
.7
.6
.4.3.2
PNI
.1
0
500
1,000
1,500
2,000
2,500
3,000
3,500
Ha
tch
ery
Ha
bita
t
Ma
rin
e
L. M
ain
ste
m
U.
Ma
inste
m
Te
rmin
al
0
500
1,000
1,500
2,000
2,500
3,000
3,500
Ha
tch
ery
Ha
bita
t
Ma
rin
e
L. M
ain
ste
m
U.
Ma
inste
m
Te
rmin
al
0
500
1,000
1,500
2,000
2,500
3,000
3,500
Ha
tch
ery
Ha
bita
t
Ma
rin
e
L.
Ma
inste
m
U.
Ma
inste
m
Te
rmin
al
0
500
1,000
1,500
2,000
2,500
3,000
3,500
Ha
tch
ery
Ha
bita
t
Ma
rin
e
L.
Ma
inste
m
U.
Ma
inste
m
Te
rmin
al
0
500
1,000
1,500
2,000
2,500
3,000
3,500
Ha
tch
ery
Ha
bita
t
Ma
rin
e
L. M
ain
ste
m
U.
Ma
inste
m
Te
rmin
al
Ha
tch
ery
Ha
bita
tM
ari
ne L.
U.
Te
rmin
al
Apply & Recalculate
Update
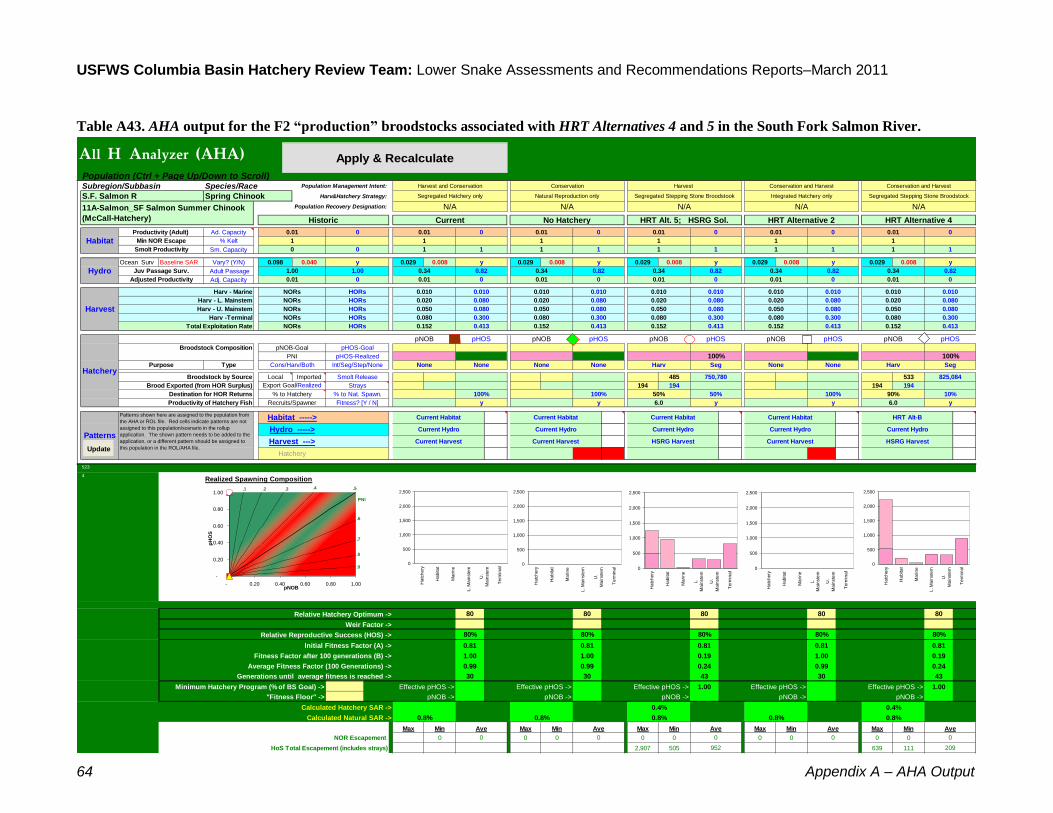
USFWS Columbia Basin Hatchery Review Team: Lower Snake Assessments and Recommendations Reports–March 2011
64 Appendix A – AHA Output
Table A43. AHA output for the F2 “production” broodstocks associated with HRT Alternatives 4 and 5 in the South Fork Salmon River.
Population (Ctrl + Page Up/Down to Scroll)Species/Race Population Management Intent:
Harv&Hatchery Strategy:
Population Recovery Designation:
Ad. Capacity
% Kelt
Sm. Capacity
Ocean Surv Baseline SAR Vary? (Y/N) 0.098 0.040 0.029 0.008 0.029 0.008 0.029 0.008 0.029 0.008 0.029 0.008
Adult Passage
Adj. Capacity
Harv - Marine
Harv - L. Mainstem
Harv - U. Mainstem
Harv -Terminal
Total Exploitation Rate
Broodstock Composition
Type
Local Imported 485 533
194 194 194 194
Destination for HOR Returns
Productivity of Hatchery Fish
523
4Realized Spawning Composition
Relative Hatchery Optimum -> 80 80 80 80 80
Weir Factor ->
Relative Reproductive Success (HOS) -> 80% 80% 80% 80% 80%
Initial Fitness Factor (A) -> 0.81 0.81 0.81 0.81 0.81
Fitness Factor after 100 generations (B) -> 1.00 1.00 0.19 1.00 0.19
Average Fitness Factor (100 Generations) -> 0.99 0.99 0.24 0.99 0.24
Generations until average fitness is reached -> 30 30 43 30 43
Minimum Hatchery Program (% of BS Goal) -> Effective pHOS -> Effective pHOS -> Effective pHOS -> 1.00 Effective pHOS -> Effective pHOS -> 1.00
"Fitness Floor" -> pNOB -> pNOB -> pNOB -> pNOB -> pNOB ->
Calculated Hatchery SAR ->
Calculated Natural SAR ->
Max Min Max Min Max Min Max Min Max Min
NOR Escapement 0 0 0 0 0 0 0 0 0 0
HoS Total Escapement (includes strays) 2,907 505 639 111
All H Analyzer (AHA)
Harvest --->
Hatchery
6.0
0
No HatcheryCurrent
0.01 0 00.01
Segregated Hatchery only
0.01
N/A
1
0
y
0.82
Current Hydro
Current Habitat
0
Ave
0.8%
0.413
pHOS
0.8%
100%
Current Hydro
Current Harvest
Ave
y
HORs
HORs
0.010
HORs
0.080
HORs
0.010
0.080
0.080
0.300
Hydro
Harvest
NORs
NORs
0.01Adjusted Productivity
NORs
Juv Passage Surv.
NORs
NORs
0.050
pHOS
0.050
0.152
0.080
0.413
pNOB
0.152
1
0.020
0.34
0.01
0.020
HORs 0.010
1
11
11A-Salmon_SF Salmon Summer Chinook
(McCall-Hatchery)
y
1
Historic
0
0.01 0
0
Productivity (Adult)
Min NOR EscapeHabitatSmolt Productivity
% to Hatchery
Purpose
Export Goal/Realized
Cons/Harv/Both
Broodstock by Source
Brood Exported (from HOR Surplus)
1
1.00 0.34
0
y
1.00
1
Integrated Hatchery only
0.300
0.01
0.050
00
0.080
0.080
0.010
0
y
Conservation and Harvest
0.34
N/A
HRT Alternative 2
0
1
0.01
0.82
0.1520.152
0.820.82
0.020 0.080
90%
HRT Alt. 5; HSRG Sol.
0.01
0.413
0.300
952
0.8%
Current Habitat
HSRG Harvest
None
pHOS-Goal
Int/Seg/Step/None
Smolt Release
Seg
6.0
50%
y
100%% to Nat. Spawn. 50%
pNOB-Goal
pHOSpNOB
None
PNI
None
pHOS-Realized
None
Strays
0
Ave Ave
0
0.0800.300
0.152
None
Recruits/Spawner
0.4%
Current Harvest
Fitness? [Y / N]
Habitat ----->
11
0
0.82
0.01 0
0.300
0.413
0.0100.010
y
0.34
0.01 0
1
0.413
0.050 0.080
0.020 0.080
0.080
0.020
0.080 0.050
0.080
pHOS pNOB
SegHarv
100%
pHOS
Conservation
y
209
0
100%
0.080
pNOB
None
Conservation and Harvest
Segregated Stepping Stone Broodstock
0.4%
Ave
y
N/A
825,084
HRT Alternative 4
N/A
1 1
0.010 0.010
Harv
750,780
0.8%
y
100%
y
0.8%
Current Habitat
Current Hydro
10%
Subregion/SubbasinNatural Reproduction only
0.080
pNOB
S.F. Salmon R Spring Chinook
Harvest and Conservation
Hatchery
Patterns
Patterns shown here are assigned to the population from
the AHA or ROL file. Red cells indicate patterns are not
assigned to this population/scenario in the rollup
application. The shown pattern needs to be added to the
application, or a different pattern should be assigned to
this population in the ROL/AHA file.
Current Hydro
Current Harvest
Current Hydro
HSRG Harvest
Current Habitat
Hydro ----->
HRT Alt-B
Harvest
Segregated Stepping Stone Broodstook
0.010
0.01
0.010
1
0.34
1
N/A
-
0.20
0.40
0.60
0.80
1.00
- 0.20 0.40 0.60 0.80 1.00pNOB
pH
OS
.5
.9
.8
.7
.6
.4.3.2
PNI
.1
0
500
1,000
1,500
2,000
2,500
Ha
tch
ery
Ha
bita
t
Ma
rin
e
L. M
ain
ste
m
U.
Ma
inste
m
Te
rmin
al
0
500
1,000
1,500
2,000
2,500
Ha
tch
ery
Ha
bita
t
Ma
rin
e
L. M
ain
ste
m
U.
Ma
inste
m
Te
rmin
al
0
500
1,000
1,500
2,000
2,500
Ha
tch
ery
Ha
bita
t
Ma
rin
e
L.
Ma
inste
m
U.
Ma
inste
m
Te
rmin
al
0
500
1,000
1,500
2,000
2,500
Ha
tch
ery
Ha
bita
t
Ma
rin
e
L.
Ma
inste
m
U.
Ma
inste
m
Te
rmin
al
0
500
1,000
1,500
2,000
2,500
Ha
tch
ery
Ha
bita
t
Ma
rin
e
L. M
ain
ste
m
U.
Ma
inste
m
Te
rmin
al
Ha
tch
ery
Ha
bita
tM
ari
ne L.
U.
Te
rmin
al
Apply & Recalculate
Update

USFWS Columbia Basin Hatchery Review Team: Lower Snake Assessments and Recommendations Reports–March 2011
Appendix A – AHA Output 65
Table A44. AHA output for Secesh River spring Chinook. HRT Alternatives refer to South Fork Salmon River summer Chinook program.
Population (Ctrl + Page Up/Down to Scroll)Species/Race Population Management Intent:
Harv&Hatchery Strategy:
Population Recovery Designation:
Ad. Capacity
% Kelt
Sm. Capacity
Ocean Surv Baseline SAR Vary? (Y/N) 0.092 0.040 0.029 0.008 0.029 0.008 0.029 0.008 0.029 0.008 0.029 0.008
Adult Passage
Adj. Capacity
Harv - Marine
Harv - L. Mainstem
Harv - U. Mainstem
Harv -Terminal
Total Exploitation Rate
Broodstock Composition
Type
Local Imported
Destination for HOR Returns
Productivity of Hatchery Fish
525
5Realized Spawning Composition
Relative Hatchery Optimum -> 80 80 80 80 80
Weir Factor ->
Relative Reproductive Success (HOS) -> 80% 80% 80% 80% 80%
Initial Fitness Factor (A) -> 0.81 0.81 0.81 0.81 0.81
Fitness Factor after 100 generations (B) -> 0.50 1.00 0.50 0.50 0.92
Average Fitness Factor (100 Generations) -> 0.52 0.99 0.55 0.59 0.93
Generations until average fitness is reached -> 31 30 39 43 24
Minimum Hatchery Program (% of BS Goal) -> Effective pHOS -> 0.20 Effective pHOS -> Effective pHOS -> 0.14 Effective pHOS -> 0.10 Effective pHOS -> 0.01
"Fitness Floor" -> 0.5 pNOB -> pNOB -> pNOB -> pNOB -> pNOB ->
Calculated Hatchery SAR ->
Calculated Natural SAR ->
Max Min Max Min Max Min Max Min Max Min
NOR Escapement 357 17 1,281 140 427 12 468 11 1,047 125
HoS Total Escapement (includes strays) 70 12 48 8 40 7 16 3
All H Analyzer (AHA)
Harvest --->
Hatchery
73
No HatcheryCurrent
1.62 1,350 1,3501.62
Natural Reproduction only
1.62
Primary
1
1,350
y
0.82
Current Hydro
Current Habitat
423
Ave
0.8%
0.083
pHOS
23
23
0.8%
100%
Current Hydro
Current Harvest
Ave
y
HORs
HORs
0.010
HORs
0.005
HORs
0.010
0.050
0.020
0.005
Hydro
Harvest
NORs
NORs
1.62Adjusted Productivity
NORs
Juv Passage Surv.
NORs
NORs
0.050
pHOS
0.050
0.083
0.005
0.083
pNOB
0.083
1
0.020
0.34
1.62
0.020
HORs 0.010
1
200200
12-Salmon_Secesh Spring Chinook
y
166,972
Historic
33,750
1.62 1,350
41
Productivity (Adult)
Min NOR EscapeHabitatSmolt Productivity
% to Hatchery
Purpose
Export Goal/Realized
Cons/Harv/Both
Broodstock by Source
Brood Exported (from HOR Surplus)
166,972
1.00 0.34
1,350
y
1.00
166,972
Natural Reproduction only
0.005
1.62
0.050
1,3501,350
0.020
0.050
0.010
1,350
y
Conservation
0.34
Primary
HRT Alternative 2
1,350
1
1.62
0.82
0.0830.083
0.820.82
0.020 0.020
HRT Alt. 5; HSRG Sol.
1.62
13
0.083
0.005
16
0.8%
Current Habitat
HSRG Harvest
None
pHOS-Goal
Int/Seg/Step/None
Smolt Release
None
16
y
100%% to Nat. Spawn. 100%
pNOB-Goal
pHOSpNOB
None
PNI 20%
None
pHOS-Realized
None
Strays
76
Ave Ave
91
13
0.005
10%
0.005
0.083
None
Recruits/Spawner
Current Harvest
Fitness? [Y / N]
Habitat ----->
166,972200
1,350
0.82
1.62 1,350
0.005
0.083
0.0100.010
y
0.34
1.62 1,350
1
0.083
0.050 0.050
0.020 0.020
0.005
0.020
0.050 0.050
0.020
pHOS pNOB
NoneNone
1%
pHOS
Conservation
y
5
360
14%
0.050
pNOB
None
Conservation
Natural Reproduction only
Ave
y
Primary
HRT Alternative 4
Primary
200 200
0.010 0.010
None
0.8%
y
100%
y
0.8%
Current Habitat
Current Hydro
100%
5
Subregion/SubbasinNatural Reproduction only
0.005
pNOB
S.F. Salmon R Spring Chinook
Conservation
Hatchery
Patterns
Patterns shown here are assigned to the population from
the AHA or ROL file. Red cells indicate patterns are not
assigned to this population/scenario in the rollup
application. The shown pattern needs to be added to the
application, or a different pattern should be assigned to
this population in the ROL/AHA file.
Current Hydro
Current Harvest
Current Hydro
HSRG Harvest
Current Habitat
Hydro ----->
HRT Alt-B
Conservation
Natural Reproduction only
0.010
1.62
0.010
166,972
0.34
1
Primary
-
0.20
0.40
0.60
0.80
1.00
- 0.20 0.40 0.60 0.80 1.00pNOB
pH
OS
.5
.9
.8
.7
.6
.4.3.2
PNI
.1
0
50
100
150
200
250
300
350
400
450
Ha
tch
ery
Ha
bita
t
Ma
rin
e
L. M
ain
ste
m
U.
Ma
inste
m
Te
rmin
al
0
50
100
150
200
250
300
350
400
450
Ha
tch
ery
Ha
bita
t
Ma
rin
e
L. M
ain
ste
m
U.
Ma
inste
m
Te
rmin
al
0
50
100
150
200
250
300
350
400
450
Ha
tch
ery
Ha
bita
t
Ma
rin
e
L.
Ma
inste
m
U.
Ma
inste
m
Te
rmin
al
0
50
100
150
200
250
300
350
400
450
Ha
tch
ery
Ha
bita
t
Ma
rin
e
L.
Ma
inste
m
U.
Ma
inste
m
Te
rmin
al
0
50
100
150
200
250
300
350
400
450
Ha
tch
ery
Ha
bita
t
Ma
rin
e
L. M
ain
ste
m
U.
Ma
inste
m
Te
rmin
al
Ha
tch
ery
Ha
bita
tM
ari
ne L.
U.
Te
rmin
al
Apply & Recalculate
Update
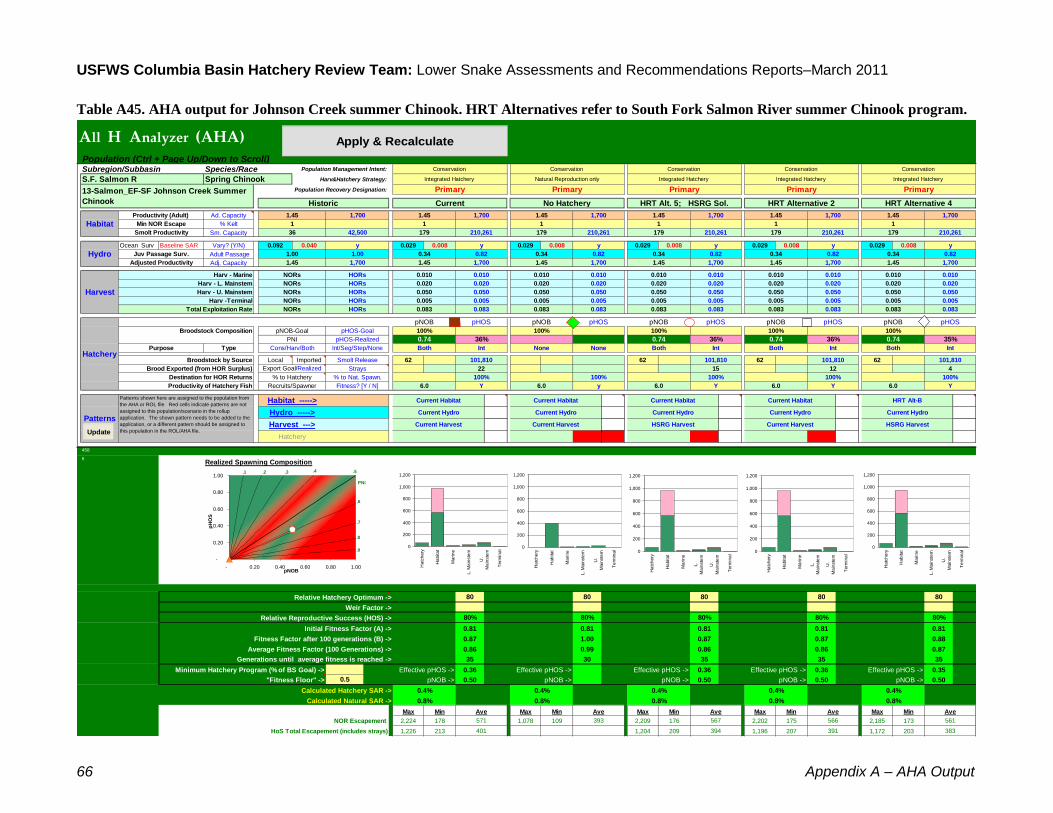
USFWS Columbia Basin Hatchery Review Team: Lower Snake Assessments and Recommendations Reports–March 2011
66 Appendix A – AHA Output
Table A45. AHA output for Johnson Creek summer Chinook. HRT Alternatives refer to South Fork Salmon River summer Chinook program.
Population (Ctrl + Page Up/Down to Scroll)Species/Race Population Management Intent:
Harv&Hatchery Strategy:
Population Recovery Designation:
Ad. Capacity
% Kelt
Sm. Capacity
Ocean Surv Baseline SAR Vary? (Y/N) 0.092 0.040 0.029 0.008 0.029 0.008 0.029 0.008 0.029 0.008 0.029 0.008
Adult Passage
Adj. Capacity
Harv - Marine
Harv - L. Mainstem
Harv - U. Mainstem
Harv -Terminal
Total Exploitation Rate
Broodstock Composition
Type
Local Imported 62 62 62 62
Destination for HOR Returns
Productivity of Hatchery Fish
458
6Realized Spawning Composition
Relative Hatchery Optimum -> 80 80 80 80 80
Weir Factor ->
Relative Reproductive Success (HOS) -> 80% 80% 80% 80% 80%
Initial Fitness Factor (A) -> 0.81 0.81 0.81 0.81 0.81
Fitness Factor after 100 generations (B) -> 0.87 1.00 0.87 0.87 0.88
Average Fitness Factor (100 Generations) -> 0.86 0.99 0.86 0.86 0.87
Generations until average fitness is reached -> 35 30 35 35 35
Minimum Hatchery Program (% of BS Goal) -> Effective pHOS -> 0.36 Effective pHOS -> Effective pHOS -> 0.36 Effective pHOS -> 0.36 Effective pHOS -> 0.35
"Fitness Floor" -> 0.5 pNOB -> 0.50 pNOB -> pNOB -> 0.50 pNOB -> 0.50 pNOB -> 0.50
Calculated Hatchery SAR ->
Calculated Natural SAR ->
Max Min Max Min Max Min Max Min Max Min
NOR Escapement 2,224 178 1,078 109 2,209 176 2,202 175 2,185 173
HoS Total Escapement (includes strays) 1,226 213 1,204 209 1,196 207 1,172 203
All H Analyzer (AHA)
Harvest --->
Hatchery
6.0
571
No HatcheryCurrent
1.45 1,700 1,7001.45
Integrated Hatchery
1.45
Primary
1
1,700
y
0.82
Current Hydro
Current Habitat
393
Ave
0.8%
0.083
pHOS
401
22
0.8%
100%
Current Hydro
Current Harvest
Ave
Y
HORs
HORs
0.010
HORs
0.005
HORs
0.010
0.050
0.020
0.005
Hydro
Harvest
NORs
NORs
1.45Adjusted Productivity
NORs
Juv Passage Surv.
NORs
NORs
0.050
pHOS
0.050
0.083
0.005
0.083
pNOB
0.083
1
0.020
0.34
1.45
0.020
HORs 0.010
1
179179
13-Salmon_EF-SF Johnson Creek Summer
Chinook
y
210,261
Historic
42,500
1.45 1,700
36
Productivity (Adult)
Min NOR EscapeHabitatSmolt Productivity
% to Hatchery
Purpose
Export Goal/Realized
Cons/Harv/Both
Broodstock by Source
Brood Exported (from HOR Surplus)
210,261
1.00 0.34
1,700
y
1.00
210,261
Integrated Hatchery
0.005
1.45
0.050
1,7001,700
0.020
0.050
0.010
1,700
y
Conservation
0.34
Primary
HRT Alternative 2
1,700
1
1.45
0.82
0.0830.083
0.820.82
0.020 0.020
HRT Alt. 5; HSRG Sol.
1.45
12
0.083
0.005
394
0.8%
Current Habitat
0.4%
HSRG Harvest
Both
pHOS-Goal
101,810
Int/Seg/Step/None
Smolt Release
100%
Int
15
100%
6.0 6.0y
100%% to Nat. Spawn. 100%
pNOB-Goal
0.74
pHOSpNOB
None
PNI 36%
Int
pHOS-Realized
None
Strays
567
Ave Ave
566
391
101,810
0.005
0.7436%
100%
0.005
0.083
Int
Recruits/Spawner
0.4% 0.4%
Current Harvest
6.0Fitness? [Y / N]
Habitat ----->
0.4%
210,261179
1,700
0.82
1.45 1,700
0.005
0.083
0.0100.010
y
0.34
1.45 1,700
1
0.083
0.050 0.050
0.020 0.020
0.005
0.020
0.050 0.050
0.020
pHOS pNOB
IntBoth
35%
pHOS
Conservation
y
383
561
36%
0.050
pNOB
Both
0.74
Conservation
Integrated Hatchery
0.4%
Ave
Y
Primary
101,810
HRT Alternative 4
Primary
179 179
0.010
6.0
100%
0.010
Both
101,810
0.8%
Y
100%
Y
0.8%
Current Habitat
Current Hydro
100%
4
Subregion/SubbasinNatural Reproduction only
100%
0.005
pNOB
S.F. Salmon R Spring Chinook
Conservation
Hatchery
0.74
Patterns
Patterns shown here are assigned to the population from
the AHA or ROL file. Red cells indicate patterns are not
assigned to this population/scenario in the rollup
application. The shown pattern needs to be added to the
application, or a different pattern should be assigned to
this population in the ROL/AHA file.
Current Hydro
Current Harvest
Current Hydro
HSRG Harvest
Current Habitat
Hydro ----->
HRT Alt-B
Conservation
Integrated Hatchery
0.010
1.45
0.010
210,261
0.34
1
Primary
-
0.20
0.40
0.60
0.80
1.00
- 0.20 0.40 0.60 0.80 1.00pNOB
pH
OS
.5
.9
.8
.7
.6
.4.3.2
PNI
.1
0
200
400
600
800
1,000
1,200
Ha
tch
ery
Ha
bita
t
Ma
rin
e
L. M
ain
ste
m
U.
Ma
inste
m
Te
rmin
al
0
200
400
600
800
1,000
1,200
Ha
tch
ery
Ha
bita
t
Ma
rin
e
L. M
ain
ste
m
U.
Ma
inste
m
Te
rmin
al
0
200
400
600
800
1,000
1,200
Ha
tch
ery
Ha
bita
t
Ma
rin
e
L.
Ma
inste
m
U.
Ma
inste
m
Te
rmin
al
0
200
400
600
800
1,000
1,200
Ha
tch
ery
Ha
bita
t
Ma
rin
e
L.
Ma
inste
m
U.
Ma
inste
m
Te
rmin
al
0
200
400
600
800
1,000
1,200
Ha
tch
ery
Ha
bita
t
Ma
rin
e
L. M
ain
ste
m
U.
Ma
inste
m
Te
rmin
al
Ha
tch
ery
Ha
bita
tM
ari
ne L.
U.
Te
rmin
al
Apply & Recalculate
Update

USFWS Columbia Basin Hatchery Review Team Lower Snake Federal Hatcheries Assessments and Recommendations Reports–March 2011
Appendix A – AHA Output 67
Table A46-A56: AHA outputs for the Upper Salmon River Major
Population Group (MPG) of spring/summer Chinook salmon

USFWS Columbia Basin Hatchery Review Team Lower Snake Federal Hatcheries Assessments and Recommendations Reports–March 2011
68 Appendix A – AHA Output
Parameters and assumptions for spring/summer Chinook in the Upper Salmon River Major Population Group (MPG) The Upper Salmon River MPG for spring/summer Chinook includes the mainstem Salmon River and
all tributaries upstream of, and including, the North Fork Salmon River. The Interior Columbia
Technical Recovery Team (ICTRT) identified nine demographically independent populations within
this MPG (AHA Tables A46-A56). Two hatchery populations are also present within this MPG:
Pahsimeroi Hatchery Summer Chinook and Sawtooth Hatchery Spring Chinook.
Table 9A. Mean values of reproductive and survival parameters assumed in the AHA analyses
for hatchery-origin spring/summer Chinook released within the Upper Salmon River MPG.
These parameter values were obtained from the HSRG, as provided by IDFG.
Hatchery/
Release location
Population/stock
Fecundity
(No. of
eggs)
Within-
hatchery
egg-to-smolt
survival
Salmon
River
smolt-to-
adult
survival (%)
Recruit/spawner
(R/S; adults)
Pahsimeroi FH
Pahsimeroi Hatchery Summer
Chinook
5,000
0.80
0.39%
6.0
Sawtooth FH
Sawtooth Hatchery Spring
Chinook - Current
4,900
0.80
0.13%
2.0
Sawtooth FH
Sawtooth Hatchery Spring
Chinook: HSRG Solution and
HRT Alternatives A and B
4,900
0.80
0.18%
2.5
Sawtooth FH/
E.F. Salmon River
Spring/Summer
Chinook,
Yankee Fork Spring Chinook
Valley Creek Spring Chinook
4,900
0.80
0.18%
2.5
Current programs, HSRG solutions, and HRT alternatives
The HRT reviewed one hatchery program in the upper Salmon River basin: the spring Chinook
program at Sawtooth FH (Table 10A). The intent of the current program at the Sawthooth FH is to
release 1.0M Sawtooth Hatchery Spring Chinook smolts annually into the mainstem Salmon River at
the hatchery weir. Currently, the Sawtooth Hatchery Spring Chinook stock is propagated as a
segregated population (pNOB = 0).
The HSRG solution involved the establishment of a second, conservation hatchery program derived
from natural-origin fish trapped at the Sawtooth Hatchery weir with a mean equilibrium value of
pNOB = 67% and an annual release of 200,000 smolts. The existing segregated hatchery population
would be maintained with a maximum release of 1.2M smolts. The HSRG Solution requires the

USFWS Columbia Basin Hatchery Review Team Lower Snake Federal Hatcheries Assessments and Recommendations Reports–March 2011
Appendix A – AHA Output 69
maintenance of two independent hatchery populations. The HRT adopted this HSRG Solution as HRT
Alternative 4.
HRT Alternative 2 would convert the existing segregated hatchery program to an integrated hatchery
program. AHA modelling suggests that current habitat conditions would restrict an integrated hatchery
program to a maximum release of 500,000 smolts, with pNOB = 0.5.
HRT Alternative 3 would convert the existing segregated hatchery program to a stepping stone
hatchery program composed of two broodstocks where returning adults from the first “integrated”
broodstock would be used as parents for the second “production” broodstock. AHA modeling suggests
that current habitat conditions would restrict each of the two broodstocks in a stepping-stone program
to a maximum release of 375,000 smolts each, with a combined maximum release of 750,000 smolts,
with pNOB = 0.5 for the first broodstock, and pNOB = 0 for the second broodstock. These latter results
are consistent with HSRG conclusions that a stepping stone program would not be able to meet the
total desired release of 1.0M smolts under current habitat conditions. The HRT favored Alternative 3
over Alternative 4 (i.e., the HSRG solution) because of the large numbers of hatchery-origin spring
Chinook that currently spawn in the mainstem Salmon River downstream from the hatchery weir and
the presumed inability to preclude large numbers of hatchery-origin fish from a “segregated” hatchery
program from spawning naturally in the mainstem Salmon River. The HRT believed this latter risk
could be reduced via a “stepping stone” program, albeit with a 25% reduction in the maximum number
of smolts available for release.
The HRT also examined alternatives for initiating hatchery programs on the East Fork Salmon River,
Yankee Fork, and Valley Creek. Two scenarios were modeled for each population. A small integrated
conservation program of 52,000 smolts (pNOB = 1.0) and a large segregated harvest program of 1.0M
smolts (HRT Alterantives A and B, respectively) were each modeled for the E.F. Salmon River and
Valley Creek. The former integrated programs of 52,000 smolts were the sizes that maximized the
predicted number of natural-origin recruits returning to each of the two streams. This latter number of
smolts also maximized the number of natural-origin recruits in Yankee Fork. In all three streams,
productivity and capacity constraints inhibited the long-term conservation benefit of hatchery-origin
fish spawning naturally. The AHA analyses also suggest that large segregated hatchery programs in
Valley Creek and the East Fork Salmon River would not be able to meet LSRCP mitigation goals
without large numbers of hatchery-origin fish escaping fisheries and potentially spawning naturally,
thereby increasing biological risks to ESA listed natural populations under current harvest regimes.
Based on those analyses, the HRT modeled two integrated programs for Yankee Fork, each with an
annual release of 52,000 smolts, but with pNOB = 1.0 and 0.5, respectively.
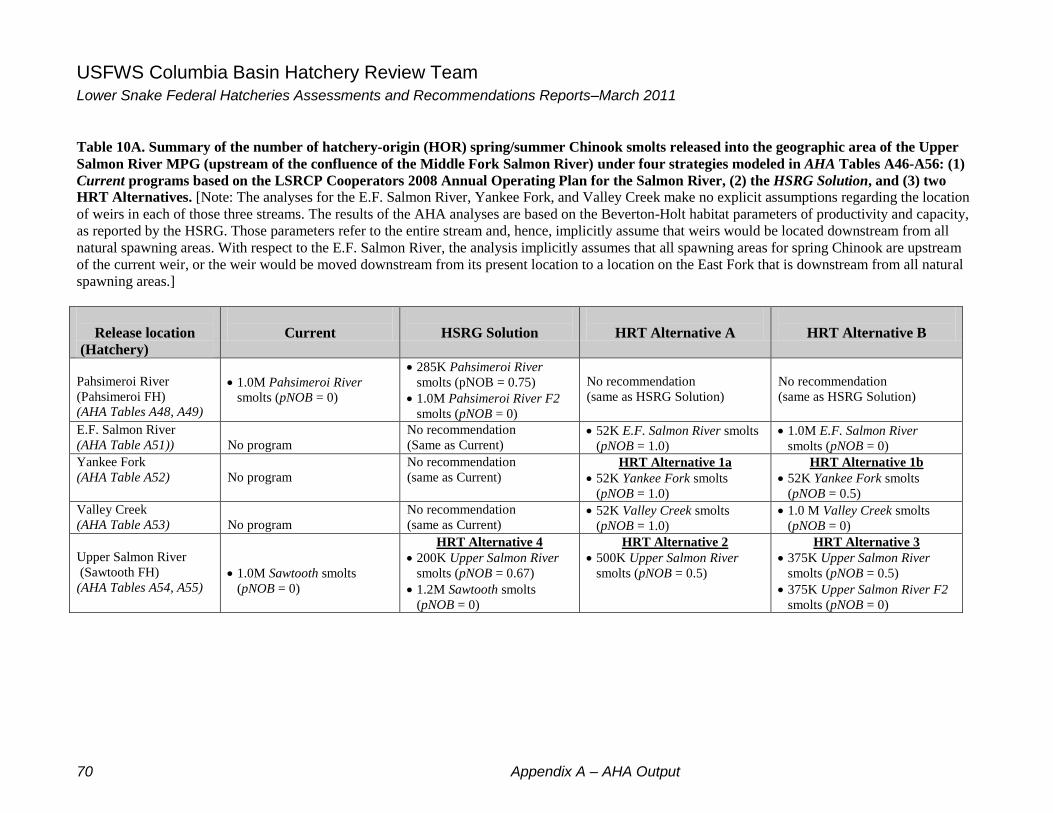
USFWS Columbia Basin Hatchery Review Team Lower Snake Federal Hatcheries Assessments and Recommendations Reports–March 2011
70 Appendix A – AHA Output
Table 10A. Summary of the number of hatchery-origin (HOR) spring/summer Chinook smolts released into the geographic area of the Upper
Salmon River MPG (upstream of the confluence of the Middle Fork Salmon River) under four strategies modeled in AHA Tables A46-A56: (1)
Current programs based on the LSRCP Cooperators 2008 Annual Operating Plan for the Salmon River, (2) the HSRG Solution, and (3) two
HRT Alternatives. [Note: The analyses for the E.F. Salmon River, Yankee Fork, and Valley Creek make no explicit assumptions regarding the location
of weirs in each of those three streams. The results of the AHA analyses are based on the Beverton-Holt habitat parameters of productivity and capacity,
as reported by the HSRG. Those parameters refer to the entire stream and, hence, implicitly assume that weirs would be located downstream from all
natural spawning areas. With respect to the E.F. Salmon River, the analysis implicitly assumes that all spawning areas for spring Chinook are upstream
of the current weir, or the weir would be moved downstream from its present location to a location on the East Fork that is downstream from all natural
spawning areas.]
Release location
(Hatchery)
Current
HSRG Solution
HRT Alternative A
HRT Alternative B
Pahsimeroi River
(Pahsimeroi FH)
(AHA Tables A48, A49)
1.0M Pahsimeroi River
smolts (pNOB = 0)
285K Pahsimeroi River
smolts (pNOB = 0.75)
1.0M Pahsimeroi River F2
smolts (pNOB = 0)
No recommendation
(same as HSRG Solution)
No recommendation
(same as HSRG Solution)
E.F. Salmon River
(AHA Table A51))
No program
No recommendation
(Same as Current) 52K E.F. Salmon River smolts
(pNOB = 1.0)
1.0M E.F. Salmon River
smolts (pNOB = 0)
Yankee Fork
(AHA Table A52)
No program
No recommendation
(same as Current) HRT Alternative 1a
52K Yankee Fork smolts
(pNOB = 1.0)
HRT Alternative 1b
52K Yankee Fork smolts
(pNOB = 0.5)
Valley Creek
(AHA Table A53)
No program
No recommendation
(same as Current) 52K Valley Creek smolts
(pNOB = 1.0)
1.0 M Valley Creek smolts
(pNOB = 0)
Upper Salmon River
(Sawtooth FH)
(AHA Tables A54, A55)
1.0M Sawtooth smolts
(pNOB = 0)
HRT Alternative 4
200K Upper Salmon River
smolts (pNOB = 0.67)
1.2M Sawtooth smolts
(pNOB = 0)
HRT Alternative 2
500K Upper Salmon River
smolts (pNOB = 0.5)
HRT Alternative 3
375K Upper Salmon River
smolts (pNOB = 0.5)
375K Upper Salmon River F2
smolts (pNOB = 0)

USFWS Columbia Basin Hatchery Review Team: Lower Snake Assessments and Recommendations Reports–March 2011
Appendix A – AHA Output 71
Table A46. AHA output for North Fork Salmon River spring Chinook.
Population (Ctrl + Page Up/Down to Scroll)Species/Race Population Management Intent:
Harv&Hatchery Strategy:
Population Recovery Designation:
Ad. Capacity
% Kelt
Sm. Capacity
Ocean Surv Baseline SAR Vary? (Y/N) 0.092 0.040 0.029 0.008 0.029 0.008 0.029 0.008 0.029 0.008 0.029 0.008
Adult Passage
Adj. Capacity
Harv - Marine
Harv - L. Mainstem
Harv - U. Mainstem
Harv -Terminal
Total Exploitation Rate
Broodstock Composition
Type
Local Imported
Destination for HOR Returns
Productivity of Hatchery Fish
534
1Realized Spawning Composition
Relative Hatchery Optimum -> 80 80 80 80 80
Weir Factor ->
Relative Reproductive Success (HOS) -> 80% 80% 80% 80% 80%
Initial Fitness Factor (A) -> 0.81 0.81 0.81 0.81 0.81
Fitness Factor after 100 generations (B) -> 0.50 1.00 0.50 0.50 0.50
Average Fitness Factor (100 Generations) -> 0.50 0.99 0.50 0.50 0.52
Generations until average fitness is reached -> 21 30 22 22
Minimum Hatchery Program (% of BS Goal) -> Effective pHOS -> 0.30 Effective pHOS -> Effective pHOS -> 0.28 Effective pHOS -> 0.28 Effective pHOS -> 0.22
"Fitness Floor" -> 0.5 pNOB -> pNOB -> pNOB -> pNOB -> pNOB ->
Calculated Hatchery SAR ->
Calculated Natural SAR ->
Max Min Max Min Max Min Max Min Max Min
NOR Escapement 146 14 502 55 122 11 123 11 130 7
HoS Total Escapement (includes strays) 74 13 56 10 57 10 31 5
Conservation
Natural Reproduction only
0.010
1.60
0.010
68,026
0.34
1
Contributing
Patterns
Patterns shown here are assigned to the population from
the AHA or ROL file. Red cells indicate patterns are not
assigned to this population/scenario in the rollup
application. The shown pattern needs to be added to the
application, or a different pattern should be assigned to
this population in the ROL/AHA file.
Current Hydro
HRT-A
Current Hydro
HRT-B
Current Habitat
Hydro ----->
Current Habitat
Subregion/SubbasinNatural Reproduction only
0.005
pNOB
Upper Salmon R Spring Chinook
Conservation
Hatchery
100%
10
None
0.8%
y
100%
y
0.8%
Current Habitat
Current Hydro
Contributing
198 198
0.010 0.010
Conservation
Natural Reproduction only
Ave
y
Contributing
HRT Alternative B
Conservation
y
10
29
28%
0.080
pNOB
None
pHOS pNOB
NoneNone
22%
pHOS
0.246
0.050 0.080
0.020 0.080
0.005
0.020
0.080 0.050
0.080
1.60 550
1
0.0100.010
y
0.34
Habitat ----->
68,026198
550
0.82
1.60 550
0.100
0.246
Recruits/Spawner
Current Harvest
Fitness? [Y / N]
0.005
28%
0.100
0.083
None
Strays
39
Ave Ave
39
19
None
PNI 30%
None
pHOS-Realized
None
% to Nat. Spawn. 100%
pNOB-Goal
pHOSpNOB
y
100%
HSRG
None
pHOS-Goal
Int/Seg/Step/None
Smolt Release
None
18
0.8%
Current Habitat
18
HSRG Solution
1.60
19
0.246
0.100
0.0830.083
0.820.82
0.020 0.080
550
y
Conservation
0.34
Contributing
HRT Alternative A
550
1
1.60
0.82
68,026
Natural Reproduction only
0.100
1.60
0.050
550550
0.080
0.080
0.010
68,026
1.00 0.34
550
y
1.00
% to Hatchery
Purpose
Export Goal/Realized
Cons/Harv/Both
Broodstock by Source
Brood Exported (from HOR Surplus)
Productivity (Adult)
Min NOR EscapeHabitatSmolt Productivity
24-Salmon_NF Salmon River Spring
Chinook
y
68,026
Historic
13,750
1.60 550
40
1
0.020
0.34
1.60
0.020
HORs 0.010
1
198198
0.050
pHOS
0.050
0.083
0.005
0.246
pNOB
0.083
Hydro
Harvest
NORs
NORs
1.60Adjusted Productivity
NORs
Juv Passage Surv.
NORs
NORs HORs
HORs
0.010
HORs
0.005
HORs
0.010
0.080
0.080
0.100
24
24
0.8%
100%
Current Hydro
Current Harvest
Ave
y
0.246
pHOS
Current Hydro
Current Habitat
168
Ave
0.8%
Natural Reproduction only
1.60
Contributing
1
550
y
0.82
No HatcheryCurrent
1.60 550 5501.60
46
All H Analyzer (AHA)
Harvest --->
Hatchery
-
0.20
0.40
0.60
0.80
1.00
- 0.20 0.40 0.60 0.80 1.00pNOB
pH
OS
.5
.9
.8
.7
.6
.4.3.2
PNI
.1
0
20
40
60
80
100
120
140
160
180
Ha
tch
ery
Ha
bita
t
Ma
rin
e
L. M
ain
ste
m
U.
Ma
inste
m
Te
rmin
al
0
20
40
60
80
100
120
140
160
180
Ha
tch
ery
Ha
bita
t
Ma
rin
e
L. M
ain
ste
m
U.
Ma
inste
m
Te
rmin
al
0
20
40
60
80
100
120
140
160
180
Ha
tch
ery
Ha
bita
t
Ma
rin
e
L.
Ma
inste
m
U.
Ma
inste
m
Te
rmin
al
0
20
40
60
80
100
120
140
160
180
Ha
tch
ery
Ha
bita
t
Ma
rin
e
L.
Ma
inste
m
U.
Ma
inste
m
Te
rmin
al
0
20
40
60
80
100
120
140
160
180
Ha
tch
ery
Ha
bita
t
Ma
rin
e
L. M
ain
ste
m
U.
Ma
inste
m
Te
rmin
al
Ha
tch
ery
Ha
bita
tM
ari
ne L.
U.
Te
rmin
al
Apply & Recalculate
Update

USFWS Columbia Basin Hatchery Review Team: Lower Snake Assessments and Recommendations Reports–March 2011
72 Appendix A – AHA Output
Table A47. AHA output for Lemhi River spring Chinook.
Population (Ctrl + Page Up/Down to Scroll)Species/Race Population Management Intent:
Harv&Hatchery Strategy:
Population Recovery Designation:
Ad. Capacity
% Kelt
Sm. Capacity
Ocean Surv Baseline SAR Vary? (Y/N) 0.092 0.040 0.029 0.008 0.029 0.008 0.029 0.008 0.029 0.008 0.029 0.008
Adult Passage
Adj. Capacity
Harv - Marine
Harv - L. Mainstem
Harv - U. Mainstem
Harv -Terminal
Total Exploitation Rate
Broodstock Composition
Type
Local Imported
Destination for HOR Returns
Productivity of Hatchery Fish
453
2Realized Spawning Composition
Relative Hatchery Optimum -> 80 80 80 80 80
Weir Factor ->
Relative Reproductive Success (HOS) -> 80% 80% 80% 80% 80%
Initial Fitness Factor (A) -> 0.81 0.81 0.81 0.81 0.81
Fitness Factor after 100 generations (B) -> 0.50 1.00 0.50 0.50 0.50
Average Fitness Factor (100 Generations) -> 0.51 0.99 0.52 0.52 0.57
Generations until average fitness is reached -> 30 39
Minimum Hatchery Program (% of BS Goal) -> Effective pHOS -> 0.30 Effective pHOS -> Effective pHOS -> 0.27 Effective pHOS -> 0.27 Effective pHOS -> 0.15
"Fitness Floor" -> 0.5 pNOB -> pNOB -> pNOB -> pNOB -> pNOB ->
Calculated Hatchery SAR ->
Calculated Natural SAR ->
Max Min Max Min Max Min Max Min Max Min
NOR Escapement 214 10 1,551 116 254 8 252 8 356 4
HoS Total Escapement (includes strays) 74 13 56 10 57 10 31 5
Conservation
Natural Reproduction only
0.010
1.31
0.010
482,363
0.34
1
Primary
Patterns
Patterns shown here are assigned to the population from
the AHA or ROL file. Red cells indicate patterns are not
assigned to this population/scenario in the rollup
application. The shown pattern needs to be added to the
application, or a different pattern should be assigned to
this population in the ROL/AHA file.
Current Hydro
HRT-A
Current Hydro
HRT-B
Current Habitat
Hydro ----->
Current Habitat
Subregion/SubbasinNatural Reproduction only
0.005
pNOB
Upper Salmon R Spring Chinook
Conservation
Hatchery
100%
10
None
0.8%
y
100%
y
0.8%
Current Habitat
Current Hydro
Primary
162 162
0.010 0.010
Conservation
Natural Reproduction only
Ave
y
Primary
HRT Alternative B
Conservation
y
10
46
27%
0.080
pNOB
None
pHOS pNOB
NoneNone
15%
pHOS
0.246
0.050 0.080
0.020 0.080
0.005
0.020
0.080 0.050
0.080
1.31 3,900
1
0.0100.010
y
0.34
Habitat ----->
482,363162
3,900
0.82
1.31 3,900
0.100
0.246
Recruits/Spawner
Current Harvest
Fitness? [Y / N]
0.005
27%
0.100
0.083
None
Strays
41
Ave Ave
41
19
None
PNI 30%
None
pHOS-Realized
None
% to Nat. Spawn. 100%
pNOB-Goal
pHOSpNOB
y
100%
HSRG
None
pHOS-Goal
Int/Seg/Step/None
Smolt Release
None
18
0.8%
Current Habitat
18
HSRG Solution
1.31
19
0.246
0.100
0.0830.083
0.820.82
0.020 0.080
3,900
y
Conservation
0.34
Primary
HRT Alternative A
3,900
1
1.31
0.82
482,363
Natural Reproduction only
0.100
1.31
0.050
3,9003,900
0.080
0.080
0.010
482,363
1.00 0.34
3,900
y
1.00
% to Hatchery
Purpose
Export Goal/Realized
Cons/Harv/Both
Broodstock by Source
Brood Exported (from HOR Surplus)
Productivity (Adult)
Min NOR EscapeHabitatSmolt Productivity
25-Salmon_Lemhi River Spring Chinook
y
482,363
Historic
97,500
1.31 3,900
33
1
0.020
0.34
1.31
0.020
HORs 0.010
1
162162
0.050
pHOS
0.050
0.083
0.005
0.246
pNOB
0.083
Hydro
Harvest
NORs
NORs
1.31Adjusted Productivity
NORs
Juv Passage Surv.
NORs
NORs HORs
HORs
0.010
HORs
0.005
HORs
0.010
0.080
0.080
0.100
24
24
0.8%
100%
Current Hydro
Current Harvest
Ave
y
0.246
pHOS
Current Hydro
Current Habitat
578
Ave
0.8%
Natural Reproduction only
1.31
Primary
1
3,900
y
0.82
No HatcheryCurrent
1.31 3,900 3,9001.31
46
All H Analyzer (AHA)
Harvest --->
Hatchery
-
0.20
0.40
0.60
0.80
1.00
- 0.20 0.40 0.60 0.80 1.00pNOB
pH
OS
.5
.9
.8
.7
.6
.4.3.2
PNI
.1
0
100
200
300
400
500
600
700
Ha
tch
ery
Ha
bita
t
Ma
rin
e
L. M
ain
ste
m
U.
Ma
inste
m
Te
rmin
al
0
100
200
300
400
500
600
700
Ha
tch
ery
Ha
bita
t
Ma
rin
e
L. M
ain
ste
m
U.
Ma
inste
m
Te
rmin
al
0
100
200
300
400
500
600
700
Ha
tch
ery
Ha
bita
t
Ma
rin
e
L.
Ma
inste
m
U.
Ma
inste
m
Te
rmin
al
0
100
200
300
400
500
600
700
Ha
tch
ery
Ha
bita
t
Ma
rin
e
L.
Ma
inste
m
U.
Ma
inste
m
Te
rmin
al
0
100
200
300
400
500
600
700
Ha
tch
ery
Ha
bita
t
Ma
rin
e
L. M
ain
ste
m
U.
Ma
inste
m
Te
rmin
al
Ha
tch
ery
Ha
bita
tM
ari
ne L.
U.
Te
rmin
al
Apply & Recalculate
Update

USFWS Columbia Basin Hatchery Review Team: Lower Snake Assessments and Recommendations Reports–March 2011
Appendix A – AHA Output 73
Table A48. AHA output for Pahsimeroi River summer Chinook.
Population (Ctrl + Page Up/Down to Scroll)Species/Race Population Management Intent:
Harv&Hatchery Strategy:
Population Recovery Designation:
Ad. Capacity
% Kelt
Sm. Capacity
Ocean Surv Baseline SAR Vary? (Y/N) 0.092 0.040 0.029 0.008 0.029 0.008 0.029 0.008 0.029 0.008 0.029 0.008
Adult Passage
Adj. Capacity
Harv - Marine
Harv - L. Mainstem
Harv - U. Mainstem
Harv -Terminal
Total Exploitation Rate
Broodstock Composition
Type
Local Imported 526 150 150 150
526 525 526 525 526 525
Destination for HOR Returns
Productivity of Hatchery Fish
460
3Realized Spawning Composition
Relative Hatchery Optimum -> 80 80 80 80 80
Weir Factor ->
Relative Reproductive Success (HOS) -> 80% 80% 80% 80% 80%
Initial Fitness Factor (A) -> 0.81 0.81 0.81 0.81 0.81
Fitness Factor after 100 generations (B) -> 0.50 1.00 0.84 0.84 0.84
Average Fitness Factor (100 Generations) -> 0.50 0.99 0.83 0.83 0.83
Generations until average fitness is reached -> 18 30 25 25 34
Minimum Hatchery Program (% of BS Goal) -> Effective pHOS -> 0.37 Effective pHOS -> Effective pHOS -> 0.33 Effective pHOS -> 0.33 Effective pHOS -> 0.33
"Fitness Floor" -> 0.5 pNOB -> pNOB -> pNOB -> 0.38 pNOB -> 0.38 pNOB -> 0.38
Calculated Hatchery SAR ->
Calculated Natural SAR ->
Max Min Max Min Max Min Max Min Max Min
NOR Escapement 1,362 128 2,550 273 3,561 269 3,561 269 3,540 267
HoS Total Escapement (includes strays) 881 152 1,719 298 1,720 299 1,694 294
Harvest and Conservation
Stepping Stone Integrated Hatchery
0.010
1.70
0.010
395,785
0.34
1
Primary
Patterns
Patterns shown here are assigned to the population from
the AHA or ROL file. Red cells indicate patterns are not
assigned to this population/scenario in the rollup
application. The shown pattern needs to be added to the
application, or a different pattern should be assigned to
this population in the ROL/AHA file.
Current Hydro
HRT-A
Current Hydro
HRT-B
Current Habitat
Hydro ----->
Current Habitat
Subregion/SubbasinNatural Reproduction only
75%
0.080
pNOB
Upper Salmon R Spring Chinook
Harvest and Conservation
Hatchery
10%
470
Cons
285,000
0.8%
y
10%
y
0.8%
Current Habitat
Current Hydro
Primary
210 210
0.010
6.0
75%
0.010
Harvest and Conservation
Stepping Stone Integrated Hatchery
0.3%
Ave
y
Primary
285,000
HRT Alternative B
Conservation
y
554
916
33%
0.050
pNOB
Cons
pHOS pNOB
StepCons
33%
pHOS
0.152
0.050 0.050
0.020 0.020
0.080
0.020
0.050 0.050
0.020
1.70 3,200
1
0.0100.010
y
0.34
Habitat ----->
0.3%
395,785210
3,200
0.82
1.70 3,200
0.080
0.152
Recruits/Spawner
0.3%
Current Harvest
6.0Fitness? [Y / N]
285,000
0.080
33%
75%
0.080
0.152
Step
Strays
920
Ave Ave
921
563
None
PNI 37%
Seg
pHOS-Realized
None
% to Nat. Spawn. 90% 10%
pNOB-Goal
pHOSpNOB
6.0
90%
y
100%
HSRG
Harv
pHOS-Goal
999,400
Int/Seg/Step/None
Smolt Release
Step
478
0.8%
Current Habitat
0.3%
563
90%
HSRG Solution
1.70
478
90%
0.152
0.080
0.1520.152
0.820.82
0.020 0.020
3,200
y
Harvest and Conservation
0.34
Primary
HRT Alternative A
3,200
1
1.70
0.82
395,785
Stepping Stone Integrated Hatchery
0.100
1.70
0.050
3,2003,200
0.080
0.080
0.010
395,785
1.00 0.34
3,200
y
1.00
% to Hatchery
Purpose
Export Goal/Realized
Cons/Harv/Both
Broodstock by Source
Brood Exported (from HOR Surplus)
Productivity (Adult)
Min NOR EscapeHabitatSmolt Productivity
26-Salmon_Pahsimeroi Summer Chinook
y
395,785
Historic
80,000
1.70 3,200
43
1
0.020
0.34
1.70
0.020
HORs 0.010
1
210210
0.050
pHOS
0.050
0.152
0.080
0.246
pNOB
0.152
Hydro
Harvest
NORs
NORs
1.70Adjusted Productivity
NORs
Juv Passage Surv.
NORs
NORs HORs
HORs
0.010
HORs
0.080
HORs
0.010
0.080
0.080
0.100
288
23
0.8%
10%
Current Hydro
Current Harvest
Ave
y
0.246
pHOS
Current Hydro
Current Habitat
863
Ave
0.8%
Segregated Hatchery
1.70
Primary
1
3,200
y
0.82
No HatcheryCurrent
1.70 3,200 3,2001.70
398
6.0
All H Analyzer (AHA)
Harvest --->
Hatchery
-
0.20
0.40
0.60
0.80
1.00
- 0.20 0.40 0.60 0.80 1.00pNOB
pH
OS
.5
.9
.8
.7
.6
.4.3.2
PNI
.1
0
500
1,000
1,500
2,000
2,500
3,000
Ha
tch
ery
Ha
bita
t
Ma
rin
e
L. M
ain
ste
m
U.
Ma
inste
m
Te
rmin
al
0
500
1,000
1,500
2,000
2,500
3,000
Ha
tch
ery
Ha
bita
t
Ma
rin
e
L. M
ain
ste
m
U.
Ma
inste
m
Te
rmin
al
0
500
1,000
1,500
2,000
2,500
3,000
Ha
tch
ery
Ha
bita
t
Ma
rin
e
L.
Ma
inste
m
U.
Ma
inste
m
Te
rmin
al
0
500
1,000
1,500
2,000
2,500
3,000
Ha
tch
ery
Ha
bita
t
Ma
rin
e
L.
Ma
inste
m
U.
Ma
inste
m
Te
rmin
al
0
500
1,000
1,500
2,000
2,500
3,000
Ha
tch
ery
Ha
bita
t
Ma
rin
e
L. M
ain
ste
m
U.
Ma
inste
m
Te
rmin
al
Ha
tch
ery
Ha
bita
tM
ari
ne L.
U.
Te
rmin
al
Apply & Recalculate
Update

USFWS Columbia Basin Hatchery Review Team: Lower Snake Assessments and Recommendations Reports–March 2011
74 Appendix A – AHA Output
Table A49. AHA output for Pahsimeroi Hatchery summer Chinook resulting from the second segregated broodstock of a two-stage “stepping
stone” hatchery program, as proposed by the HSRG.
Population (Ctrl + Page Up/Down to Scroll)Species/Race Population Management Intent:
Harv&Hatchery Strategy:
Population Recovery Designation:
Ad. Capacity
% Kelt
Sm. Capacity
Ocean Surv Baseline SAR Vary? (Y/N) 0.092 0.040 0.029 0.008 0.029 0.008 0.029 0.008 0.029 0.008 0.029 0.008
Adult Passage
Adj. Capacity
Harv - Marine
Harv - L. Mainstem
Harv - U. Mainstem
Harv -Terminal
Total Exploitation Rate
Broodstock Composition
Type
Local Imported 526 526 526
Destination for HOR Returns
Productivity of Hatchery Fish
535
4Realized Spawning Composition
Relative Hatchery Optimum -> 80 80 80 80 80
Weir Factor ->
Relative Reproductive Success (HOS) -> 80% 80% 80% 80% 80%
Initial Fitness Factor (A) -> 0.81 0.81 0.81 0.81 0.81
Fitness Factor after 100 generations (B) -> 1.00 1.00 0.50 0.50 0.50
Average Fitness Factor (100 Generations) -> 0.99 0.99 0.50 0.50 0.50
Generations until average fitness is reached -> 30 30 12 12 12
Minimum Hatchery Program (% of BS Goal) -> Effective pHOS -> Effective pHOS -> Effective pHOS -> 1.00 Effective pHOS -> 1.00 Effective pHOS -> 1.00
"Fitness Floor" -> 0.5 pNOB -> pNOB -> pNOB -> pNOB -> pNOB ->
Calculated Hatchery SAR ->
Calculated Natural SAR ->
Max Min Max Min Max Min Max Min Max Min
NOR Escapement 0 0 0 0 0 0 0 0 0 0
HoS Total Escapement (includes strays) 4,054 704 4,054 704 4,054 704
Harvest
Stepping Stone Segregated Hatchery
0.010
0.00
1
0.34
1
N/A
Patterns
Patterns shown here are assigned to the population from
the AHA or ROL file. Red cells indicate patterns are not
assigned to this population/scenario in the rollup
application. The shown pattern needs to be added to the
application, or a different pattern should be assigned to
this population in the ROL/AHA file.
Current Hydro
HRT-A
Current Hydro
HRT-B
Current Habitat
Hydro ----->
Current Habitat
Subregion/SubbasinNatural Reproduction only
pNOB
Upper Salmon R Spring Chinook
Harvest
Hatchery
50%
Harv
999,400
0.8%
y
50%
y
0.8%
Current Habitat
Current Hydro
N/A
0 0
6.0
0.010
Harvest
Stepping Stone Segregated Hatchery
0.3%
Ave
y
N/A
999,400
HRT Alternative B
Conservation
y
1,327
0
100%
0.080
pNOB
Harv
pHOS pNOB
StepHarv
100%
pHOS
0.246
0.080
0.080
0.080
0.080
0.00 0
1
0.010
y
0.34
Habitat ----->
10
0
0.82
0.00 0
0.100
0.246
Recruits/Spawner
0.3%
Current Harvest
Fitness? [Y / N]
999,400
100%
0.100
Step
Strays
0
Ave Ave
0
1,327
None
PNI
Seg
pHOS-Realized
None
% to Nat. Spawn. 50%
pNOB-Goal
pHOSpNOB
6.0
50%
y
100%
HSRG
Harv
pHOS-Goal
Int/Seg/Step/None
Smolt Release
Step
0.8%
Current Habitat
0.3%
1,327
50%
HSRG Solution
0.00
50%
0.246
0.100
0.820.82
0.080
0
y
Harvest
0.34
N/A
HRT Alternative A
0
1
0.00
0.82
1
Stepping Stone Segregated Hatchery
0.100
0.0000
0.080
0.080
0.010
1
1.00 0.34
0
y
1.00
% to Hatchery
Purpose
Export Goal/Realized
Cons/Harv/Both
Broodstock by Source
Brood Exported (from HOR Surplus)
Productivity (Adult)
Min NOR EscapeHabitatSmolt Productivity
26A-Salmon_Pahsimeroi Summer Chinook
(Pahsimeroi Hatchery)
y
1
Historic
0
0.00 0
0
1
0.34
0.00
HORs
1
00
pHOS
0.246
pNOB
Hydro
Harvest
NORs
NORs
0.00Adjusted Productivity
NORs
Juv Passage Surv.
NORs
NORs HORs
HORs
0.010
HORs
HORs 0.080
0.080
0.100
0.8%
100%
Current Hydro
Current Harvest
Ave
y
0.246
pHOS
Current Hydro
Current Habitat
0
Ave
0.8%
Segregated Hatchery
0.00
N/A
1
0
y
0.82
No HatcheryCurrent
0.00 0 00.00
0
6.0
All H Analyzer (AHA)
Harvest --->
Hatchery
-
0.20
0.40
0.60
0.80
1.00
- 0.20 0.40 0.60 0.80 1.00pNOB
pH
OS
.5
.9
.8
.7
.6
.4.3.2
PNI
.1
0
200
400
600
800
1,000
1,200
1,400
1,600
1,800
2,000
Ha
tch
ery
Ha
bita
t
Ma
rin
e
L. M
ain
ste
m
U.
Ma
inste
m
Te
rmin
al
0
200
400
600
800
1,000
1,200
1,400
1,600
1,800
2,000
Ha
tch
ery
Ha
bita
t
Ma
rin
e
L. M
ain
ste
m
U.
Ma
inste
m
Te
rmin
al
0
200
400
600
800
1,000
1,200
1,400
1,600
1,800
2,000
Ha
tch
ery
Ha
bita
t
Ma
rin
e
L.
Ma
inste
m
U.
Ma
inste
m
Te
rmin
al
0
200
400
600
800
1,000
1,200
1,400
1,600
1,800
2,000
Ha
tch
ery
Ha
bita
t
Ma
rin
e
L.
Ma
inste
m
U.
Ma
inste
m
Te
rmin
al
0
200
400
600
800
1,000
1,200
1,400
1,600
1,800
2,000
Ha
tch
ery
Ha
bita
t
Ma
rin
e
L. M
ain
ste
m
U.
Ma
inste
m
Te
rmin
al
Ha
tch
ery
Ha
bita
tM
ari
ne L.
U.
Te
rmin
al
Apply & Recalculate
Update
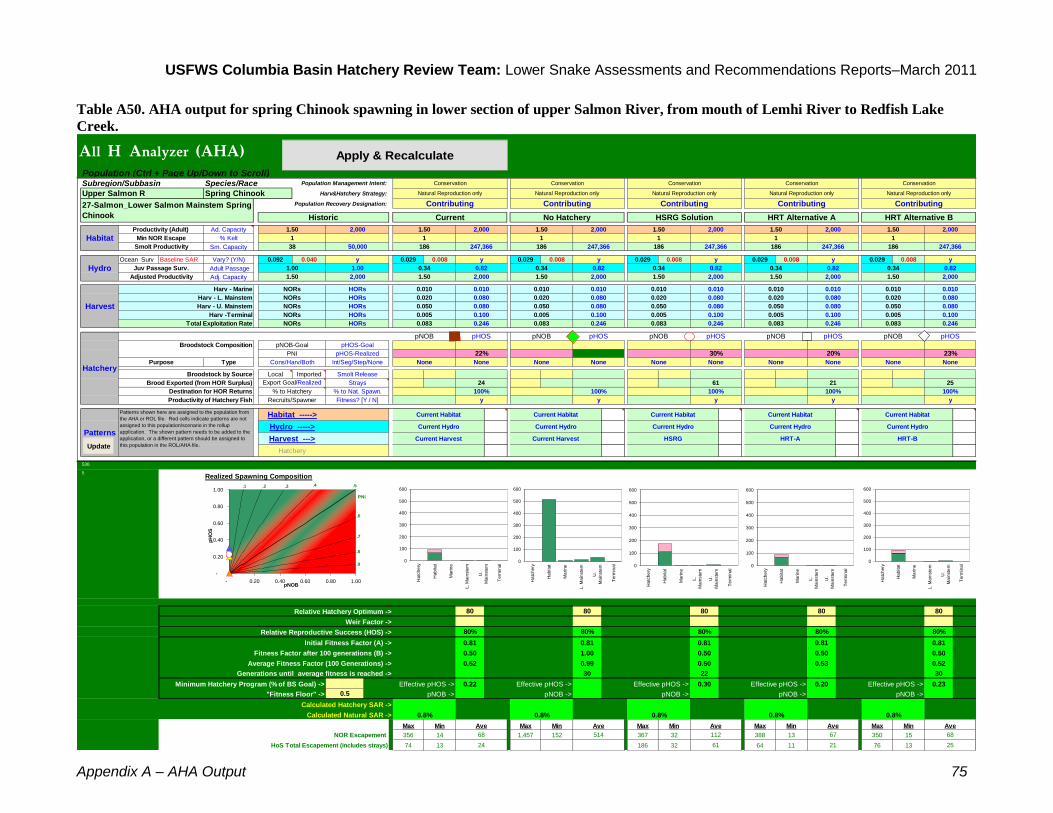
USFWS Columbia Basin Hatchery Review Team: Lower Snake Assessments and Recommendations Reports–March 2011
Appendix A – AHA Output 75
Table A50. AHA output for spring Chinook spawning in lower section of upper Salmon River, from mouth of Lemhi River to Redfish Lake
Creek.
Population (Ctrl + Page Up/Down to Scroll)Species/Race Population Management Intent:
Harv&Hatchery Strategy:
Population Recovery Designation:
Ad. Capacity
% Kelt
Sm. Capacity
Ocean Surv Baseline SAR Vary? (Y/N) 0.092 0.040 0.029 0.008 0.029 0.008 0.029 0.008 0.029 0.008 0.029 0.008
Adult Passage
Adj. Capacity
Harv - Marine
Harv - L. Mainstem
Harv - U. Mainstem
Harv -Terminal
Total Exploitation Rate
Broodstock Composition
Type
Local Imported
Destination for HOR Returns
Productivity of Hatchery Fish
536
5Realized Spawning Composition
Relative Hatchery Optimum -> 80 80 80 80 80
Weir Factor ->
Relative Reproductive Success (HOS) -> 80% 80% 80% 80% 80%
Initial Fitness Factor (A) -> 0.81 0.81 0.81 0.81 0.81
Fitness Factor after 100 generations (B) -> 0.50 1.00 0.50 0.50 0.50
Average Fitness Factor (100 Generations) -> 0.52 0.99 0.50 0.53 0.52
Generations until average fitness is reached -> 30 22 30
Minimum Hatchery Program (% of BS Goal) -> Effective pHOS -> 0.22 Effective pHOS -> Effective pHOS -> 0.30 Effective pHOS -> 0.20 Effective pHOS -> 0.23
"Fitness Floor" -> 0.5 pNOB -> pNOB -> pNOB -> pNOB -> pNOB ->
Calculated Hatchery SAR ->
Calculated Natural SAR ->
Max Min Max Min Max Min Max Min Max Min
NOR Escapement 356 14 1,457 152 367 32 388 13 350 15
HoS Total Escapement (includes strays) 74 13 186 32 64 11 76 13
Conservation
Natural Reproduction only
0.010
1.50
0.010
247,366
0.34
1
Contributing
Patterns
Patterns shown here are assigned to the population from
the AHA or ROL file. Red cells indicate patterns are not
assigned to this population/scenario in the rollup
application. The shown pattern needs to be added to the
application, or a different pattern should be assigned to
this population in the ROL/AHA file.
Current Hydro
HRT-A
Current Hydro
HRT-B
Current Habitat
Hydro ----->
Current Habitat
Subregion/SubbasinNatural Reproduction only
0.005
pNOB
Upper Salmon R Spring Chinook
Conservation
Hatchery
100%
25
None
0.8%
y
100%
y
0.8%
Current Habitat
Current Hydro
Contributing
186 186
0.010 0.010
Conservation
Natural Reproduction only
Ave
y
Contributing
HRT Alternative B
Conservation
y
25
68
30%
0.080
pNOB
None
pHOS pNOB
NoneNone
23%
pHOS
0.246
0.050 0.080
0.020 0.080
0.005
0.020
0.080 0.050
0.080
1.50 2,000
1
0.0100.010
y
0.34
Habitat ----->
247,366186
2,000
0.82
1.50 2,000
0.100
0.246
Recruits/Spawner
Current Harvest
Fitness? [Y / N]
0.005
20%
0.100
0.083
None
Strays
112
Ave Ave
67
21
None
PNI 22%
None
pHOS-Realized
None
% to Nat. Spawn. 100%
pNOB-Goal
pHOSpNOB
y
100%
HSRG
None
pHOS-Goal
Int/Seg/Step/None
Smolt Release
None
61
0.8%
Current Habitat
61
HSRG Solution
1.50
21
0.246
0.100
0.0830.083
0.820.82
0.020 0.080
2,000
y
Conservation
0.34
Contributing
HRT Alternative A
2,000
1
1.50
0.82
247,366
Natural Reproduction only
0.100
1.50
0.050
2,0002,000
0.080
0.080
0.010
247,366
1.00 0.34
2,000
y
1.00
% to Hatchery
Purpose
Export Goal/Realized
Cons/Harv/Both
Broodstock by Source
Brood Exported (from HOR Surplus)
Productivity (Adult)
Min NOR EscapeHabitatSmolt Productivity
27-Salmon_Lower Salmon Mainstem Spring
Chinook
y
247,366
Historic
50,000
1.50 2,000
38
1
0.020
0.34
1.50
0.020
HORs 0.010
1
186186
0.050
pHOS
0.050
0.083
0.005
0.246
pNOB
0.083
Hydro
Harvest
NORs
NORs
1.50Adjusted Productivity
NORs
Juv Passage Surv.
NORs
NORs HORs
HORs
0.010
HORs
0.005
HORs
0.010
0.080
0.080
0.100
24
24
0.8%
100%
Current Hydro
Current Harvest
Ave
y
0.246
pHOS
Current Hydro
Current Habitat
514
Ave
0.8%
Natural Reproduction only
1.50
Contributing
1
2,000
y
0.82
No HatcheryCurrent
1.50 2,000 2,0001.50
68
All H Analyzer (AHA)
Harvest --->
Hatchery
-
0.20
0.40
0.60
0.80
1.00
- 0.20 0.40 0.60 0.80 1.00pNOB
pH
OS
.5
.9
.8
.7
.6
.4.3.2
PNI
.1
0
100
200
300
400
500
600
Ha
tch
ery
Ha
bita
t
Ma
rin
e
L. M
ain
ste
m
U.
Ma
inste
m
Te
rmin
al
0
100
200
300
400
500
600
Ha
tch
ery
Ha
bita
t
Ma
rin
e
L. M
ain
ste
m
U.
Ma
inste
m
Te
rmin
al
0
100
200
300
400
500
600
Ha
tch
ery
Ha
bita
t
Ma
rin
e
L.
Ma
inste
m
U.
Ma
inste
m
Te
rmin
al
0
100
200
300
400
500
600
Ha
tch
ery
Ha
bita
t
Ma
rin
e
L.
Ma
inste
m
U.
Ma
inste
m
Te
rmin
al
0
100
200
300
400
500
600
Ha
tch
ery
Ha
bita
t
Ma
rin
e
L. M
ain
ste
m
U.
Ma
inste
m
Te
rmin
al
Ha
tch
ery
Ha
bita
tM
ari
ne L.
U.
Te
rmin
al
Apply & Recalculate
Update

USFWS Columbia Basin Hatchery Review Team: Lower Snake Assessments and Recommendations Reports–March 2011
76 Appendix A – AHA Output
Table A51. AHA output for East Fork Salmon River spring/summer Chinook. HRT Alternative A represents a small, integrated conservation
program, and HRT Alternative B represents a large segregated program in partial support for achieving LSRCP mitigation goals.
Population (Ctrl + Page Up/Down to Scroll)Species/Race Population Management Intent:
Harv&Hatchery Strategy:
Population Recovery Designation:
Ad. Capacity
% Kelt
Sm. Capacity
Ocean Surv Baseline SAR Vary? (Y/N) 0.092 0.040 0.029 0.008 0.029 0.008 0.029 0.008 0.029 0.008 0.029 0.008
Adult Passage
Adj. Capacity
Harv - Marine
Harv - L. Mainstem
Harv - U. Mainstem
Harv -Terminal
Total Exploitation Rate
Broodstock Composition
Type
Local Imported 30 567
Destination for HOR Returns
Productivity of Hatchery Fish
454
6Realized Spawning Composition
Relative Hatchery Optimum -> 80 80 80 80 80
Weir Factor ->
Relative Reproductive Success (HOS) -> 80% 80% 80% 80% 80%
Initial Fitness Factor (A) -> 0.81 0.81 0.81 0.81 0.81
Fitness Factor after 100 generations (B) -> 0.50 1.00 0.50 0.95 0.50
Average Fitness Factor (100 Generations) -> 0.51 0.99 0.51 0.93 0.50
Generations until average fitness is reached -> 27 30 26 44 18
Minimum Hatchery Program (% of BS Goal) -> Effective pHOS -> 0.28 Effective pHOS -> Effective pHOS -> 0.29 Effective pHOS -> 0.18 Effective pHOS -> 0.39
"Fitness Floor" -> 0.5 pNOB -> pNOB -> pNOB -> pNOB -> 0.50 pNOB ->
Calculated Hatchery SAR ->
Calculated Natural SAR ->
Max Min Max Min Max Min Max Min Max Min
NOR Escapement 187 13 980 100 178 14 1,318 95 595 55
HoS Total Escapement (includes strays) 74 13 83 14 317 55 422 73
Conservation
Natural Reproduction only
0.010
1.46
0.010
185,524
0.34
1
Contributing
Patterns
Patterns shown here are assigned to the population from
the AHA or ROL file. Red cells indicate patterns are not
assigned to this population/scenario in the rollup
application. The shown pattern needs to be added to the
application, or a different pattern should be assigned to
this population in the ROL/AHA file.
Current Hydro
HRT-A
Current Hydro
HRT-B
Current Habitat
Hydro ----->
Current Habitat
Subregion/SubbasinNatural Reproduction only
0.005
pNOB
Upper Salmon R Spring Chinook
Conservation
Hatchery
10%
19
None
0.8%
y
100%
y
0.8%
Current Habitat
Current Hydro
Contributing
181 181
0.010
2.5
100%
0.010
Harvest
Segregated Hatchery
0.1%
Ave
y
Contributing
1,000,189
HRT Alternative B
Conservation
Y
138
174
29%
0.080
pNOB
Cons
0.85
pHOS pNOB
SegHarv
39%
pHOS
0.083
0.050 0.080
0.020 0.080
0.005
0.020
0.050 0.050
0.020
1.46 1,500
1
0.0100.010
Y
0.34
Habitat ----->
185,524181
1,500
0.82
1.46 1,500
0.100
0.246
Recruits/Spawner
Current Harvest
Fitness? [Y / N]
52,744
0.005
18%
0.005
0.083
Int
Strays
55
Ave Ave
388
104
None
PNI 28%
None
pHOS-Realized
None
% to Nat. Spawn. 100%
pNOB-Goal
pHOSpNOB
y
100%
HSRG
None
pHOS-Goal
Int/Seg/Step/None
Smolt Release
None
27
0.8%
Current Habitat
0.1%
27
90%
HSRG Solution
1.46
28
0.246
0.100
0.0830.083
0.820.82
0.020 0.080
1,500
Y
Conservation
0.34
Contributing
HRT Alternative A
1,500
1
1.46
0.82
185,524
Integrated Hatchery + Supplementation
0.100
1.46
0.050
1,5001,500
0.080
0.080
0.010
185,524
1.00 0.34
1,500
y
1.00
% to Hatchery
Purpose
Export Goal/Realized
Cons/Harv/Both
Broodstock by Source
Brood Exported (from HOR Surplus)
Productivity (Adult)
Min NOR EscapeHabitatSmolt Productivity
28-Salmon_East Fork Salmon River Spring-
Summer Chinook
Y
185,524
Historic
37,500
1.46 1,500
37
1
0.020
0.34
1.46
0.020
HORs 0.010
1
181181
0.050
pHOS
0.050
0.083
0.005
0.246
pNOB
0.083
Hydro
Harvest
NORs
NORs
1.46Adjusted Productivity
NORs
Juv Passage Surv.
NORs
NORs HORs
HORs
0.010
HORs
0.005
HORs
0.010
0.080
0.080
0.100
24
24
0.8%
100%
Current Hydro
Current Harvest
Ave
y
0.246
pHOS
Current Hydro
Current Habitat
355
Ave
0.8%
Natural Reproduction only
1.46
Contributing
1
1,500
Y
0.82
No HatcheryCurrent
1.46 1,500 1,5001.46
51
2.5
All H Analyzer (AHA)
Harvest --->
Hatchery
-
0.20
0.40
0.60
0.80
1.00
- 0.20 0.40 0.60 0.80 1.00pNOB
pH
OS
.5
.9
.8
.7
.6
.4.3.2
PNI
.1
0
200
400
600
800
1,000
1,200
Ha
tch
ery
Ha
bita
t
Ma
rin
e
L. M
ain
ste
m
U.
Ma
inste
m
Te
rmin
al
0
200
400
600
800
1,000
1,200
Ha
tch
ery
Ha
bita
t
Ma
rin
e
L. M
ain
ste
m
U.
Ma
inste
m
Te
rmin
al
0
200
400
600
800
1,000
1,200
Ha
tch
ery
Ha
bita
t
Ma
rin
e
L.
Ma
inste
m
U.
Ma
inste
m
Te
rmin
al
0
200
400
600
800
1,000
1,200
Ha
tch
ery
Ha
bita
t
Ma
rin
e
L.
Ma
inste
m
U.
Ma
inste
m
Te
rmin
al
0
200
400
600
800
1,000
1,200
Ha
tch
ery
Ha
bita
t
Ma
rin
e
L. M
ain
ste
m
U.
Ma
inste
m
Te
rmin
al
Ha
tch
ery
Ha
bita
tM
ari
ne L.
U.
Te
rmin
al
Apply & Recalculate
Update

USFWS Columbia Basin Hatchery Review Team: Lower Snake Assessments and Recommendations Reports–March 2011
Appendix A – AHA Output 77
Table A52. AHA output for Yankee Fork spring Chinook. HRT Alternatives A and B represent small integrated conservation programs to
increase the overall recruit per spawner ratio for the population as a whole. Two different broodstock strategies are modeled.
Population (Ctrl + Page Up/Down to Scroll)Species/Race Population Management Intent:
Harv&Hatchery Strategy:
Population Recovery Designation:
Ad. Capacity
% Kelt
Sm. Capacity
Ocean Surv Baseline SAR Vary? (Y/N) 0.092 0.040 0.029 0.008 0.029 0.008 0.029 0.008 0.029 0.008 0.029 0.008
Adult Passage
Adj. Capacity
Harv - Marine
Harv - L. Mainstem
Harv - U. Mainstem
Harv -Terminal
Total Exploitation Rate
Broodstock Composition
Type
Local Imported 30 30
Destination for HOR Returns
Productivity of Hatchery Fish
457
7Realized Spawning Composition
Relative Hatchery Optimum -> 80 80 80 80 80
Weir Factor ->
Relative Reproductive Success (HOS) -> 80% 80% 80% 80% 80%
Initial Fitness Factor (A) -> 0.81 0.81 0.81 0.81 0.81
Fitness Factor after 100 generations (B) -> 0.50 1.00 0.50 0.85 0.69
Average Fitness Factor (100 Generations) -> 0.50 0.99 0.50 0.85 0.72
Generations until average fitness is reached -> 20 30 17 34 32
Minimum Hatchery Program (% of BS Goal) -> Effective pHOS -> 0.34 Effective pHOS -> Effective pHOS -> 0.46 Effective pHOS -> 0.40 Effective pHOS -> 0.41
"Fitness Floor" -> 0.5 pNOB -> pNOB -> pNOB -> pNOB -> 0.50 pNOB -> 0.26
Calculated Hatchery SAR ->
Calculated Natural SAR ->
Max Min Max Min Max Min Max Min Max Min
NOR Escapement 127 11 381 39 389 38 766 51 616 49
HoS Total Escapement (includes strays) 74 13 348 60 479 83 427 74
Conservation
Natural Reproduction only - Captive Rearing
0.010
1.45
0.010
74,210
0.34
1
Stabilizing
Patterns
Patterns shown here are assigned to the population from
the AHA or ROL file. Red cells indicate patterns are not
assigned to this population/scenario in the rollup
application. The shown pattern needs to be added to the
application, or a different pattern should be assigned to
this population in the ROL/AHA file.
Current Hydro
HRT-A
Current Hydro
HRT-B
Current Habitat
Hydro ----->
Current Habitat
Subregion/SubbasinNatural Reproduction only
0.005
pNOB
Upper Salmon R Spring Chinook
Conservation
Hatchery
75%
83
None
0.8%
y
100%
y
0.8%
Current Habitat
Current Hydro
Stabilizing
179 179
0.010
2.5
100%
0.010
Conservation
Integrated Hatchery + Supplementation
0.1%
Ave
y
Stabilizing
52,821
HRT Alternative B
Conservation
y
140
164
46%
0.080
pNOB
Cons
0.72
pHOS pNOB
IntCons
41%
pHOS
0.083
0.050 0.050
0.020 0.020
0.005
0.020
0.050 0.050
0.020
1.45 600
1
0.0100.010
y
0.34
Habitat ----->
74,210179
600
0.82
1.45 600
0.005
0.083
Recruits/Spawner
Current Harvest
Fitness? [Y / N]
52,744
0.005
0.5540%
50%
0.005
0.083
Int
Strays
108
Ave Ave
190
157
None
PNI 34%
None
pHOS-Realized
None
% to Nat. Spawn. 100%
pNOB-Goal
pHOSpNOB
y
100%
HSRG
None
pHOS-Goal
Int/Seg/Step/None
Smolt Release
None
114
0.8%
Current Habitat
0.1%
114
25%
HSRG Solution
1.45
81
0.246
0.100
0.0830.083
0.820.82
0.020 0.080
600
y
Conservation
0.34
Stabilizing
HRT Alternative A
600
1
1.45
0.82
74,210
Integrated Hatchery + Supplementation
0.100
1.45
0.050
600600
0.080
0.080
0.010
74,210
1.00 0.34
600
y
1.00
% to Hatchery
Purpose
Export Goal/Realized
Cons/Harv/Both
Broodstock by Source
Brood Exported (from HOR Surplus)
Productivity (Adult)
Min NOR EscapeHabitatSmolt Productivity
29-Salmon_Yankee Fork Spring Chinook
y
74,210
Historic
15,000
1.45 600
36
1
0.020
0.34
1.45
0.020
HORs 0.010
1
179179
0.050
pHOS
0.050
0.083
0.005
0.246
pNOB
0.083
Hydro
Harvest
NORs
NORs
1.45Adjusted Productivity
NORs
Juv Passage Surv.
NORs
NORs HORs
HORs
0.010
HORs
0.005
HORs
0.010
0.080
0.080
0.100
24
24
0.8%
100%
Current Hydro
Current Harvest
Ave
y
0.246
pHOS
Current Hydro
Current Habitat
139
Ave
0.8%
Natural Reproduction only - Captive Rearing
1.45
Stabilizing
1
600
y
0.82
No HatcheryCurrent
1.45 600 6001.45
38
2.5
All H Analyzer (AHA)
Harvest --->
Hatchery
-
0.20
0.40
0.60
0.80
1.00
- 0.20 0.40 0.60 0.80 1.00pNOB
pH
OS
.5
.9
.8
.7
.6
.4.3.2
PNI
.1
0
50
100
150
200
250
300
350
400
Ha
tch
ery
Ha
bita
t
Ma
rin
e
L. M
ain
ste
m
U.
Ma
inste
m
Te
rmin
al
0
50
100
150
200
250
300
350
400
Ha
tch
ery
Ha
bita
t
Ma
rin
e
L. M
ain
ste
m
U.
Ma
inste
m
Te
rmin
al
0
50
100
150
200
250
300
350
400
Ha
tch
ery
Ha
bita
t
Ma
rin
e
L.
Ma
inste
m
U.
Ma
inste
m
Te
rmin
al
0
50
100
150
200
250
300
350
400
Ha
tch
ery
Ha
bita
t
Ma
rin
e
L.
Ma
inste
m
U.
Ma
inste
m
Te
rmin
al
0
50
100
150
200
250
300
350
400
Ha
tch
ery
Ha
bita
t
Ma
rin
e
L. M
ain
ste
m
U.
Ma
inste
m
Te
rmin
al
Ha
tch
ery
Ha
bita
tM
ari
ne L.
U.
Te
rmin
al
Apply & Recalculate
Update

USFWS Columbia Basin Hatchery Review Team: Lower Snake Assessments and Recommendations Reports–March 2011
78 Appendix A – AHA Output
Table A53. AHA output for Valley Creek spring Chinook. HRT Alternative A represents a small, integrated conservation program, and HRT
Alternative B represents a large segregated program in partial support for achieving LSRCP mitigation goals.
Population (Ctrl + Page Up/Down to Scroll)Species/Race Population Management Intent:
Harv&Hatchery Strategy:
Population Recovery Designation:
Ad. Capacity
% Kelt
Sm. Capacity
Ocean Surv Baseline SAR Vary? (Y/N) 0.092 0.040 0.029 0.008 0.029 0.008 0.029 0.008 0.029 0.008 0.029 0.008
Adult Passage
Adj. Capacity
Harv - Marine
Harv - L. Mainstem
Harv - U. Mainstem
Harv -Terminal
Total Exploitation Rate
Broodstock Composition
Type
Local Imported 30 577
Destination for HOR Returns
Productivity of Hatchery Fish
537
8Realized Spawning Composition
Relative Hatchery Optimum -> 80 80 80 80 80
Weir Factor ->
Relative Reproductive Success (HOS) -> 80% 80% 80% 80% 80%
Initial Fitness Factor (A) -> 0.81 0.81 0.81 0.81 0.81
Fitness Factor after 100 generations (B) -> 0.50 1.00 0.50 0.92 0.50
Average Fitness Factor (100 Generations) -> 0.50 0.99 0.50 0.90 0.50
Generations until average fitness is reached -> 22 30 23 44 15
Minimum Hatchery Program (% of BS Goal) -> Effective pHOS -> 0.28 Effective pHOS -> Effective pHOS -> 0.28 Effective pHOS -> 0.25 Effective pHOS -> 0.63
"Fitness Floor" -> 0.5 pNOB -> pNOB -> pNOB -> pNOB -> 0.50 pNOB ->
Calculated Hatchery SAR ->
Calculated Natural SAR ->
Max Min Max Min Max Min Max Min Max Min
NOR Escapement 155 14 657 70 146 13 851 55 1,033 121
HoS Total Escapement (includes strays) 74 13 68 12 297 51 1,891 313
Conservation
Natural Reproduction only
0.010
1.55
0.010
98,946
0.34
1
Contributing
Patterns
Patterns shown here are assigned to the population from
the AHA or ROL file. Red cells indicate patterns are not
assigned to this population/scenario in the rollup
application. The shown pattern needs to be added to the
application, or a different pattern should be assigned to
this population in the ROL/AHA file.
Current Hydro
HRT-A
Current Hydro
HRT-B
Current Habitat
Hydro ----->
Current Habitat
Subregion/SubbasinNatural Reproduction only
0.005
pNOB
Upper Salmon R Spring Chinook
Conservation
Hatchery
50%
13
None
0.8%
y
100%
y
0.8%
Current Habitat
Current Hydro
Contributing
192 192
0.010
2.5
100%
0.010
Harvest
Segregated Hatchery
0.1%
Ave
y
Contributing
1,001,113
HRT Alternative B
Conservation
y
611
285
28%
0.080
pNOB
Cons
0.80
pHOS pNOB
SegHarv
63%
pHOS
0.083
0.050 0.080
0.020 0.080
0.005
0.020
0.050 0.050
0.020
1.55 800
1
0.0100.010
y
0.34
Habitat ----->
98,946192
800
0.82
1.55 800
0.100
0.246
Recruits/Spawner
Current Harvest
Fitness? [Y / N]
52,744
0.005
25%
0.005
0.083
Int
Strays
46
Ave Ave
228
97
None
PNI 28%
None
pHOS-Realized
None
% to Nat. Spawn. 100%
pNOB-Goal
pHOSpNOB
y
100%
HSRG
None
pHOS-Goal
Int/Seg/Step/None
Smolt Release
None
22
0.8%
Current Habitat
0.1%
22
50%
HSRG Solution
1.55
21
0.246
0.100
0.0830.083
0.820.82
0.020 0.080
800
y
Conservation
0.34
Contributing
HRT Alternative A
800
1
1.55
0.82
98,946
Integrated Hatchery
0.100
1.55
0.050
800800
0.080
0.080
0.010
98,946
1.00 0.34
800
y
1.00
% to Hatchery
Purpose
Export Goal/Realized
Cons/Harv/Both
Broodstock by Source
Brood Exported (from HOR Surplus)
Productivity (Adult)
Min NOR EscapeHabitatSmolt Productivity
30-Salmon_Valley Spring Chinook
y
98,946
Historic
20,000
1.55 800
39
1
0.020
0.34
1.55
0.020
HORs 0.010
1
192192
0.050
pHOS
0.050
0.083
0.005
0.246
pNOB
0.083
Hydro
Harvest
NORs
NORs
1.55Adjusted Productivity
NORs
Juv Passage Surv.
NORs
NORs HORs
HORs
0.010
HORs
0.005
HORs
0.010
0.080
0.080
0.100
24
24
0.8%
100%
Current Hydro
Current Harvest
Ave
y
0.246
pHOS
Current Hydro
Current Habitat
225
Ave
0.8%
Natural Reproduction only
1.55
Contributing
1
800
y
0.82
No HatcheryCurrent
1.55 800 8001.55
49
2.5
All H Analyzer (AHA)
Harvest --->
Hatchery
-
0.20
0.40
0.60
0.80
1.00
- 0.20 0.40 0.60 0.80 1.00pNOB
pH
OS
.5
.9
.8
.7
.6
.4.3.2
PNI
.1
0
100
200
300
400
500
600
700
800
900
1,000
Ha
tch
ery
Ha
bita
t
Ma
rin
e
L. M
ain
ste
m
U.
Ma
inste
m
Te
rmin
al
0
100
200
300
400
500
600
700
800
900
1,000
Ha
tch
ery
Ha
bita
t
Ma
rin
e
L. M
ain
ste
m
U.
Ma
inste
m
Te
rmin
al
0
100
200
300
400
500
600
700
800
900
1,000
Ha
tch
ery
Ha
bita
t
Ma
rin
e
L.
Ma
inste
m
U.
Ma
inste
m
Te
rmin
al
0
100
200
300
400
500
600
700
800
900
1,000
Ha
tch
ery
Ha
bita
t
Ma
rin
e
L.
Ma
inste
m
U.
Ma
inste
m
Te
rmin
al
0
100
200
300
400
500
600
700
800
900
1,000
Ha
tch
ery
Ha
bita
t
Ma
rin
e
L. M
ain
ste
m
U.
Ma
inste
m
Te
rmin
al
Ha
tch
ery
Ha
bita
tM
ari
ne L.
U.
Te
rmin
al
Apply & Recalculate
Update

USFWS Columbia Basin Hatchery Review Team: Lower Snake Assessments and Recommendations Reports–March 2011
Appendix A – AHA Output 79
Table A54. AHA output for upper Salmon River spring Chinook, including Sawtooth Hatchery, upstream from Redfish Lake Creek. HRT
Alternative A represents a large integrated program, and HRT Alternative B represents a two=stage stepping stone program.
Population (Ctrl + Page Up/Down to Scroll)Species/Race Population Management Intent:
Harv&Hatchery Strategy:
Population Recovery Designation:
Ad. Capacity
% Kelt
Sm. Capacity
Ocean Surv Baseline SAR Vary? (Y/N) 0.092 0.040 0.029 0.008 0.029 0.008 0.029 0.008 0.029 0.008 0.029 0.008
Adult Passage
Adj. Capacity
Harv - Marine
Harv - L. Mainstem
Harv - U. Mainstem
Harv -Terminal
Total Exploitation Rate
Broodstock Composition
Type
Local Imported 532 106 267 200
200 164
Destination for HOR Returns
Productivity of Hatchery Fish
456
9Realized Spawning Composition
Relative Hatchery Optimum -> 80 80 80 80 80
Weir Factor ->
Relative Reproductive Success (HOS) -> 80% 80% 80% 80% 80%
Initial Fitness Factor (A) -> 0.81 0.81 0.81 0.81 0.81
Fitness Factor after 100 generations (B) -> 0.50 1.00 0.85 0.61 0.66
Average Fitness Factor (100 Generations) -> 0.50 0.99 0.85 0.66 0.70
Generations until average fitness is reached -> 18 30 34 40 39
Minimum Hatchery Program (% of BS Goal) -> Effective pHOS -> 0.38 Effective pHOS -> Effective pHOS -> 0.27 Effective pHOS -> 0.50 Effective pHOS -> 0.40
"Fitness Floor" -> 0.5 pNOB -> pNOB -> pNOB -> 0.33 pNOB -> 0.26 pNOB -> 0.25
Calculated Hatchery SAR ->
Calculated Natural SAR ->
Max Min Max Min Max Min Max Min Max Min
NOR Escapement 1,134 110 1,897 209 2,003 147 1,555 12 1,316 35
HoS Total Escapement (includes strays) 755 130 740 128 1,366 237 864 150
Conservation
Integrated Hatchery
0.010
1.80
0.010
247,366
0.34
1
Primary
Patterns
Patterns shown here are assigned to the population from
the AHA or ROL file. Red cells indicate patterns are not
assigned to this population/scenario in the rollup
application. The shown pattern needs to be added to the
application, or a different pattern should be assigned to
this population in the ROL/AHA file.
Current Hydro
HRT-A
Current Hydro
HRT-B
Current Habitat
Hydro ----->
Current Habitat
Subregion/SubbasinNatural Reproduction only
67%
0.080
pNOB
Upper Salmon R Spring Chinook
Harvest and Conservation
Hatchery
0.72
50%
47
Cons
199,393
0.8%
y
75%
y
0.8%
Current Habitat
Current Hydro
Primary
223 223
0.010
2.5
50%
0.010
Harvest and Conservation
Stepping Stone - Integrated Hatchery
0.1%
Ave
y
Primary
376,320
HRT Alternative B
Conservation
y
283
334
27%
0.050
pNOB
Both
0.50
pHOS pNOB
StepCons
40%
pHOS
0.246
0.050 0.050
0.020 0.020
0.080
0.020
0.080 0.050
0.080
1.80 2,000
1
0.0100.010
y
0.34
Habitat ----->
0.1%
247,366223
2,000
0.82
1.80 2,000
0.080
0.152
Recruits/Spawner
0.1%
Current Harvest
2.0Fitness? [Y / N]
499,207
0.080
50%
50%
0.100
0.152
Int
Strays
533
Ave Ave
352
445
None
PNI 38%
Seg
pHOS-Realized
None
% to Nat. Spawn. 75% 50%
pNOB-Goal
pHOSpNOB
2.5
50%
y
100%
HSRG
Harv
pHOS-Goal
1,001,011
Int/Seg/Step/None
Smolt Release
Int
117
0.8%
Current Habitat
0.1%
242
50%
HSRG Solution
1.80
26
25%
0.152
0.080
0.1520.152
0.820.82
0.020 0.020
2,000
y
Harvest and Conservation
0.34
Primary
HRT Alternative A
2,000
1
1.80
0.82
247,366
Integrated Hatchery
0.100
1.80
0.050
2,0002,000
0.080
0.080
0.010
247,366
1.00 0.34
2,000
y
1.00
% to Hatchery
Purpose
Export Goal/Realized
Cons/Harv/Both
Broodstock by Source
Brood Exported (from HOR Surplus)
Productivity (Adult)
Min NOR EscapeHabitatSmolt Productivity
31-Salmon_Upper Salmon Mainstem Spring
Chinook
y
247,366
Historic
50,000
1.80 2,000
45
1
0.020
0.34
1.80
0.020
HORs 0.010
1
223223
0.050
pHOS
0.050
0.152
0.080
0.246
pNOB
0.152
Hydro
Harvest
NORs
NORs
1.80Adjusted Productivity
NORs
Juv Passage Surv.
NORs
NORs HORs
HORs
0.010
HORs
0.080
HORs
0.010
0.080
0.080
0.100
247
23
0.8%
25%
Current Hydro
Current Harvest
Ave
y
0.246
pHOS
Current Hydro
Current Habitat
615
Ave
0.8%
Segregated Hatchery
1.80
Primary
1
2,000
y
0.82
No HatcheryCurrent
1.80 2,000 2,0001.80
322
2.5
All H Analyzer (AHA)
Harvest --->
Hatchery
-
0.20
0.40
0.60
0.80
1.00
- 0.20 0.40 0.60 0.80 1.00pNOB
pH
OS
.5
.9
.8
.7
.6
.4.3.2
PNI
.1
0
100
200
300
400
500
600
700
800
900
Ha
tch
ery
Ha
bita
t
Ma
rin
e
L. M
ain
ste
m
U.
Ma
inste
m
Te
rmin
al
0
100
200
300
400
500
600
700
800
900
Ha
tch
ery
Ha
bita
t
Ma
rin
e
L. M
ain
ste
m
U.
Ma
inste
m
Te
rmin
al
0
100
200
300
400
500
600
700
800
900
Ha
tch
ery
Ha
bita
t
Ma
rin
e
L.
Ma
inste
m
U.
Ma
inste
m
Te
rmin
al
0
100
200
300
400
500
600
700
800
900
Ha
tch
ery
Ha
bita
t
Ma
rin
e
L.
Ma
inste
m
U.
Ma
inste
m
Te
rmin
al
0
100
200
300
400
500
600
700
800
900
Ha
tch
ery
Ha
bita
t
Ma
rin
e
L. M
ain
ste
m
U.
Ma
inste
m
Te
rmin
al
Ha
tch
ery
Ha
bita
tM
ari
ne L.
U.
Te
rmin
al
Apply & Recalculate
Update

USFWS Columbia Basin Hatchery Review Team: Lower Snake Assessments and Recommendations Reports–March 2011
80 Appendix A – AHA Output
Table A55. AHA output for segregated broodstock portions of Sawtooth Hatchery spring Chinook. The HSRG proposed separate integrated
and segregated programs. The HRT proposed coupling these programs as a two-stage stepping stone program (HRT Alternative B).
Population (Ctrl + Page Up/Down to Scroll)Species/Race Population Management Intent:
Harv&Hatchery Strategy:
Population Recovery Designation:
Ad. Capacity
% Kelt
Sm. Capacity
Ocean Surv Baseline SAR Vary? (Y/N) 0.092 0.040 0.029 0.008 0.029 0.008 0.029 0.008 0.029 0.008 0.029 0.008
Adult Passage
Adj. Capacity
Harv - Marine
Harv - L. Mainstem
Harv - U. Mainstem
Harv -Terminal
Total Exploitation Rate
Broodstock Composition
Type
Local Imported 638 200
Destination for HOR Returns
Productivity of Hatchery Fish
788
10Realized Spawning Composition
Relative Hatchery Optimum -> 80 80 80 80 80
Weir Factor ->
Relative Reproductive Success (HOS) -> 80% 80% 80% 80% 80%
Initial Fitness Factor (A) -> 0.81 0.81 0.81 0.81 0.81
Fitness Factor after 100 generations (B) -> 1.00 1.00 0.19 1.00 0.19
Average Fitness Factor (100 Generations) -> 0.99 0.99 0.24 0.99 0.24
Generations until average fitness is reached -> 30 30 43 30 43
Minimum Hatchery Program (% of BS Goal) -> Effective pHOS -> Effective pHOS -> Effective pHOS -> 1.00 Effective pHOS -> Effective pHOS -> 1.00
"Fitness Floor" -> pNOB -> pNOB -> pNOB -> pNOB -> pNOB ->
Calculated Hatchery SAR ->
Calculated Natural SAR ->
Max Min Max Min Max Min Max Min Max Min
NOR Escapement 0 0 0 0 0 0 0 0 0 0
HoS Total Escapement (includes strays) 1,024 177 321 55
Harvest
Segregated Hatchery
0.010
0.00
0.010
1
0.34
1
N/A
Patterns
Patterns shown here are assigned to the population from
the AHA or ROL file. Red cells indicate patterns are not
assigned to this population/scenario in the rollup
application. The shown pattern needs to be added to the
application, or a different pattern should be assigned to
this population in the ROL/AHA file.
Current Hydro
HRT-A
Current Hydro
HRT-B
Current Habitat
Hydro ----->
Current Habitat
Subregion/SubbasinNatural Reproduction only
0.080
pNOB
Upper Salmon R Spring Chinook
Harvest and Conservation
Hatchery
25%
Harv
1,200,461
0.8%
y
100%
y
0.8%
Current Habitat
Current Hydro
N/A
0 0
0.010 0.010
Harvest
Stepping Stone Segregated Hatchery
0.1%
Ave
y
N/A
376,320
HRT Alternative B
Conservation
y
105
0
100%
0.080
pNOB
Both
1.00
pHOS pNOB
StepHarv
100%
pHOS
0.246
0.050 0.080
0.020 0.080
0.080
0.020
0.080 0.050
0.080
0.00 0
1
0.0100.010
y
0.34
Habitat ----->
10
0
0.82
0.00 0
0.100
0.246
Recruits/Spawner
0.1%
Current Harvest
Fitness? [Y / N]
0.0800.100
0.152
Int
Strays
0
Ave Ave
0
None
PNI
Seg
pHOS-Realized
None
% to Nat. Spawn. 25%
pNOB-Goal
pHOSpNOB
2.5
75%
y
100%
HSRG
Both
pHOS-Goal
Int/Seg/Step/None
Smolt Release
Seg
0.8%
Current Habitat
335
75%
HSRG Solution
0.00
0.246
0.100
0.1520.152
0.820.82
0.020 0.080
0
y
Harvest and Conservation
0.34
N/A
HRT Alternative A
0
1
0.00
0.82
1
Integrated Hatchery
0.100
0.00
0.050
00
0.080
0.080
0.010
1
1.00 0.34
0
y
1.00
% to Hatchery
Purpose
Export Goal/Realized
Cons/Harv/Both
Broodstock by Source
Brood Exported (from HOR Surplus)
Productivity (Adult)
Min NOR EscapeHabitatSmolt Productivity
31A-Salmon_Upper Salmon Mainstem
Spring Chinook (Sawtooth Hatchery)
y
1
Historic
0
0.00 0
0
1
0.020
0.34
0.00
0.020
HORs 0.010
1
00
0.050
pHOS
0.050
0.152
0.080
0.246
pNOB
0.152
Hydro
Harvest
NORs
NORs
0.00Adjusted Productivity
NORs
Juv Passage Surv.
NORs
NORs HORs
HORs
0.010
HORs
0.080
HORs
0.010
0.080
0.080
0.100
0.8%
100%
Current Hydro
Current Harvest
Ave
y
0.246
pHOS
Current Hydro
Current Habitat
0
Ave
0.8%
Segregated Hatchery
0.00
N/A
1
0
y
0.82
No HatcheryCurrent
0.00 0 00.00
0
2.5
All H Analyzer (AHA)
Harvest --->
Hatchery
-
0.20
0.40
0.60
0.80
1.00
- 0.20 0.40 0.60 0.80 1.00pNOB
pH
OS
.5
.9
.8
.7
.6
.4.3.2
PNI
.1
0
200
400
600
800
1,000
1,200
Ha
tch
ery
Ha
bita
t
Ma
rin
e
L. M
ain
ste
m
U.
Ma
inste
m
Te
rmin
al
0
200
400
600
800
1,000
1,200
Ha
tch
ery
Ha
bita
t
Ma
rin
e
L. M
ain
ste
m
U.
Ma
inste
m
Te
rmin
al
0
200
400
600
800
1,000
1,200
Ha
tch
ery
Ha
bita
t
Ma
rin
e
L.
Ma
inste
m
U.
Ma
inste
m
Te
rmin
al
0
200
400
600
800
1,000
1,200
Ha
tch
ery
Ha
bita
t
Ma
rin
e
L.
Ma
inste
m
U.
Ma
inste
m
Te
rmin
al
0
200
400
600
800
1,000
1,200
Ha
tch
ery
Ha
bita
t
Ma
rin
e
L. M
ain
ste
m
U.
Ma
inste
m
Te
rmin
al
Ha
tch
ery
Ha
bita
tM
ari
ne L.
U.
Te
rmin
al
Apply & Recalculate
Update
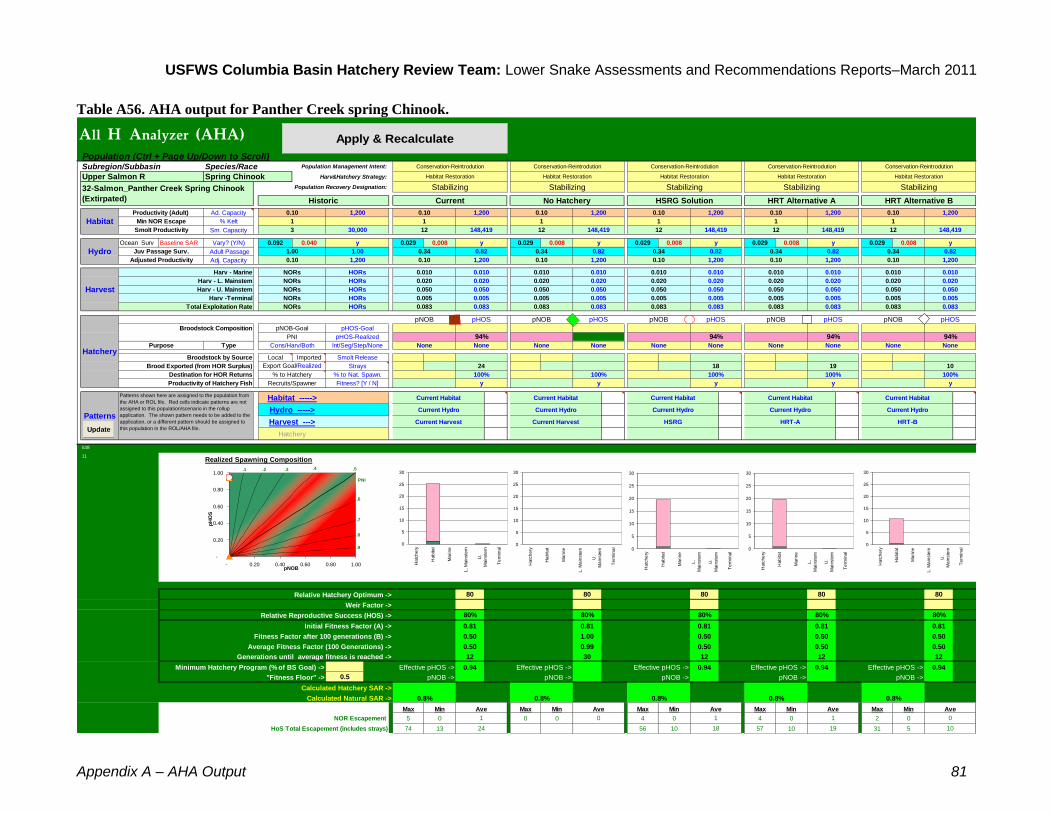
USFWS Columbia Basin Hatchery Review Team: Lower Snake Assessments and Recommendations Reports–March 2011
Appendix A – AHA Output 81
Table A56. AHA output for Panther Creek spring Chinook.
Population (Ctrl + Page Up/Down to Scroll)Species/Race Population Management Intent:
Harv&Hatchery Strategy:
Population Recovery Designation:
Ad. Capacity
% Kelt
Sm. Capacity
Ocean Surv Baseline SAR Vary? (Y/N) 0.092 0.040 0.029 0.008 0.029 0.008 0.029 0.008 0.029 0.008 0.029 0.008
Adult Passage
Adj. Capacity
Harv - Marine
Harv - L. Mainstem
Harv - U. Mainstem
Harv -Terminal
Total Exploitation Rate
Broodstock Composition
Type
Local Imported
Destination for HOR Returns
Productivity of Hatchery Fish
538
11Realized Spawning Composition
Relative Hatchery Optimum -> 80 80 80 80 80
Weir Factor ->
Relative Reproductive Success (HOS) -> 80% 80% 80% 80% 80%
Initial Fitness Factor (A) -> 0.81 0.81 0.81 0.81 0.81
Fitness Factor after 100 generations (B) -> 0.50 1.00 0.50 0.50 0.50
Average Fitness Factor (100 Generations) -> 0.50 0.99 0.50 0.50 0.50
Generations until average fitness is reached -> 12 30 12 12 12
Minimum Hatchery Program (% of BS Goal) -> Effective pHOS -> 0.94 Effective pHOS -> Effective pHOS -> 0.94 Effective pHOS -> 0.94 Effective pHOS -> 0.94
"Fitness Floor" -> 0.5 pNOB -> pNOB -> pNOB -> pNOB -> pNOB ->
Calculated Hatchery SAR ->
Calculated Natural SAR ->
Max Min Max Min Max Min Max Min Max Min
NOR Escapement 5 0 0 0 4 0 4 0 2 0
HoS Total Escapement (includes strays) 74 13 56 10 57 10 31 5
Conservation-Reintrodution
Habitat Restoration
0.010
0.10
0.010
148,419
0.34
1
Stabilizing
Patterns
Patterns shown here are assigned to the population from
the AHA or ROL file. Red cells indicate patterns are not
assigned to this population/scenario in the rollup
application. The shown pattern needs to be added to the
application, or a different pattern should be assigned to
this population in the ROL/AHA file.
Current Hydro
HRT-A
Current Hydro
HRT-B
Current Habitat
Hydro ----->
Current Habitat
Subregion/SubbasinHabitat Restoration
0.005
pNOB
Upper Salmon R Spring Chinook
Conservation-Reintrodution
Hatchery
100%
10
None
0.8%
y
100%
y
0.8%
Current Habitat
Current Hydro
Stabilizing
12 12
0.010 0.010
Conservation-Reintrodution
Habitat Restoration
Ave
y
Stabilizing
HRT Alternative B
Conservation-Reintrodution
y
10
0
94%
0.050
pNOB
None
pHOS pNOB
NoneNone
94%
pHOS
0.083
0.050 0.050
0.020 0.020
0.005
0.020
0.050 0.050
0.020
0.10 1,200
1
0.0100.010
y
0.34
Habitat ----->
148,41912
1,200
0.82
0.10 1,200
0.005
0.083
Recruits/Spawner
Current Harvest
Fitness? [Y / N]
0.005
94%
0.005
0.083
None
Strays
1
Ave Ave
1
19
None
PNI 94%
None
pHOS-Realized
None
% to Nat. Spawn. 100%
pNOB-Goal
pHOSpNOB
y
100%
HSRG
None
pHOS-Goal
Int/Seg/Step/None
Smolt Release
None
18
0.8%
Current Habitat
18
HSRG Solution
0.10
19
0.083
0.005
0.0830.083
0.820.82
0.020 0.020
1,200
y
Conservation-Reintrodution
0.34
Stabilizing
HRT Alternative A
1,200
1
0.10
0.82
148,419
Habitat Restoration
0.005
0.10
0.050
1,2001,200
0.020
0.050
0.010
148,419
1.00 0.34
1,200
y
1.00
% to Hatchery
Purpose
Export Goal/Realized
Cons/Harv/Both
Broodstock by Source
Brood Exported (from HOR Surplus)
Productivity (Adult)
Min NOR EscapeHabitatSmolt Productivity
32-Salmon_Panther Creek Spring Chinook
(Extirpated)
y
148,419
Historic
30,000
0.10 1,200
3
1
0.020
0.34
0.10
0.020
HORs 0.010
1
1212
0.050
pHOS
0.050
0.083
0.005
0.083
pNOB
0.083
Hydro
Harvest
NORs
NORs
0.10Adjusted Productivity
NORs
Juv Passage Surv.
NORs
NORs HORs
HORs
0.010
HORs
0.005
HORs
0.010
0.050
0.020
0.005
24
24
0.8%
100%
Current Hydro
Current Harvest
Ave
y
0.083
pHOS
Current Hydro
Current Habitat
0
Ave
0.8%
Habitat Restoration
0.10
Stabilizing
1
1,200
y
0.82
No HatcheryCurrent
0.10 1,200 1,2000.10
1
All H Analyzer (AHA)
Harvest --->
Hatchery
-
0.20
0.40
0.60
0.80
1.00
- 0.20 0.40 0.60 0.80 1.00pNOB
pH
OS
.5
.9
.8
.7
.6
.4.3.2
PNI
.1
0
5
10
15
20
25
30
Ha
tch
ery
Ha
bita
t
Ma
rin
e
L. M
ain
ste
m
U.
Ma
inste
m
Te
rmin
al
0
5
10
15
20
25
30
Ha
tch
ery
Ha
bita
t
Ma
rin
e
L. M
ain
ste
m
U.
Ma
inste
m
Te
rmin
al
0
5
10
15
20
25
30
Ha
tch
ery
Ha
bita
t
Ma
rin
e
L.
Ma
inste
m
U.
Ma
inste
m
Te
rmin
al
0
5
10
15
20
25
30
Ha
tch
ery
Ha
bita
t
Ma
rin
e
L.
Ma
inste
m
U.
Ma
inste
m
Te
rmin
al
0
5
10
15
20
25
30
Ha
tch
ery
Ha
bita
t
Ma
rin
e
L. M
ain
ste
m
U.
Ma
inste
m
Te
rmin
al
Ha
tch
ery
Ha
bita
tM
ari
ne L.
U.
Te
rmin
al
Apply & Recalculate
Update

Pacific Region Fishery Resources 911 NE 11
th Avenue
Portland, OR 97232 503/872.2763 E-Mail: [email protected] U.S. Fish and Wildlife Service www.fws.gov For Columbia River Basin Hatchery Review Information www.fws.gov/pacific/Fisheries/Hatcheryreview/ The mission of the U.S. Fish and Wildlife Service is working with others to conserve, protect and enhance fish, wildlife, plants and their habitats for the continuing benefit of the American people. March 2011