(12) United States Patent (10) Patent No.: US 7,839,022 B2 ...

(12) United States Patent
USOO7750843B2
(10) Patent No.: US 7,750,843 B2 Ray et al. (45) Date of Patent: Jul. 6, 2010
(54) WEAKSIGNAL ACQUISITION 6,680,695 B2 1/2004 Turetzky et al. 2002/0050944 A1* 5/2002 Sheynblat et al. ...... 342,357.06
(75) Inventors: Jayanta Kumar Ray, Bangalore (IN); 2002/0064209 A1* 5/2002 Turetzky et al.............. 375,142 Nagaraj Shivaramaiah 2004/01961.83 A1* 10, 2004 Roh ...................... 342,357. 12 Channarayapatna, Bangalore (IN); Sameet Mangesh Deshpande, Bangalore (IN)
(73) Assignee: Accord Software & Systems Pvt. Ltd, Bangalore, Karnataka (IN)
(*) Notice: Subject to any disclaimer, the term of this patent is extended or adjusted under 35 U.S.C. 154(b) by 0 days.
(21) Appl. No.: 11/439,103
(22) Filed: May 23, 2006
(65) Prior Publication Data
US 2007/OO85736A1 Apr. 19, 2007
(30) Foreign Application Priority Data Oct. 14, 2005 (IN) ........................ 1478/CHFA2005
(51) Int. Cl. GOIS I/O (2006.01)
(52) U.S. Cl. ................................................. 342/357.02 (58) Field of Classification Search ................................
342/357.01 357.17 See application file for complete search history.
(56) References Cited
U.S. PATENT DOCUMENTS
6,236,354 B1 5, 2001 Krasner
2005/OO32513 A1 2/2005 Norman et al.
2008/0316096 A1* 12/2008 Bochkovskiyet al. .. 342/357. 12
* cited by examiner Primary Examiner Thomas H Tarcza Assistant Examiner Nga X Nguyen (74) Attorney, Agent, or Firm Ashok Tankha; IP Legal Services
(57) ABSTRACT
A method for acquisition of a weak signal from a satellite in the presence of a strong interfering signal from another sat ellite is disclosed. The method encompasses identifying the auto-correlation peak due to the weak satellite signal from the cross correlation peaks due to the strong satellite signal. This invention presents a method and apparatus of acquiring a weak satellite signal in the presence of a strong interfering satellite signal in a receiver by two techniques, namely, the millisecond boundary correlation histogram method, and the frequency response correlation histogram method. Both the techniques distinguish between the correlation characteris tics for auto-correlation and cross-correlation. The apparatus presented in the invention implements the methods of weak satellite signal acquisition in presence of a strong interfering satellite signal in a pseudorandom noise (PRN) receiver.
12 Claims, 11 Drawing Sheets
301
DENTFY THESTRONG SATELLTESIGNAL THAT CAUSESCROSS CORRELATON
DETERMNEMLLSECOND BOUNDARY CORRELATION HISTOGRAM
SATELLTESIGNAL WTTH THENCOMINGSIGNAL
INTEGRATE CORRELATION WALUES STARTING FROM
CORRELATE LOCALLY GENERATED CODE OF STRONG
DFFERENTMLLISECON BOUNDARES FORNAVIGATION DATA BIT TO GENERATE THE CORRELATONHSTOGRAM
/ 302
CORRELATE AND INTEGRATE LOCALLY GENERATE CODE OF WEAKSIGNAL WITH THENCOMINGSIGNALATPREDEFINED CODE
DELAYS FORAN EXTENDED PERIOD
IDENTFY THE AUTO-CORRELATION PEAK AND CROSS CORRELATION PEAKS AND CHP DELAYS AT WHCH THOSE PEAKS
OCCUR
EDETERMNEMLLESECON BONARY CORRELATION HISTOGRAM FOR NAVIGATION DATABITATEACH OF THOSE CHP DELAYS WHERE AUTO-CORREATION AND CROSS-CORRELATON
PEAKSOCCUR
35
306
30

U.S. Patent Jul. 6, 2010 Sheet 1 of 11 US 7,750,843 B2
100
RADIO FREQUENCY (RF) DOWN CONVERTER
CHIP FREQUENCY TIME MULTIPLEXED CORRELATOR
103 104
CARRIER MIXER CORRELATOR
ACCUMULATOR DETECTOR
105 106
NAVIGATION PROCESSOR
FIGURE 1

U.S. Patent Jul. 6, 2010 Sheet 3 of 11 US 7,750,843 B2
301
DENTFY THE STRONG SATELLITE SIGNAL THAT CAUSES CROSS CORRELATON
DETERMINE MLLISECOND BOUNDARY CORRELATION HISTOGRAM
CORRELATE LOCALLY GENERATED CODE OF STRONG 302 SATELLITE SIGNAL WITH THE ENCOMING SIGNAL
INTEGRATE CORRELATION VALUES STARTING FROM DFFERENTMLLISECOND BOUNDARES FOR NAVIGATION DATA BIT TO GENERATE THE CORRELATION HISTOGRAM
305
CORRELATE AND INTEGRATE LOCALLY GENERATED CODE OF WEAK SIGNAL WITH THE INCOMING SIGNAL AT PREDEFINED CODE
DELAYS FOR AN EXTENDED PERIOD
306 IDENTFY THE AUTO-CORRELATION PEAK AND CROSS
CORRELATION PEAKS AND CHIP DELAYS AT WHICH THOSE PEAKS OCCUR
307 DETERMINE MILLESECOND BOUNDARY CORRELATION
HISTOGRAM FOR NAVIGATION DATABITATEACH OF THOSE CHIP DELAYS WHERE AUTO-CORRELATION AND CROSS-CORRELATION
PEAKS OCCUR
IDENTIFY THE UNIQUE CORRELATION HISTOGRAM
FIGURE 3A
308
U.S. Patent Jul. 6, 2010 Sheet 4 of 11 US 7,750,843 B2
x 10
O 2 4. 6 8 1O 12 14 16 18 2O
MILLISECOND DATA BIT BOUNDARY
FIGURE 3B

U.S. Patent Jul. 6, 2010 Sheet 5 of 11 US 7,750,843 B2
x 10'
S.
55 4. 5
240 245 2SO 2S5 28O S5 2O 27.75
CHP DELAY
FIGURE 3C

U.S. Patent Jul. 6, 2010 Sheet 6 of 11 US 7,750,843 B2
x 10'
5.8
5.5. 4.6 5 2
O 2 4. 6 8 1O 12 14 16 18 2
MILLISECOND DATA BIT BOUNDARY
FIGURE 3D

U.S. Patent Jul. 6, 2010 Sheet 7 of 11 US 7,750,843 B2
401
IDENTIFY THE STRONG SATELLITE SIGNAL
DETERMINE FREQUENCY RESPONSE CORRELATION HISTOGRAM OF THE STRONG SIGNAL
CORRELATE LOCALLY GENERATED CODE OF STRONG SATELLITE SIGNAL AND MIX LOCALLY GENERATED 42 CARRIER WITH A HIGH FREQUENCY RESOLUTION AROUND THE TRACKING FREQUENCY WITH THE
NCOMING SIGNAL
INTEGRATE CORRELATION VALUES FOREACH LOCALLY GENERATED CARRIER FREQUENCIES AROUND
THE TRACKING FREQUENCY
4S CORRELATE AND INTEGRATE LOCALLY GENERATED CODE OF WEAK SIGNAL WITH THE INCOMING SIGNAL AT PREDEFINED
CODE DELAYS
406
DENTFY AUTO-CORRELATION PEAK AND CROSS-CORRELATION PEAKS AND CHP DELAYS AT WHICH THOSE PEAKS OCCUR
407 DETERMINE FREQUENCY RESPONSE CORRELATION HISTOGRAM ATEACH CHP DELAY WHERE AUTO-CORRELATION AND CROSS
CORRELATION PEAKS OCCUR
408
IDENTIFY THE UNIQUE FREQUENCY RESPONSE CORRELATION HISTOGRAM
FIGURE 4A


U.S. Patent Jul. 6, 2010 Sheet 9 of 11 US 7,750,843 B2
45OO
3500
3OOO
25OO
2OOO
1SO
OOO
500
x 10(Hz) 2 3 4. S S 8 9
FREQUENCY BIN
FIGURE 4C

U.S. Patent Jul. 6, 2010 Sheet 10 of 11 US 7,750,843 B2
65
5. 56 5
45
1 2 3 4. 5 6 8 9
FREQUENCY BIN
FIGURE 4D

U.S. Patent Jul. 6, 2010 Sheet 11 of 11 US 7,750,843 B2
SO1
PERFORM FREQUENCY RESPONSE CORRELATION HISTOGRAM METHOD
502
1S THE WEAKSIGNALN YES PEAK DENTIFIED2
PERFORM MLLISECOND BOUNDARY CORRELATION HISTOGRAMMETHOD
IS THE WEAK SIGNAL PEAK DENTIFIED2
FIGURES

US 7,750,843 B2 1.
WEAKSIGNAL ACQUISITION
BACKGROUND OF THE INVENTION
The invention disclosed herein, in general, relates to a pseudorandom noise receiver and specifically relates to a method of differentiating between an auto-correlated weak signal and a cross-correlated product of weak and strong signals in a receiver used in global positioning system (GPS). GPS satellites transmit signals to a universal receiver with
a unique code called the coarse acquisition (C/A) code. The C/A code belongs to the family of gold code having a code length of 1023 chips. Signals from the satellites are coded with gold codes and transmitted at a chip rate of 1.023 MHz, with a period of 1 millisecond, with the code repeating every millisecond. Each satellite has a unique code for reception at the receiver. In correlation techniques, the incoming satellite signal is multiplied with a locally generated code. For example, the incoming satellite signal comprises a carrier of 1575.42 MHz, navigation data bits of 50 Hz and a coarse acquisition (C/A) code of 1.023 MHz.
Consider a case where the incoming signal from the satel lite in a GPS receiver comprises a mix of weak and strong signals and where the weak signal is the desired signal and the strong signal is non-desired signal. There is a need to accu rately differentiate between an auto-correlated weak signal and a cross-correlated product of weak and strong signals in a global positioning systems receiver. Interferences from the undesirable strong signals result in loss of valuable data trans mitted from the satellite.
SUMMARY OF THE INVENTION
The proposed invention provides a method and an appara tus to detect a weak pseudorandom noise (PRN) signal in the presence of a strong PRN signal, where the weak signal is partially masked by the strong signal in a PRN receiver. The proposed invention uses a special chip-frequency-time mul tiplexed (CFT) correlator for identification of the auto-corre lation peak due to the weak satellite signal from the cross correlation peaks due to the strong satellite signal by employing two techniques, namely the millisecond boundary correlation histogram method, and the frequency response correlation histogram method. The two methods can be used independently or in parallel to increase the efficiency of the receiver, so that even if one method fails, the other method yields the desired results.
The proposed invention uses an apparatus that employs the above-mentioned techniques for weak signal acquisition is a PRN ranging GPS receiver. The PRN ranging receiver con sists of a radio frequency (RF) front end, a chip-frequency time multiplexed (CFT) correlator and individually program mable large correlator and an embedded processor. The CFT correlator provides multiple correlation peaks within the code chip delay search range, and also allows an increase in the signal integration period dynamically, thereby enabling weak signal detection using the aforesaid techniques. This archi tecture of the GPS receiver is suitable for a variety of appli cations including E-911 and car navigation, for reliable signal acquisition in indoor and other constrained environments.
In the millisecond boundary correlation histogram method, the strong satellite signal that causes cross correlation is first identified. The incoming GPS signal is correlated with the locally generated code for the satellite, corresponding to the strong signal, and a millisecond boundary correlation histo gram plot is drawn. Then, the locally generated code repre senting the weak satellite signal is correlated with the incom
5
10
15
25
30
35
40
45
50
55
60
65
2 ing GPS signal at the search range code delays and integrated over an extended period of time, until the auto-correlation peak and the cross-correlation peaks stand out from the noise. Subsequently, millisecond boundary correlation histograms are plotted at each chip delay where auto-correlation or cross correlation peaks occur. One plot amongst the multiple his tograms has a unique slope characteristic compared to the remaining histograms. This unique histogram represents the auto-correlation peak.
In the frequency response correlation histogram method, the signal with higher signal strength is identified as the strong satellite signal. A frequency response correlation his togram is generated for the strong satellite signal by beating the local code and the local carrier against the incoming GPS signal, wherein the local carrier frequency is varied around the tracking frequency in Small steps. Then, the locally gen erated code for the weak signal is correlated with the incom ing GPS signal at predefined code delays and integrated over an extended period of time, until the auto-correlation peak and cross-correlation peaks stand out from the noise. Subse quently, the frequency response correlation histogram is gen erated for each chip delay in which auto-correlation or cross correlation peaks occur. One plot amongst the multiple fre quency response correlation histograms has a unique charac teristic compared to the remaining histograms, which repre sents the auto-correlation peak.
This invention allows detection of a weak signal when it is partially masked by a strong signal and provides an effective Solution for weak signal acquisition even when the weak and the strong signals arrive at the GPS receiver at the same Doppler frequency. The method disclosed herein also searches for progres
sively weaker and weaker signals by continuous integration and peak examination, without discarding the prior data, thereby improving the search efficiency for weak signal acquisition in the GPS receiver.
Also, in order to set the duration of integration in the correlation process, the CFT correlator does not require any knowledge of the approximate signal strength of a pseudo random noise (PRN) signal. Hence, the technique of milli second boundary correlation histogram method and fre quency response correlation histogram method disclosed herein are not affected by dynamic variations in the signal strength during signal acquisition at the GPS receiver.
BRIEF DESCRIPTION OF DRAWINGS
FIG. 1 illustrates the block diagram of a pseudorandom noise receiver (PRN receiver).
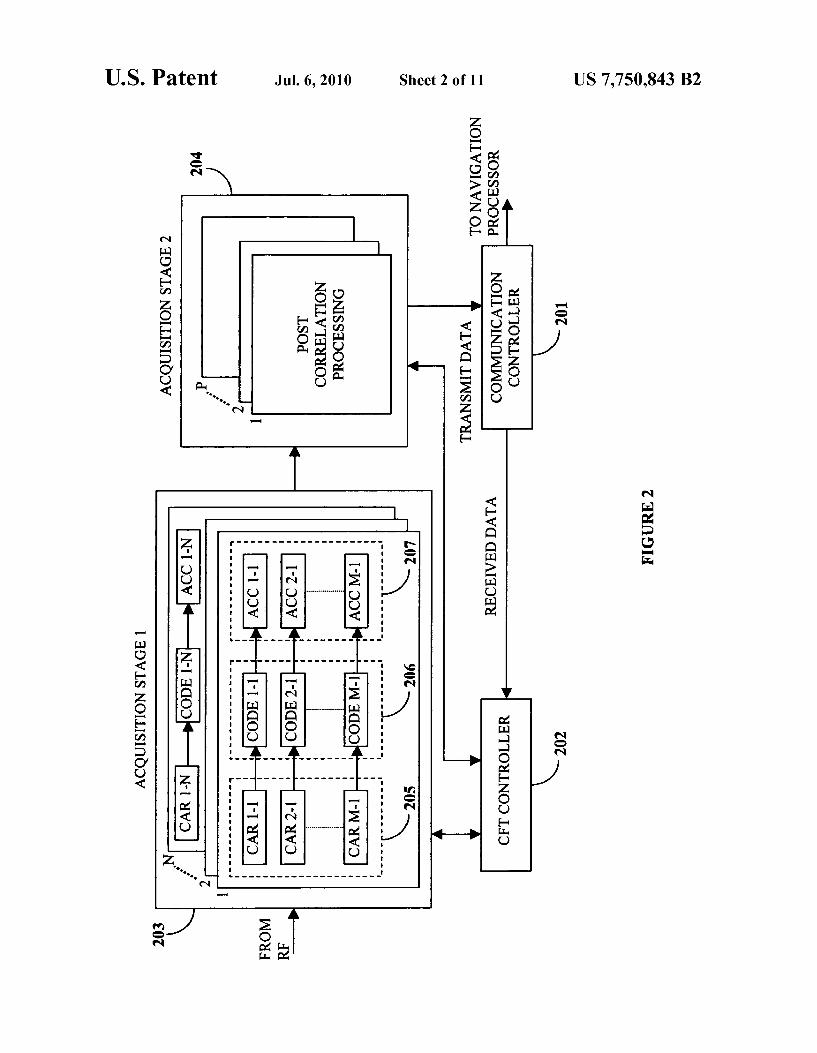
FIG. 2 illustrates a block diagram of the chip frequency timing (CFT) correlator.
FIG. 3A illustrates the millisecond boundary correlation histogram method for the acquisition of a weak satellite sig nal in a GPS receiver in the presence of a strong interfering satellite signal.
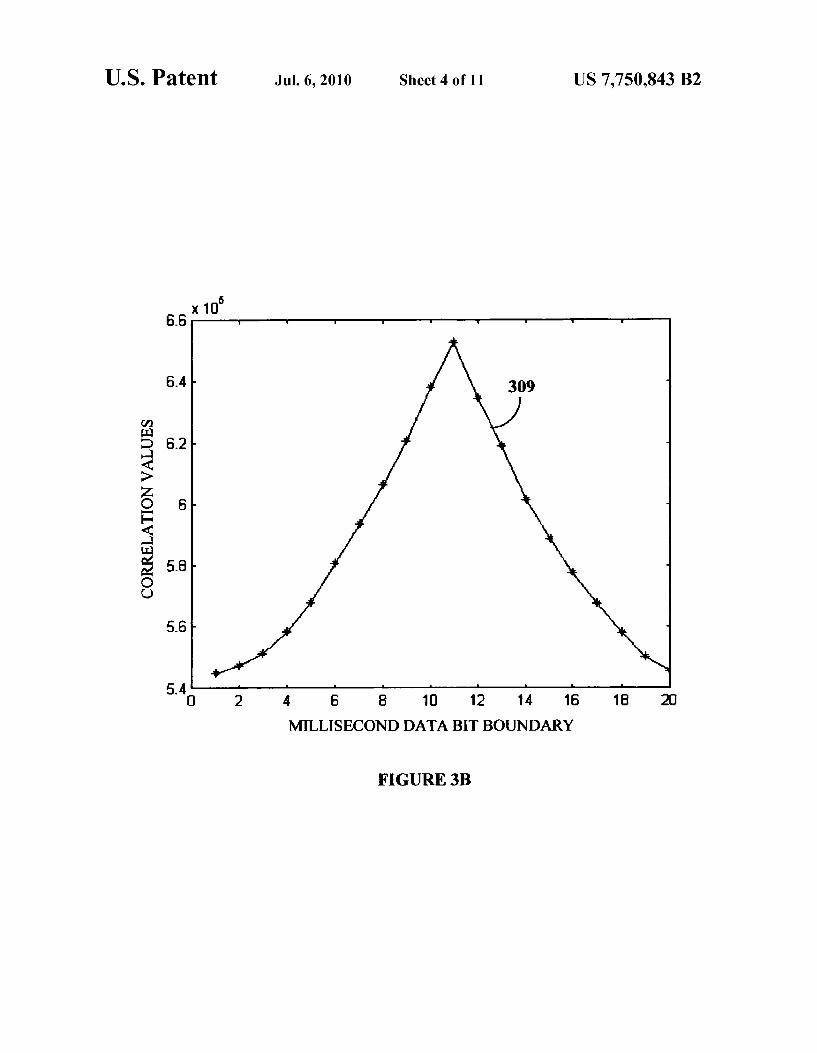
FIG. 3B illustrates an example wherein a strong satellite signal millisecond boundary correlation histogram is gener ated by correlating the locally generated code representing the strong satellite signal with the incoming GPS signal.
FIG. 3C illustrates an example wherein as a result of extended correlation integration at predefined chip delays, the auto-correlation peak due to weak satellite signal and cross correlation peaks due to strong satellite signal stand out from the noise.

US 7,750,843 B2 3
FIG. 3D illustrates an example of millisecond boundary correlation histogram for navigation data at each chip delay where auto-correlation and cross-correlation peaks occur in FIG.3C.
FIG. 4A illustrates a method of weak satellite signal acqui sition in a GPS receiver in the presence of an interfering strong satellite signal using the frequency response correla tion histogram method.
FIG. 4B illustrates an example of the chip frequency shar ing methodology in the CFT correlator.
FIG. 4C illustrates an example of a frequency response correlation histogram generated from the correlation of the strong satellite signal with the incoming GPS signal, gener ated at a high frequency resolution around the tracking fre quency FIG. 4D illustrates an example of the frequency response correlation histogram generated by correlation of a weak satellite signal with the incoming GPS signal, generated at a high frequency resolution around the tracking frequency at each chip delay at which auto-correlation and cross-corre lation peaks occur in FIG. 3C.
FIG. 5 illustrates the method of weak satellite signal acqui sition in a receiver in the presence of an interfering strong satellite signal using a combination of the millisecond bound ary correlation histogram method and/or the frequency response correlation histogram method.
DETAILED DESCRIPTION OF THE INVENTION
The method disclosed herein presents a method of acquir ing a weak satellite signal in the presence of a strong inter fering satellite signal at a GPS receiver, using two techniques, namely the millisecond boundary correlation histogram method and the frequency response correlation histogram method. Both the techniques distinguish between the corre lation characteristics of auto-correlation and cross-correla tion peaks. A chip-frequency-time multiplexed (CFT) corr elator applies the millisecond boundary correlation histogram and frequency response correlation histogram methods to distinguish the auto-correlation peak from the cross-correla tion peaks.
FIG. 1 illustrates the block diagram of a PRN receiver, such as a GPS receiver. The GPS receiver 100 consists of a radio frequency (RF) down converter 101 that down converts the high frequency RF signal to an intermediate frequency (IF) signal, rejects the unwanted frequency bands, and provides Sufficient signal amplification. The IF signal is processed in a chip-frequency-time (CFT) multiplexed correlator 102, where it is mixed with a locally generated carrier in the carrier mixer 103, correlated with locally generated code in the cor relator 104. The correlation values are integrated for a desired integration period in the accumulator 105. A post correlation processor performs extended integration, if required, and then detects the correlation peak for signal acquisition in the detector 106. A navigation processor 107 interacts with the CFT correlator and provides necessary information to per form a faster satellite signal search. The navigation processor 107 takes the output of the post-integration detector 106 for final detection and tracking of the satellite signal.
FIG. 2 illustrates the block diagramofa CFT correlator that is used for weak satellite signal acquisition in the presence of an interfering strong satellite signal. The communication con troller 201 receives information regarding weak signal satel lite identification (ID), Doppler frequency search range and chip delay search range from the navigation processor 107. The CFT controller 202 that runs a state machine receives the information from the communication controller 201 and pro grams the chip-frequency-time multiplexed correlator (CFT)
10
15
25
30
35
40
45
50
55
60
65
4 array 203. The CFT correlator array 203 contains an MXN carrier mixer 205, correlator and accumulator blocks 207. The CFT controller programs the MXN local carrier generator and mixer 205 with the weak signal Doppler frequency search range and MXN local code generator 206 with the weak signal code delay search range for simultaneous chip-frequency search. The MXN accumulator 207 accumulates the correla tion values for the desired duration. Further, it is also possible to run this MXN correlator array in a time-multiplexed fashion for a different set of frequency range and code delay range thereby re-using the hardware more efficiently and enabling faster search of wider frequency and code delay ranges.
Detection of a weak satellite signal requires the accumu lation of correlation values for an extended period of time, for example, in the order of several seconds. This accumulation is performed in post correlation processing block 204. Further, post correlation processing allows the continuous accumula tion of correlation values and continuous examination of the correlation peaks, resulting in accumulation of correlation values only until the correlation peaks stand out from the noise floor. In this process, all the prior data is utilized, thereby avoiding wastage of valuable time and resources. Multiple correlation peaks are detected in the simultaneous chip-frequency-time multiplexed search and this information is communicated to the navigation processor 107 through the communication controller 201. At the GPS receiver 100, the GPS signal consists of a
combination of satellite signals from all the visible satellites. For various reasons including space loss, local obstructions, etc.. Some of the satellite signals may be significantly weaker compared with some other satellite signals in the incoming signal to the GPS receiver. At the GPS receiver 100, the pre-known code for the desired satellites are generated and correlated with the incoming GPS signal. An auto-correlation occurs when the locally generated code is correlated with the same code coming from the satellite in the incoming GPS signal. A cross-correlation occurs when the locally generated code is correlated with the different codes coming from vari ous other satellites in the incoming GPS signal. There are multiple cross-correlation peaks but only one auto-correla tion peak. These cross-correlation peaks hinder the process of weak auto-correlated signal acquisition. The GPS receiver 100 has to differentiate between an auto-correlated peak of the desired satellite signal and cross-correlated peaks of an interfering signal from a different satellite.
Consider two signals transmitted from two different satel lites arriving at the GPS receiver 100. The two satellite signals are coded uniquely and transmitted. Both the satellite signals arrive at the GPS receiver. Assume that one of them arrives through the roof and the other through a window at the GPS receiver. Due to the impact of Doppler shifts, consider the case where the two satellite signals arrive at the receiver at comparable Doppler frequencies. Assume that the satellite signal coming through the roof is
attenuated, in the order of 20-25 dB and is therefore received as the weak satellite signal. Assume further that the signal from the satellite coming through the window is not attenu ated and therefore, in comparison, is received as a strong satellite signal. Since both the strong and the weak satellite signals have about the same Doppler frequency, the strong satellite signal interferes with the weak satellite signal during its acquisition.
Auto-correlation peaks are generated as a result of corre lation of the weak satellite signal with the locally generated code for that satellite, representing the desired satellite signal. Cross-correlation peaks are generated as a result of correla tion of strong satellite signal with the locally generated code

US 7,750,843 B2 5
for the weak satellite, representing the undesired satellite signal. Typically, when the signal strengths of all the incom ing satellite signals are the same or nearly the same, the auto-correlation peak is about 24 dB higher than that of the cross-correlation peaks. However, in the case under consid eration, the strengths of auto-correlation and cross-correla tion peaks are comparable because of the 20-25 dB attenua tion of the desired weak satellite signal, compared to minimal attenuation of the strong satellite signal.
FIG. 3A illustrates the millisecond boundary correlation histogram method for the acquisition of a weak satellite sig nal in a GPS receiver 100 in the presence of a strong interfer ing satellite signal. The strong satellite signal that causes cross-correlation is identified 301. The satellite signal with a greater strength compared to another satellite signal having a lower strength and at about the same Doppler frequency of the signal is termed the strong satellite signal. A millisecond boundary correlation histogram for the identified strong sat ellite signal is plotted for a pre-defined navigation data bit period, for example, 20 millisecond (msec) by correlating the locally generated code representing the strong satellite signal with the incoming satellite signal 302. The locally generated code representing the strong satellite signal is correlated with the incoming satellite signal with the code delay at which the correlation peak occurs 303. The correlation values are inte grated, starting from different millisecond boundaries for navigation data bit at which auto-correlation peak occurs, to generate the correlation histogram 304.
While the weak satellite signal is acquired at about the same Doppler frequency of the strong satellite signal, a search is performed for all the code delay ranges at which the weak signal is expected to attain a correlation peak. This code delay is also called a predefined chip delay or predefined search window.
The locally generated code of the weak satellite signal is correlated with the incoming signal 305. The process of detection of a weak satellite signal requires accumulation of correlation values for an extended period in the order of several seconds, which is performed in the post correlation processing block 204. Multiple correlation peaks are detected in the simultaneous chip-frequency-time multiplexed search 306 and this information is communicated to the navigation processor 107 through the communication controller 201.
All the correlation peaks have similar characteristics except the auto-correlation peak that is generated due to the weak satellite signal. One of the characteristics of the cross correlation peaks is the correlation histogram pattern at the millisecond boundary for navigation data, and that character istic matches with the strong satellite's auto-correlation peak. One of these peaks is an auto-correlation peak due to the weak satellite signal and this peak has a different characteristic compared to the cross-correlation peak of the strong satellite signal. One of the characteristics of the auto-correlation peak is the correlation histogram pattern at millisecond boundary for navigation data, and that characteristic is generally differ ent from that of the cross-correlation peaks due to the strong signals. The pattern discussed above refers to the position of the correlation peak of the histogram. A correlation histogram is drawn for all the correlation
peaks by integrating the correlation values for the extended integration period, and by delaying the start of integration by 1 millisecond each time until the end of the navigation data bit 307. The millisecond boundary correlation histogram is examined for all the correlation peaks, and the only histogram that has a different pattern compared to the remaining peaks 308 is identified. The correlation peak corresponding to that
10
15
25
30
35
40
45
50
55
60
65
6 identified correlation histogram is the auto-correlation peak due to the weak satellite signal.
FIG. 3B illustrates an example where the millisecond boundary correlation histogram of the strong satellite signal is generated by correlating the incoming satellite signal with the locally generated code representing the strong satellite signal. This correlation histogram 309 generates the auto correlation peak of the strong satellite signal.
FIG. 3C illustrates an example where as a result of an extended correlation integration performed using CFT corr elator 102 at predefined chip delays, the auto-correlation peak due to the weak satellite signal and the cross-correlation peaks due to the strong satellite signal stand out from the noise. Due to the large integration period, the noise floor is lower compared to the correlation peaks. In the example, peaks 310, 311, 312 and 313 are identified in the search window at sample delays 2741,2750,2764 and 2774 respec tively, at a sampling frequency of 4.7 MHz and code fre quency of 1.023 MHz. One of these peaks is due to auto correlation, while the remaining peaks are due to cross correlation. Amplitudes of all the peaks are comparable and therefore the auto-correlation peak is indistinguishable from the cross-correlation peaks.
FIG. 3D illustrates an example of millisecond boundary correlation histogram for navigation data at each chip delay for the auto-correlation and cross-correlation peaks shown in FIG. 3C. In this example, correlation histograms 314, 315, 316 and 317 are plotted for correlation peaks 310, 311, 312 and 313 respectively at sample delays 2741, 2750, 2764 and 2774 respectively. It is observed that correlation histograms 314, 315 and 316 have a similar pattern, while 317 has a pattern different from the remaining histograms. Particularly, correlation histograms 314, 315 and 316 have the maximum value in the vicinity of 11" millisecond in the millisecond data bit boundary (X-axis), whereas the correlation histogram 317 has a maximum value at the 19” millisecond. It is also observed that correlation histograms 314, 315 and 316 have a pattern that closely resembles that of the correlation histo gram 309 illustrated in FIG. 3B. From these observations, it can be concluded that the correlation histograms 314,315 and 316 are due to the strong signals cross-correlation and there fore correlation peaks 310,311 and 312 are due to the strong signal and more importantly, the correlation peak 313 is due to the weak signal and is the desired auto-correlation peak.
FIG. 4A illustrates a method of acquisition of a weak signal from a satellite in the presence of a strong interfering signal from another satellite using a frequency response correlation histogram method. The signal with a higher strength and at a Doppler frequency close to another satellite signal with a comparatively lower strength is referred to as the strong sat ellite signal. This strong satellite signal is first identified 401. A frequency response correlation histogram is plotted at the chip delay and Doppler frequency at which the strong signal is acquired 402. A correlation value is obtained by mixing the local carrier with the incoming signal and correlating the locally generated code for the strong satellite with the incom ing signal 403. The frequency response correlation histogram is drawn by changing the local carrier at Small steps at around the tracking frequency and at the code chip delay at which the signal is acquired 404. While acquiring the weak signal at about the same Doppler
frequency as that of the strong signal, a search is performed at the estimated code chip delays at which the correlation peak is expected to occur. The locally generated code of the weak satellite signal is correlated with the incoming satellite signal at different chip delays within the search window, using the CFT correlator 203. Integration is performed for an extended

US 7,750,843 B2 7
period of time in the post correlation processor 204 until the correlation peaks stand out from the noise floor 405. All the correlation peaks are identified by the post correlation pro cessor 204. The correlation peaks are generated by auto correlation of the weak Satellite signal and cross-correlation of the strong satellite signal 406. All these peaks are cross correlation peaks due to the strong satellite signal, and have similar characteristics except for one peak. One of the char acteristics is the profile of the frequency response correlation histogram around the tracking frequency. The CFT correlator through its various configuration modes generates the corre lation values for different frequencies and chip delays.
FIG. 4B illustrates an example of the chip frequency shar ing methodology in the CFT correlator. Hardware resource for N blocks is shared between chip delay searches and Dop pler frequency searches. In MODE 1, all the N blocks gener ate the same Doppler frequency and N chip delay searches which allows a parallel search of N chips at the same Doppler frequency to be performed. In MODE 2, the first half of the N blocks generate one Doppler frequency and the second half of N blocks generate another Doppler frequency, which is offset from that of the first N blocks by Fs. Fs is the frequency search resolution of the frequency response histogram for weak signal acquisition. In this mode, parallel search of N/2 chips and two Doppler frequencies can be performed. Other modes, MODE3, MODE 4, MODE 5, etc., also offer versa tile programming and parallel code and Doppler search capa bilities. This architecture enables search in different fre quency steps and chip delays simultaneously, thereby effectively implementing the weak signal acquisition tech niques.
Frequency response correlation values are obtained by pro gramming the CFT correlator 102, using one of the available modes. The correlation histogram is drawn for all the chip delays at which correlation peaks occurred by integrating the correlation values for the extended integration period, which are in the order of a few seconds and for different small deviations of local carrier frequencies around the tracking frequency 407. The frequency response correlation histogram is examined for all the correlation peaks, and the frequency response correlation histogram that has a different pattern compared to the remaining patterns 408 is identified. The correlation peak corresponding to that correlation histogram is the auto-correlation peak due to the weak signal.
FIG. 4C illustrates the frequency response correlation his togram obtained by mixing local carrier with the incoming signal and correlating local code of the satellite generating the strong satellite with the incoming signal for various carrier frequencies around the tracking frequency 409. It is observed that the correlation histogram peak occurs in the vicinity of the 7"bin, which is at a distance of 70 Hz (bin size equal to 10 HZ) from the beginning of the frequency search window in the X-axis.
FIG. 4D illustrates an example of frequency response cor relation histograms drawn for the correlation peaks that occur at different chip delays within the frequency search window. In this example, the frequency response correlation histo grams 410,411, 412 and 413 are plotted for correlation peaks 310, 311, 312 and 313 respectively, and at sample delays 2741, 2750, 2764 and 2774 respectively. It is observed that the frequency response correlation histograms 410, 411 and 412 have a similar pattern, while the correlation histogram 413 has a different pattern from the remaining histograms. In particular, frequency response correlation histograms 410. 411 and 412 have maximum values in the vicinity of the 7" frequency bin, which is at a distance of 70 Hz from the beginning of the frequency search window (X-axis). How
10
15
25
30
35
40
45
50
55
60
65
8 ever, correlation histogram 413 has a maximum value at the 1 frequency bin, which is at the beginning of the frequency search window. It is also observed that the frequency response correlation histograms 410, 411 and 412 have their maximum values in the vicinity of the 7" frequencybin, which is similar to the positioning of maximum value of the strong satellite's frequency response correlation histogram 409. From these observations, it can be concluded that the correlation peaks 310, 311 and 312 are due to the strong satellite signal, and more importantly, the correlation peak 313 is due to the weak signal and is the desired auto-correlation peak.
FIG. 5 illustrates the method of acquiring a weak satellite signal at a GPS receiver, in the presence of an interfering strong satellite signal in a global positioning system using a combination of the millisecond boundary correlation histo gram method and the frequency response correlation histo gram method.
For weak signal acquisition, the frequency response corre lation histogram method is used to detect the correlation peak 501. In those situations where the Doppler frequencies of the strong satellite and the weak satellite are very close, for example, having a difference of about 20 Hz, the frequency response correlation histogram method will not be able to distinguish the weak satellite signal auto-correlation peak from the strong satellite signal cross-correlation peaks. If the difference in Doppler frequencies of the strong and weak satellite signals is much greater than 20 HZ, the frequency response correlation histogram method will be able to detect the auto-correlation peak. Whether the frequency response correlation histogram is able to detect the autocorrelation peak 502 is first determined. If the frequency response corre lation histogram method is unable to detect the auto correla tion peak, the millisecond boundary correlation histogram method 503 is applied. If the millisecond boundary correla tion histogram method is also unable to detect the autocorre lation peak 504, then the frequency response correlation his togram method is repeated. Since, the satellite Doppler varies over time even if the first attempt of detecting the autocorre lation peak fails, one of the methods will be able to detect the weak satellite signal within a finite period of time.
INDUSTRIAL APPLICATION
The proposed invention can be used to detect a weak PRN signal in the presence of a strong PRN signal, wherein the former is partially masked by the latter in a PRN receiver. The weak signal can be detected efficiently by using the proposed method and the apparatus embodied in this invention. This invention can be applied for GPS-application in an indoor or masked signal environment.
While one or more embodiments of the present invention have been described in the specification, those skilled in the art will recognize that changes and modifications may be made thereto without departing from the spirit of the inven tion, and it is intended to claim all Such changes and modifi cations that fall within the scope of the invention. We claim: 1. A method of acquisition of a weak satellite signal from a
satellite, in the presence of an interfering strong satellite signal from another satellite in a global positioning system receiver, comprising the steps of
identifying said strong interfering satellite signal that causes cross-correlation;
determining millisecond boundary correlation histogram for said incoming strong interfering satellite signal, wherein the millisecond boundary correlation histogram

US 7,750,843 B2
is derived by determining and integrating correlation values starting from different millisecond boundaries for a navigation data bit;
correlating and integrating a locally generated code repre senting said weak satellite signal with the incoming signal at different predefined chip delays for an extended period of time, thereby identifying the chip delays at which the correlation peaks occur;
generating millisecond boundary correlation histograms for navigation data bit at each of said identified chip delays at which correlation peaks occur;
identifying a histogram with a unique peak from amongst the multiple correlation histograms generated, wherein said histogram corresponds to correlation peak due to the weak satellite signal; and
Selecting the weak satellite signal for acquisition. 2. A method of acquisition of a weak satellite signal from a
satellite, in the presence of an undesirable strong interfering satellite signal from another satellite in a global positioning system receiver, comprising the steps of:
identifying said strong satellite signal that causes cross correlation;
determining frequency response correlation histogram of the strong satellite signal with a high frequency resolu tion around the tracking frequency, wherein said fre quency response correlation histogram is derived by integrating overtime the correlation values as a result of changing the local carrier at Small steps around the tracking frequency:
correlating and integrating the locally generated code rep resenting the weak satellite signal with the incoming satellite signal at different predefined chip delays for an extended period of time, thereby identifying the chip delays at which the autocorrelation and cross correlation peaks occur;
generating frequency response correlation histograms at each of said identified chip delays at which correlation peaks occur;
identifying a histogram with a unique peak from amongst the multiple frequency response correlation histograms generated, wherein said histogram corresponds to cor relation peak due to the weak satellite signal; and
Selecting the weak satellite signal for acquisition. 3. A method of acquisition of a weak satellite signal from a
satellite, in the presence of an undesirable strong interfering satellite signal from another satellite in a global positioning system receiver, comprising the steps of:
performing frequency response correlation histogram method and millisecond boundary correlation histogram method successively and iteratively until the weak sat ellite signal peak is successfully identified, wherein the step of performing the frequency response correlation histogram method further comprises the steps of
identifying said strong satellite signal that causes cross correlation;
determining the frequency response correlation histogram of the strong satellite signal with a high frequency reso lution around the tracking frequency, wherein said fre quency response correlation histogram is derived by integrating overtime the correlation values as a result of changing the local carrier at Small steps around the tracking frequency:
correlating and integrating the locally generated code rep resenting the weak satellite signal with the incoming satellite signal, at different predefined chip delays for an
10
15
25
30
35
40
45
50
55
60
65
10 extended period of time, and thereby identifying the chip delays at which the autocorrelation and cross correlation peaks occur;
generating frequency response correlation histograms at each of said identified chip delays at which correlation peaks occur;
identifying a histogram with a unique peak from amongst the multiple frequency response correlation histograms generated, wherein said histogram corresponds to cor relation peak due to the weak satellite signal; and
selecting the weak satellite signal for acquisition; and wherein the step of performing the millisecond boundary correlation histogram method further comprises the steps of
identifying said strong interfering satellite signal that causes cross correlation;
determining the millisecond boundary histogram for said incoming strong interfering satellite signal, wherein the millisecond boundary correlation histogram is derived by determining and integrating correlation values start ing from different millisecond boundaries for a naviga tion data bit;
correlating and integrating the locally generated code rep resenting said weak satellite signal with the incoming signal, at different predefined chip delays for an extended period of time, and thereby identifying the chip delays at which the correlation peaks occur;
generating millisecond boundary correlation histograms for navigation data bit at each of said identified chip delays at which correlation peaks occur;
identifying a histogram with a unique peak from amongst the multiple correlation histograms generated, wherein said histogram corresponds to correlation peak due to the weak satellite signal; and
selecting the weak satellite signal for acquisition. 4. The method of claim 1, wherein the correlation involves
the accumulation of correlation values for an extended period of time, in the order of several seconds, by continuous inte gration without discarding the prior data, for the search of progressively weaker signals.
5. The method of claim 1, wherein the step of generating millisecond boundary correlation histograms, occurs in a simultaneous chip frequency time multiplexed search.
6. The method of claim 1, wherein the correlation histo gram is drawn for all the correlation peaks by integrating the correlation values for the extended integration period, and by delaying the start of integration by 1 millisecond each time until the end of the navigation data bit period.
7. The method of claim 2, wherein the correlation involves the accumulation of correlation values for an extended period of time, in the order of several seconds, utilizing prior corre lation data and allowing accumulation of correlation values until the correlation peaks of the correlation histogram stand out from the noise floor.
8. The method of claim 2, wherein the step of generating frequency response correlation histograms occurs in a simul taneous chip frequency time multiplexed search.
9. The method of claim 2, wherein the frequency response correlation histogram is drawn for all the correlation peaks by integrating the correlation values for the extended integration period, and by changing the local carrier at Small steps around the tracking frequency.
10. A global positioning system receiver for detecting a desired weak satellite signal in the presence of a strong inter fering satellite signal, comprising:
a radio frequency down converter; a navigation processor,

US 7,750,843 B2 11 12
a communication controller that receives information integrating overtime the correlation values as a result of regarding weak signal satellite identification, Doppler changing the local carrier at Small steps around the frequency search range and chip delay search range tracking frequency; and from said navigation processor, a chip frequency time multiplexed controller that programs
a chip-frequency-time multiplexed correlator array that is 5 said chip, frequency and time multiplexed correlator operated in a time multiplexed manner for different sets array. of frequency range and code delay range, simulta- 11. The global positioning system receiver of claim 10, neously generating the correlation values by continuous wherein the array of blocks within the chip frequency time integration and peak examination, without discarding multiplexed correlator array is shared between chip delay the prior data, at desired chip and frequency ranges for 10 searches and Doppler frequency searches. the strong interfering signal and weak desired signal, 12. The global positioning system receiver of claim 11, and thereafter creating the millisecond boundary corre- wherein in Successive modes of operation, said blocks are lation histogram and frequency response correlation his- programmable and generate Doppler frequencies at different togram, wherein the millisecond boundary correlation offsets and generate simultaneous chip delays, thereby histogram is derived by determining and integrating cor- 15 enabling search in different frequency steps and chip delays relation values starting from different millisecond simultaneously. boundaries for a navigation data bit, and wherein said frequency response correlation histogram is derived by k . . . .