12-Lead EKG Interpretation Disclosures · 2018-04-03 · 12-Lead EKG Interpretation • I work for...
31
Jon Tardiff, BS, PA-C 2+68 $I¿OLDWH $VVRFLDWH 3URIHVVRU 12-Lead EKG Interpretation • I work for Virginia Garcia Memorial Health Center, Beaverton, Oregon. • And I am a medical editor for Jones & Bartlett Publishing. Disclosures: 3 Goals for today’s ECG Review: • Determine Right vs Left bundle branch block • Diagnose Acute MI • Diagnose old MI • Location of the infarct • Other Acute Coronary Syndromes • Determine Axis • Other ECG confounders • Pfun! “Ask questions any time—I like answering them” What a 12-Lead EKG can help you do • Diagnose ACS / AMI • Interpret arrhythmias* (computer Dx) • Identify life-threatening syndromes (WPW, LGL, Long QT synd., Wellens synd., etc) • Infer electrolyte imbalances • Infer hypertrophy of any chamber • Infer COPD, pericarditis, drug effects, and more!
Transcript of 12-Lead EKG Interpretation Disclosures · 2018-04-03 · 12-Lead EKG Interpretation • I work for...

Jon Tardiff, BS, PA-C
12-Lead EKG Interpretation
• I work for Virginia Garcia Memorial Health Center, Beaverton, Oregon.
• And I am a medical editor for Jones & Bartlett Publishing.
Disclosures:
3
Goals for today’s ECG Review:
• Determine Right vs Left bundle branch block• Diagnose Acute MI • Diagnose old MI• Location of the infarct• Other Acute Coronary Syndromes• Determine Axis• Other ECG confounders• Pfun!
“Ask questions any time—I like answering them”
What a 12-Lead EKG can help you do
• Diagnose ACS / AMI• Interpret arrhythmias* (computer Dx)• Identify life-threatening syndromes (WPW,
LGL, Long QT synd., Wellens synd., etc)• Infer electrolyte imbalances• Infer hypertrophy of any chamber• Infer COPD, pericarditis, drug effects, and
more!

5
73 y.o. male with nausea, syncope
6
Acute Inferior MI
ST elevation
What rhythm? (look at V1 for P waves)
(w/septal MI?)
9
another example…
10
WPW with Atrial Fib
WPW GraphicWolff-Parkinson-White synd.
• short PR• wide QRS• delta wave
12
Same pt, converted to SR

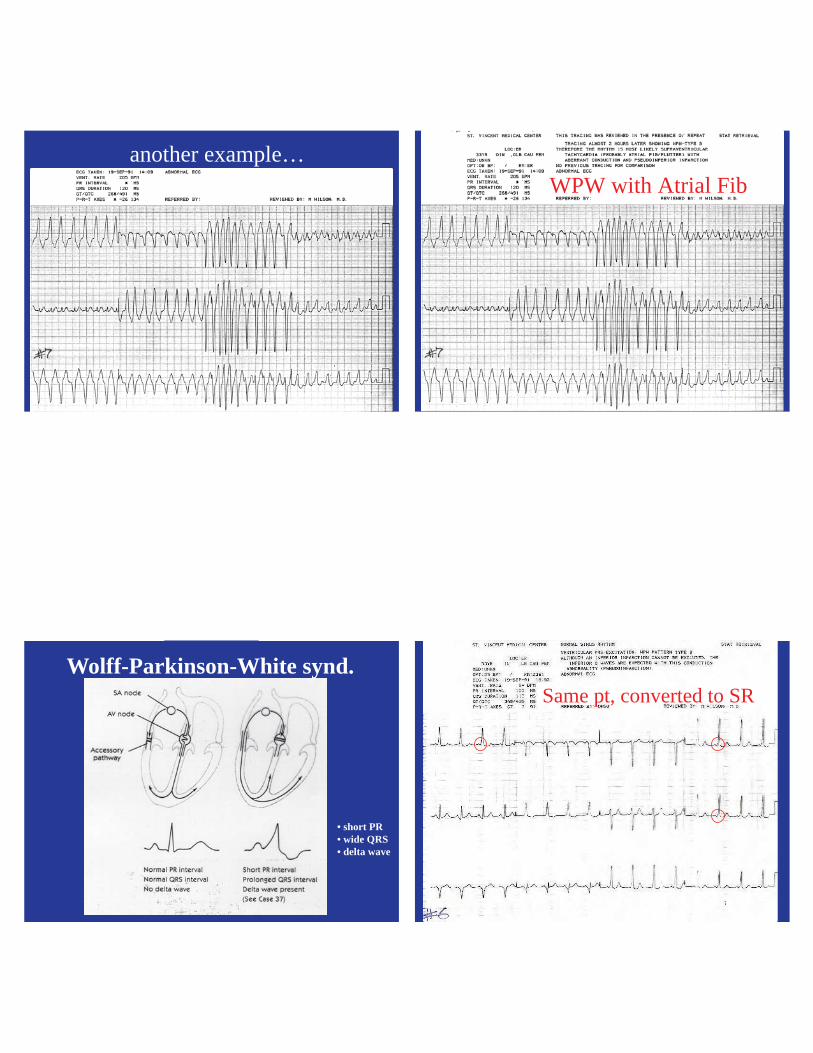
Limitations of a 12-Lead ECG
• Truly useful only ~40% of the time• Each ECG is only a 10 sec. snapshot• Serial ECGs are necessary, especially for ACS• Other labs help corroborate ECG findings
(cardiac markers, Cx X-ray)• Confounders must be ruled out (dissecting
aneurysm, pericarditis, WPW, LBBB, digoxin, RVH)
The Problem with Bundle Branch Blocks
• Desynchronized contraction of the ventricles• Reduced cardiac output• Worsened heart failure•
15
Confounder: Left Bundle Branch Block
16
Bundle Branch Blocks (QRS > 120 msec.)
Left BBB (L I, V5, V6: upright QRS with a notch)
Right BBB (V1, V2, MCL1: rsR’ pattern)
R’
S
r
notchIV1
(left-sided lead) (right-sided lead)

17
Bundle Branch Blocks Two QRSs
notchI
Healthyventricle
Blockedbundle
R’
S
rV1 slurI
V1 & V2
RBBB
V5 V6
(& I, aVL)
LBBB
20
Practice: Bundle Branch Block

RBBB
Which Bundle Branch is Blocked? 1RBBB
Right Bundle Branch Block (Lead V1) 1
LBBB 12-Lead
Which Bundle Branch is Blocked? 2LBBB 12-LeadLeft Bundle Branch Block
(L I, V5, V6)
2

Where is the Pathology? Right Bundle Branch Block
27
Where is the Pathology?
28
Left Bundle Branch Block
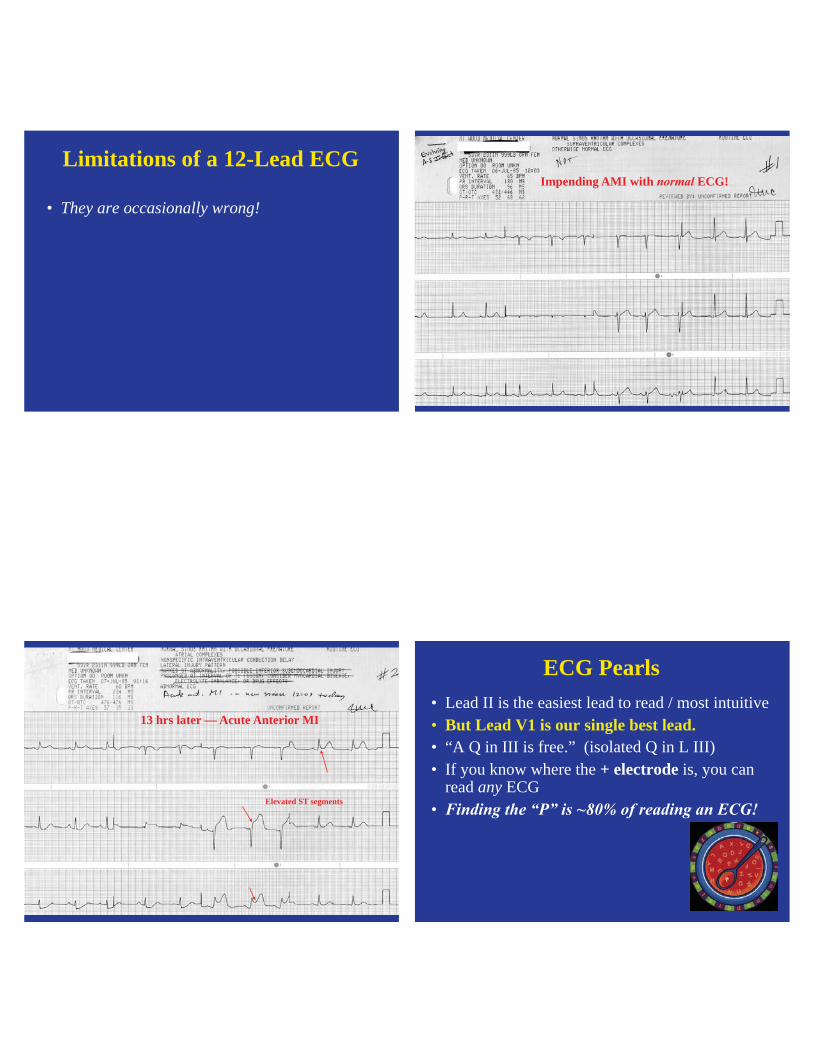
Limitations of a 12-Lead ECG
• They are occasionally wrong!
30
Impending AMI with ECG!
31
13 hrs later — Acute Anterior MI
Elevated ST segments
ECG Pearls• Lead II is the easiest lead to read / most intuitive• But Lead V1 is our single best lead. • “A Q in III is free.” (isolated Q in L III)• If you know where the + electrode is, you can
read any ECG•

33
ECG Lead Placement&
Electrophysiology Review
34
IIIIII
Limb Leads
(standardleads)
- ±
+
35
Leads I, II, III
I
II III
Normal 12-Lead ECG
37
Rapid Interpretation Tips
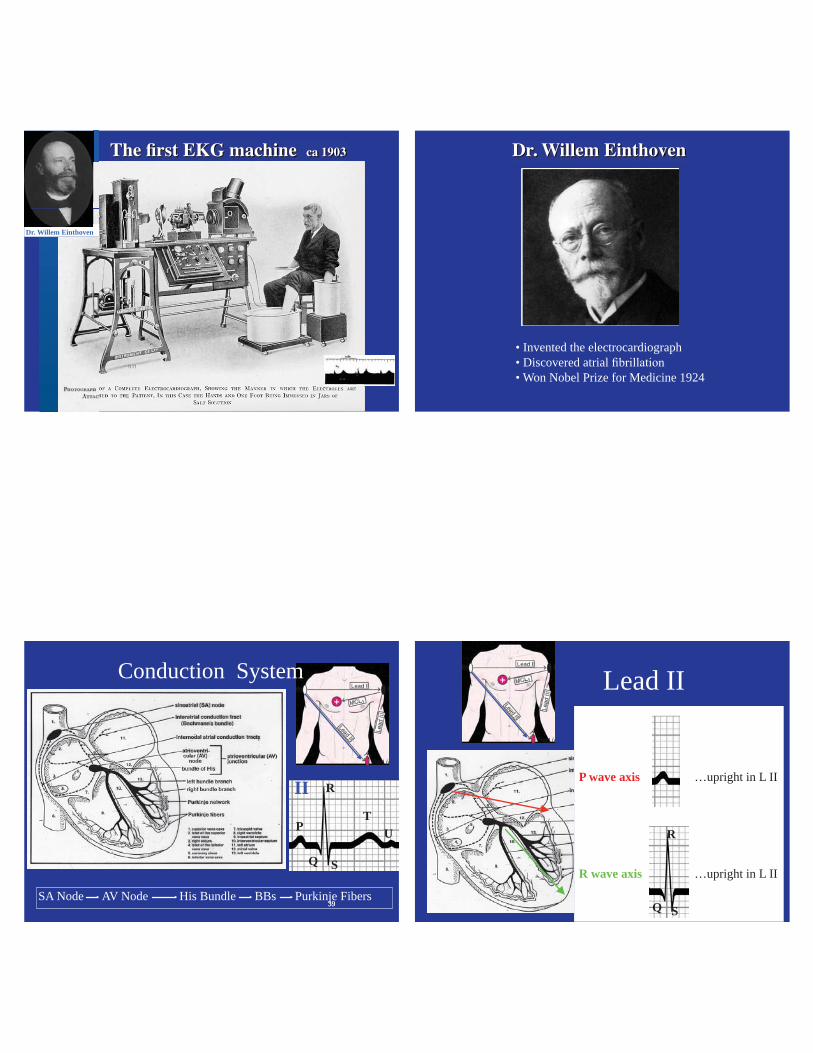
Dr. Willem Einthoven
• Invented the electrocardiograph• Discovered atrial• Won Nobel Prize for Medicine 1924
3939SA Node AV Node His Bundle BBs Purkinje Fibers
P
Q
R
S
T
II
U
Conduction System
40Q
R
S
P wave axis
R wave axis
…upright in L II
…upright in L II
Lead II

4141
PR
II
Intervals
PR Interval: 120 – 200 mSec (3 – 5 boxes)QRS width: 60 – 120 mSec (1 – 3 boxes) QT/QTc interval: 400 mSec (10 boxes)
QTQRS
42
300, 150, 100, 75, 60, 50 Quick, easy, sufficient
Count PQRST in a 6- second strip & multiply x 10 Easy, & more accurate
300 150 100 75 60 6 seconds
Horizontal axis is (mS); vertical axis is electrical (mV)
43
Normal Sinus Rhythm
What is the heart rate?
6 seconds
44
IIIIIIaVRaVL aVF
Limb (frontal plane) Leads
(augmented leads)
(standardleads)

Normal 12-Lead ECG
46
6 Frontal Plane Leads (limb leads)
I
II III
R
L
F
Axis
47
Leads I II III aVR* aVL aVF
-
48

49
IIIIIIaVRaVL aVF
V1V2V3V4V5V6
Limb (frontalplane) Leads
(augmented leads)
(standardleads) (anterior
leads)
(lateralleads)
Chest (precordial)Leads
50
V Lead Cutaway V Lead Progression

Normal 12-Lead ECG
54
New 12-Lead ECG Format
aVL
I
-aVR
II
aVF
III
New 12-Lead ECG Format
aVL
I
-aVR
II
aVF
III
New
Old
Axis Determination

57
Why We Care About Axis DeviationsThe axis shifts &
58
Axis DeviationHorizontal heart (0°): obesity, 3rd trimester pregnancy. Ascites
Vertical heart (90°): slender build
Left Axis Deviation: LBBB, Anterior MI, Inferior MI, Left anterior hemiblock, LVH
Right Axis Deviation: Anterior MI, Lateral MI, RBBB, COPD, RVH, Left posterior hemiblock
Extreme RAD: Ectopic rhythm (VT), massive MI
59
QRS Morphology in Lead II
II60
How to calculate Axis
the computer does it for you!
(if tallest is Lead II = )
Thumbs up / Thumbs down

61
Thumbs Up / Down Method
Lead I —Your Left thumbLead aVF —Your Right thumb
62
Practice: Axis 3I
F
63
Axis Practice 1Normal Axis
I
F64
4I
F

65
4Left Axis Deviation
I
F66
5
67
5Right Axis Deviation
68
6

69
6Extreme Right Axis Deviation
Lots of ways to read EKGs…
• QRSs wide or narrow?• Regular or irregular?• Fast or slow?• P waves?
• Sinus rhythm or not?• If not, is it atrial fibrillation?• BBB?• MI?
Symptoms:• Syncope is bradycardia, heart blocks, or VT• Rapid heart beat is AF, SVT, or VT
71
Step-by-step method for reading a 12-Lead Rapid Interpretation Tips
Rapid Interpretation Tips• Identify the rhythm. If supraventricular*,
If no LBBB,
If present, • Rule out other confounders: WPW, pericarditis, LVH,
digoxin effect• Identify location of infarct, and consider appropriate
treatments: MONA, PCI [or fibrinolytic], nitrate infusion, heparin infusion, GP IIb, IIIa inhibitor, beta-blocker, clopidogrel, statin, etc.
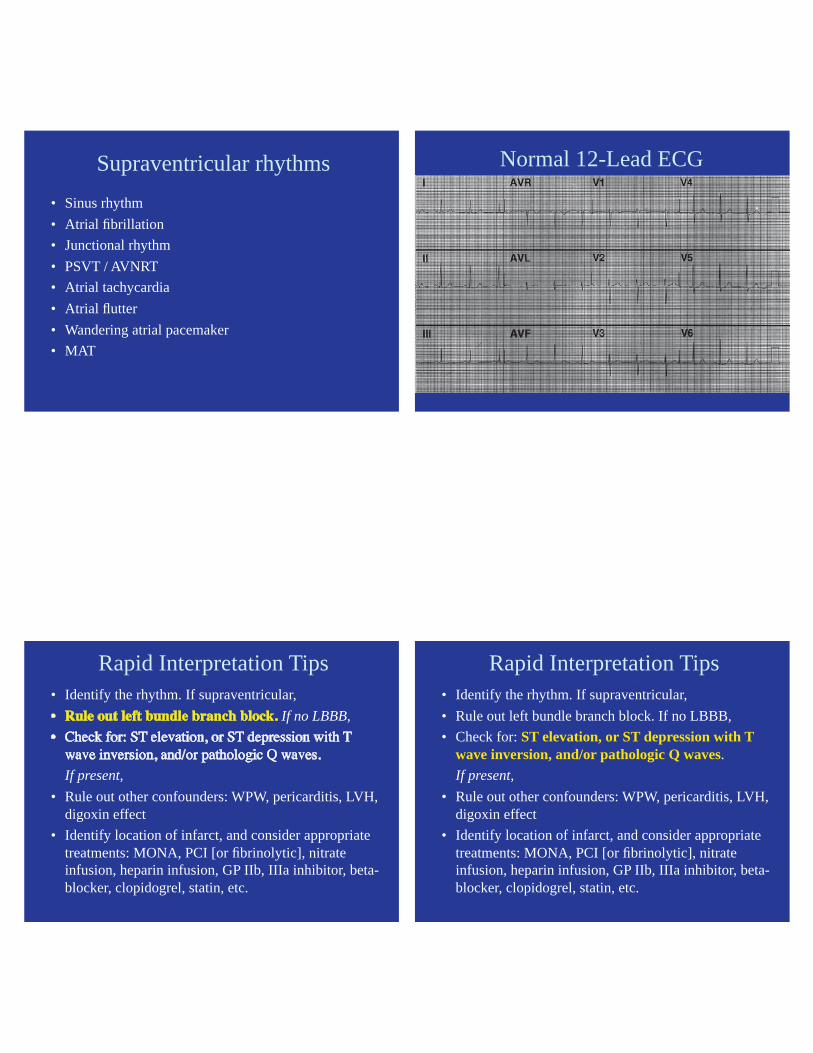
Supraventricular rhythms• Sinus rhythm• Atrial fibrillation• Junctional rhythm• PSVT / AVNRT• Atrial tachycardia• Atrial flutter• Wandering atrial pacemaker• MAT
Normal 12-Lead ECG
Rapid Interpretation Tips
Rapid Interpretation Tips• Identify the rhythm. If supraventricular,
If no LBBB,
If present, • Rule out other confounders: WPW, pericarditis, LVH,
digoxin effect• Identify location of infarct, and consider appropriate
treatments: MONA, PCI [or fibrinolytic], nitrate infusion, heparin infusion, GP IIb, IIIa inhibitor, beta-blocker, clopidogrel, statin, etc.
Rapid Interpretation Tips
Rapid Interpretation Tips• Identify the rhythm. If supraventricular, • Rule out left bundle branch block. If no LBBB,• Check for: ST elevation, or ST depression with T
wave inversion, and/or pathologic Q waves. If present,
• Rule out other confounders: WPW, pericarditis, LVH, digoxin effect
• Identify location of infarct, and consider appropriate treatments: MONA, PCI [or fibrinolytic], nitrate infusion, heparin infusion, GP IIb, IIIa inhibitor, beta-blocker, clopidogrel, statin, etc.

Ischemia Injury InfarctionNormal
STEMIST elevation, ST depression, T wave inversion, pathologic Q waves
78
Percutaneous Coronary Intervention

81
RCA before and after stenting
Before stenting After stenting
STEMI: ECG ChangesA. Normal ECGB. Hyperacute T wave changes - increased T wave amplitude and width; may also see ST elevationC. Marked ST elevation with hyperacute T wave changes (transmural injury)D. Pathologic Q waves, less ST elevation, terminal T wave inversion (necrosis)E. Pathologic Q waves, T wave inversion (necrosis and fibrosis) F. Pathologic Q waves, loss of R waves (fibrosis)
(w/onset cx pn)
(20 minutes) (1 hour)
(1 week – years)(>1 hr)
(normal)
MI ECG Patterns
84
Why Pathologic Q Waves Form
Normal q Pathologic Q

85
STEMI — Typical Progression Acute Inferior MI#1
Acute Inferior MI
ST elevation
Qs Qs
Axis is shifting leftward…
Acute Inferior MI #2
Same Patient~2 hrs later
Worsened ST elevation
Qs Qs
New ST elevation
Acute Inferior MI #3Same Patient 9 days later
Permanent Q waves(inferior wall scar)
But NO anterior infarct (no Qs)
Permanent left axis deviation

Acute Anterior MI Page
45% of MIs
Acute Inferior MI Page
40% of MIs
Acute R Ventricle MI Page
1/3 of Inferior MIs
Acute Lateral MI Page
15% of MIs

Acute Posterior MI Page
94
Practice: Infarct Location
Acute Anterior MI
Where is the Pathology? 7 Acute Anterior MI(ST elevation in V1 - V4)
ST Elevation
What is the R wave axis?
7

Acute Inferior MI
Where is the Pathology? 8Acute Inferior MI
Acute Inferior MI(ST elevation in II, III, F)
8
Acute Inferolateral MI
Where is the Pathology? 9Acute Inferolateral MIAcute Inferolateral MI
(ST elevation in II, III, F, V5, V6)
Note the axis has not shifted yet, because it is early in the AMI, and there are no loss of R waves yet.
9

Where is the Pathology? 10Acute Inferior & Right Ventricle MI
Acute Inferior MI & Right Ventricle MI 10
Where is the MI?
Normal V1 – V3
• V1, V2, V3• Large R Waves• Depressed STs
ST Depression
Large R waves
11 Acute Posterior MI
Normal V1 – V3
• V1, V2, V3• Large R Waves• Depressed STs
ST Depression
Large R waves
11

105
Confounders
Rapid Interpretation Tips
Rapid Interpretation Tips• Identify the rhythm. If supraventricular, • Rule out left bundle branch block. If no LBBB,
If present, • Rule out other confounders: WPW, pericarditis,
LVH, digoxin effect• Identify location of infarct, and consider appropriate
treatments: MONA, PCI [or fibrinolytic], nitrate infusion, heparin infusion, GP IIb, IIIa inhibitor, beta-blocker, clopidogrel, statin, etc.
WPW GraphicWolff-Parkinson-White synd. Wolff-Parkinson-White synd.
• Short PR, Wide QRS, “Delta” wave
Short PR
Widened QRS
Delta wave

109
False Q Waves (the Delta wave)
WPWFalse Q waves mimic MI
Other Confounders
111
Benign Normal VariantST Elevation
Mild upsloping ST segments
Pericarditis
Elevated STs in multiple leads
Depressed PR segments
• NO loss of R waves •
Elevated STs in multiple leads
Depressed PR segments

Other Confounders Left Ventricular Hypertrophy
• Tall R waves in V5, V6; deep S waves in V1, V2
Tall R waves V5, V6
Deep S waves V1, V2
“strain”
Other Confounders: Digoxin(ST Depression)
Depressed ST segments
116
ST Depression(a diagnostic challenge)
Can be caused by: • Ischemia• Digoxin effect• Tachycardia• LVH, BBB• Hypokalemia• NSTEMI (Non Q wave MI)

Ischemic ST Depression(a positive exercise ECG)
118
Practice: Confounders
1244 y.o. female with history of tachycardia
WPW (short PR, Wide QRS, Delta waves)
false Q waves delta waves
short PR
12
121
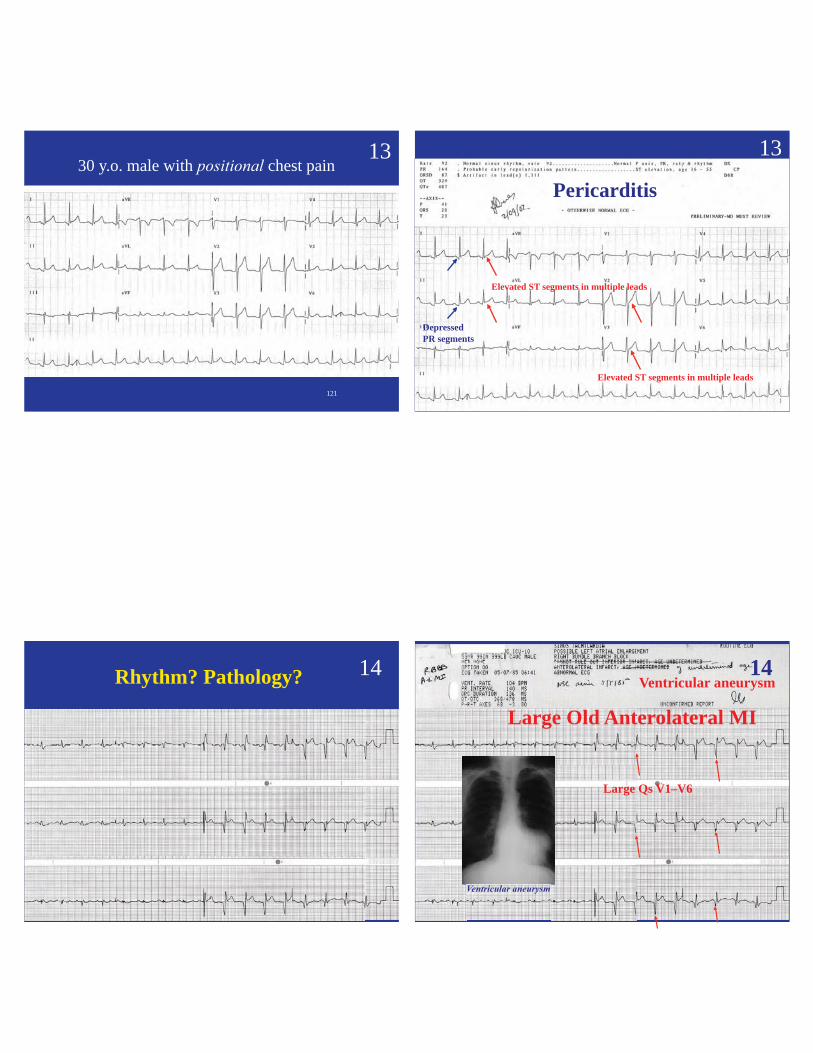
1330 y.o. male with chest pain
122
13
Pericarditis
DepressedPR segments
Elevated ST segments in multiple leads
Elevated ST segments in multiple leads
123
Rhythm? Pathology? 14
124
Large Old Anterolateral MI
Large Qs V1–V6
Ventricular aneurysm14