12. FOREIGN TRADE & BALANCE OF PAYMENTS …wko.at/statistik/jahrbuch/2016_c12.pdfdirect survey...
10
59 source: STATISTICS AUSTRIA region 12.0 Austria´s foreign trade 2015 by world region million EUR exports of goods 2015 1 2 provisional data 1 since 1995 inner-community trade has to be recorded by direct survey (INTRASTAT), so that there is no direct comparability of results before/after 1995 imports of goods 2015 1 12. FOREIGN TRADE & BALANCE OF PAYMENTS million EUR share (%) share (%) 1 provisional data source: STATISTICS AUSTRIA Europe 106,984 80.4 104,032 79.1 EU 93,686 70.4 90,841 69.1 EFTA 8,020 6.0 8,098 6.2 Rest of Europe 5,278 4.0 5,093 3.9 Overseas 26,018 19.6 27,476 20.9 Asia 16,934 12.7 12,489 9.5 America 7,180 5.4 12,375 9.4 Africa 1,764 1.3 1,724 1.3 TOTAL 133,002 100.0 131,554 100.0 1980 22.95 16.44 - 6.52 1990 40.42 33.87 - 6.55 1995 1 48.55 42.15 - 6.40 1996 51.80 + 6.7 44.49 + 5.5 - 7.31 1997 57.43 +10.9 51.96 +16.8 - 5.47 1998 61.20 + 6.6 56.30 + 8.4 - 4.90 1999 65.32 + 6.7 60.27 + 7.0 - 5.05 2000 74.94 +14.7 69.69 +15.6 - 5.24 2001 78.69 + 5.0 74.25 + 6.5 - 4.44 2002 77.10 - 2.0 77.40 + 4.2 + 0.30 2003 80.99 + 5.0 78.90 + 1.9 - 2.09 2004 91.09 +12.5 89.85 +13.9 - 1.25 2005 96.50 + 5.9 94.71 + 5.4 - 1.79 2006 104.20 + 8.0 103.74 + 9.5 - 0.46 2007 114.25 + 9.6 114.68 +10.5 + 0.43 2008 119.57 + 4.7 117.53 + 2.5 - 2.04 2009 97.57 -18.4 93.74 -20.2 - 3.83 2010 113.65 +16.5 109.37 +16.7 - 4.28 2011 131.01 +15.3 121.77 +11.3 - 9.23 2012 131.98 + 0.7 123.54 + 1.5 - 8.44 2013 130.71 - 1.0 125.81 + 1.8 - 4.90 2014 129.85 - 0.7 128.11 + 1.8 - 1.74 2015 ² 133.00 + 2.4 131.55 + 2.7 - 1.45 year 12.1 Foreign trade and trade balance billion EUR exports of goods imports of goods billion EUR annual change (%) annual change (%) trade balance billion EUR
Transcript of 12. FOREIGN TRADE & BALANCE OF PAYMENTS …wko.at/statistik/jahrbuch/2016_c12.pdfdirect survey...

59
source: STATISTICS AUSTRIA
region
12.0 Austria´s foreign trade 2015 by world region
million EURexports of goods 2015 1
2 provisional data
1 since 1995 inner-community trade has to be recorded by direct survey (INTRASTAT), so that there is no direct comparability of results before/after 1995
imports of goods 2015 1
12. FOREIGN TRADE & BALANCE OF PAYMENTS
million EURshare (%) share (%)
1 provisional data source: STATISTICS AUSTRIA
Europe 106,984 80.4 104,032 79.1 EU 93,686 70.4 90,841 69.1 EFTA 8,020 6.0 8,098 6.2 Rest of Europe 5,278 4.0 5,093 3.9Overseas 26,018 19.6 27,476 20.9 Asia 16,934 12.7 12,489 9.5 America 7,180 5.4 12,375 9.4 Africa 1,764 1.3 1,724 1.3TOTAL 133,002 100.0 131,554 100.0
1980 22.95 16.44 - 6.521990 40.42 33.87 - 6.55
1995 1 48.55 42.15 - 6.401996 51.80 + 6.7 44.49 + 5.5 - 7.311997 57.43 +10.9 51.96 +16.8 - 5.471998 61.20 + 6.6 56.30 + 8.4 - 4.901999 65.32 + 6.7 60.27 + 7.0 - 5.052000 74.94 +14.7 69.69 +15.6 - 5.242001 78.69 + 5.0 74.25 + 6.5 - 4.442002 77.10 - 2.0 77.40 + 4.2 + 0.302003 80.99 + 5.0 78.90 + 1.9 - 2.092004 91.09 +12.5 89.85 +13.9 - 1.252005 96.50 + 5.9 94.71 + 5.4 - 1.792006 104.20 + 8.0 103.74 + 9.5 - 0.462007 114.25 + 9.6 114.68 +10.5 + 0.432008 119.57 + 4.7 117.53 + 2.5 - 2.042009 97.57 -18.4 93.74 -20.2 - 3.832010 113.65 +16.5 109.37 +16.7 - 4.282011 131.01 +15.3 121.77 +11.3 - 9.232012 131.98 + 0.7 123.54 + 1.5 - 8.442013 130.71 - 1.0 125.81 + 1.8 - 4.902014 129.85 - 0.7 128.11 + 1.8 - 1.74
2015 ² 133.00 + 2.4 131.55 + 2.7 - 1.45
year
12.1 Foreign trade and trade balance
billion EUR
exports of goodsimports of goods
billion EURannualchange (%)
annualchange (%)
trade balance
billion EUR

60
commodity group (SITC)
12.2 Imports/commodity structure
million EUR2015 12010
million EURshare(%)
1 provisional data source: STATISTICS AUSTRIA
0 Food 3,553 6,679 8,981 6.81 Beverages and tobacco 376 866 797 0.62 Raw materials 3,014 5,811 5,557 4.23 Fuels, energy 4,899 12,167 10,428 7.84 Animal and vegetable oils, fats 111 374 374 0.35 Chemical products 7,572 14,441 18,362 13.8 Organic chemicals 751 1,182 1,452 1.1 Personal hygiene products, cleaning prod. 2,141 5,476 7,999 6.0 Medicinal & pharmaceut. products 701 1,119 1,385 1.0 Plastics in primary form 1,301 2,102 2,343 1.8 Other plastics 745 1,306 1,610 1.26 Manufactured goods 12,501 18,060 20,956 15.8 Leather, leatherware, fur 158 208 308 0.2 Rubberware 762 1,143 1,155 0.9 Cork and wood products 651 788 894 0.7 Paper, cardboard and similar products 1,585 1,822 1,917 1.4 Textiles 1,650 1,512 1,705 1.3 Non-metallic mineral products 1,260 1,578 1,926 1.4 Iron and steel 1,746 3,359 3,609 2.7 Non-ferrous metals 1,725 3,238 3,811 2.9 Metalware 2,965 4,413 5,631 4.27 Machines, vehicles 30,818 36,958 45,344 34.1 Engines 1,990 2,936 3,794 2.9 Machines 2,269 3,115 3,918 2.9 Metal-processing machinery 639 662 910 0.7 Other machines 3,847 5,923 7,314 5.5 Office and data-processing machines 2,498 2,420 2,356 1.8 Telecommunications 3,032 3,106 3,638 2.7 Electrical machinery and devices 5,894 6,677 8,407 6.3 Road motor vehicles 8,611 10,761 13,494 10.1 Other means of transport 2,040 1,358 1,512 1.18 Other finished products 11,814 16,499 20,024 15.1 Buildings, sanit. facilities, lighting 623 811 1,175 0.9 Furniture 1,589 1,769 1,973 1.5 Travel accessories, bags 151 272 449 0.3 Clothing and accessories 2,925 3,991 5,066 3.8 Footwear 807 1,067 1,435 1.1 Measuring, testing, controlling equip. 1,365 1,910 2,374 1.8 Photo-optical equip., clocks & watches 750 722 950 0.7 Other finished products 3,603 5,956 6,602 5.09 Other products 278 1,795 2,178 1.6TOTAL IMPORTS OF GOODS 74,935 113,652 133,002 100.0
12. FOREIGN TRADE & BALANCE OF PAYMENTS
2000
61
12. FOREIGN TRADE & BALANCE OF PAYMENTS
commodity group (SITC)
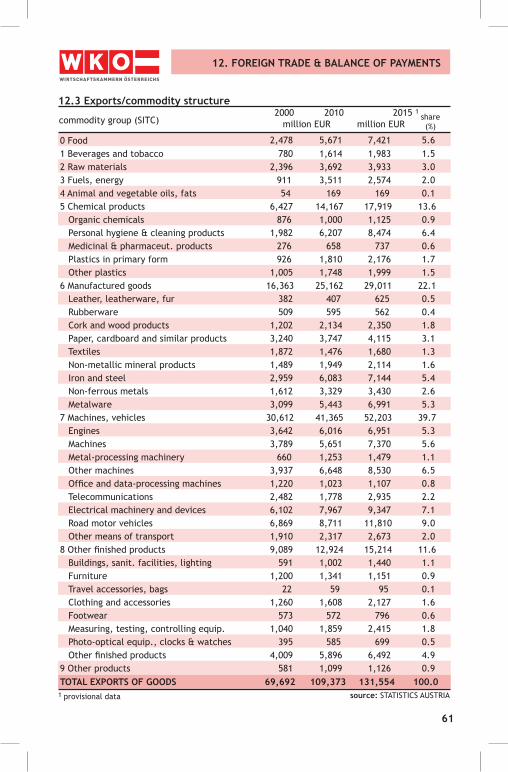
12.3 Exports/commodity structure
million EUR2015 12010
million EURshare(%)
1 provisional data source: STATISTICS AUSTRIA
0 Food 2,478 5,671 7,421 5.61 Beverages and tobacco 780 1,614 1,983 1.52 Raw materials 2,396 3,692 3,933 3.03 Fuels, energy 911 3,511 2,574 2.04 Animal and vegetable oils, fats 54 169 169 0.15 Chemical products 6,427 14,167 17,919 13.6 Organic chemicals 876 1,000 1,125 0.9 Personal hygiene & cleaning products 1,982 6,207 8,474 6.4 Medicinal & pharmaceut. products 276 658 737 0.6 Plastics in primary form 926 1,810 2,176 1.7 Other plastics 1,005 1,748 1,999 1.56 Manufactured goods 16,363 25,162 29,011 22.1 Leather, leatherware, fur 382 407 625 0.5 Rubberware 509 595 562 0.4 Cork and wood products 1,202 2,134 2,350 1.8 Paper, cardboard and similar products 3,240 3,747 4,115 3.1 Textiles 1,872 1,476 1,680 1.3 Non-metallic mineral products 1,489 1,949 2,114 1.6 Iron and steel 2,959 6,083 7,144 5.4 Non-ferrous metals 1,612 3,329 3,430 2.6 Metalware 3,099 5,443 6,991 5.37 Machines, vehicles 30,612 41,365 52,203 39.7 Engines 3,642 6,016 6,951 5.3 Machines 3,789 5,651 7,370 5.6 Metal-processing machinery 660 1,253 1,479 1.1 Other machines 3,937 6,648 8,530 6.5 Office and data-processing machines 1,220 1,023 1,107 0.8 Telecommunications 2,482 1,778 2,935 2.2 Electrical machinery and devices 6,102 7,967 9,347 7.1 Road motor vehicles 6,869 8,711 11,810 9.0 Other means of transport 1,910 2,317 2,673 2.08 Other finished products 9,089 12,924 15,214 11.6 Buildings, sanit. facilities, lighting 591 1,002 1,440 1.1 Furniture 1,200 1,341 1,151 0.9 Travel accessories, bags 22 59 95 0.1 Clothing and accessories 1,260 1,608 2,127 1.6 Footwear 573 572 796 0.6 Measuring, testing, controlling equip. 1,040 1,859 2,415 1.8 Photo-optical equip., clocks & watches 395 585 699 0.5 Other finished products 4,009 5,896 6,492 4.99 Other products 581 1,099 1,126 0.9TOTAL EXPORTS OF GOODS 69,692 109,373 131,554 100.0
2000

62
12.4 Imports of goods/country structure
2 Europe excluding EU and EFTA
12. FOREIGN TRADE & BALANCE OF PAYMENTS
country/regionmillion EUR
2015 12014
million EUR share (%)
1 provisional data source: STATISTICS AUSTRIA
EUROPE 61,903 94,275 104,750 106,984 80.4EU 57,393 82,867 92,485 93,686 70.4 Germany 30,534 44,851 48,543 49,091 36.9 Italy 5,354 7,690 8,033 8,197 6.2 Czech Republic 1,921 4,186 5,405 5,558 4.2 France 2,605 3,234 3,629 3,584 2.7 Netherlands 3,312 3,231 3,483 3,510 2.6 Hungary 2,285 3,132 3,824 3,408 2.6 Poland 1,042 1,896 2,569 2,970 2.2 Slovakia 757 2,630 2,867 2,965 2.2 United Kingdom 2,092 1,728 2,306 2,454 1.8 Spain 1,048 1,772 2,173 2,234 1.7 Belgium 1,372 1,832 2,060 1,920 1.4 Slovenia 718 1,256 1,697 1,722 1.3 Romania 1,130 941 1,210 1,230 0.9 Sweden 333 1,247 1,265 1,227 0.9 Croatia 425 522 474 540 0.4 Denmark 320 454 534 537 0.4 Portugal 283 400 496 500 0.4 Ireland 650 607 462 494 0.4 Finland 816 444 423 471 0.4 Bulgaria 84 322 398 410 0.3 Luxembourg 103 186 251 261 0.2 Greece 130 137 191 202 0.2 Lithuenia 27 63 87 91 0.1 Estonia 21 36 34 40 0.0 Latvia 17 24 28 33 0.0 Cyprus 4 36 27 26 0.0 Malta 8 10 11 12 0.0EFTA 2,487 6,738 7,115 8,020 6.0 Switzerland 2,280 5,941 6,633 7,497 5.6 Norway 101 581 248 260 0.2 Liechtenstein 90 201 227 249 0.2Other European countries 2 2,023 4,669 5,150 5,278 4.0 Russia 1,238 2,317 2,295 2,332 1.8 Turkey 445 884 1,285 1,442 1.1 Ukraine 229 795 607 477 0.4
20102000

63
12.4 Imports of goods/country structure
country/regionmillion EUR
2015 12014
million EUR share (%)
1 provisional data source: STATISTICS AUSTRIA
OVERSEAS 13,033 19,377 25,097 26,018 19.6Asia 6,751 6,751 16,891 16,934 12.7 China 1,243 1,243 7,323 7,910 5.9 Japan 2,015 2,015 1,746 1,875 1.4 Kazakhstan 384 384 1,645 865 0.7 India 159 159 626 702 0.5 Taiwan 640 640 544 595 0.4Africa 1,078 1,997 2,121 1,764 1.3North America 4,616 3,624 4,782 5,691 4.3 United States 4,108 3,261 4,404 5,254 3.9 Canada 508 362 378 437 0.3Middle and South America 525 1,252 1,174 1,489 1.1Australia, Oceania 62 103 129 140 0.1
TOTAL IMPORTS OF GOODS 74,935 113,652 129,847 133,002 100.0
20102000
12. FOREIGN TRADE & BALANCE OF PAYMENTS
Austria's imports of goods 2015 by world regions, %-share
EFTA: 6.0 %
EU: 70.4 %
Asia: 12.7 %
others*: 5.4 %
America: 5.4 %
* Rest of Europe: 4.0 %, Africa: 1.3 %, Australia/Oceania: 0.1 %

64
12.5 Exports of goods/country structure
2 Europe excluding EU and EFTA
12. FOREIGN TRADE & BALANCE OF PAYMENTS
country/regionmillion EUR
2015 12014
million EUR share (%)
1 provisional data source: STATISTICS AUSTRIA
EUROPE 59,563 89,828 102,197 104,032 79.1EU 52,704 78,275 88,187 90,841 69.1 Germany 23,244 34,530 38,082 39,464 30.0 Italy 6,046 8,576 8,237 8,268 6.3 France 3,078 4,557 6,265 5,885 4.5 Czech Republic 1,999 4,145 4,355 4,766 3.6 Hungary 3,466 3,345 4,290 4,312 3.3 United Kingdom 3,039 3,319 3,943 4,174 3.2 Poland 1,110 2,745 3,840 4,135 3.1 Slovakia 768 2,276 2,608 2,715 2.1 Slovenia 1,229 2,221 2,534 2,690 2.0 Netherlands 1,852 2,003 2,140 2,294 1.7 Spain 1,586 1,719 2,143 2,136 1.6 Romania 506 1,691 1,881 1,992 1.5 Belgium 1,047 1,500 1,710 1,693 1.3 Sweden 813 1,191 1,376 1,438 1.1 Croatia 667 1,130 1,177 1,343 1.0 Denmark 513 601 701 700 0.5 Bulgaria 216 593 644 643 0.5 Finland 370 512 474 497 0.4 Greece 321 507 412 380 0.3 Portugal 341 339 298 317 0.2 Ireland 194 198 290 257 0.2 Lithuania 44 132 172 174 0.1 Luxembourg 122 122 165 162 0.1 Latvia 37 97 151 135 0.1 Estonia 34 95 119 121 0.1 Cyprus 38 77 83 67 0.1 Malta 23 33 43 39 0.0EFTA 5,018 6,053 7,713 8,098 6.2 Switzerland 4,423 5,199 6,686 7,121 5.4 Liechtenstein 316 425 543 534 0.4 Norway 252 418 470 426 0.3Other European countries 2 1,841 5,501 6,297 5,093 3.9 Russia 655 2,547 3,194 1,978 1.5 Turkey 482 1,062 1,207 1,403 1.1 Ukraine 213 667 512 335 0.3
20102000

65
12.5 Exports of goods/country structure
country/regionmillion EUR
2015 12014
million EUR
1 provisional data source: STATISTICS AUSTRIA
OVERSEAS 10,129 19,492 25,856 27,476 20.9Asia 4,195 9,660 12,213 12,489 9.5 China 490 2,807 3,380 3,305 2.5 Japan 914 1,023 1,331 1,350 1.0 South Korea 269 712 861 846 0.6 India 116 655 594 701 0.5 Hongkong 525 540 520 562 0.4Africa 811 1,425 1,668 1,724 1.3North America 4,007 5,704 8,791 10,111 7.7 United States 3,498 4,958 7,781 9,084 6.9 Canada 509 746 1,011 1,027 0.8Middle and South America 756 1,979 2,229 2,264 1.7Australia, Oceania 361 723 954 887 0.7
TOTAL EXPORTS OF GOODS 69,692 109,373 128,106 131,554 100.0
20102000
12. FOREIGN TRADE & BALANCE OF PAYMENTS
share (%)
Austria's exports of goods 2015 by world regions, %-share
EFTA: 6.2 %
EU: 69.1 %
Asia: 9.5 %
others*: 5.9 %
America: 9.4 %
* Rest of Europe: 3.9 %, Africa: 1.3 %, Australia/Oceania: 0.7 %

66
12.6 Balance of payments 1
deficit/surplus, billion EUR
12. FOREIGN TRADE & BALANCE OF PAYMENTS
1 2006 onwards: new concept (6th IMF-Balance of payments-Handbook); up to 2012: final data, 2013: revised data, 2014: provisional
source: OeNB
Current account balance - 1.51 + 8.45 + 5.06 + 4.73 + 6.30 + 6.38 + 8.64
Goods and services + 2.58 + 8.96 + 7.03 + 7.51 + 9.20 +12.07 +14.26
Goods - 3.31 - 1.38 - 3.63 - 3.16 - 1.00 + 1.56 + 2.63 Travel + 3.83 + 6.31 + 6.74 + 6.88 + 7.50 + 7.53 + 8.37
Other business related services + 1.12 + 2.67 + 3.14 + 2.97 + 2.05 + 2.39 + 2.48
Other services + 0.95 + 1.36 + 0.78 + 0.82 + 0.64 + 0.60 + 0.77
Primary income - 1.67 + 2.48 + 1.05 + 0.41 + 1.02 - 2.40 - 2.18Secundary income - 2.42 - 2.99 - 3.02 - 3.19 - 3.92 - 3.28 - 3.45
Property transfers - 0.44 + 0.18 - 0.33 - 0.45 - 0.49 - 0.46 - 1.93Capital balance - 4.05 + 3.37 + 4.75 + 5.22 +10.92 + 1.46 + 5.47
Direct investment - 3.37 + 5.76 +11.03 +10.21 + 7.89 - 3.70 + 8.09 Portfolio investment - 3.23 + 6.99 -15.82 - 5.75 - 2.19 +13.09 +14.53 Other investments + 3.13 -10.69 + 9.57 + 0.88 + 8.65 - 8.67 -16.33 Financial derivatives + 0.26 + 0.21 - 0.75 - 1.05 - 3.81 - 1.39 - 0.52 Official currency reserves - 0.84 + 1.10 + 0.72 + 0.94 + 0.40 + 2.13 - 0.31
Statistical discrepancy - 2.10 - 5.26 + 0.03 + 0.95 + 5.12 - 4.46 - 1.23
2010 2000 2011 2014 2015 2012 2013
Current account balance 2000 - 2017 % of GDP
3.3
2.32.1
1.6
2.1
-0.8-0.7
3.8
4.5
1.9
* 2016 and 2017: WIFO-forecast (March 2016)
2001 2002 2003 2004 2005 2006 2007 2008 2010 2011 2012 2013 2014 2000 2015 2016* 2017* 2008
1.51.6
2.92.6 2.6
3.1
1.9
3.2

67
12.7 Austrian direct investment abroadAustrian investment abroad 1, million EUR
(active direct investment)
12. FOREIGN TRADE & BALANCE OF PAYMENTS
source: OeNB
Belgium - 2 120 20 24 - 170 658
Denmark 36 - 855 - 61 - 24 - 34 25 Germany 1,976 673 - 952 2,924 - 402 586 Finland 15 - 139 - 67 - 139 - 89 35 France - 43 - 242 307 - 334 2,005 - 197 United Kingdom 136 - 45 - 208 1,130 - 699 - 40 Irland - 39 12 18 20 - 18 2 Italy 81 131 699 - 949 - 3 840 Croatia 140 161 90 - 8 - 25 1,319 Luxembourg 1 115 3,942 390 43 457 Netherlands 669 856 - 4,352 5,335 5,503 411 Poland 324 - 755 719 107 92 72 Romania 183 461 825 789 171 1,254 Sweden 79 - 237 141 - 1 - 47 - 61 Slovakia 194 288 209 - 233 - 416 - 18 Slovenia 111 116 - 62 - 135 434 391 Spain 7 169 121 - 74 - 28 - 14 Czech Republic 1,014 692 1,400 819 438 161 Hungary 386 136 227 - 357 164 - 243Euro area (19) 3,025 1,463 84 6,965 5,885 2,964EU (28) 5,336 1,137 3,215 9,549 6,228 5,721 Russia 73 1,235 686 917 409 - 15 Switzerland - 182 651 1,294 - 210 289 - 102 Turkey 2 1,251 1,540 - 1,503 272 - 37America 484 799 741 1,003 - 5,831 1,678 United States 377 165 537 1,602 1,003 452 Canada - 7 - 249 35 119 - 347 27Asia 90 1,350 764 - 457 1,353 2,109Africa - 7 66 111 40 41 - 1
TOTAL NET INVESTMENT 5,980 7,237 10,203 11,725 3,818 11,180
STOCK OF DIRECT INVESTMENT 26,630 135,936 158,826 168,107 178,377 191,295
2000 2010 2014 2015 2012 2013
country of destination
1 2006 onwards: new concept (6th IMF-Balance of payments-Handbook); up to 2013: final data, 2014: revised data, 2015: provisional
68
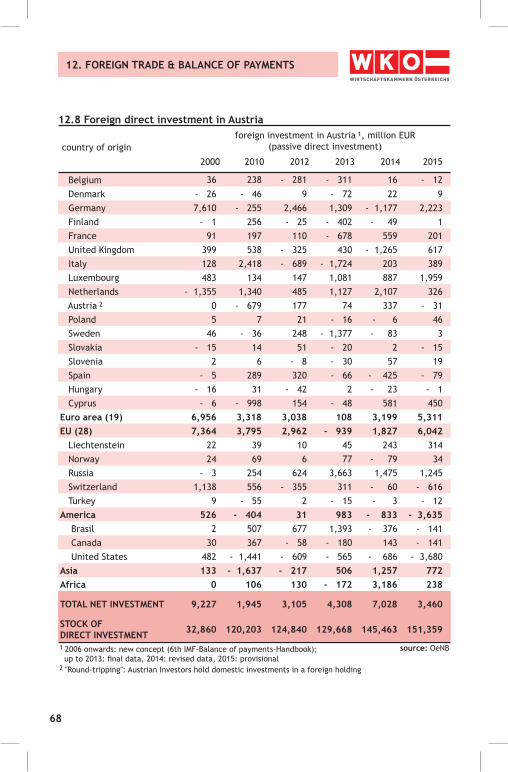
12.8 Foreign direct investment in Austriaforeign investment in Austria 1, million EUR
(passive direct investment)
12. FOREIGN TRADE & BALANCE OF PAYMENTS
source: OeNB
Belgium 36 238 - 281 - 311 16 - 12
Denmark - 26 - 46 9 - 72 22 9 Germany 7,610 - 255 2,466 1,309 - 1,177 2,223 Finland - 1 256 - 25 - 402 - 49 1 France 91 197 110 - 678 559 201 United Kingdom 399 538 - 325 430 - 1,265 617 Italy 128 2,418 - 689 - 1,724 203 389 Luxembourg 483 134 147 1,081 887 1,959 Netherlands - 1,355 1,340 485 1,127 2,107 326 Austria 2 0 - 679 177 74 337 - 31 Poland 5 7 21 - 16 - 6 46 Sweden 46 - 36 248 - 1,377 - 83 3 Slovakia - 15 14 51 - 20 2 - 15 Slovenia 2 6 - 8 - 30 57 19 Spain - 5 289 320 - 66 - 425 - 79 Hungary - 16 31 - 42 2 - 23 - 1 Cyprus - 6 - 998 154 - 48 581 450Euro area (19) 6,956 3,318 3,038 108 3,199 5,311EU (28) 7,364 3,795 2,962 - 939 1,827 6,042 Liechtenstein 22 39 10 45 243 314 Norway 24 69 6 77 - 79 34 Russia - 3 254 624 3,663 1,475 1,245 Switzerland 1,138 556 - 355 311 - 60 - 616 Turkey 9 - 55 2 - 15 - 3 - 12America 526 - 404 31 983 - 833 - 3,635 Brasil 2 507 677 1,393 - 376 - 141 Canada 30 367 - 58 - 180 143 - 141 United States 482 - 1,441 - 609 - 565 - 686 - 3,680Asia 133 - 1,637 - 217 506 1,257 772Africa 0 106 130 - 172 3,186 238
TOTAL NET INVESTMENT 9,227 1,945 3,105 4,308 7,028 3,460
STOCK OF DIRECT INVESTMENT 32,860 120,203 124,840 129,668 145,463 151,359
2000 2010 2012 2013
country of origin
2014 2015
1 2006 onwards: new concept (6th IMF-Balance of payments-Handbook); up to 2013: final data, 2014: revised data, 2015: provisional2 "Round-tripping": Austrian Investors hold domestic investments in a foreign holding