12 Chapter 3 PEG 400-MATRIX EFFECTS -...
24
PEG 400-Matrix Effects Chapter 3 Page 56 CHAPTER 3 PEG 400-Matrix Effects
Transcript of 12 Chapter 3 PEG 400-MATRIX EFFECTS -...

PEG 400-Matrix Effects Chapter 3
Page 56
CHAPTER 3
PEG 400-Matrix
Effects

PEG 400-Matrix Effects Chapter 3
Page 57
Identification and Reduction of Matrix Effects caused by Polyethylene glycol 400
in bioanalysis using Liquid chromatography/Tandem mass spectrometry
Table of Contents
3.1 Introduction ........................................................................................................ 58
3.2 Experimental section ......................................................................................... 58
3.2.1 Materials ...................................................................................................... 58
3.2.2 Physical parameters (log D at pH 7.40) ....................................................... 59
3.2.3 Preparation of plasma samples-PEG 400 investigations ............................. 59
3.2.3.1 Preparation of master and working stock solutions ............................. 59
3.2.3.2 Sample Preparation .............................................................................. 59
3.2.3.2.1 Protein Precipitation (PPT) .............................................................. 59
3.2.3.2.2 Liquid-Liquid Extraction (LLE) ...................................................... 60
3.2.3.3 LC-MS/MS analysis............................................................................. 60
3.3 Results and discussion ....................................................................................... 61
3.3.1 Physical parameters (log D at pH 7.40) ....................................................... 61
3.3.2 Preparation of plasma samples-Polyethyleneglycol 400 investigations ...... 61
3.3.2.1 Preparation of master and working stock solutions ............................. 61
3.3.2.2 LC-MS/MS analysis............................................................................. 63
3.3.2.2.1 Propranolol ....................................................................................... 64
3.3.2.2.2 Caffeine ............................................................................................ 66
3.3.2.2.3 Ketoconazole.................................................................................... 66
3.3.2.2.4 Diltiazem .......................................................................................... 69
3.3.2.2.5 Ranitidine ......................................................................................... 71
3.3.2.2.6 Atenolol............................................................................................ 71
3.3.2.2.7 Telmisartan ...................................................................................... 74
3.3.2.2.8 Metoprolol........................................................................................ 74
3.3.2.2.9 Warfarin ........................................................................................... 74
3.4 Conclusion .......................................................................................................... 78
3.5 References ........................................................................................................... 79
PEG 400-Matrix Effects Chapter 3
Page 58
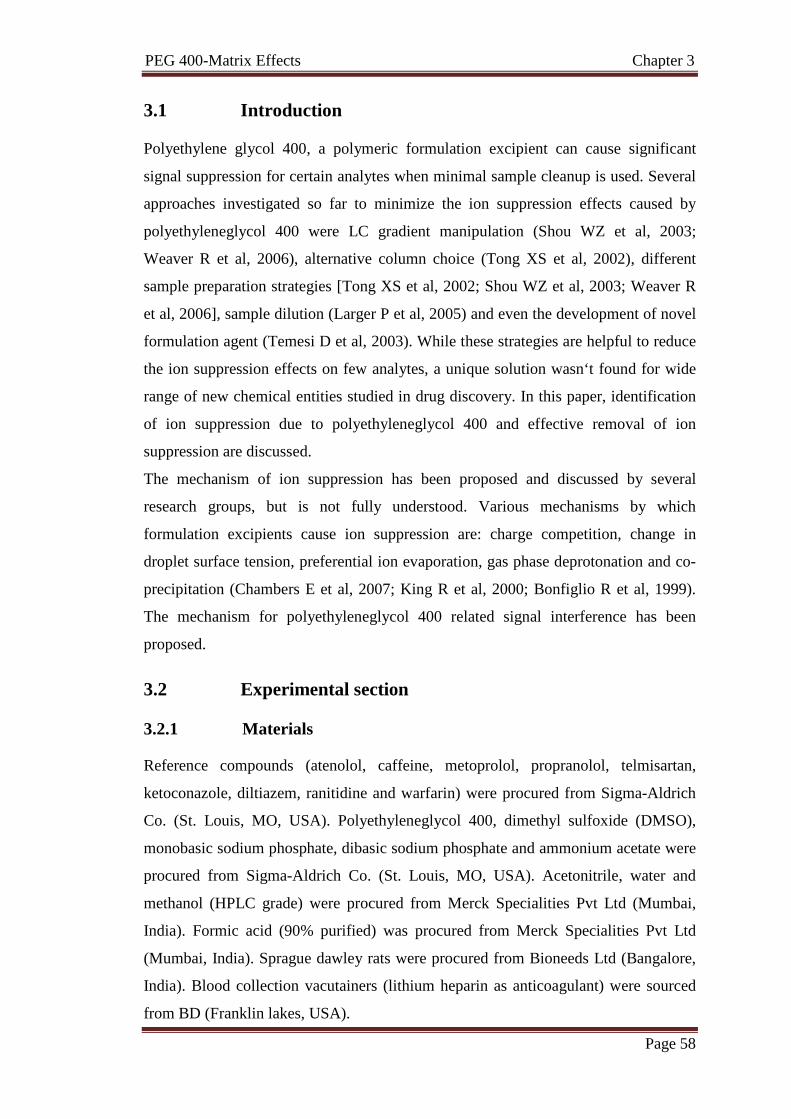
3.1 Introduction
Polyethylene glycol 400, a polymeric formulation excipient can cause significant
signal suppression for certain analytes when minimal sample cleanup is used. Several
approaches investigated so far to minimize the ion suppression effects caused by
polyethyleneglycol 400 were LC gradient manipulation (Shou WZ et al, 2003;
Weaver R et al, 2006), alternative column choice (Tong XS et al, 2002), different
sample preparation strategies [Tong XS et al, 2002; Shou WZ et al, 2003; Weaver R
et al, 2006], sample dilution (Larger P et al, 2005) and even the development of novel
formulation agent (Temesi D et al, 2003). While these strategies are helpful to reduce
the ion suppression effects on few analytes, a unique solution wasn‘t found for wide
range of new chemical entities studied in drug discovery. In this paper, identification
of ion suppression due to polyethyleneglycol 400 and effective removal of ion
suppression are discussed.
The mechanism of ion suppression has been proposed and discussed by several
research groups, but is not fully understood. Various mechanisms by which
formulation excipients cause ion suppression are: charge competition, change in
droplet surface tension, preferential ion evaporation, gas phase deprotonation and co-
precipitation (Chambers E et al, 2007; King R et al, 2000; Bonfiglio R et al, 1999).
The mechanism for polyethyleneglycol 400 related signal interference has been
proposed.
3.2 Experimental section
3.2.1 Materials
Reference compounds (atenolol, caffeine, metoprolol, propranolol, telmisartan,
ketoconazole, diltiazem, ranitidine and warfarin) were procured from Sigma-Aldrich
Co. (St. Louis, MO, USA). Polyethyleneglycol 400, dimethyl sulfoxide (DMSO),
monobasic sodium phosphate, dibasic sodium phosphate and ammonium acetate were
procured from Sigma-Aldrich Co. (St. Louis, MO, USA). Acetonitrile, water and
methanol (HPLC grade) were procured from Merck Specialities Pvt Ltd (Mumbai,
India). Formic acid (90% purified) was procured from Merck Specialities Pvt Ltd
(Mumbai, India). Sprague dawley rats were procured from Bioneeds Ltd (Bangalore,
India). Blood collection vacutainers (lithium heparin as anticoagulant) were sourced
from BD (Franklin lakes, USA).

PEG 400-Matrix Effects Chapter 3
Page 59
3.2.2 Physical parameters (log D at pH 7.40)
The log of octanol-buffer partition coefficients (log D) was estimated for reference
compounds using saturated octanol and phosphate buffer (pH 7.40). 15 µL of 10 mM
stock of reference compounds were spiked in 500 µL of saturated octanol and vortex
mixed at 1200 rpm for 10 min. Equivalent volume of saturated phosphate buffer (pH
7.40) was added and vortex mixed at 1200 rpm for 1 h. The sample plate was
centrifuged at 3350 g for 30 min to ensure complete separation of both phases.
Samples were analyzed on HPLC (Shimadzu, Japan) at a detection wavelength of
254 nm. Mobile phases consisted of 0.1% formic acid in water and 100% acetonitrile.
Measurements were performed on a C18 (Waters XBridge, 50 x 4.6 mm, 3.5 µm)
column.
3.2.3 Preparation of plasma samples-PEG 400 investigations
3.2.3.1 Preparation of master and working stock solutions
Master stock solutions of atenolol, caffeine, metaprolol, telmisartan, propranolol,
diltiazem, ketoconazole, ranitidine and warfarin (1 mg/mL) were prepared in DMSO.
Working standard solutions of polyethyleneglycol 400 were prepared by serial
dilution from master stock (polyethyleneglycol 400 provided by supplier with density
of 1.126 g/mL was used as master stock) at 25 times higher concentration than plasma
concentrations in acetonitrile: water: DMSO (2:2:1). A total of twelve working
concentrations of polyethyleneglycol 400 were prepared. Plasma concentrations (0.05,
0.125, 0.25, 0.50, 1.00, 1.25, 2.50, 5.00, 7.50, 10.00, 12.50, 15.00 mg/mL) of
polyethyleneglycol 400 were prepared by spiking 2 µL of working concentrations in
48 µL of blank rat plasma. Pooled working stock solution of reference compounds at
1000 ng/mL concentrations was prepared in acetonitrile: water (1:1). Master stock and
working stock solutions were stored at 4oC, when not in use.
3.2.3.2 Sample Preparation
3.2.3.2.1 Protein Precipitation (PPT)
A 50 µL aliquot of plasma (blank plasma, plasma samples spiked with
polyethyleneglycol 400) was pipette transferred in to a 96 well polypropylene plate
and extracted with 200 µL of acetonitrile. Samples were vortex mixed for 10 min at
1200 rpm and centrifuged at 3350 g for 10 min at 4oC. 150 µL of supernatant was

PEG 400-Matrix Effects Chapter 3
Page 60
pipette transferred to a fresh analysis plate and diluted with 150 µL of pooled working
stock solution of reference compounds. 10 µL were injected for LC-MS/MS analysis.
3.2.3.2.2 Liquid-Liquid Extraction (LLE)
A 50 µL aliquot of plasma (blank plasma, plasma samples spiked with
polyethyleneglycol 400) was pipette transferred in to a 96 well polypropylene plate
and extracted with 1000 µL of ethyl acetate, tert-butyl-methyl ether (TBME) and
hexane individually. Samples were vortex mixed for 10 min at 1000 rpm and
centrifuged at 3350 g for 10 min at 4oC. 800 µL of supernatant was pipette transferred
to a fresh evaporation plate and evaporated to dryness under nitrogen at 40oC for
10 min. After evaporation, samples were reconstituted with 300 µL of pooled working
stock solution of reference compounds and 10 µL were injected for LC-MS/MS
analysis.
3.2.3.3 LC-MS/MS analysis
All mass spectrometric estimations were performed on a sciex 3200 QTrap triple
quadrupole instrument with turboionspray (AB Sciex, Toronto, Canada). The HPLC
system consisted two of LC20AD UFLC pumps and a SIL HTC autosampler
(Shimadzu, Kyoto, Japan). The stationary phase was XBridge C18 with 3.5 µm
particle diameter (Waters, Ireland). The column dimensions were 50 x 4.6 mm. The
mobile phase flow rate was 1.0 mL/min with a split ratio of 1:1 to the ionization
source. The mobile phase consisted of the following combinations of aqueous and
organic modifiers: 1) 0.1% formic acid in water, 100% acetonitrile (FA-ACN)
2) 0.1% formic acid in water, 100% methanol (FA-MEOH) 3) 10 mM ammonium
acetate in water, 100% acetonitrile (AMM. ACET.-ACN) 4) 10 mM ammonium
acetate in water, 100% methanol (AMM. ACET.-MEOH). The column and
autosampler were maintained at 40oC and 4oC respectively. The turboionspray source
was operated with typical settings as follows: ionization mode, positive; curtain gas,
15 psi; nebulizer gas (GS1), 50 psi; heater gas (GS2), 50 psi (ESI); ionspray voltage
(IS), 5500V (ESI); nebulizer current (NC), 5A (APCI); temperature, 550oC. Multiple
reaction monitoring (MRM) mode was employed for the quantification of reference
compounds and PEG 400. List of MRM used for analytical measurements was
presented in Table 3.1. Peak areas for all components were automatically integrated
using Analyst software version 1.5.

PEG 400-Matrix Effects Chapter 3
Page 61
3.3 Results and discussion
3.3.1 Physical parameters (log D at pH 7.40)
Sample was injected from both octanol and buffer phases by adjusting the needle
height of the autosampler. LC generic gradient with a short run time of 5 min was
developed (Table 3.2). A penetration height of 40 mm was used to inject the sample
from octanol phase and a penetration height of 50 mm was used to inject the sample
from buffer phase. A different volume of sample was injected from both the buffer
(100 µL) and octanol phase (10 µL) to accurately measure log D in the range of -1.27
to 3.74. Calculated Log D values of reference compounds were presented in
Table 3.3.
Table 3.1: List of MRM used for quantifying the reference compounds
Compound Name
Q1 Mass (Da)
Q3 Mass (Da)
Dwell Time
(msec)
Declustering Potential (V)
Collision energy
(V)
Propranolol 260.10 116.20 100 40 25
Caffeine 195.10 137.90 100 45 25
Ketoconazole 531.10 82.10 100 80 80
Diltiazem 415.10 178.10 100 40 32
Ranitidine 315.10 176.10 100 25 22
Atenolol 267.10 145.10 100 40 32
Telmisartan 515.30 276.10 100 65 64
Metoprolol 268.10 116.00 100 50 25
Warfarin 309.20 163.00 100 50 21
3.3.2 Preparation of plasma samples - Polyethyleneglycol 400
investigations
3.3.2.1 Preparation of master and working stock solutions
Concentrations of PEG 400 used to study the matrix effects were decided based upon
the plasma concentrations of the excipient in intravenous (Figure 2.10) and oral
(Figure 2.11) route of administration. Plasma concentrations of excipient ranged from

PEG 400-Matrix Effects Chapter 3
Page 62
5-10 mg/mL in the initial sampling points after intravenous route of administration.
Based on the physiological concentrations of excipient and possibility of still higher
dose of excipient to be administered, a maximum working concentration of 15 mg/mL
was used to study the matrix effects of PEG 400. Lower working concentration of
0.05 mg/mL that was 300 fold less than the higher working concentration of PEG 400
was prepared along with intermediate serial dilution concentrations to understand if
the dilution of samples post sample preparation helps in reducing the matrix effects
and to understand the concentration from which the excipient shows matrix effects on
the test compound studied.
Table 3.2: LC Generic gradient for measurement of lipophilicity of reference
compounds
Time (min) Flow Rate (mL/min)
%A (Aqueous Modifier)
%B (Organic Modifier)
0.01 1.00 95 5
2.00 1.00 35 65
3.00 1.00 5 95
4.00 1.00 5 95
4.01 1.00 95 5
5.00 1.00 95 5
Table 3.3: Calculated log D values of reference compounds
Compound Name Log D Value
Propranolol 1.27
Caffeine -0.09
Ketoconazole 3.74
Diltiazem 2.05
Ranitidine -0.12
Atenolol -1.29
Telmisartan 1.90
Metoprolol -0.30
Warfarin 0.80
PEG 400-Matrix Effects Chapter 3
Page 63
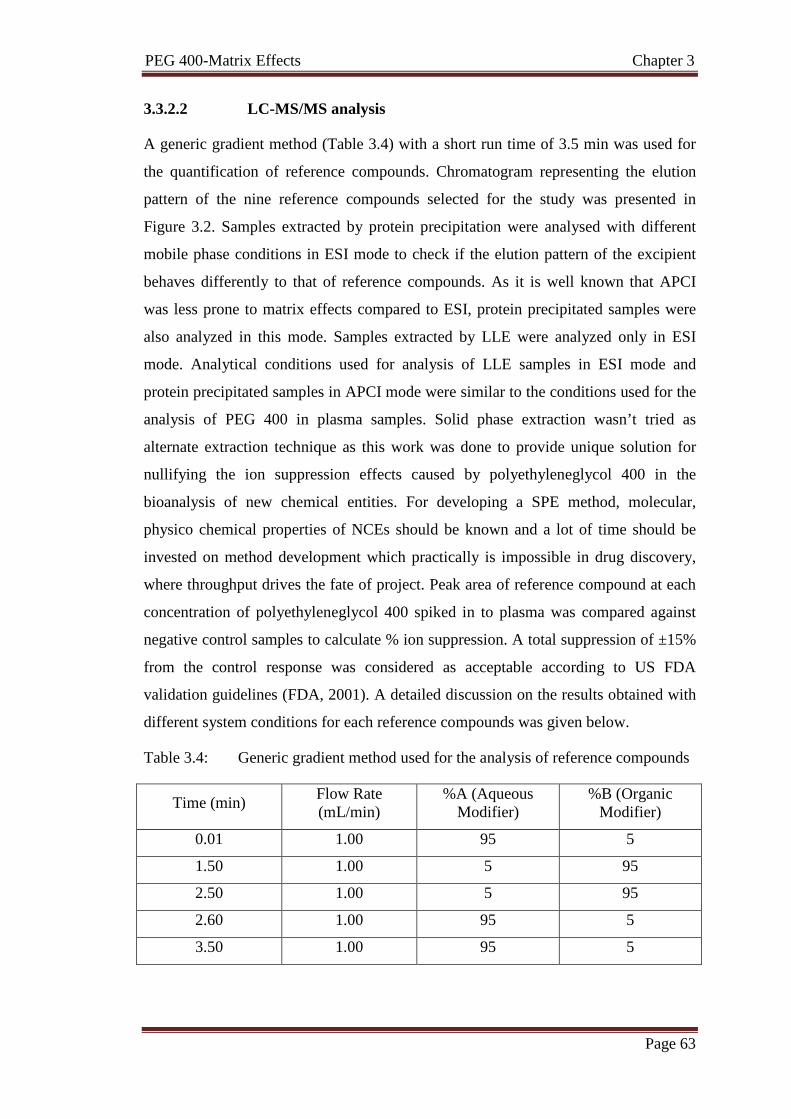
3.3.2.2 LC-MS/MS analysis
A generic gradient method (Table 3.4) with a short run time of 3.5 min was used for
the quantification of reference compounds. Chromatogram representing the elution
pattern of the nine reference compounds selected for the study was presented in
Figure 3.2. Samples extracted by protein precipitation were analysed with different
mobile phase conditions in ESI mode to check if the elution pattern of the excipient
behaves differently to that of reference compounds. As it is well known that APCI
was less prone to matrix effects compared to ESI, protein precipitated samples were
also analyzed in this mode. Samples extracted by LLE were analyzed only in ESI
mode. Analytical conditions used for analysis of LLE samples in ESI mode and
protein precipitated samples in APCI mode were similar to the conditions used for the
analysis of PEG 400 in plasma samples. Solid phase extraction wasn’t tried as
alternate extraction technique as this work was done to provide unique solution for
nullifying the ion suppression effects caused by polyethyleneglycol 400 in the
bioanalysis of new chemical entities. For developing a SPE method, molecular,
physico chemical properties of NCEs should be known and a lot of time should be
invested on method development which practically is impossible in drug discovery,
where throughput drives the fate of project. Peak area of reference compound at each
concentration of polyethyleneglycol 400 spiked in to plasma was compared against
negative control samples to calculate % ion suppression. A total suppression of ±15%
from the control response was considered as acceptable according to US FDA
validation guidelines (FDA, 2001). A detailed discussion on the results obtained with
different system conditions for each reference compounds was given below.
Table 3.4: Generic gradient method used for the analysis of reference compounds
Time (min) Flow Rate (mL/min)
%A (Aqueous Modifier)
%B (Organic Modifier)
0.01 1.00 95 5
1.50 1.00 5 95
2.50 1.00 5 95
2.60 1.00 95 5
3.50 1.00 95 5

PEG 400-Matrix Effects Chapter 3
Page 64
3.3.2.2.1 Propranolol
At an excipient concentration of 15 mg/mL, propranolol had >75% ion suppression
using ethyl acetate as extraction solvent (Figure 3.1; Table 3.5). Sample preparation
with hexane, TBME and ionization by APCI mode of ionization for protein
precipitation samples proved to be the best methodologies for the analysis of
propranolol (Figure 3.1; Table 3.5). Ion suppression at different concentrations of
polyethyleneglycol 400 under different analytical conditions was shown in Figure 3.3;
Table 3.6.
Figure 3.1: Pictorial representation of percent control response for propranolol,
caffeine, ketoconazole, diltiazem, ranitidine, atenolol, telmisartan,
metoprolol and warfarin at 15 mg/mL concentration of PEG 400 under
different analytical conditions

PEG 400-Matrix Effects Chapter 3
Page 65
XIC of +MRM (10 pairs): 260... Max. 1.3e5 cps.
1.0 2.0 3.0Time, min
0.00
5.00e4
1.00e5
1.50e5
2.00e5
2.50e5
3.00e5
3.50e5
4.00e5
4.50e5
5.00e5
5.50e5
6.00e5
6.50e5
7.00e5
7.50e5
8.00e5
8.50e5
9.00e5
9.50e5
1.00e6
1.05e6
1.10e6
1.15e6In
tens
ity, c
ps
1.75
Figure 3.2: Chromatogram representing the elution pattern of nine reference
compounds selected for studying matrix effects caused by PEG 400
DILTIAZEM
KETOCONAZOLE
PROPRANOLOL
TELMISARTAN
WARFARIN
METOPROLOL
CAFFEINE
RANITIDINE
ATENOLOL
PEG 400-Matrix Effects Chapter 3
Page 66
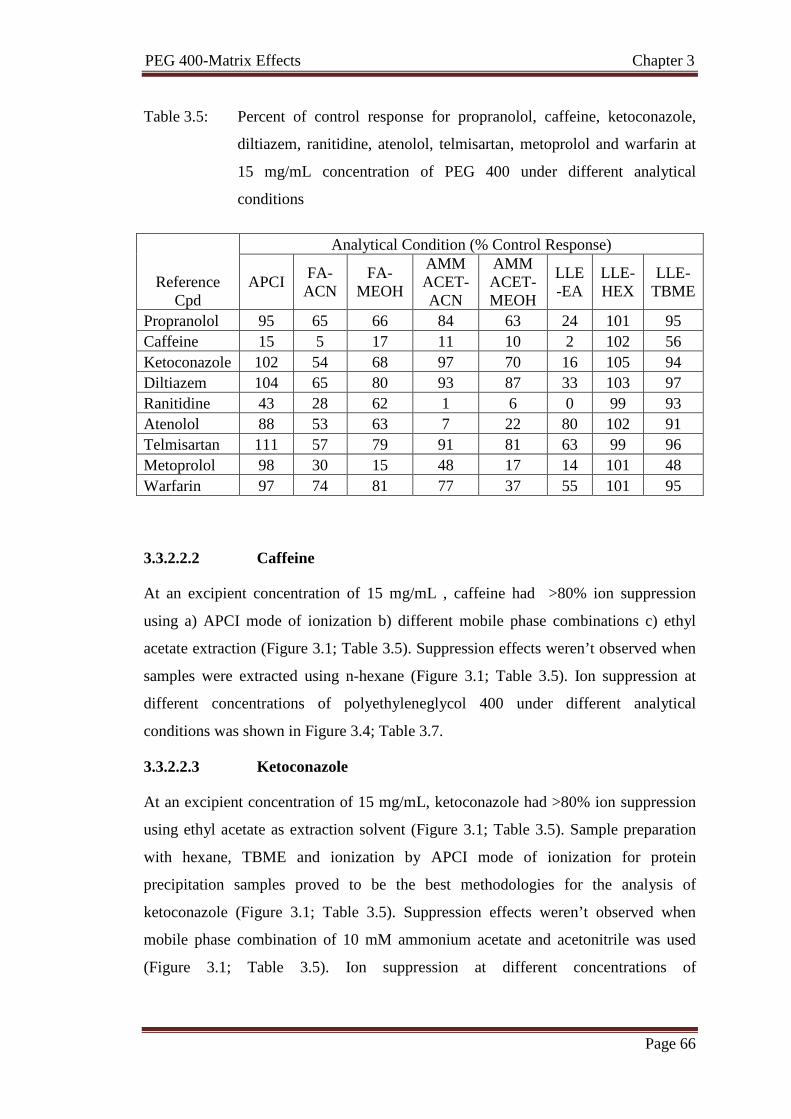
Table 3.5: Percent of control response for propranolol, caffeine, ketoconazole,
diltiazem, ranitidine, atenolol, telmisartan, metoprolol and warfarin at
15 mg/mL concentration of PEG 400 under different analytical
conditions
Reference Cpd
Analytical Condition (% Control Response)
APCI FA-ACN
FA-MEOH
AMM ACET-ACN
AMM ACET-MEOH
LLE-EA
LLE-HEX
LLE-TBME
Propranolol 95 65 66 84 63 24 101 95 Caffeine 15 5 17 11 10 2 102 56 Ketoconazole 102 54 68 97 70 16 105 94 Diltiazem 104 65 80 93 87 33 103 97 Ranitidine 43 28 62 1 6 0 99 93 Atenolol 88 53 63 7 22 80 102 91 Telmisartan 111 57 79 91 81 63 99 96 Metoprolol 98 30 15 48 17 14 101 48 Warfarin 97 74 81 77 37 55 101 95
3.3.2.2.2 Caffeine
At an excipient concentration of 15 mg/mL , caffeine had >80% ion suppression
using a) APCI mode of ionization b) different mobile phase combinations c) ethyl
acetate extraction (Figure 3.1; Table 3.5). Suppression effects weren’t observed when
samples were extracted using n-hexane (Figure 3.1; Table 3.5). Ion suppression at
different concentrations of polyethyleneglycol 400 under different analytical
conditions was shown in Figure 3.4; Table 3.7.
3.3.2.2.3 Ketoconazole
At an excipient concentration of 15 mg/mL, ketoconazole had >80% ion suppression
using ethyl acetate as extraction solvent (Figure 3.1; Table 3.5). Sample preparation
with hexane, TBME and ionization by APCI mode of ionization for protein
precipitation samples proved to be the best methodologies for the analysis of
ketoconazole (Figure 3.1; Table 3.5). Suppression effects weren’t observed when
mobile phase combination of 10 mM ammonium acetate and acetonitrile was used
(Figure 3.1; Table 3.5). Ion suppression at different concentrations of
PEG 400-Matrix Effects Chapter 3
Page 67
polyethyleneglycol 400 under different analytical conditions was shown in Figure 3.5;
Table 3.8.
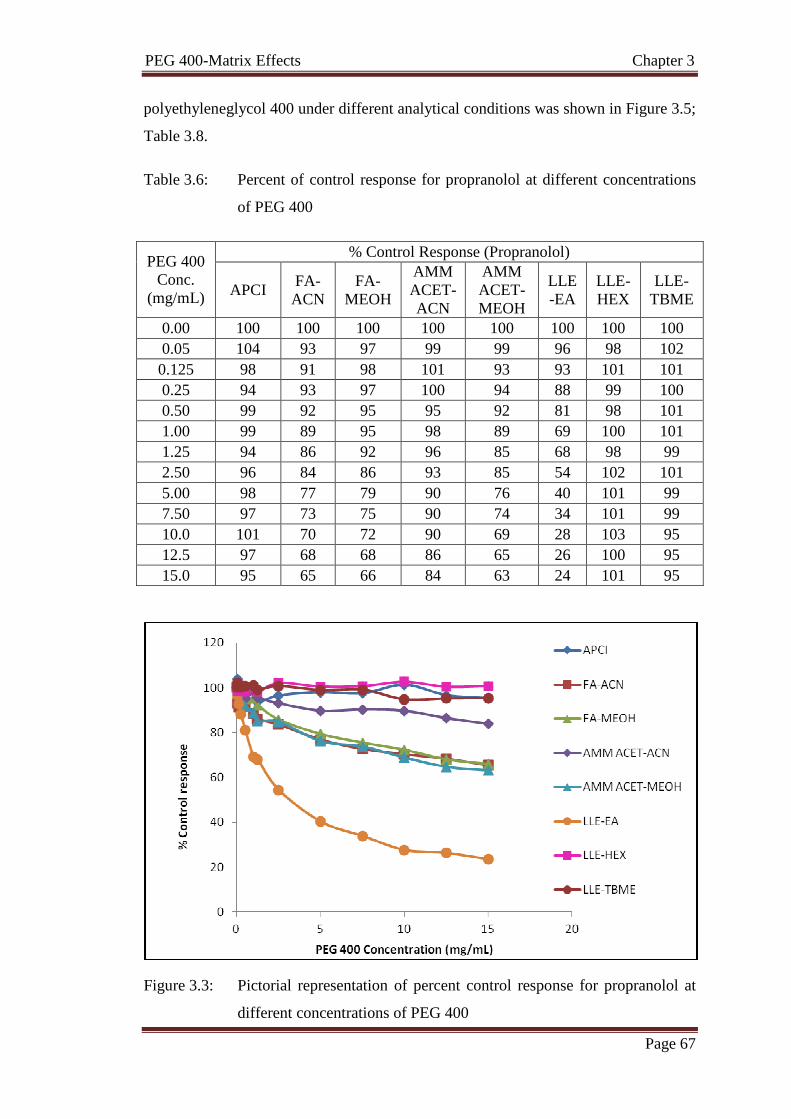
Table 3.6: Percent of control response for propranolol at different concentrations
of PEG 400
PEG 400 Conc.
(mg/mL)
% Control Response (Propranolol)
APCI FA-ACN
FA-MEOH
AMM ACET-ACN
AMM ACET-MEOH
LLE-EA
LLE-HEX
LLE-TBME
0.00 100 100 100 100 100 100 100 100 0.05 104 93 97 99 99 96 98 102 0.125 98 91 98 101 93 93 101 101 0.25 94 93 97 100 94 88 99 100 0.50 99 92 95 95 92 81 98 101 1.00 99 89 95 98 89 69 100 101 1.25 94 86 92 96 85 68 98 99 2.50 96 84 86 93 85 54 102 101 5.00 98 77 79 90 76 40 101 99 7.50 97 73 75 90 74 34 101 99 10.0 101 70 72 90 69 28 103 95 12.5 97 68 68 86 65 26 100 95 15.0 95 65 66 84 63 24 101 95
Figure 3.3: Pictorial representation of percent control response for propranolol at
different concentrations of PEG 400
PEG 400-Matrix Effects Chapter 3
Page 68
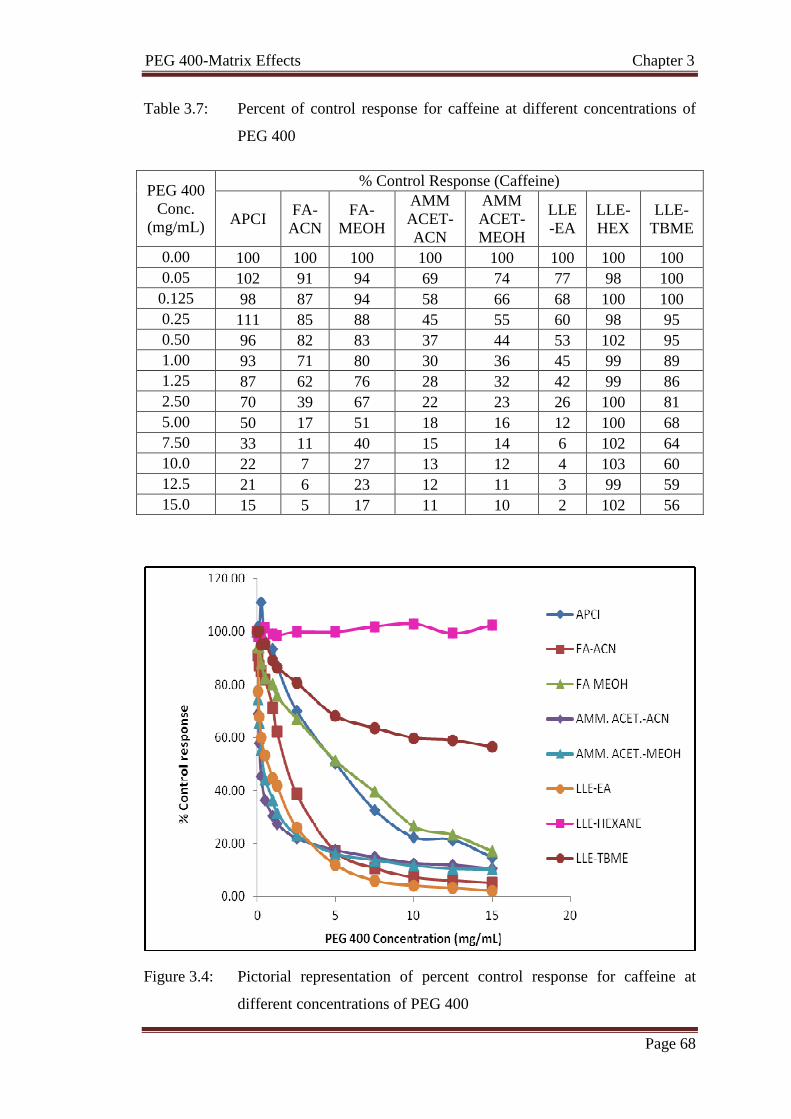
Table 3.7: Percent of control response for caffeine at different concentrations of
PEG 400
PEG 400 Conc.
(mg/mL)
% Control Response (Caffeine)
APCI FA-ACN
FA-MEOH
AMM ACET-ACN
AMM ACET-MEOH
LLE-EA
LLE-HEX
LLE-TBME
0.00 100 100 100 100 100 100 100 100 0.05 102 91 94 69 74 77 98 100 0.125 98 87 94 58 66 68 100 100 0.25 111 85 88 45 55 60 98 95 0.50 96 82 83 37 44 53 102 95 1.00 93 71 80 30 36 45 99 89 1.25 87 62 76 28 32 42 99 86 2.50 70 39 67 22 23 26 100 81 5.00 50 17 51 18 16 12 100 68 7.50 33 11 40 15 14 6 102 64 10.0 22 7 27 13 12 4 103 60 12.5 21 6 23 12 11 3 99 59 15.0 15 5 17 11 10 2 102 56
Figure 3.4: Pictorial representation of percent control response for caffeine at
different concentrations of PEG 400
PEG 400-Matrix Effects Chapter 3
Page 69
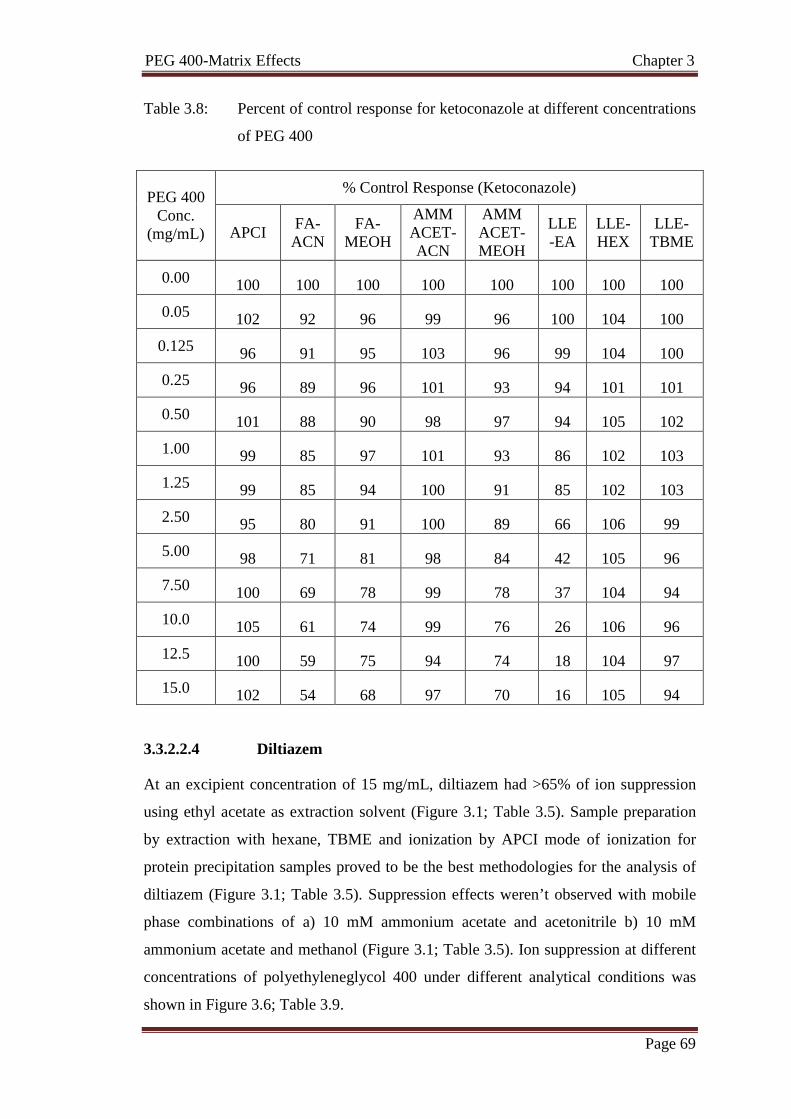
Table 3.8: Percent of control response for ketoconazole at different concentrations
of PEG 400
PEG 400 Conc.
(mg/mL)
% Control Response (Ketoconazole)
APCI FA-ACN
FA-MEOH
AMM ACET-ACN
AMM ACET-MEOH
LLE-EA
LLE-HEX
LLE-TBME
0.00 100 100 100 100 100 100 100 100
0.05 102 92 96 99 96 100 104 100
0.125 96 91 95 103 96 99 104 100
0.25 96 89 96 101 93 94 101 101
0.50 101 88 90 98 97 94 105 102
1.00 99 85 97 101 93 86 102 103
1.25 99 85 94 100 91 85 102 103
2.50 95 80 91 100 89 66 106 99
5.00 98 71 81 98 84 42 105 96
7.50 100 69 78 99 78 37 104 94
10.0 105 61 74 99 76 26 106 96
12.5 100 59 75 94 74 18 104 97
15.0 102 54 68 97 70 16 105 94
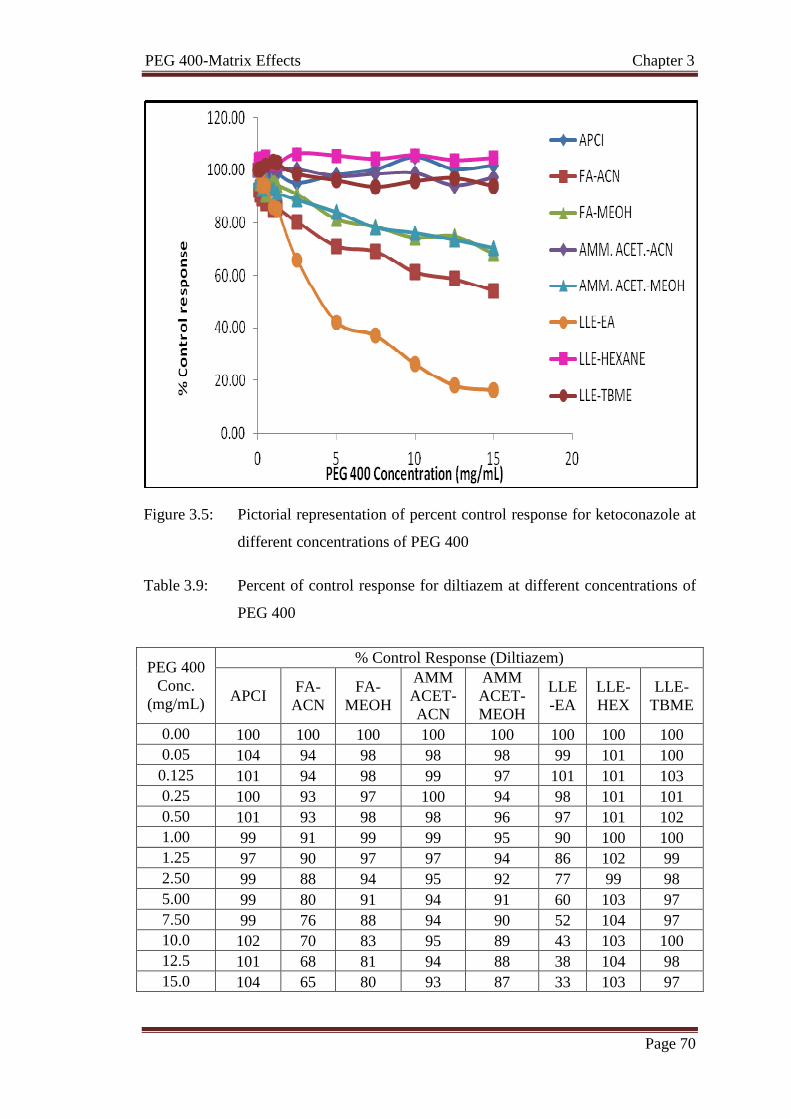
3.3.2.2.4 Diltiazem
At an excipient concentration of 15 mg/mL, diltiazem had >65% of ion suppression
using ethyl acetate as extraction solvent (Figure 3.1; Table 3.5). Sample preparation
by extraction with hexane, TBME and ionization by APCI mode of ionization for
protein precipitation samples proved to be the best methodologies for the analysis of
diltiazem (Figure 3.1; Table 3.5). Suppression effects weren’t observed with mobile
phase combinations of a) 10 mM ammonium acetate and acetonitrile b) 10 mM
ammonium acetate and methanol (Figure 3.1; Table 3.5). Ion suppression at different
concentrations of polyethyleneglycol 400 under different analytical conditions was
shown in Figure 3.6; Table 3.9.
PEG 400-Matrix Effects Chapter 3
Page 70
Figure 3.5: Pictorial representation of percent control response for ketoconazole at
different concentrations of PEG 400
Table 3.9: Percent of control response for diltiazem at different concentrations of
PEG 400
PEG 400 Conc.
(mg/mL)
% Control Response (Diltiazem)
APCI FA-ACN
FA-MEOH
AMM ACET-ACN
AMM ACET-MEOH
LLE-EA
LLE-HEX
LLE-TBME
0.00 100 100 100 100 100 100 100 100 0.05 104 94 98 98 98 99 101 100 0.125 101 94 98 99 97 101 101 103 0.25 100 93 97 100 94 98 101 101 0.50 101 93 98 98 96 97 101 102 1.00 99 91 99 99 95 90 100 100 1.25 97 90 97 97 94 86 102 99 2.50 99 88 94 95 92 77 99 98 5.00 99 80 91 94 91 60 103 97 7.50 99 76 88 94 90 52 104 97 10.0 102 70 83 95 89 43 103 100 12.5 101 68 81 94 88 38 104 98 15.0 104 65 80 93 87 33 103 97

PEG 400-Matrix Effects Chapter 3
Page 71
Figure 3.6: Pictorial representation of percent control response for diltiazem at
different concentrations of PEG 400
3.3.2.2.5 Ranitidine
At an excipient concentration of 15 mg/mL, ranitidine had >35% ion suppression
using a) APCI mode of ionization b) different mobile phase combinations c) ethyl
acetate extraction (Figure 3.1; Table 3.5). Suppression effects weren’t observed when
samples were extracted using n-hexane, TBME (Figure 3.1; Table 3.5). Ion
suppression at different concentrations of polyethyleneglycol 400 under different
analytical conditions was shown in Figure 3.7; Table 3.10.
3.3.2.2.6 Atenolol
At an excipient concentration of 15 mg/mL, atenolol had >90% ion suppression using
mobile phase combination of 10mM ammonium acetate and acetonitrile (Figure 3.1;
Table 3.5). Sample preparation by extraction with hexane, TBME and ionization by
APCI mode of ionization for protein precipitation samples proved to be the best
methodologies for the analysis of atenolol (Figure 3.1; Table 3.5). Ion suppression at
different concentrations of polyethyleneglycol 400 under different analytical
conditions was shown in Figure 3.8; Table 3.11.

PEG 400-Matrix Effects Chapter 3
Page 72
Table 3.10: Percent of control response for ranitidine at different concentrations of
PEG 400
PEG 400 Conc.
(mg/mL)
% Control Response (Ranitidine)
APCI FA-ACN
FA-MEOH
AMM ACET-ACN
AMM ACET-MEOH
LLE-EA
LLE-HEX
LLE-TBME
0.00 100 100 100 100 100 100 100 100 0.05 110 82 93 48 91 102 100 104 0.125 110 69 94 33 83 98 100 102 0.25 112 61 91 21 72 99 99 103 0.50 107 52 89 10 58 93 97 100 1.00 99 46 91 6 44 69 102 107 1.25 96 42 87 5 37 65 99 103 2.50 82 34 83 4 24 20 100 100 5.00 66 31 76 3 15 2 96 101 7.50 57 28 75 4 10 2 103 97 10.0 51 27 69 3 8 0 101 99 12.5 46 27 67 2 6 0 99 97 15.0 43 28 62 1 6 0 99 93
Figure 3.7: Pictorial representation of percent control response for ranitidine at
different concentrations of PEG 400

PEG 400-Matrix Effects Chapter 3
Page 73
Table 3.11: Percent of control response for atenolol at different concentrations of
PEG 400
PEG 400 Conc.
(mg/mL)
% Control Response (Atenolol)
APCI FA-ACN
FA-MEOH
AMM ACET-ACN
AMM ACET-MEOH
LLE-EA
LLE-HEX
LLE-TBME
0.00 100 100 100 100 100 100 100 100 0.05 100 86 92 82 95 100 102 102 0.125 98 82 90 73 89 98 102 102 0.25 101 74 88 59 84 96 102 100 0.50 99 70 84 44 79 96 99 100 1.00 97 68 87 34 73 95 100 99 1.25 93 66 82 28 67 94 101 99 2.50 94 61 84 20 55 97 100 96 5.00 96 58 74 13 41 91 103 98 7.50 91 55 71 10 34 86 103 94 10.0 92 52 69 9 28 82 102 92 12.5 88 50 67 8 26 82 101 92 15.0 88 53 63 7 22 80 102 91
Figure 3.8: Pictorial representation of percent control response for atenolol at
different concentrations of PEG 400
PEG 400-Matrix Effects Chapter 3
Page 74
3.3.2.2.7 Telmisartan
At an excipient concentration of 15 mg/mL, telmisartan had >50% ion suppression
using mobile phase combination of formic acid and acetonitrile (Figure 3.1; Table
3.5). Sample preparation by extraction with hexane, TBME and ionization by APCI
mode of ionization for protein precipitation samples proved to be the best
methodologies for the analysis of telmisartan (Figure 3.1; Table 3.5). Suppression
effects weren’t observed using mobile phase combination of 10mM ammonium
acetate and acetonitrile (Figure 3.1; Table 3.5). Ion suppression at different
concentrations of polyethyleneglycol 400 under different analytical conditions was
shown in Figure 3.9; Table 3.12.
3.3.2.2.8 Metoprolol
At an excipient concentration of 15 mg/mL, metoprolol had >70% ion suppression
using a) ethyl acetate extraction b) different mobile phase combinations (Figure 3.1;
Table 3.5). Sample preparation by extraction with hexane and ionization by APCI
mode of ionization for protein precipitation samples proved to be the best
methodologies for the analysis of metoprolol (Figure 3.1; Table 3.5). Ion suppression
at different concentrations of polyethyleneglycol 400 under different analytical
conditions was shown in Figure 3.10; Table 3.13.
3.3.2.2.9 Warfarin
At an excipient concentration of 15 mg/mL, warfarin had >45% ion suppression using
a) ethyl acetate extraction b) mobile phase combination of 10 mM ammonium acetate
and methanol (Figure 3.1; Table 3.5). Sample preparation by extraction with hexane,
TBME and ionization by APCI mode of ionization for protein precipitation samples
proved to be the best methodologies for the analysis of warfarin (Figure 3.1; Table
3.5). Ion suppression at different concentrations of polyethyleneglycol 400 under
different analytical conditions was shown in Figure 3.11; Table 3.14.
Using different mobile phase conditions helped to nullify the ion suppression on
ketoconazole, diltiazem and telmisartan in ESI mode of analysis. No ion suppression
effects were observed for propranolol, ketoconazole, diltiazem, ranitidine, atenolol,
telmisartan and warfarin when samples were extracted using TBME. However, Ion
suppression was observed for metaprolol and caffeine. LLE with ethyl acetate was the

PEG 400-Matrix Effects Chapter 3
Page 75
poor extraction method with severe ion suppression effects on all the reference
compounds tested.
Table 3.12: Percent of control response for telmisartan at different concentrations
of PEG 400
PEG 400 Conc.
(mg/mL)
% Control Response (Telmisartan)
APCI FA-ACN
FA-MEOH
AMM ACET-ACN
AMM ACET-MEOH
LLE-EA
LLE-
HEX
LLE-TBME
0.00 100 100 100 100 100 100 100 100 0.05 101 94 98 101 99 100 98 100 0.125 96 92 95 101 99 97 98 100 0.25 96 90 94 102 97 95 98 100 0.50 102 90 92 98 96 96 98 99 1.00 102 88 90 101 95 91 95 100 1.25 98 87 91 100 95 92 99 98 2.50 97 81 89 97 92 86 99 99 5.00 108 75 86 95 91 78 100 100 7.50 106 71 83 93 88 74 101 98 10.0 115 65 81 92 86 67 100 98 12.5 108 61 80 92 84 69 101 98 15.0 111 57 79 91 81 63 99 96
Figure 3.9: Pictorial representation of percent control response for telmisartan at
different concentrations of PEG 400

PEG 400-Matrix Effects Chapter 3
Page 76
Table 3.13: Percent of control response for metoprolol at different concentrations
of PEG 400
PEG 400 Conc.
(mg/mL)
% Control Response (Metoprolol)
APCI FA-ACN
FA-MEOH
AMM ACET-ACN
AMM ACET-MEOH
LLE-EA
LLE-HEX
LLE-TBME
0.00 100 100 100 100 100 100 100 100 0.05 102 84 89 100 88 76 100 100 0.125 98 75 80 101 82 64 100 99 0.25 97 69 69 97 74 48 98 97 0.50 102 63 56 90 62 35 97 96 1.00 100 58 42 87 54 26 97 90 1.25 100 55 37 83 54 25 99 88 2.50 94 47 28 71 41 21 101 82 5.00 101 40 20 66 32 17 98 71 7.50 100 36 18 60 26 16 101 62 10.0 106 35 17 55 20 15 100 56 12.5 94 33 16 53 19 14 100 51 15.0 98 30 15 48 17 14 101 48
Figure 3.10: Pictorial representation of percent control response for metoprolol at
different concentrations of PEG 400

PEG 400-Matrix Effects Chapter 3
Page 77
Table 3.14: Percent of control response for warfarin at different concentrations of
PEG 400
PEG 400 Conc.
(mg/mL)
% Control Response (Warfarin)
APCI FA-ACN
FA-MEOH
AMM ACET-ACN
AMM ACET-MEOH
LLE-EA
LLE-HEX
LLE-TBME
0.00 100 100 100 100 100 100 100 100 0.05 101 94 97 99 93 93 100 98 0.125 97 90 98 101 90 92 100 101 0.25 96 89 96 98 85 91 100 97 0.50 93 88 96 94 78 89 100 98 1.00 100 89 97 94 74 86 99 98 1.25 96 88 95 93 68 84 100 97 2.50 98 83 93 88 59 77 99 97 5.00 93 82 89 85 51 69 100 97 7.50 103 82 87 83 46 64 100 97 10.0 101 78 85 80 41 60 101 96 12.5 92 77 84 79 39 60 102 96 15.0 97 74 81 77 37 55 101 95
Figure 3.11: Pictorial representation of percent control response for warfarin at
different concentrations of PEG 400
PEG 400-Matrix Effects Chapter 3
Page 78
Sample analysis by APCI mode of ionization brought down the ion suppression
effects caused by polyethyleneglycol 400 on propranolol, ketoconazole, diltiazem,
atenolol, metaprolol and warfarin. However, ranitidine and caffeine still had ion
suppression in APCI mode of ionization. This shows that polyethyleneglycol 400
cause ion suppression both in liquid and gas phases. ESI is prone to matrix effects
caused by excipients in liquid and gas phase whereas APCI is resistant to liquid phase
suppression effects.
We proposed various mechanisms by which polyethyleneglycol 400 cause ion
suppression effects on different analytes:
1. Increase in surface tension and viscosity of the droplets due to high
concentrations of excipients leading to insufficient evaporation (ESI)
2. Charge competition between analyte and ion suppressing agent leading to
overall reduced ionization of analyte (ESI/APCI)
3. Co precipitation with non volatile components (ESI/APCI)
4. Gas phase reactions causing charge transfer between analytes and ion
suppressing agent (ESI/APCI)
The only extraction technique that provided unique solution for all the reference
compounds tested was liquid-liquid extraction with hexane.
3.4 Conclusion
Based on the physiological concentration levels of excipient, various approaches such
as a) different mobile phase conditions b) different extraction techniques c) different
ionization conditions were tested for finding best technique that nullifies ion
suppression effects. The approaches for reducing the ion suppression effects in
LC-MS/MS are largely analyte dependent. However, sample preparation with hexane
as extraction solvent totally nullified the ion suppression effects caused by
polyethyleneglycol 400. Mechanism of ion suppression caused by polyethyleneglycol
400 was proposed as a) charge competition b) increase in surface tension/viscosity of
droplets c) co-precipitation d) gas phase reactions.

PEG 400-Matrix Effects Chapter 3
Page 79
3.5 References
� Bonfiglio R., King R.C., Olah T.V., Merkle K. (1999), The effects of sample
preparation methods on the variability of the electrospray ionization response
for model drug compounds, Rapid Commun. Mass Spectrom., 13., 1175-1185.
� Chambers E., Wagrowski D.M., Lu Z., Mazzeo J.R. (2007), Systematic and
comprehensive strategy for reducing matrix effects in LC/MS/MS analyses, J.
Chromatogr. B. Analyt. Technol. Biomed Life Sci., 852., 22-34.
� Guidance for Industry: Bioanalytical Methods Validation. (2001), US
Department of Health and Human Services, Center for Drug Evaluation and
Research, and Center for Veterinary Medicine.
� King R., Bonfiglio R., Fernandez M.C., Miller S.C., Olah T. (2000),
Mechanistic investigation of ionization suppression in electrospray ionization,
J. Am. Soc. Mass Spectrom., 11., 942-950.
� Larger P.J., Breda M., Fraier D., Hughes H., James C. (2005), Ion suppression
effects in liquid chromatography tandem mass spectrometry due to a
formulation agent, a case study in drug discovery bioanalysis, J. Pharm.
Biomed. Anal., 39., 206-216.
� Shou W.Z., Naidong W. (2003), Post-column infusion study of the dosing
vehicle effect in the liquid chromatography/tandem mass spectrometric
analysis of discovery pharmacokinetic samples, Rapid Commun. Mass
Spectrom., 17., 589-597.
� Temesi D., Law B., Howe N. (2003), Synthesis and evaluation of PEG414, a
novel formulation agent that avoids analytical problems associated with
polydispersive vehicles such as PEG400, J. Pharmaceutical Sciences, 92 (12).,
2512-2518.
� Tong X.S., Wang J., Zheng S., Pivnichny J.V., Griffin P.R. (2002), Effect of
signal interference from dosing excipients on pharmacokinetic screening of
drug candidates by liquid chromatography/mass spectrometry, Anal. Chem.,
74., 6305-6313.
� Weaver R., Riley R.J. (2006), Identification and reduction of ion suppression
effects on pharmacokinetic parameters by polyethylene glycol 400, Rapid
Commun. Mass Spectrom., 20., 2559-2564.