1.2 A Sort of Sorts - Carnegie Learning · A Sort of Sorts Analyzing and Sorting graphs...
18
7 Workshop Resources WORKSHOP RESOURCES • ALGEBRA I/INTEGRATED MATH I • GEOMETRY/INTEGRATED MATH II • ALGEBRA II/INTEGRATED MATH III Copyright © 2015 Carnegie Learning, Inc. ALGEBRA I, LESSON 1.2: A SORT OF SORTS © 2012 Carnegie Learning 17 A re you getting the urge to start driving? Chances are that you’ll be studying for your driving test before you know it. But how much will driving cost you? For all states in the U.S., auto insurance is a must before any driving can take place. For most teens and their families, this more than likely means an increase in auto insurance costs. So how do insurance companies determine how much you will pay? The fact of the matter is that auto insurance companies sort drivers into different groups to determine their costs. For example, they sort drivers by gender, age, marital status, and driving experience. The type of car is also a factor. A sports vehicle or a luxury car is generally more expensive to insure than an economical car or a family sedan. Even the color of a car can affect the cost to insure it! Do you think it is good business practice to group drivers to determine auto insurance costs? Or do you feel that each individual should be reviewed solely on the merit of the driver based on driving record? Do you think auto insurance companies factor in where a driver lives when computing insurance costs? KEY TERMS • relation • domain • range • function • Vertical Line Test • discrete graph • continuous graph LEARNING GOALS In this lesson, you will: • Review and analyze graphs • Determine similarities and differences among various graphs • Sort graphs by their similarities and rationalize the differences between the groups of graphs • Use the Vertical Line Test to determine if the graph of a relation is a function 1.2 A Sort of Sorts Analyzing and Sorting Graphs HS_Participant_Handbook.indd 7 4/16/15 9:18 AM
Transcript of 1.2 A Sort of Sorts - Carnegie Learning · A Sort of Sorts Analyzing and Sorting graphs...
7Workshop Resources
WoRkshop ResouRces • AlgebRA I/IntegRAted M
Ath I • geoMetRy/IntegRAted M
Ath II • AlgebRA II/IntegRAted MAth III
copy
right
© 2
015
carn
egie
lea
rnin
g, In
c.
ALGEBRA I, LESSoN 1.2: A SoRT oF SoRTS
© 2
012
Car
negi
e Le
arni
ng
17
A re you getting the urge to start driving? Chances are that you’ll be studying for your driving test before you know it. But how much will driving cost you? For all
states in the U.S., auto insurance is a must before any driving can take place. For most teens and their families, this more than likely means an increase in auto insurance costs.
So how do insurance companies determine how much you will pay? The fact of the matter is that auto insurance companies sort drivers into different groups to determine their costs. For example, they sort drivers by gender, age, marital status, and driving experience. The type of car is also a factor. A sports vehicle or a luxury car is generally more expensive to insure than an economical car or a family sedan. Even the color of a car can affect the cost to insure it!
Do you think it is good business practice to group drivers to determine auto insurance costs? Or do you feel that each individual should be reviewed solely on the merit of the driver based on driving record? Do you think auto insurance companies factor in where a driver lives when computing insurance costs?
Key TeRMS
• relation• domain• range• function• Vertical Line Test• discrete graph• continuous graph
LeARnIng goALS
In this lesson, you will:
• Review and analyze graphs .• Determine similarities and differences
among various graphs .• Sort graphs by their similarities and rationalize
the differences between the groups of graphs .• Use the Vertical Line Test to determine if the graph
of a relation is a function .
1.2A Sort of SortsAnalyzing and Sorting graphs
8043_Ch01.indd 17 11/04/12 9:51 AM
HS_Participant_Handbook.indd 7 4/16/15 9:18 AM
8 Workshop Resources
copyright © 2015 carnegie learning, Inc.
ALGEBRA I, LESSoN 1.2: A SoRT oF SoRTSCoNT’D
© 2
012
Car
negi
e Le
arni
ng
18 Chapter 1 Quantities and Relationships
1 Problem 1 Let’s Sort Some graphs
Mathematics is the science of patterns and relationships . Looking for patterns and sorting objects into different groups can provide valuable insights . In this lesson, you will analyze many different graphs and sort them into various groups .
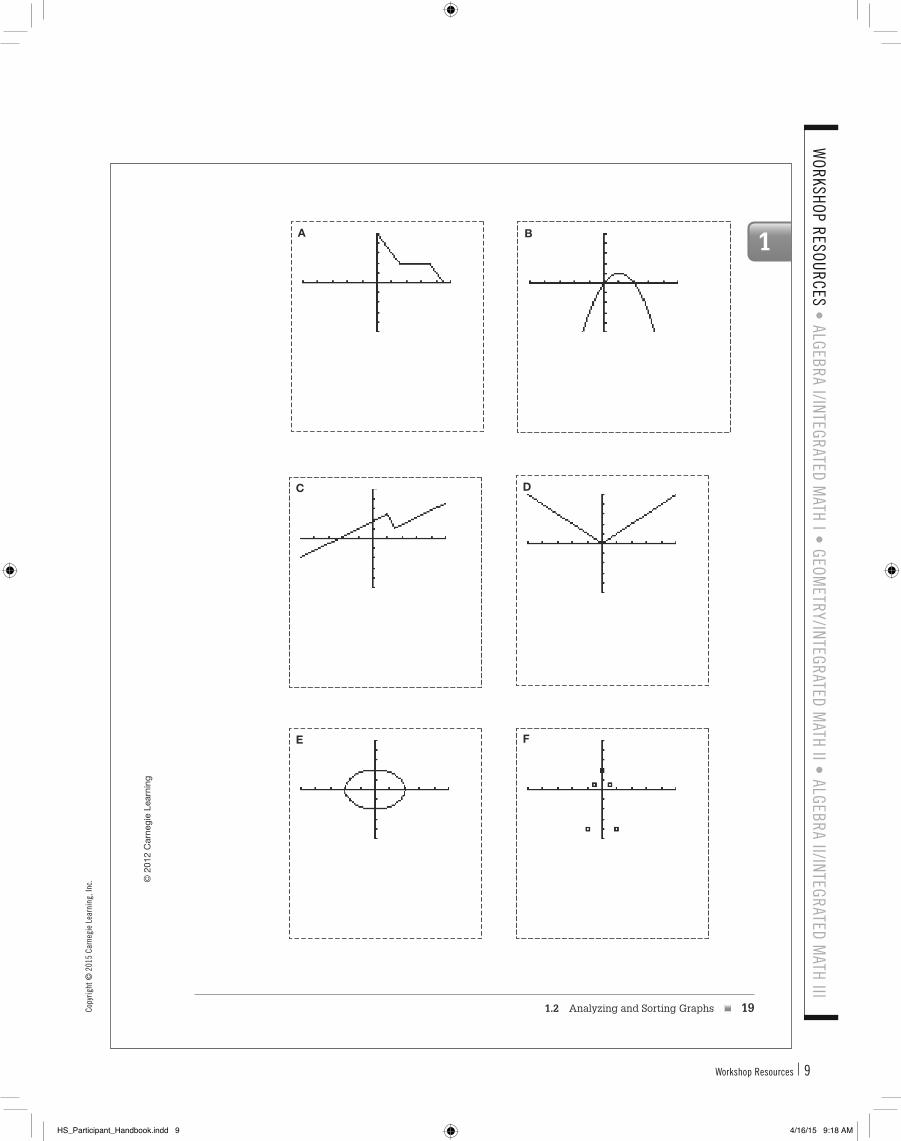
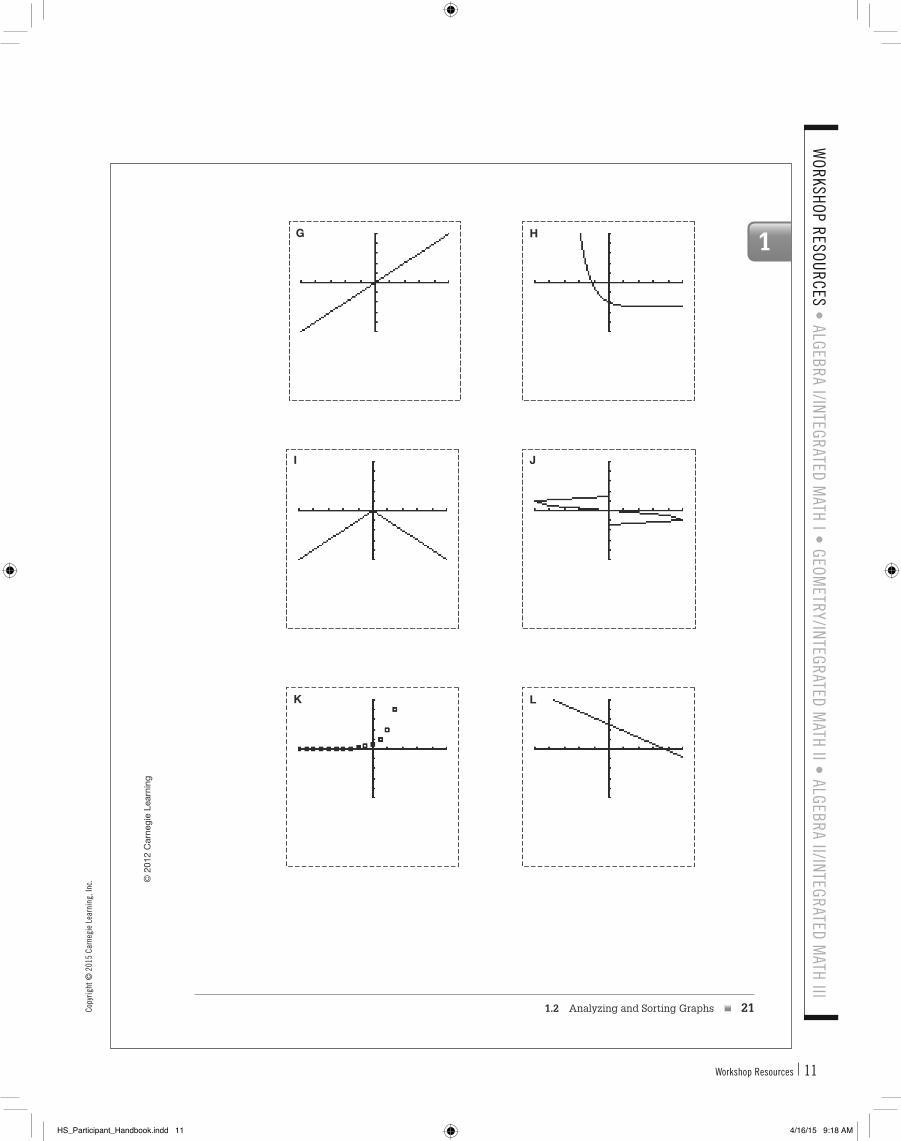
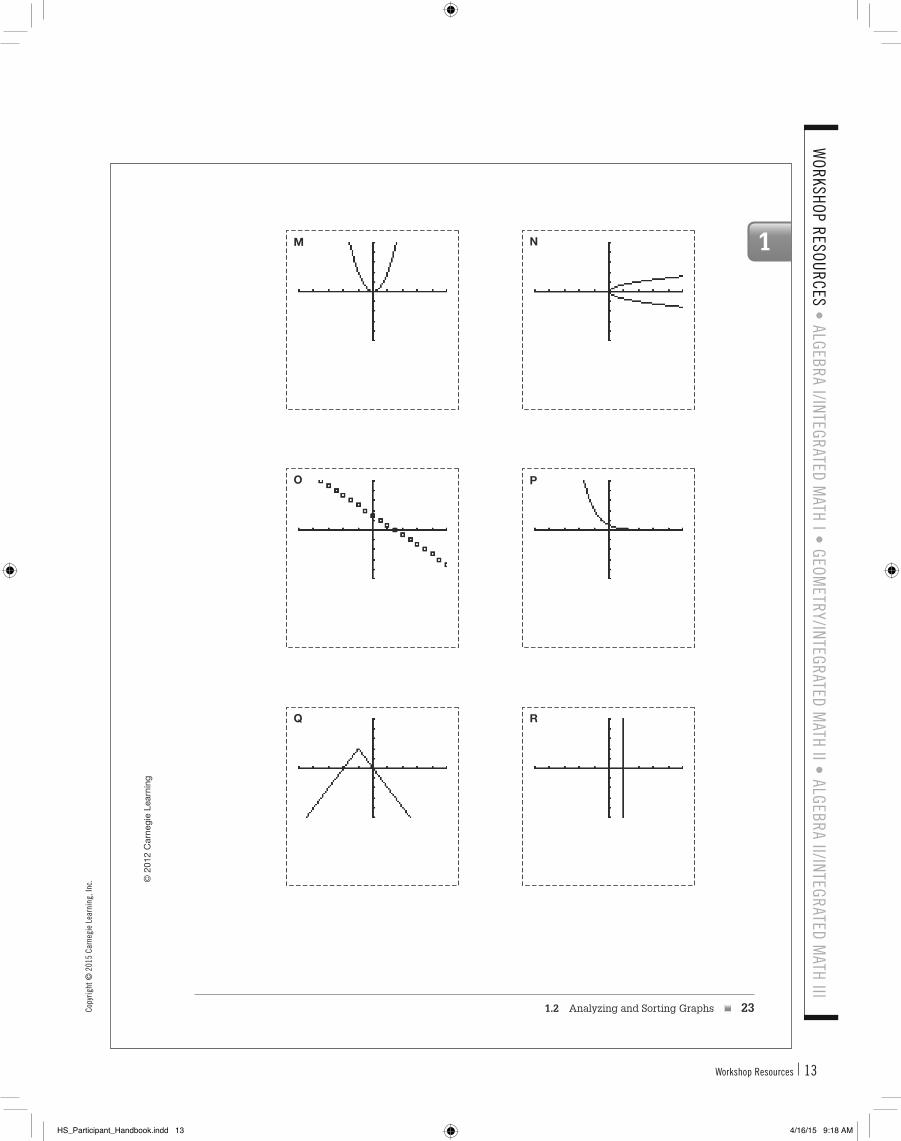
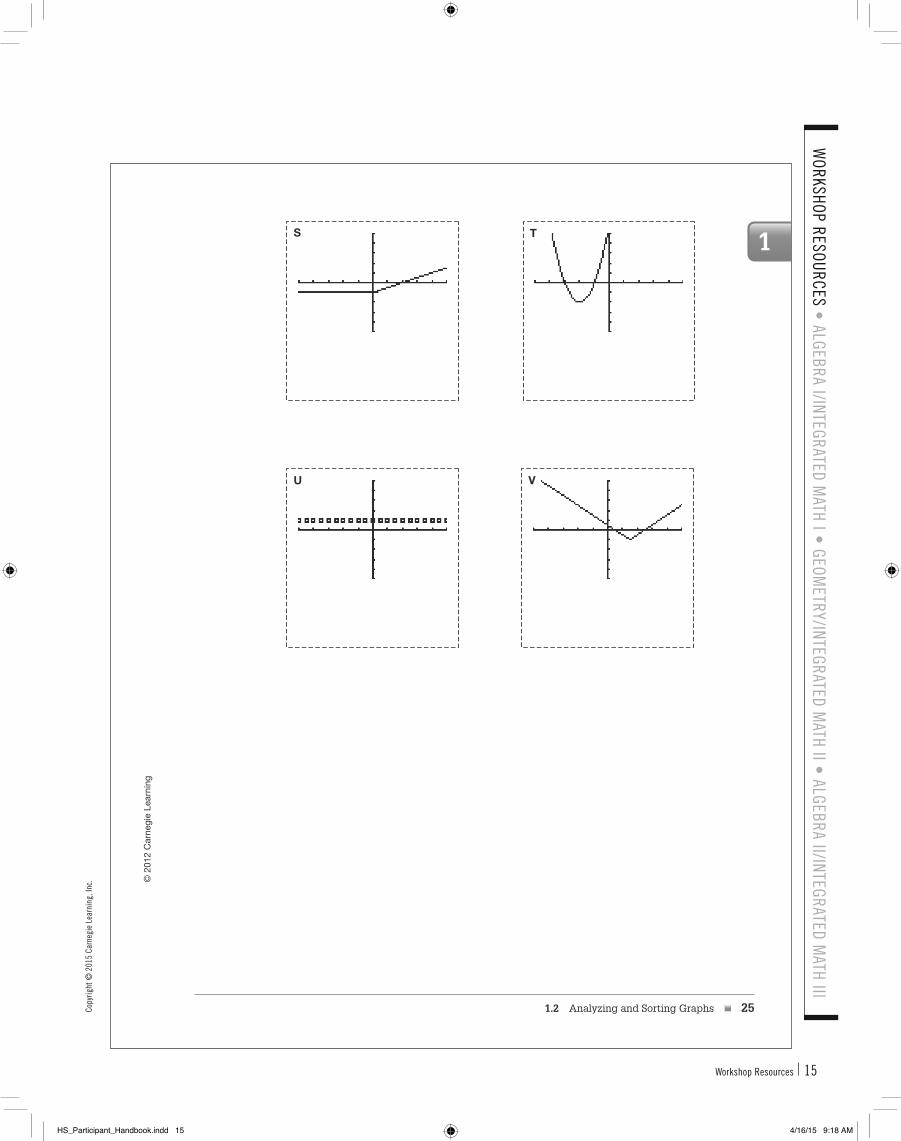
1. Cut out the twenty-two graphs on the following pages . Then analyze and sort the graphs into different groups . You may group the graphs in any way you feel is appropriate . However, you must sort the graphs into more than one group!
In the space provided, record the following information for each of your groups .
• Name each group of graphs .
• List the letters of the graphs in each group .
• Provide a rationale why you created each group .
Each coordinate plane is 10 units
by 10 units.plane is 10 units
by 10 units.
8043_Ch01.indd 18 11/04/12 9:51 AM
HS_Participant_Handbook.indd 8 4/16/15 9:18 AM
9Workshop Resources
WoRkshop ResouRces • AlgebRA I/IntegRAted M
Ath I • geoMetRy/IntegRAted M
Ath II • AlgebRA II/IntegRAted MAth III
copy
right
© 2
015
carn
egie
lea
rnin
g, In
c. © 2
012
Car
negi
e Le
arni
ng
1
1.2 Analyzing and Sorting Graphs 19
A
B
C
D
E
F
8043_Ch01.indd 19 08/05/12 11:37 AM
HS_Participant_Handbook.indd 9 4/16/15 9:18 AM

10 Workshop Resources
Copyright © 2015 Carnegie Learning, Inc.
© 2
012
Car
negi
e Le
arni
ng
20 Chapter 1 Quantities and Relationships
1
8043_Ch01.indd 20 11/04/12 9:51 AM
ALGEBRA I, LESSoN 1.2: A SoRT oF SoRTSCoNT’D
HS_Participant_Handbook.indd 10 4/16/15 9:18 AM
11Workshop Resources
WoRkshop ResouRces • AlgebRA I/IntegRAted M
Ath I • geoMetRy/IntegRAted M
Ath II • AlgebRA II/IntegRAted MAth III
copy
right
© 2
015
carn
egie
lea
rnin
g, In
c. © 2
012
Car
negi
e Le
arni
ng
1
1.2 Analyzing and Sorting Graphs 21
G
H
I
J
K
L
8043_Ch01.indd 21 11/04/12 9:51 AM
HS_Participant_Handbook.indd 11 4/16/15 9:18 AM

12 Workshop Resources
Copyright © 2015 Carnegie Learning, Inc.
© 2
012
Car
negi
e Le
arni
ng
22 Chapter 1 Quantities and Relationships
1
8043_Ch01.indd 22 11/04/12 9:51 AM
ALGEBRA I, LESSoN 1.2: A SoRT oF SoRTSCoNT’D
HS_Participant_Handbook.indd 12 4/16/15 9:18 AM
13Workshop Resources
WoRkshop ResouRces • AlgebRA I/IntegRAted M
Ath I • geoMetRy/IntegRAted M
Ath II • AlgebRA II/IntegRAted MAth III
copy
right
© 2
015
carn
egie
lea
rnin
g, In
c. © 2
012
Car
negi
e Le
arni
ng
1
1.2 Analyzing and Sorting Graphs 23
M
N
O
P
Q
R
8043_Ch01.indd 23 11/04/12 9:51 AM
HS_Participant_Handbook.indd 13 4/16/15 9:18 AM

14 Workshop Resources
Copyright © 2015 Carnegie Learning, Inc.
© 2
012
Car
negi
e Le
arni
ng
24 Chapter 1 Quantities and Relationships
1
8043_Ch01.indd 24 11/04/12 9:51 AM
ALGEBRA I, LESSoN 1.2: A SoRT oF SoRTSCoNT’D
HS_Participant_Handbook.indd 14 4/16/15 9:18 AM
15Workshop Resources
WoRkshop ResouRces • AlgebRA I/IntegRAted M
Ath I • geoMetRy/IntegRAted M
Ath II • AlgebRA II/IntegRAted MAth III
copy
right
© 2
015
carn
egie
lea
rnin
g, In
c. © 2
012
Car
negi
e Le
arni
ng
1
1.2 Analyzing and Sorting Graphs 25
S
T
U
V
8043_Ch01.indd 25 11/04/12 9:51 AM
HS_Participant_Handbook.indd 15 4/16/15 9:18 AM
16 Workshop Resources
Copyright © 2015 Carnegie Learning, Inc.
© 2
012
Car
negi
e Le
arni
ng
26 Chapter 1 Quantities and Relationships
1
8043_Ch01.indd 26 11/04/12 9:51 AM
ALGEBRA I, LESSoN 1.2: A SoRT oF SoRTSCoNT’D
HS_Participant_Handbook.indd 16 4/16/15 9:18 AM
17Workshop Resources
WoRkshop ResouRces • AlgebRA I/IntegRAted M
Ath I • geoMetRy/IntegRAted M
Ath II • AlgebRA II/IntegRAted MAth III
copy
right
© 2
015
carn
egie
lea
rnin
g, In
c. © 2
012
Car
negi
e Le
arni
ng
1
1.2 Analyzing and Sorting Graphs 27
2. Compare your groupings with your classmates’ groupings . Create a list of the different graphical behaviors you noticed .
Are any of the graphical
behaviors shared among your groups? Or, are
they unique to each group?
1.2 Analyzing and Sorting Graphs
each group?
8043_Ch01.indd 27 11/04/12 9:51 AM
HS_Participant_Handbook.indd 17 4/16/15 9:18 AM
18 Workshop Resources
Copyright © 2015 Carnegie Learning, Inc.
© 2
012
Car
negi
e Le
arni
ng
28 Chapter 1 Quantities and Relationships
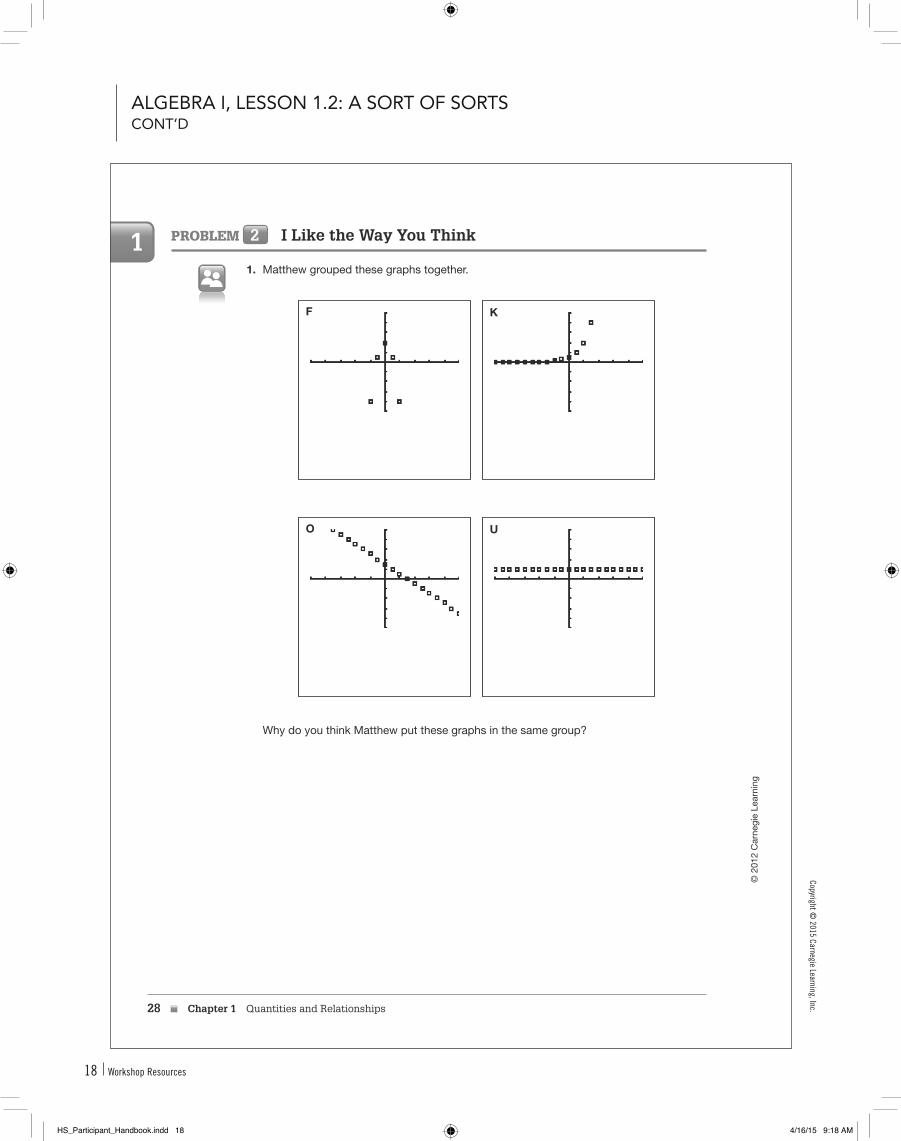
1 Problem 2 I Like the Way you Think
1. Matthew grouped these graphs together .
F K
O U
Why do you think Matthew put these graphs in the same group?
8043_Ch01.indd 28 11/04/12 9:51 AM
ALGEBRA I, LESSoN 1.2: A SoRT oF SoRTSCoNT’D
HS_Participant_Handbook.indd 18 4/16/15 9:18 AM
19Workshop Resources
WoRkshop ResouRces • AlgebRA I/IntegRAted M
Ath I • geoMetRy/IntegRAted M
Ath II • AlgebRA II/IntegRAted MAth III
copy
right
© 2
015
carn
egie
lea
rnin
g, In
c. © 2
012
Car
negi
e Le
arni
ng
1
1.2 Analyzing and Sorting Graphs 29
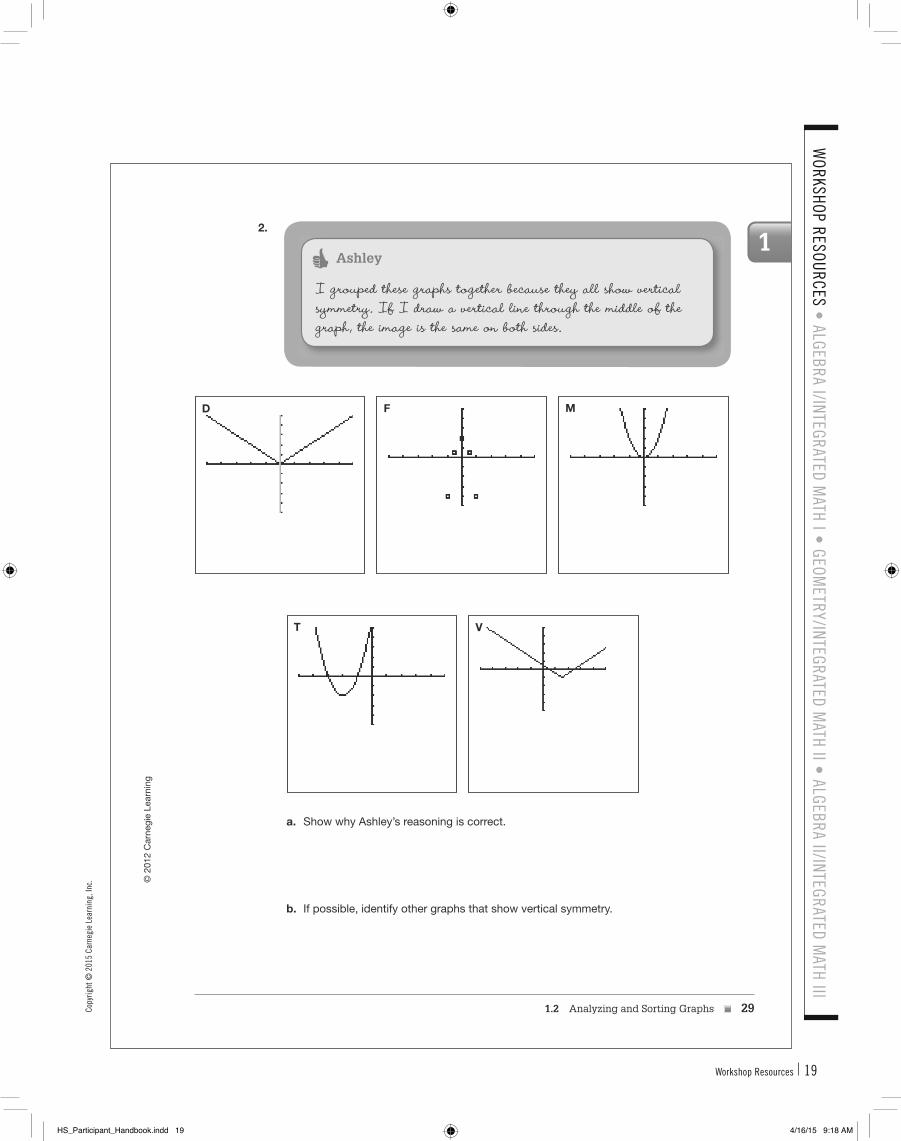
2.
Ashley
I grouped these graphs together because they all show vertical symmetry. If I draw a vertical line through the middle of the graph, the image is the same on both sides.
D F M
T V
a. Show why Ashley’s reasoning is correct .
b. If possible, identify other graphs that show vertical symmetry .
8043_Ch01.indd 29 11/04/12 9:51 AM
HS_Participant_Handbook.indd 19 4/16/15 9:18 AM
20 Workshop Resources
copyright © 2015 carnegie learning, Inc.
© 2
012
Car
negi
e Le
arni
ng
30 Chapter 1 Quantities and Relationships
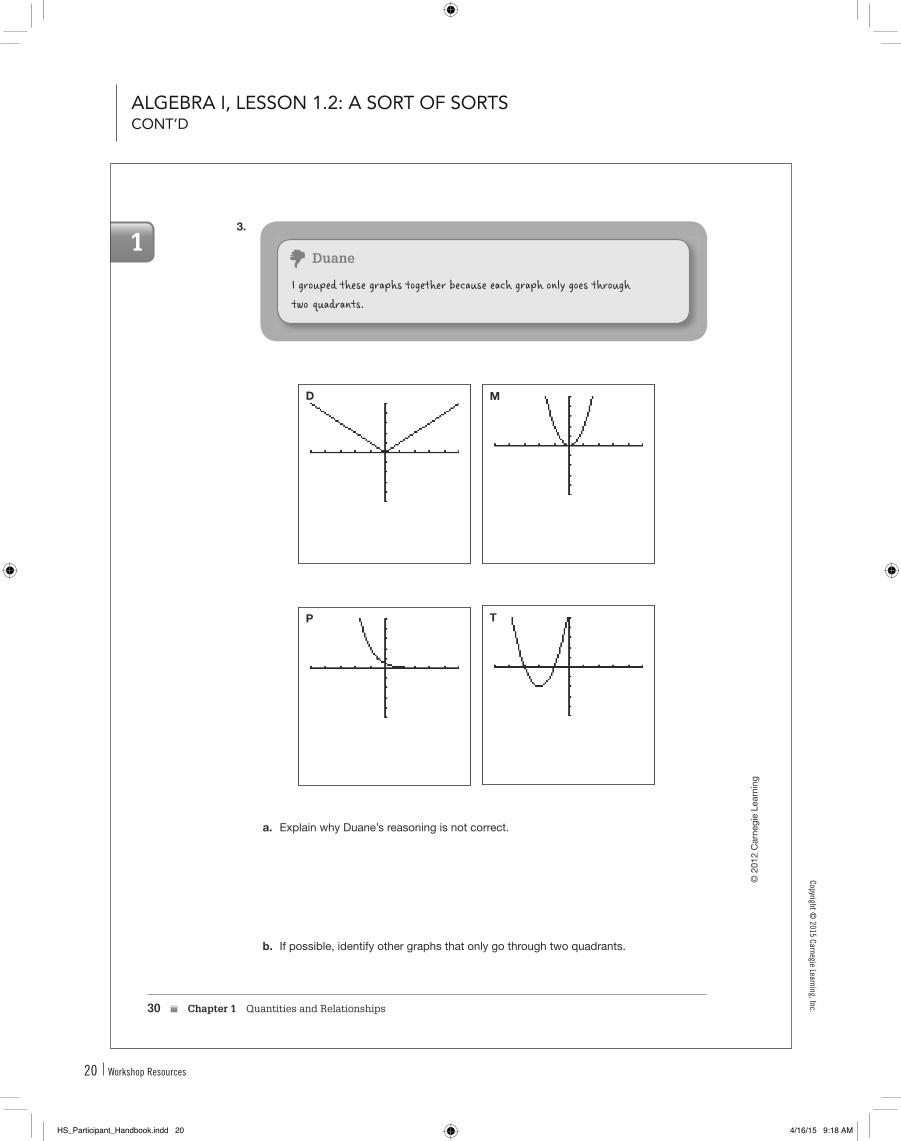
13.
Duane
I grouped these graphs together because each graph only goes through two quadrants.
D M
P T
a. Explain why Duane’s reasoning is not correct .
b. If possible, identify other graphs that only go through two quadrants .
8043_Ch01.indd 30 11/04/12 9:51 AM
ALGEBRA I, LESSoN 1.2: A SoRT oF SoRTSCoNT’D
HS_Participant_Handbook.indd 20 4/16/15 9:18 AM
21Workshop Resources
WoRkshop ResouRces • AlgebRA I/IntegRAted M
Ath I • geoMetRy/IntegRAted M
Ath II • AlgebRA II/IntegRAted MAth III
copy
right
© 2
015
carn
egie
lea
rnin
g, In
c. © 2
012
Car
negi
e Le
arni
ng
1
1.2 Analyzing and Sorting Graphs 31
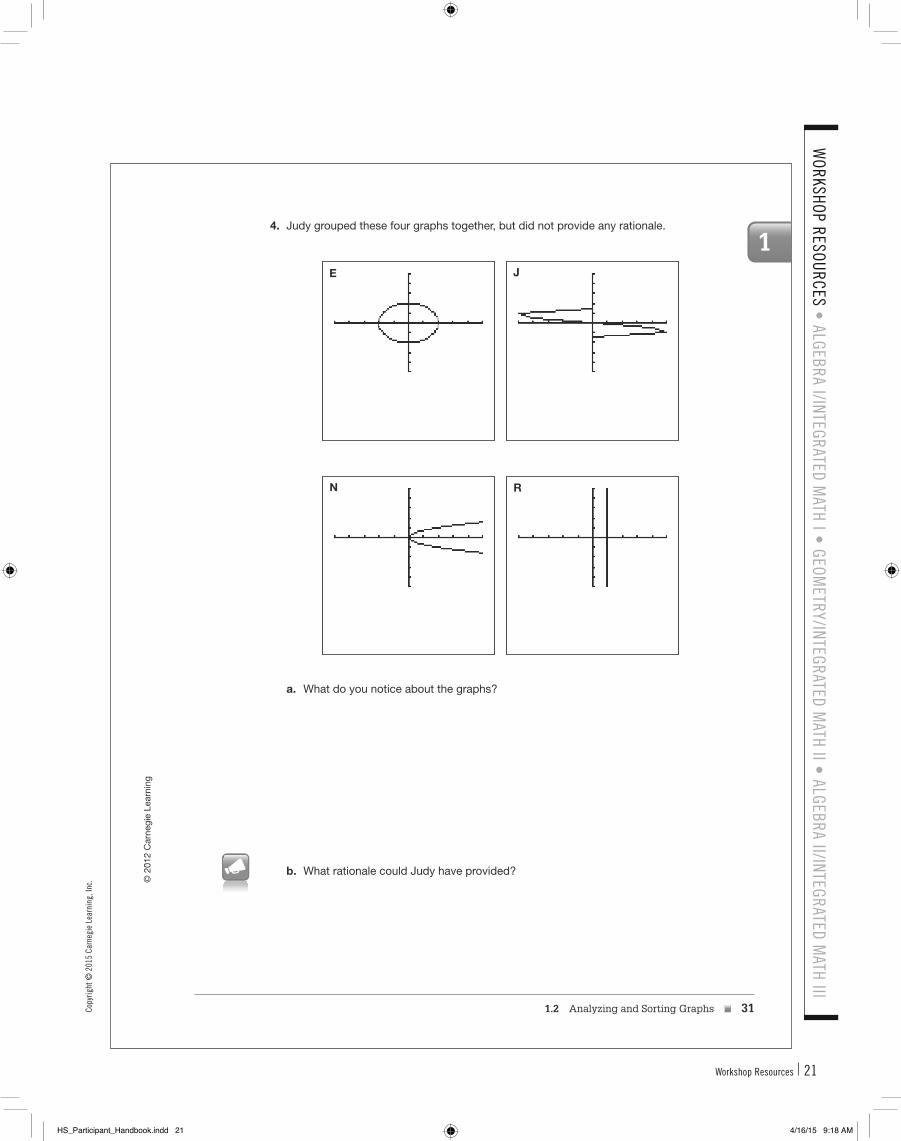
4. Judy grouped these four graphs together, but did not provide any rationale .
E J
N R
a. What do you notice about the graphs?
b. What rationale could Judy have provided?
8043_Ch01.indd 31 11/04/12 9:51 AM
HS_Participant_Handbook.indd 21 4/16/15 9:18 AM
22 Workshop Resources
copyright © 2015 carnegie learning, Inc.
© 2
012
Car
negi
e Le
arni
ng
32 Chapter 1 Quantities and Relationships
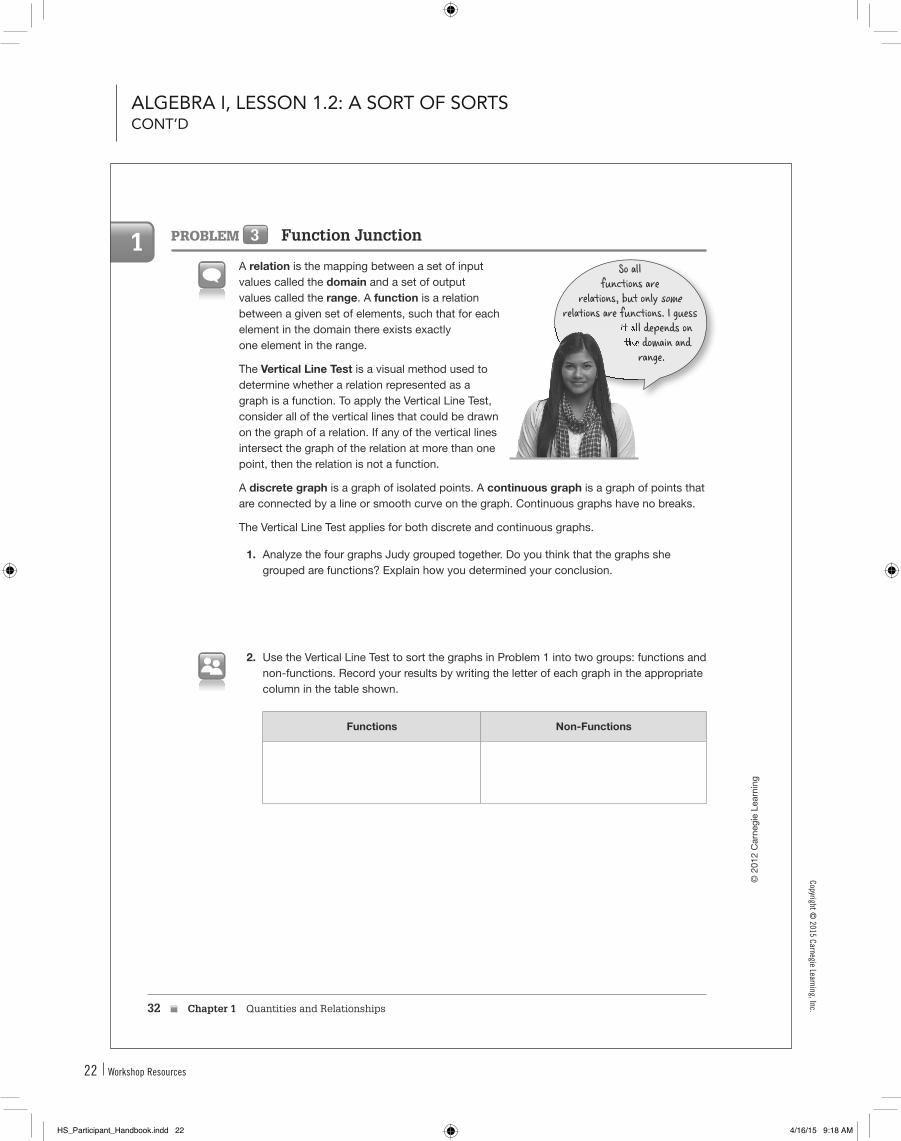
1 Problem 3 Function Junction
A relation is the mapping between a set of input values called the domain and a set of output values called the range . A function is a relation between a given set of elements, such that for each element in the domain there exists exactly one element in the range .
The Vertical Line Test is a visual method used to determine whether a relation represented as a graph is a function . To apply the Vertical Line Test, consider all of the vertical lines that could be drawn on the graph of a relation . If any of the vertical lines intersect the graph of the relation at more than one point, then the relation is not a function .
A discrete graph is a graph of isolated points . A continuous graph is a graph of points that are connected by a line or smooth curve on the graph . Continuous graphs have no breaks .
The Vertical Line Test applies for both discrete and continuous graphs .
1. Analyze the four graphs Judy grouped together . Do you think that the graphs she grouped are functions? Explain how you determined your conclusion .
2. Use the Vertical Line Test to sort the graphs in Problem 1 into two groups: functions and non-functions . Record your results by writing the letter of each graph in the appropriate column in the table shown .
Functions Non-Functions
So all functions are
relations, but only some relations are functions. I guess
it all depends on the domain and
range.
it all depends on the domain and
8043_Ch01.indd 32 11/04/12 9:51 AM
ALGEBRA I, LESSoN 1.2: A SoRT oF SoRTSCoNT’D
HS_Participant_Handbook.indd 22 4/16/15 9:18 AM
23Workshop Resources
WoRkshop ResouRces • AlgebRA I/IntegRAted M
Ath I • geoMetRy/IntegRAted M
Ath II • AlgebRA II/IntegRAted MAth III
copy
right
© 2
015
carn
egie
lea
rnin
g, In
c. © 2
012
Car
negi
e Le
arni
ng
1 3. Each graph in this set of functions has a domain that is either:
• the set of all real numbers, or
• the set of integers.
For each graph, remember that the x-axis and the y-axis display values from 210 to 10 with an interval of 2 units.
Label each function graph with the appropriate domain.
4. Clip all your graphs together and keep them for the next lesson.
1.2 Analyzing and Sorting Graphs 33
Hang on to your graphs. You
will need them for the next
lesson.
will need them for the next
lesson.
8043_Ch01.indd 33 08/05/12 11:38 AM
HS_Participant_Handbook.indd 23 4/16/15 9:18 AM
24 Workshop Resources
copyright © 2015 carnegie learning, Inc.
© 2
012
Car
negi
e Le
arni
ng
34 Chapter 1 Quantities and Relationships
1Talk the Talk
1. Sketch a graph of a function . Explain how you know that it is a function .
2. Sketch a graph that is not a function . Explain how you know that it is not a function .
Be prepared to share your solutions and methods .
Be original! Please don’t use
any graphs from this lesson.lesson.
8043_Ch01.indd 34 11/04/12 9:51 AM
ALGEBRA I, LESSoN 1.2: A SoRT oF SoRTSCoNT’D
HS_Participant_Handbook.indd 24 4/16/15 9:18 AM