
12 13 Quality Report final RDG - transpower.co.nz The Electricity Information ... West Wind...
34
2012 /13 QUALITY PERFORMANCE REPORT
Transcript of 12 13 Quality Report final RDG - transpower.co.nz The Electricity Information ... West Wind...
2012/13QUALITY PERFORMANCE REPORTQUALITY PERFORMANCE REPORT 2012/13
www.transpower.co.nz

Contents
Contents ........................................................................................................................ 1 Highlights ....................................................................................................................... 2 From the Chief Executive ................................................................................................ 3
1 Management and Operation of the Transpower System ........................................... 5 2 Interruptions to Supply .......................................................................................... 5 3 Interruptions to Generator Connections ................................................................ 12 4 HVAC Transmission Performance .......................................................................... 13 5 Transmission System Utilisation ............................................................................ 15 6 HVDC Link Availability .......................................................................................... 16 7 International Comparison of Transmission Performance ......................................... 17 8 Supply Performance Summary .............................................................................. 18 9 Point of Service Performance ............................................................................... 19 10 Transpower Individual Price-Quality Path .............................................................. 26 11 The Electricity Information Disclosure Requirements .............................................. 28
Maps of High Voltage Transmission System ................................................................... 30 Significant Events from 1987 to 2013 ............................................................................. 32 Cover image: West Wind Substation – 220 kV switchgear. An infrared gas detection camera is used to check for sulphur hexafluoride gas leaks on Transpower circuit breakers at Meridian’s wind farm.
Page 2 © 2013 Transpower New Zealand Limited
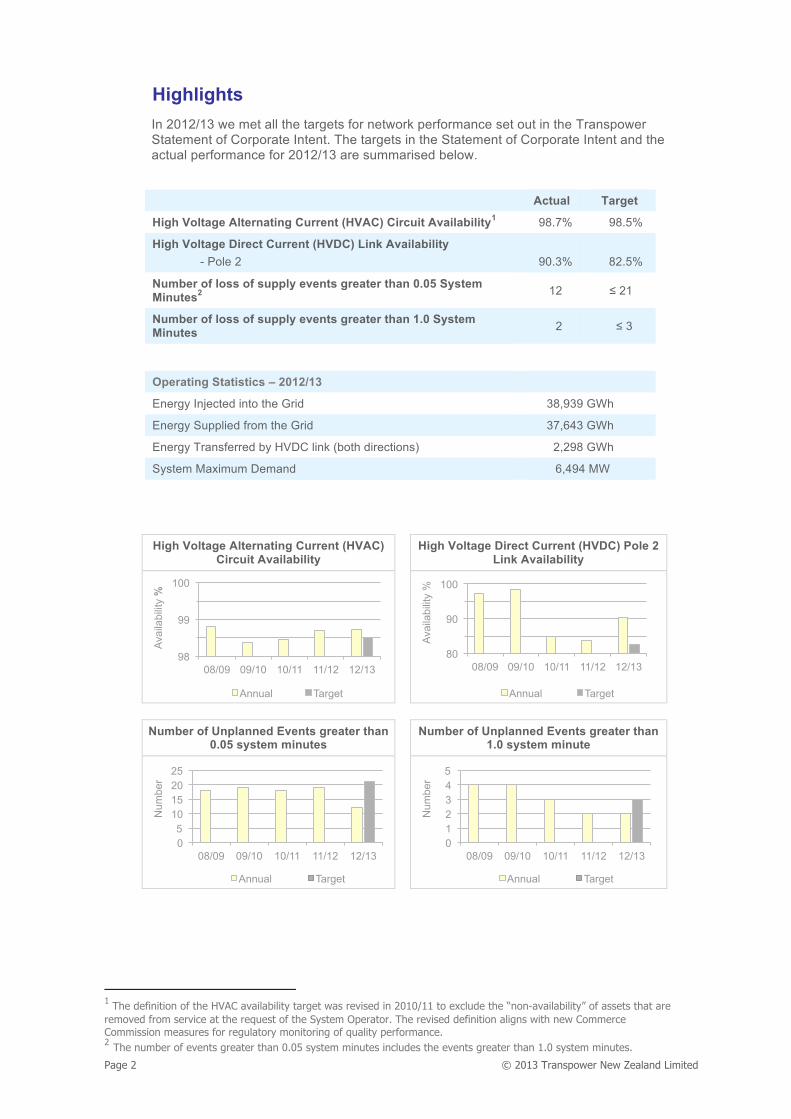
Highlights In 2012/13 we met all the targets for network performance set out in the Transpower Statement of Corporate Intent. The targets in the Statement of Corporate Intent and the actual performance for 2012/13 are summarised below.
Actual Target
High Voltage Alternating Current (HVAC) Circuit Availability1 98.7% 98.5%
High Voltage Direct Current (HVDC) Link Availability - Pole 2
90.3%
82.5%
Number of loss of supply events greater than 0.05 System Minutes2 12 ≤ 21
Number of loss of supply events greater than 1.0 System Minutes 2 ≤ 3
Operating Statistics – 2012/13
Energy Injected into the Grid 38,939 GWh
Energy Supplied from the Grid 37,643 GWh
Energy Transferred by HVDC link (both directions) 2,298 GWh
System Maximum Demand 6,494 MW
High Voltage Alternating Current (HVAC)
Circuit Availability High Voltage Direct Current (HVDC) Pole 2
Link Availability
Number of Unplanned Events greater than
0.05 system minutes Number of Unplanned Events greater than
1.0 system minute
1 The definition of the HVAC availability target was revised in 2010/11 to exclude the “non-availability” of assets that are removed from service at the request of the System Operator. The revised definition aligns with new Commerce Commission measures for regulatory monitoring of quality performance. 2 The number of events greater than 0.05 system minutes includes the events greater than 1.0 system minutes.
98
99
100
08/09 09/10 10/11 11/12 12/13
Avai
labi
lity
%
Annual Target
80
90
100
08/09 09/10 10/11 11/12 12/13
Avai
labi
lity
%
Annual Target
0 5
10 15 20 25
08/09 09/10 10/11 11/12 12/13
Num
ber
Annual Target
0 1 2 3 4 5
08/09 09/10 10/11 11/12 12/13
Num
ber
Annual Target

© 2013 Transpower New Zealand Limited Page 3
From the Chief Executive This is Transpower New Zealand Limited’s 22nd annual Quality Performance Report. It sets out operational performance data that enables our stakeholders to assess our performance against measures included in our 2012/13 Statement of Corporate Intent.
As in previous years, the 2012/13 report details High Voltage Alternating Current (HVAC) and High Voltage Direct Current (HVDC) availability, and reliability performance at specific points on the grid, and accounts for any significant interruptions of supply. The report also includes performance information that the company is required to disclose as per the Electricity Information Disclosure Requirements for the 12 months to 30 June 2013, and the Commerce Act (Transpower Individual Price-Quality Path) Determination 2010.
This year we met all the targets for network performance set out in the 2012/13 Statement of Corporate Intent. There were 12 interruption events greater than 0.05 system minutes compared to a target of less than or equal to 21, and there were two events greater than 1.0 system minute compared to the target of less than or equal to three. HVAC availability of 98.7 percent was above (better than) the target of 98.5 percent. The 2012/13 target for HVDC Pole 2 was set relatively low at 82.5 percent to allow for the operating restrictions anticipated during the reconductoring of the North Island section of the HVDC transmission link and project work associated with the new Pole 3. Pole 2 has performed well during the year with availability of 90.3 percent and has bettered this target.
The total planned and unplanned interruptions for the 2012/13 year was 7.6 system minutes and is a marked improvement from the 14.5 system minutes incurred in 2011/12.
The total energy injected onto the grid during 2012/13 decreased by 1.9 percent to 38,939 GWh compared to 39,697 GWh for the previous year. Total energy delivered for the year decreased by 1.5 percent from 2011/12, in part due to a reduced demand from the Tiwai aluminium smelter.
The system maximum demand of 6494 MW was recorded at 5:30 pm on 27 June 2013, and was 6.1 percent lower than the maximum of 6917 MW recorded for 2011/12. However, the 2011/12 figure was unusually high because of very cold conditions in mid-August 2011. The average trend over the last five years has been that system maximum demand has decreased at approximately 0.4 percent per annum.
South Island generation injected onto the grid was 11.3 percent higher than in 2011/12 and, as a result, there was a net energy transfer across the HVDC link from South to North. This reflects the return to normal generation patterns after the dry hydro year in 2011/12. Northwards transfers across the link were 1976 GWh compared to the previous year’s 771 GWh, and southwards transfers were only 322 GWh compared to 1032 GWh in 2011/12.
A wide range of initiatives are in progress to achieve sustained improvements in performance and to reduce interruptions. These include:
following consultation with customers, developing a set of long-term grid performance measures. These measures will form a key part of our future reports to customers. The targets for performance against these measures are differentiated based on the criticality of the connected load. Asset management decisions will incorporate these targets and expenditure prioritisation will be based on asset criticality, to drive cost-effective improvements in performance.
continuing to review and improve our overall asset management framework, with an objective of achieving compliance with the internationally recognised BSI publication PAS55:2008 – Asset Management.
recently establishing a formal reliability engineering team. This is now providing a strong focus on identifying root causes of poor performance and risk and driving improvement through systematic application of corrective and preventive actions.
work on developing Asset Health Indices to provide long-range forecasts of asset condition and to support asset replacement strategies.

Page 4 © 2013 Transpower New Zealand Limited
developing and publishing a wide range of standardised maintenance procedures to achieve nationwide consistency in preventive maintenance, and provide a sound basis for further improvements in practice.
recently replacing our asset management information system. This will enable improvements in all aspects of the capture, storage, display and use of asset management information to support decision-making.
making significant changes to the way we manage real time operation of the grid assets. We are continuing to invest in improvements in systems used for grid operations, and in the training and development of our asset operations personnel.
This Quality Performance Report is an important element of our on-going commitment to provide a comprehensive information base for our customers and stakeholders. A range of other publications is available at www.transpower.co.nz including the Annual Report, Annual Planning Report, System Security Forecast, and Statement of Corporate Intent.
Patrick Strange
Chief Executive
© 2013 Transpower New Zealand Limited Page 5
11 Management and Operation of the Transpower System The transmission assets that we own and operate are summarised in Table 1. The HVAC systems in the North and South Islands form an integrated system, joined by an HVDC link, and managed from two national control centres in Hamilton and Wellington, and two regional operating centres in Otahuhu and Islington.
The management of the system is facilitated by our communications network, which comprises fibre optic links, ultra-high frequency (UHF) and microwave radio links, and telephone networks supplemented by leased circuits.
We contract the grid’s operational, maintenance and construction fieldwork to specialist service providers. Our staff set and manage these contracts to strict standards.
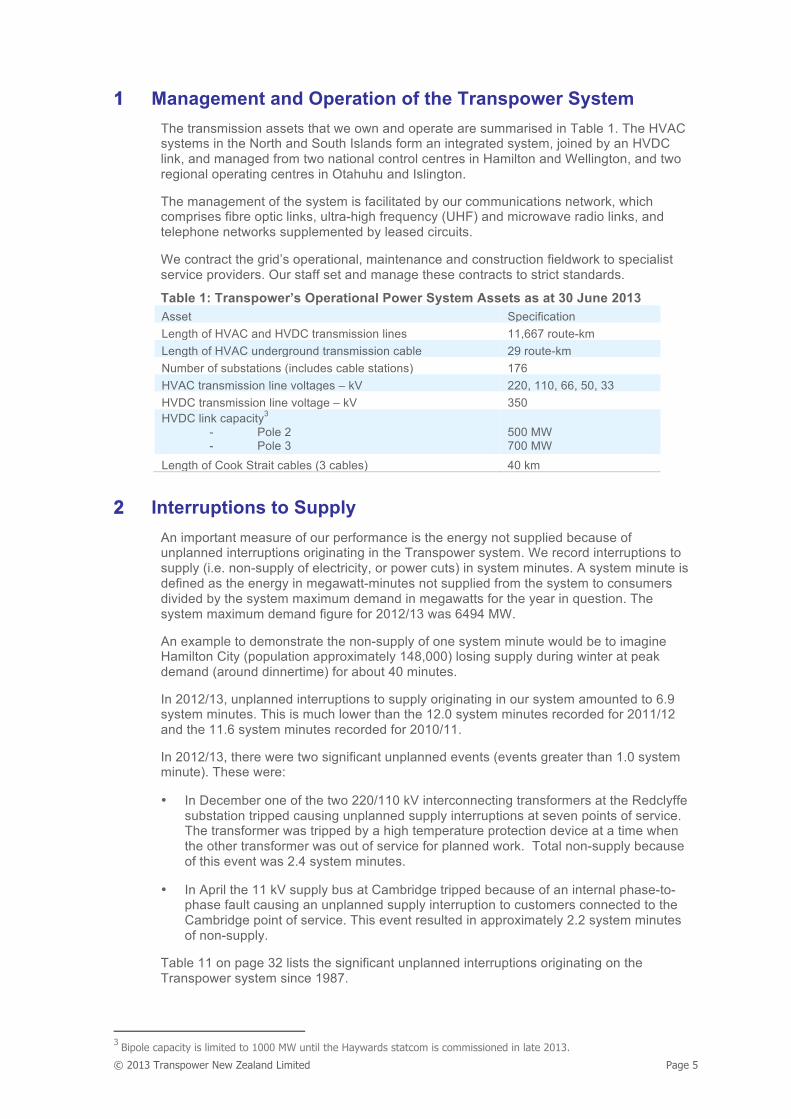
Table 1: Transpower’s Operational Power System Assets as at 30 June 2013 Asset Specification Length of HVAC and HVDC transmission lines 11,667 route-km Length of HVAC underground transmission cable 29 route-km Number of substations (includes cable stations) 176 HVAC transmission line voltages – kV 220, 110, 66, 50, 33 HVDC transmission line voltage – kV 350 HVDC link capacity3 - Pole 2 - Pole 3
500 MW 700 MW
Length of Cook Strait cables (3 cables) 40 km
22 Interruptions to Supply An important measure of our performance is the energy not supplied because of unplanned interruptions originating in the Transpower system. We record interruptions to supply (i.e. non-supply of electricity, or power cuts) in system minutes. A system minute is defined as the energy in megawatt-minutes not supplied from the system to consumers divided by the system maximum demand in megawatts for the year in question. The system maximum demand figure for 2012/13 was 6494 MW.
An example to demonstrate the non-supply of one system minute would be to imagine Hamilton City (population approximately 148,000) losing supply during winter at peak demand (around dinnertime) for about 40 minutes.
In 2012/13, unplanned interruptions to supply originating in our system amounted to 6.9 system minutes. This is much lower than the 12.0 system minutes recorded for 2011/12 and the 11.6 system minutes recorded for 2010/11.
In 2012/13, there were two significant unplanned events (events greater than 1.0 system minute). These were:
In December one of the two 220/110 kV interconnecting transformers at the Redclyffe substation tripped causing unplanned supply interruptions at seven points of service. The transformer was tripped by a high temperature protection device at a time when the other transformer was out of service for planned work. Total non-supply because of this event was 2.4 system minutes.
In April the 11 kV supply bus at Cambridge tripped because of an internal phase-to-phase fault causing an unplanned supply interruption to customers connected to the Cambridge point of service. This event resulted in approximately 2.2 system minutes of non-supply.
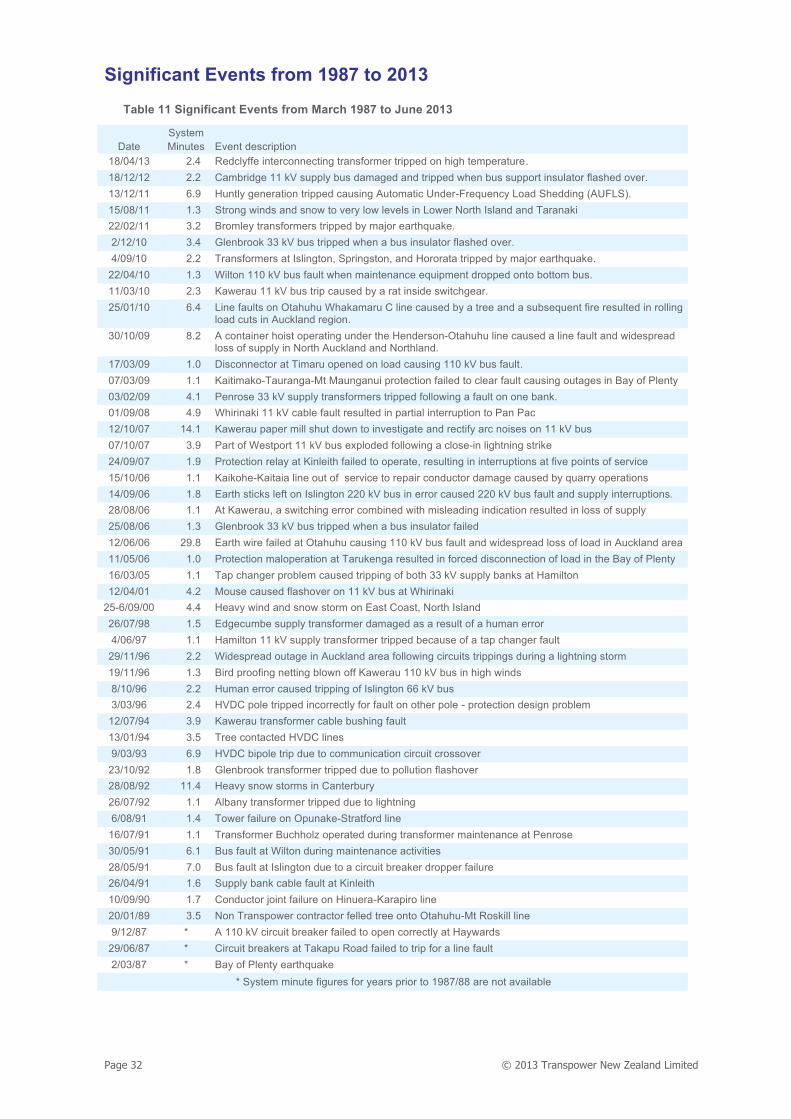
Table 11 on page 32 lists the significant unplanned interruptions originating on the Transpower system since 1987.
3 Bipole capacity is limited to 1000 MW until the Haywards statcom is commissioned in late 2013.

Page 6 © 2013 Transpower New Zealand Limited
Figure 1 shows performance in terms of the unplanned supply interruptions for the last six years. Events resulting in supply interruptions amounting to more than one system minute are categorised as significant, and the remainder are categorised as underlying.
Figure 2 shows monthly performance in terms of underlying unplanned supply interruptions for the 2012/13 year compared to the average of the previous five years. This wide monthly variation is to be expected given the relatively random nature of unplanned interruption-to-supply events. Interruptions are generally less frequent in the winter months because there are fewer circuit and transformer outages for maintenance and the grid is therefore more secure.
Figure 3 illustrates both the number and impact of significant unplanned non-supply events for 2012/13 and the preceding five years.
Figure 4 shows the numbers of unplanned events greater than 0.05 system minutes for 2012/13 and the preceding five years. (This includes events greater than 1.0 system minutes.)
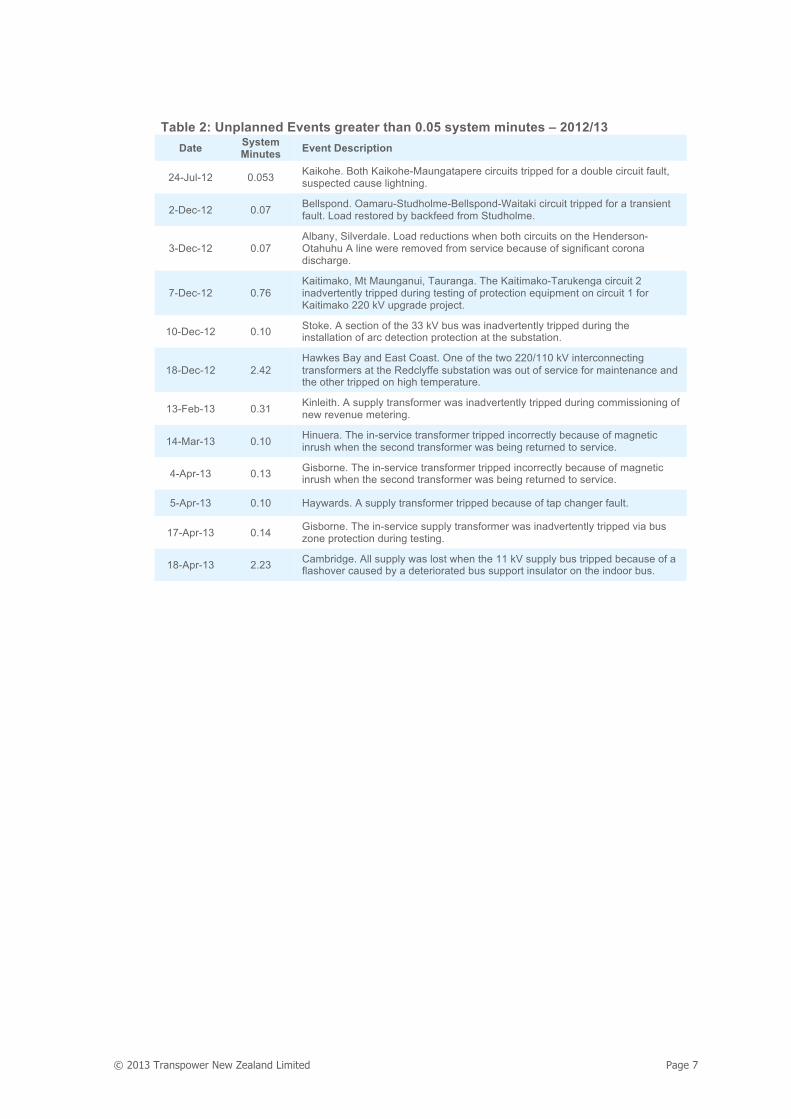
During 2012/13 there were 12 unplanned events resulting in greater than 0.05 system minutes. These 12 events are listed in Table 2 (see page 7). Of these 12 events, two were greater than 1.0 system minute. There were a further 29 events that each resulted in less than 0.05 system minutes of non-supply. Figure 1 Unplanned Supply Interruptions
Figure 2 Unplanned Supply Interruptions – Underlying Events by Month
Figure 3 Unplanned Events > 1 System Minute (Significant Events)
Figure 4 Unplanned Events > 0.05 System Minutes
0
10
20
30
07/08 08/09 09/10 10/11 11/12 12/13
Sys
tem
Min
utes
Underlying Significant Total
0.0
0.5
1.0
1.5
2.0
Jul Aug Sep Oct Nov Dec Jan Feb Mar Apr May Jun
Sys
tem
Min
utes
2012/13 Average Previous 5 years
0 2 4 6 8
10
07/08 08/09 09/10 10/11 11/12 12/13
Sys
tem
Min
utes
each bar represents one event
14.1
0
10
20
30
07/08 08/09 09/10 10/11 11/12 12/13
Num
ber o
f Eve
nts
© 2013 Transpower New Zealand Limited Page 7
Table 2: Unplanned Events greater than 0.05 system minutes – 2012/13 Date System
Minutes Event Description
24-Jul-12 0.053 Kaikohe. Both Kaikohe-Maungatapere circuits tripped for a double circuit fault, suspected cause lightning.
2-Dec-12 0.07 Bellspond. Oamaru-Studholme-Bellspond-Waitaki circuit tripped for a transient fault. Load restored by backfeed from Studholme.
3-Dec-12 0.07 Albany, Silverdale. Load reductions when both circuits on the Henderson-Otahuhu A line were removed from service because of significant corona discharge.
7-Dec-12 0.76 Kaitimako, Mt Maunganui, Tauranga. The Kaitimako-Tarukenga circuit 2 inadvertently tripped during testing of protection equipment on circuit 1 for Kaitimako 220 kV upgrade project.
10-Dec-12 0.10 Stoke. A section of the 33 kV bus was inadvertently tripped during the installation of arc detection protection at the substation.
18-Dec-12 2.42 Hawkes Bay and East Coast. One of the two 220/110 kV interconnecting transformers at the Redclyffe substation was out of service for maintenance and the other tripped on high temperature.
13-Feb-13 0.31 Kinleith. A supply transformer was inadvertently tripped during commissioning of new revenue metering.
14-Mar-13 0.10 Hinuera. The in-service transformer tripped incorrectly because of magnetic inrush when the second transformer was being returned to service.
4-Apr-13 0.13 Gisborne. The in-service transformer tripped incorrectly because of magnetic inrush when the second transformer was being returned to service.
5-Apr-13 0.10 Haywards. A supply transformer tripped because of tap changer fault.
17-Apr-13 0.14 Gisborne. The in-service supply transformer was inadvertently tripped via bus zone protection during testing.
18-Apr-13 2.23 Cambridge. All supply was lost when the 11 kV supply bus tripped because of a flashover caused by a deteriorated bus support insulator on the indoor bus.
Page 8 © 2013 Transpower New Zealand Limited
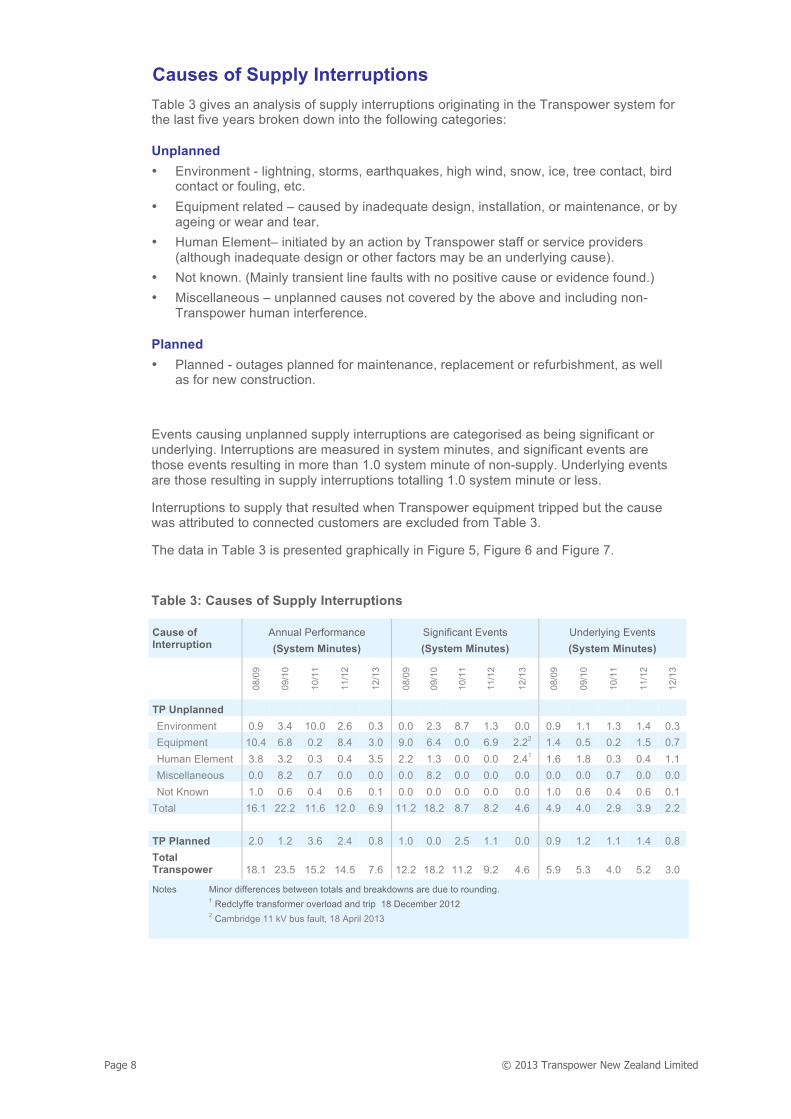
Causes of Supply Interruptions Table 3 gives an analysis of supply interruptions originating in the Transpower system for the last five years broken down into the following categories:
Unplanned Environment - lightning, storms, earthquakes, high wind, snow, ice, tree contact, bird
contact or fouling, etc. Equipment related – caused by inadequate design, installation, or maintenance, or by
ageing or wear and tear. Human Element– initiated by an action by Transpower staff or service providers
(although inadequate design or other factors may be an underlying cause). Not known. (Mainly transient line faults with no positive cause or evidence found.) Miscellaneous – unplanned causes not covered by the above and including non-
Transpower human interference.
Planned Planned - outages planned for maintenance, replacement or refurbishment, as well
as for new construction.
Events causing unplanned supply interruptions are categorised as being significant or underlying. Interruptions are measured in system minutes, and significant events are those events resulting in more than 1.0 system minute of non-supply. Underlying events are those resulting in supply interruptions totalling 1.0 system minute or less.
Interruptions to supply that resulted when Transpower equipment tripped but the cause was attributed to connected customers are excluded from Table 3.
The data in Table 3 is presented graphically in Figure 5, Figure 6 and Figure 7.
Table 3: Causes of Supply Interruptions
Cause of Interruption
Annual Performance (System Minutes)
Significant Events (System Minutes)
Underlying Events (System Minutes)
08/0
9
09/1
0
10/1
1
11/1
2
12/1
3
08/0
9
09/1
0
10/1
1
11/1
2
12/1
3
08/0
9
09/1
0
10/1
1
11/1
2
12/1
3
TP Unplanned
Environment 0.9 3.4 10.0 2.6 0.3 0.0 2.3 8.7 1.3 0.0 0.9 1.1 1.3 1.4 0.3 Equipment 10.4 6.8 0.2 8.4 3.0 9.0 6.4 0.0 6.9 2.22 1.4 0.5 0.2 1.5 0.7 Human Element 3.8 3.2 0.3 0.4 3.5 2.2 1.3 0.0 0.0 2.41 1.6 1.8 0.3 0.4 1.1 Miscellaneous 0.0 8.2 0.7 0.0 0.0 0.0 8.2 0.0 0.0 0.0 0.0 0.0 0.7 0.0 0.0 Not Known 1.0 0.6 0.4 0.6 0.1 0.0 0.0 0.0 0.0 0.0 1.0 0.6 0.4 0.6 0.1 Total 16.1 22.2 11.6 12.0 6.9 11.2 18.2 8.7 8.2 4.6 4.9 4.0 2.9 3.9 2.2 TP Planned 2.0 1.2 3.6 2.4 0.8 1.0 0.0 2.5 1.1 0.0 0.9 1.2 1.1 1.4 0.8 Total Transpower 18.1 23.5 15.2 14.5 7.6 12.2 18.2 11.2 9.2 4.6 5.9 5.3 4.0 5.2 3.0
Notes Minor differences between totals and breakdowns are due to rounding. 1 Redclyffe transformer overload and trip 18 December 2012 2 Cambridge 11 kV bus fault, 18 April 2013
© 2013 Transpower New Zealand Limited Page 9
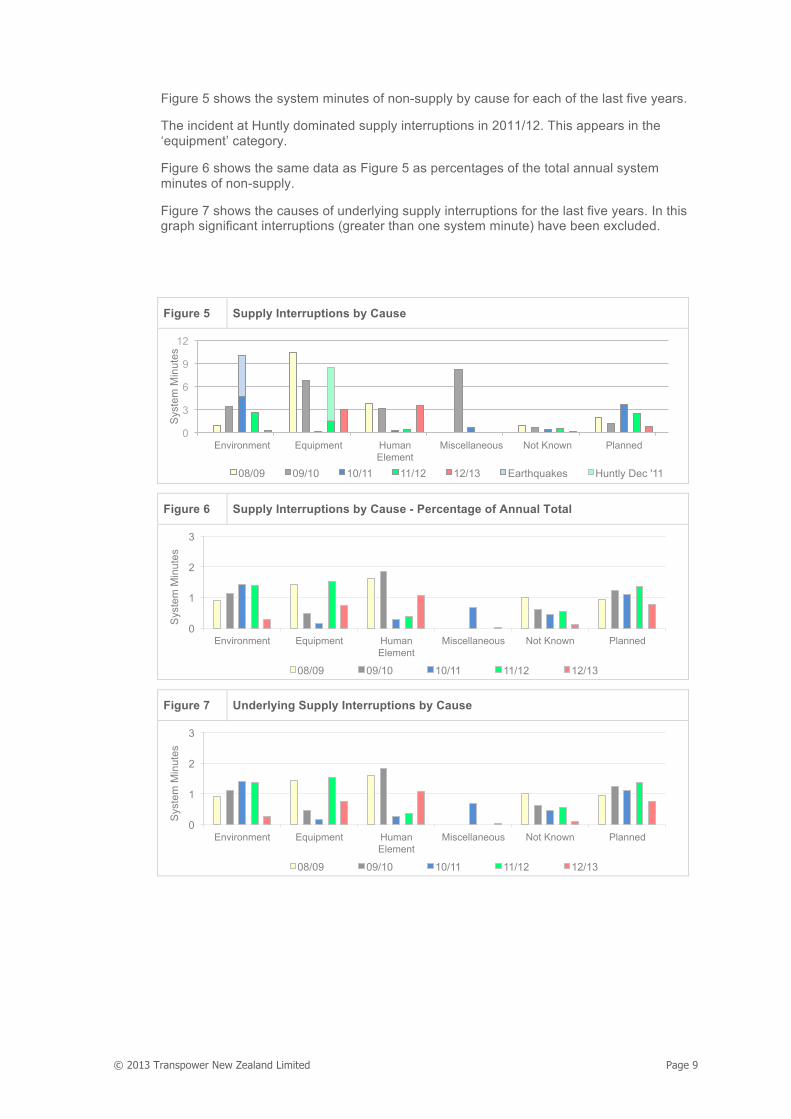
Figure 5 shows the system minutes of non-supply by cause for each of the last five years.
The incident at Huntly dominated supply interruptions in 2011/12. This appears in the ‘equipment’ category.
Figure 6 shows the same data as Figure 5 as percentages of the total annual system minutes of non-supply.
Figure 7 shows the causes of underlying supply interruptions for the last five years. In this graph significant interruptions (greater than one system minute) have been excluded.
Figure 5 Supply Interruptions by Cause
Figure 6 Supply Interruptions by Cause - Percentage of Annual Total
Figure 7 Underlying Supply Interruptions by Cause
0
3
6
9
12
Environment Equipment Human Element
Miscellaneous Not Known Planned
Sys
tem
Min
utes
08/09 09/10 10/11 11/12 12/13 Earthquakes Huntly Dec '11
0
1
2
3
Environment Equipment Human Element
Miscellaneous Not Known Planned
Sys
tem
Min
utes
08/09 09/10 10/11 11/12 12/13
0
1
2
3
Environment Equipment Human Element
Miscellaneous Not Known Planned
Sys
tem
Min
utes
08/09 09/10 10/11 11/12 12/13
Page 10 © 2013 Transpower New Zealand Limited
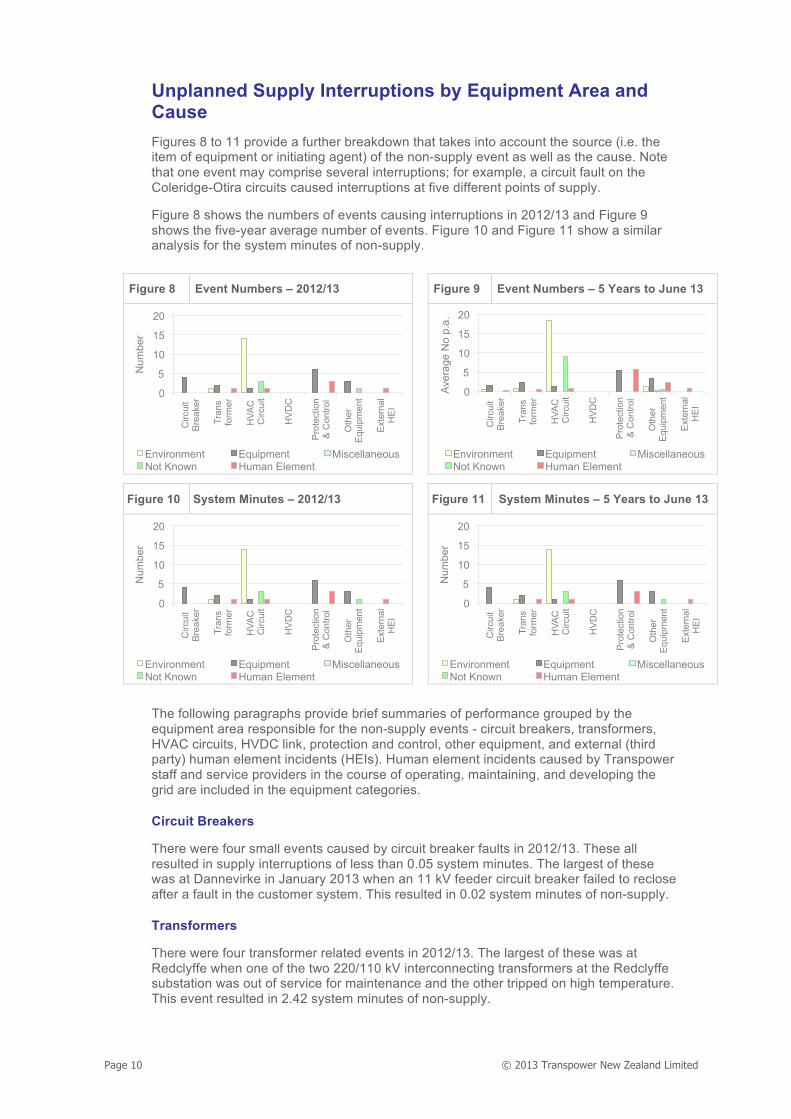
Unplanned Supply Interruptions by Equipment Area and Cause Figures 8 to 11 provide a further breakdown that takes into account the source (i.e. the item of equipment or initiating agent) of the non-supply event as well as the cause. Note that one event may comprise several interruptions; for example, a circuit fault on the Coleridge-Otira circuits caused interruptions at five different points of supply.
Figure 8 shows the numbers of events causing interruptions in 2012/13 and Figure 9 shows the five-year average number of events. Figure 10 and Figure 11 show a similar analysis for the system minutes of non-supply.
Figure 8 Event Numbers – 2012/13 Figure 9 Event Numbers – 5 Years to June 13
Figure 10 System Minutes – 2012/13 Figure 11 System Minutes – 5 Years to June 13
The following paragraphs provide brief summaries of performance grouped by the equipment area responsible for the non-supply events - circuit breakers, transformers, HVAC circuits, HVDC link, protection and control, other equipment, and external (third party) human element incidents (HEIs). Human element incidents caused by Transpower staff and service providers in the course of operating, maintaining, and developing the grid are included in the equipment categories.
Circuit Breakers
There were four small events caused by circuit breaker faults in 2012/13. These all resulted in supply interruptions of less than 0.05 system minutes. The largest of these was at Dannevirke in January 2013 when an 11 kV feeder circuit breaker failed to reclose after a fault in the customer system. This resulted in 0.02 system minutes of non-supply.
Transformers
There were four transformer related events in 2012/13. The largest of these was at Redclyffe when one of the two 220/110 kV interconnecting transformers at the Redclyffe substation was out of service for maintenance and the other tripped on high temperature. This event resulted in 2.42 system minutes of non-supply.
0
5
10
15
20
Circ
uit
Bre
aker
Tran
s fo
rmer
HVA
C
Circ
uit
HV
DC
Pro
tect
ion
&
Con
trol
Oth
er
Equ
ipm
ent
Ext
erna
l H
EI
Num
ber
Environment Equipment Miscellaneous Not Known Human Element
0
5
10
15
20
Circ
uit
Bre
aker
Tran
s fo
rmer
HVA
C
Circ
uit
HV
DC
Pro
tect
ion
&
Con
trol
Oth
er
Equ
ipm
ent
Ext
erna
l H
EI
Aver
age
No
p.a.
Environment Equipment Miscellaneous Not Known Human Element
0
5
10
15
20
Circ
uit
Bre
aker
Tran
s fo
rmer
HVA
C
Circ
uit
HV
DC
Pro
tect
ion
&
Con
trol
Oth
er
Equ
ipm
ent
Ext
erna
l H
EI
Num
ber
Environment Equipment Miscellaneous Not Known Human Element
0
5
10
15
20
Circ
uit
Bre
aker
Tran
s fo
rmer
HVA
C
Circ
uit
HV
DC
Pro
tect
ion
&
Con
trol
Oth
er
Equ
ipm
ent
Ext
erna
l H
EI
Num
ber
Environment Equipment Miscellaneous Not Known Human Element

© 2013 Transpower New Zealand Limited Page 11
HVAC Circuits
Outages due to environmental causes dominate circuit performance; the most usual reason being lightning, although snow and high winds cause a number of outages. Outages categorised as “not known” are usually transient faults that cause a circuit to trip but for which no positive cause or evidence has been found. These could be caused by environmental factors, or possibly by faulty hardware.
The number of events caused by transmission line faults in 2012/13 was lower than the five-year average, mostly because of a significant improvement in the performance of the Te Kaha-Waiotahi circuit that caused only one lines-related loss of supply event in 2012/13 compared to 13 in 2011/12.
The largest events in this category in 2012/13 were the tripping of the Oamaru-Studholme-Bellspond-Waitaki circuit for a transient fault, and the load reductions in Auckland when both circuits on the Henderson-Otahuhu A line were removed from service because of significant corona discharge. Both these events resulted in 0.07 system minutes of non-supply.
HVDC Link
In the last five years there have been no events originating on the HVDC link which caused supply interruptions (other than to interruptible load).
Protection and Control
This category includes interruptions caused by equipment faults or problems with protection, SCADA, and control equipment. The most common causes of events in this category were protection and SCADA mal-operations, and errors during testing.
The number of non-supply events in this group in 2012/13 and the resultant system minutes are similar to the five-year average for this group. The largest event in this category was in the Bay of Plenty when a 220 kV circuit into Kaitimako was tripped during commissioning tests for the BOP 220 kV upgrade project. This resulted in 0.76 system minutes.
Other Equipment
The “Other Equipment” category includes interruptions caused by faults on equipment not included in the categories above, for example, disconnectors, current transformers, bus work, and station services. The most common causes of events in this category are bus insulator and bus connector faults and disconnector problems.
The number of events in this category in 2012/13 and the system minutes of non-supply are both approximately 50 percent lower than the five-year average. The largest event in 2012/13 was at Cambridge when the 11 kV supply bus tripped because of an internal flashover caused by a deteriorated bus support insulator on the indoor bus. This event resulted in 2.23 system minutes of non-supply.
External Human Element
This category is for events caused by interference by third parties. In 2012/13 there was one minor event totalling 0.02 system minutes. The five-year average is dominated by the tripping of the Henderson-Otahuhu circuit in 2009/10 when a container hoist contacted the blue phase conductor causing widespread interruptions in Auckland and Northland.
Page 12 © 2013 Transpower New Zealand Limited
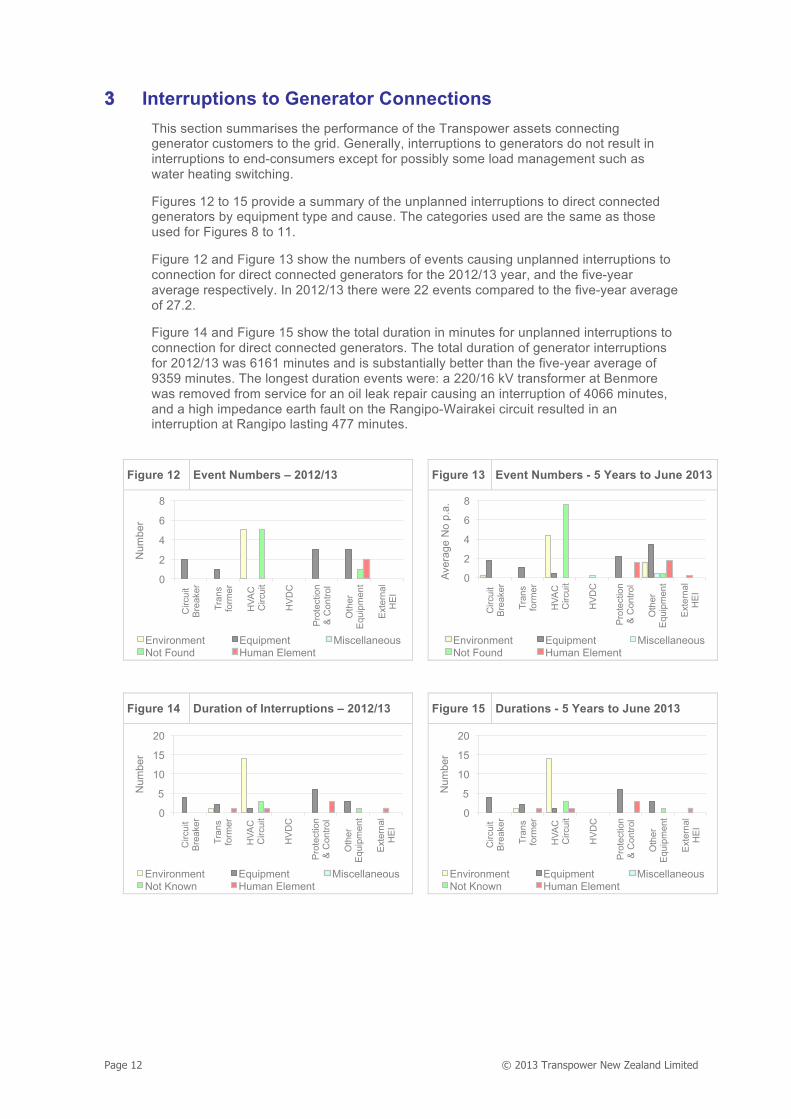
33 Interruptions to Generator Connections This section summarises the performance of the Transpower assets connecting generator customers to the grid. Generally, interruptions to generators do not result in interruptions to end-consumers except for possibly some load management such as water heating switching.
Figures 12 to 15 provide a summary of the unplanned interruptions to direct connected generators by equipment type and cause. The categories used are the same as those used for Figures 8 to 11.
Figure 12 and Figure 13 show the numbers of events causing unplanned interruptions to connection for direct connected generators for the 2012/13 year, and the five-year average respectively. In 2012/13 there were 22 events compared to the five-year average of 27.2.
Figure 14 and Figure 15 show the total duration in minutes for unplanned interruptions to connection for direct connected generators. The total duration of generator interruptions for 2012/13 was 6161 minutes and is substantially better than the five-year average of 9359 minutes. The longest duration events were: a 220/16 kV transformer at Benmore was removed from service for an oil leak repair causing an interruption of 4066 minutes, and a high impedance earth fault on the Rangipo-Wairakei circuit resulted in an interruption at Rangipo lasting 477 minutes.
Figure 12 Event Numbers – 2012/13 Figure 13 Event Numbers - 5 Years to June 2013
Figure 14 Duration of Interruptions – 2012/13 Figure 15 Durations - 5 Years to June 2013
0
2
4
6
8
Circ
uit
Bre
aker
Tran
s fo
rmer
HVA
C
Circ
uit
HV
DC
Pro
tect
ion
&
Con
trol
Oth
er
Equ
ipm
ent
Ext
erna
l H
EI
Num
ber
Environment Equipment Miscellaneous Not Found Human Element
0
2
4
6
8 C
ircui
t B
reak
er
Tran
s fo
rmer
HVA
C
Circ
uit
HV
DC
Pro
tect
ion
&
Con
trol
Oth
er
Equ
ipm
ent
Ext
erna
l H
EI
Aver
age
No
p.a.
Environment Equipment Miscellaneous Not Found Human Element
0
5
10
15
20
Circ
uit
Bre
aker
Tran
s fo
rmer
HVA
C
Circ
uit
HV
DC
Pro
tect
ion
&
Con
trol
Oth
er
Equ
ipm
ent
Ext
erna
l H
EI
Num
ber
Environment Equipment Miscellaneous Not Known Human Element
0
5
10
15
20
Circ
uit
Bre
aker
Tran
s fo
rmer
HVA
C
Circ
uit
HV
DC
Pro
tect
ion
&
Con
trol
Oth
er
Equ
ipm
ent
Ext
erna
l H
EI
Num
ber
Environment Equipment Miscellaneous Not Known Human Element
© 2013 Transpower New Zealand Limited Page 13
44 HVAC Transmission Performance Circuit Forced Outages
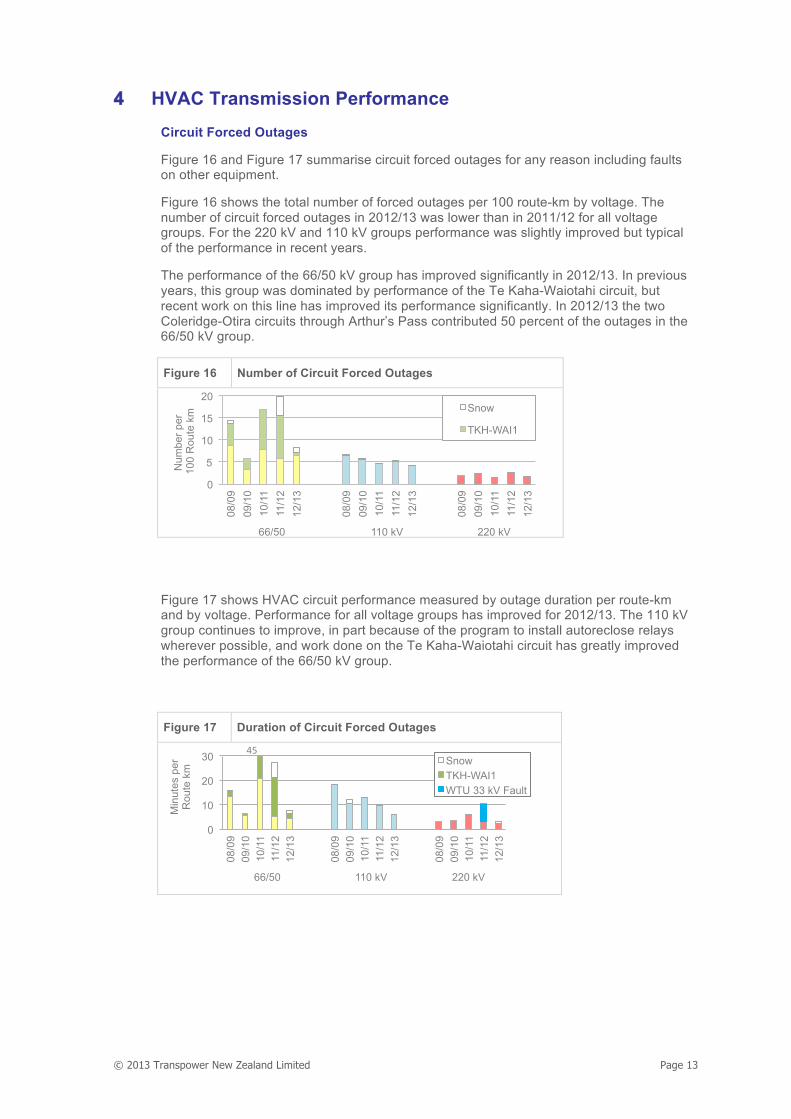
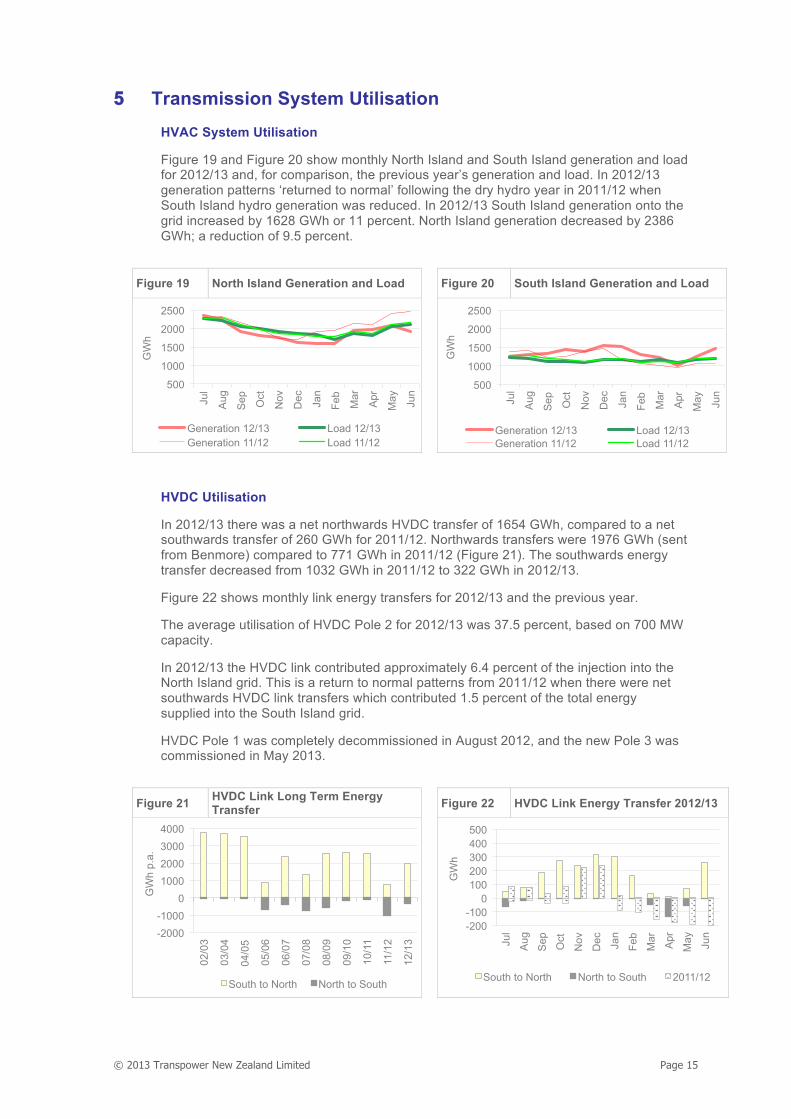
Figure 16 and Figure 17 summarise circuit forced outages for any reason including faults on other equipment.
Figure 16 shows the total number of forced outages per 100 route-km by voltage. The number of circuit forced outages in 2012/13 was lower than in 2011/12 for all voltage groups. For the 220 kV and 110 kV groups performance was slightly improved but typical of the performance in recent years.
The performance of the 66/50 kV group has improved significantly in 2012/13. In previous years, this group was dominated by performance of the Te Kaha-Waiotahi circuit, but recent work on this line has improved its performance significantly. In 2012/13 the two Coleridge-Otira circuits through Arthur’s Pass contributed 50 percent of the outages in the 66/50 kV group.
Figure 16 Number of Circuit Forced Outages
Figure 17 shows HVAC circuit performance measured by outage duration per route-km and by voltage. Performance for all voltage groups has improved for 2012/13. The 110 kV group continues to improve, in part because of the program to install autoreclose relays wherever possible, and work done on the Te Kaha-Waiotahi circuit has greatly improved the performance of the 66/50 kV group.
Figure 17 Duration of Circuit Forced Outages
0
5
10
15
20
08/0
9 09
/10
10/1
1 11
/12
12/1
3
08/0
9 09
/10
10/1
1 11
/12
12/1
3
08/0
9 09
/10
10/1
1 11
/12
12/1
3 66/50 110 kV 220 kV
Num
ber p
er
100
Rou
te k
m Snow
TKH-WAI1
0
10
20
30
08/0
9 09
/10
10/1
1 11
/12
12/1
3
08/0
9 09
/10
10/1
1 11
/12
12/1
3
08/0
9 09
/10
10/1
1 11
/12
12/1
3
66/50 110 kV 220 kV
Min
utes
per
R
oute
km
Snow TKH-WAI1 WTU 33 kV Fault
45

Page 14 © 2013 Transpower New Zealand Limited
HVAC Transmission Circuit Availability
Figure 18 shows the monthly HVAC transmission circuit availability for 2012/13. The overall availability of HVAC circuits after allowing for forced4 and planned outages5 was 98.7 percent, and was better than the target of 98.5 percent.
Figure 18 HVAC Transmission Availability 12/13
In 2012/13, planned circuit outages accounted for 1.23 percent of annual availability and unplanned outages resulted in only 0.03 percent.
4 The term “forced” is generally used in relation to HVAC transmission circuit performance reporting. In the context of this report it is equivalent to the term “unplanned” used for system minute interruptions. This includes outages caused by both protection operations and manual intervention. 5 An outage is the removal from service of a transmission asset. An outage does not necessarily result in an interruption to a customer, depending on whether the asset is the only connection between a customer and the grid, or one of a number of parallel paths.
98
99
100
Jul Aug Sep Oct Nov Dec Jan Feb Mar Apr May Jun
Avai
labi
lity
%
Planned Outages Forced Outages Availability
© 2013 Transpower New Zealand Limited Page 15
55 Transmission System Utilisation HVAC System Utilisation
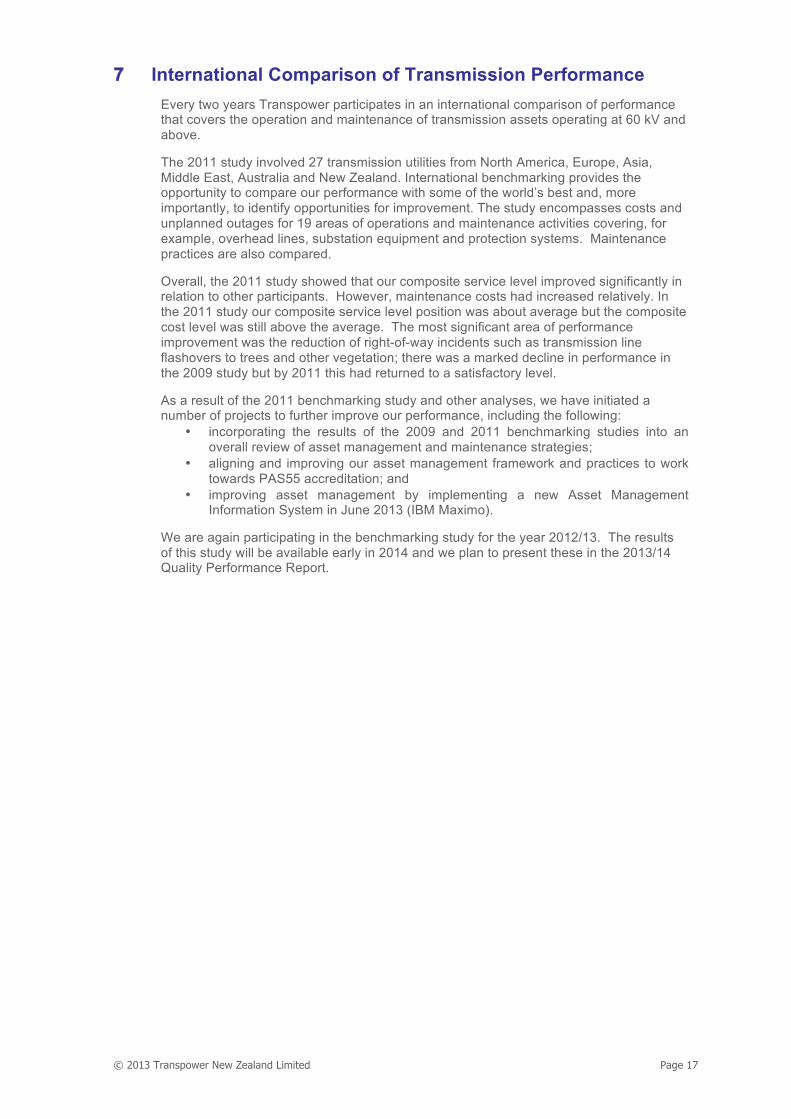
Figure 19 and Figure 20 show monthly North Island and South Island generation and load for 2012/13 and, for comparison, the previous year’s generation and load. In 2012/13 generation patterns ‘returned to normal’ following the dry hydro year in 2011/12 when South Island hydro generation was reduced. In 2012/13 South Island generation onto the grid increased by 1628 GWh or 11 percent. North Island generation decreased by 2386 GWh; a reduction of 9.5 percent.
Figure 19 North Island Generation and Load Figure 20 South Island Generation and Load
HVDC Utilisation
In 2012/13 there was a net northwards HVDC transfer of 1654 GWh, compared to a net southwards transfer of 260 GWh for 2011/12. Northwards transfers were 1976 GWh (sent from Benmore) compared to 771 GWh in 2011/12 (Figure 21). The southwards energy transfer decreased from 1032 GWh in 2011/12 to 322 GWh in 2012/13.
Figure 22 shows monthly link energy transfers for 2012/13 and the previous year.
The average utilisation of HVDC Pole 2 for 2012/13 was 37.5 percent, based on 700 MW capacity.
In 2012/13 the HVDC link contributed approximately 6.4 percent of the injection into the North Island grid. This is a return to normal patterns from 2011/12 when there were net southwards HVDC link transfers which contributed 1.5 percent of the total energy supplied into the South Island grid.
HVDC Pole 1 was completely decommissioned in August 2012, and the new Pole 3 was commissioned in May 2013.
Figure 21 HVDC Link Long Term Energy Transfer
Figure 22 HVDC Link Energy Transfer 2012/13
500
1000
1500
2000
2500
Jul
Aug
Sep
Oct
Nov
Dec
Jan
Feb
Mar
Apr
May
Jun
Generation 12/13 Load 12/13 Generation 11/12 Load 11/12
GW
h
500
1000
1500
2000
2500
Jul
Aug
Sep
Oct
Nov
Dec
Jan
Feb
Mar
Apr
May
Jun
Generation 12/13 Load 12/13 Generation 11/12 Load 11/12
GW
h
-2000 -1000
0 1000 2000 3000 4000
02/0
3
03/0
4
04/0
5
05/0
6
06/0
7
07/0
8
08/0
9
09/1
0
10/1
1
11/1
2
12/1
3
GW
h p.
a.
South to North North to South
-200 -100
0 100 200 300 400 500
Jul
Aug
Sep
Oct
Nov
Dec
Jan
Feb
Mar
Apr
May
Jun
GW
h
South to North North to South 2011/12

Page 16 © 2013 Transpower New Zealand Limited
66 HVDC Link Availability6 Pole 1
Pole 1 was stood down in September 2007 to remove the risk of an in-service failure, and half of the equipment was decommissioned and removed. At that time the remaining half was made available and used for limited periods of operation with restricted operating conditions. This remaining half of Pole 1 was decommissioned on 1 August 2012.
Pole 2
The availability of Pole 2 in 2012/13 was 90.3 percent and was above the target of 82.5 percent. The target was set relatively low because of planned capacity reductions during the project to reconductor the Haywards-Oteranga Bay section of the HVDC line, and other work associated with the HVDC upgrade. This work was co-ordinated with the HVDC Pole 3 project and affected availability at various times throughout the year.
The Forced Unavailability in 2012/13 was 0.68 percent (0.11 percent in 2011/12). There were 23 forced outages in 2012/13 (four in 2011/12) but 14 of these were related to HVDC upgrade work.
Pole 3
Pole 3 was commissioned in May 2013, and achieved 99.4 percent availability for the first full month of operation in June 2013.
HVDC Pole 2 monthly availability is shown in Figure 23.
Figure 23 HVDC Link Availability (Pole 2)
6 The term “availability”, in relation to HVDC link performance follows the definition of “Energy Availability” used by CIGRE Study Committee 14 Protocol for Reporting the Operational Performance of HVDC Transmission Systems.
50
60
70
80
90
100
Jul Aug Sep Oct Nov Dec Jan Feb Mar Apr May Jun
Avai
labi
lity
%
Scheduled Outages Forced Outages Net Availability
© 2013 Transpower New Zealand Limited Page 17
77 International Comparison of Transmission Performance Every two years Transpower participates in an international comparison of performance that covers the operation and maintenance of transmission assets operating at 60 kV and above.
The 2011 study involved 27 transmission utilities from North America, Europe, Asia, Middle East, Australia and New Zealand. International benchmarking provides the opportunity to compare our performance with some of the world’s best and, more importantly, to identify opportunities for improvement. The study encompasses costs and unplanned outages for 19 areas of operations and maintenance activities covering, for example, overhead lines, substation equipment and protection systems. Maintenance practices are also compared.
Overall, the 2011 study showed that our composite service level improved significantly in relation to other participants. However, maintenance costs had increased relatively. In the 2011 study our composite service level position was about average but the composite cost level was still above the average. The most significant area of performance improvement was the reduction of right-of-way incidents such as transmission line flashovers to trees and other vegetation; there was a marked decline in performance in the 2009 study but by 2011 this had returned to a satisfactory level.
As a result of the 2011 benchmarking study and other analyses, we have initiated a number of projects to further improve our performance, including the following:
incorporating the results of the 2009 and 2011 benchmarking studies into an overall review of asset management and maintenance strategies;
aligning and improving our asset management framework and practices to work towards PAS55 accreditation; and
improving asset management by implementing a new Asset Management Information System in June 2013 (IBM Maximo).
We are again participating in the benchmarking study for the year 2012/13. The results of this study will be available early in 2014 and we plan to present these in the 2013/14 Quality Performance Report.
Page 18 © 2013 Transpower New Zealand Limited
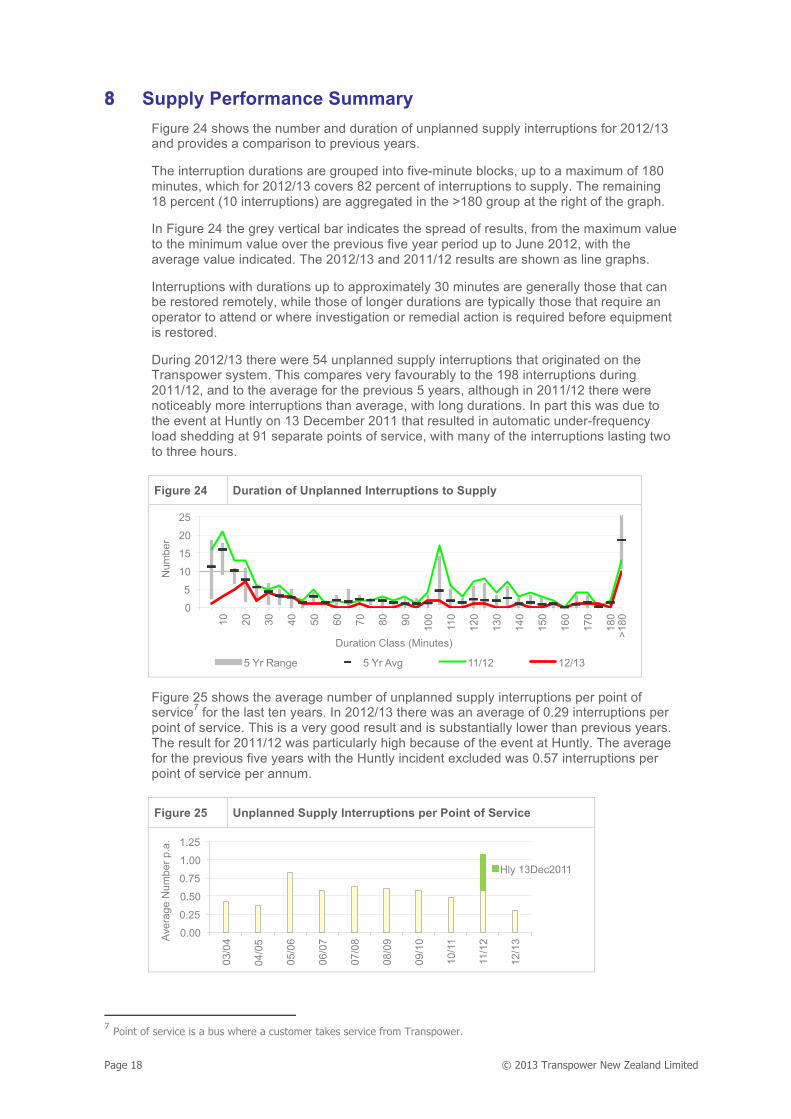
88 Supply Performance Summary Figure 24 shows the number and duration of unplanned supply interruptions for 2012/13 and provides a comparison to previous years.
The interruption durations are grouped into five-minute blocks, up to a maximum of 180 minutes, which for 2012/13 covers 82 percent of interruptions to supply. The remaining 18 percent (10 interruptions) are aggregated in the >180 group at the right of the graph.
In Figure 24 the grey vertical bar indicates the spread of results, from the maximum value to the minimum value over the previous five year period up to June 2012, with the average value indicated. The 2012/13 and 2011/12 results are shown as line graphs.
Interruptions with durations up to approximately 30 minutes are generally those that can be restored remotely, while those of longer durations are typically those that require an operator to attend or where investigation or remedial action is required before equipment is restored.
During 2012/13 there were 54 unplanned supply interruptions that originated on the Transpower system. This compares very favourably to the 198 interruptions during 2011/12, and to the average for the previous 5 years, although in 2011/12 there were noticeably more interruptions than average, with long durations. In part this was due to the event at Huntly on 13 December 2011 that resulted in automatic under-frequency load shedding at 91 separate points of service, with many of the interruptions lasting two to three hours.
Figure 24 Duration of Unplanned Interruptions to Supply
Figure 25 shows the average number of unplanned supply interruptions per point of service7 for the last ten years. In 2012/13 there was an average of 0.29 interruptions per point of service. This is a very good result and is substantially lower than previous years. The result for 2011/12 was particularly high because of the event at Huntly. The average for the previous five years with the Huntly incident excluded was 0.57 interruptions per point of service per annum.
Figure 25 Unplanned Supply Interruptions per Point of Service
7 Point of service is a bus where a customer takes service from Transpower.
0
5
10
15
20
25
10
20
30
40
50
60
70
80
90
100
110
120
130
140
150
160
170
180
>180
Num
ber
5 Yr Range 5 Yr Avg 11/12 12/13
Duration Class (Minutes)
0.00
0.25
0.50
0.75
1.00
1.25
03/0
4
04/0
5
05/0
6
06/0
7
07/0
8
08/0
9
09/1
0
10/1
1
11/1
2
12/1
3 Aver
age
Num
ber p
.a.
Hly 13Dec2011

© 2013 Transpower New Zealand Limited Page 19
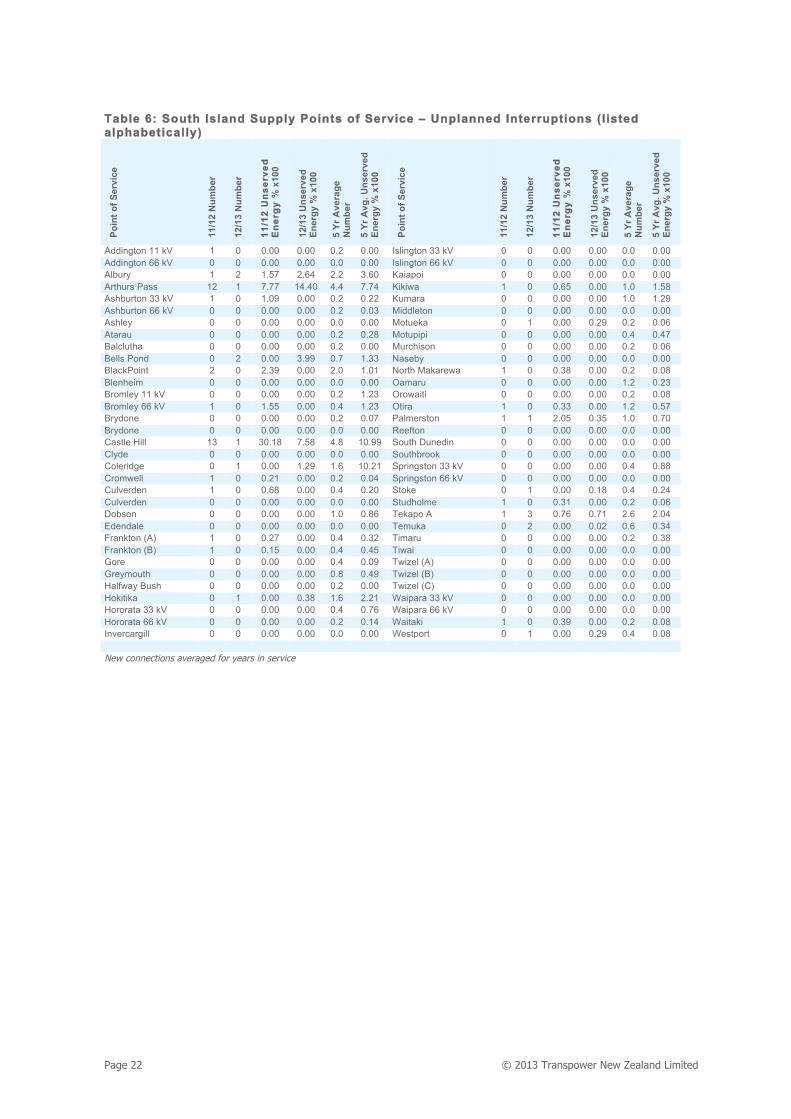
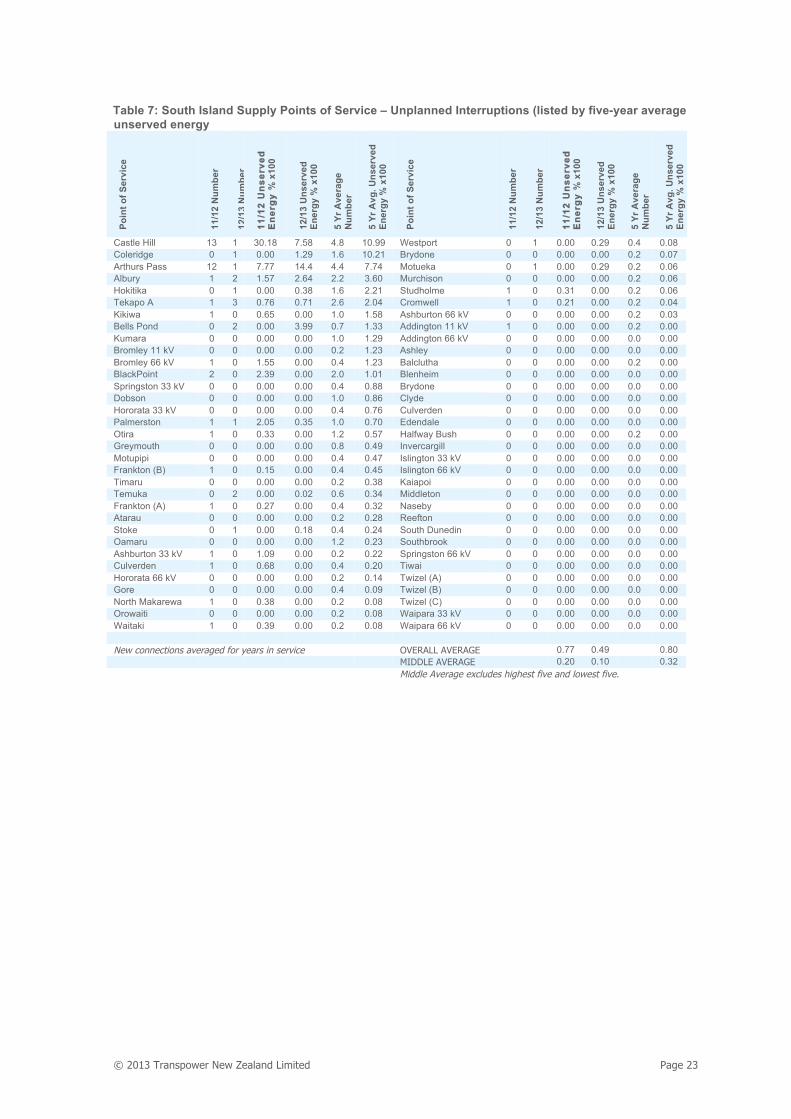
99 Point of Service Performance The tables and graph on the following pages summarise performance at individual points of service7. These measures indicate the impact on service of Transpower-caused unplanned interruptions. These include both partial and full interruptions to connection due to a fault or human interference. The measures are aggregated at each point of service, but include interruptions originating anywhere on the Transpower system up to the point of connection8. The tables cover points of service for both supply customers and direct-connected generator customers. The points of service listed are those in service as at 30 June 2013.
Supply Customers
Tables 4 to 7 summarise unplanned interruptions to supply originating in the Transpower system including interference caused by the public. The tables show the number of interruptions, and the unserved energy expressed as a percentage of the total energy that would have been supplied during the year had there not been any supply interruptions.
Data is shown separately for each supply voltage at the station of supply. If two customers are supplied from a station at the same voltage then these are shown separately as Station (A) and Station (B). Tables 4 and 5 present the data for the North Island sorted both alphabetically, and by five-year average unserved energy, and tables 6 and 7 similarly for the South Island.
Generator Customers
For direct-connected generator customers, the point of service performance is shown in Tables 8 and 9 as the number of unplanned interruptions to service caused by forced outages and the duration in minutes of the interruptions. The data is shown sorted both alphabetically and by five-year9 average annual duration.
8 Point of connection is the point where customer assets are connected to Transpower assets. One point of service will
have one or more points of connection. 9 For points of service that have been in service for less than five years, the figure given is the average for the years in
service.

Page 20 © 2013 Transpower New Zealand Limited
Point of Service Performance - Supply
TTaabbllee 44:: NNoorrtthh IIssllaanndd SSuuppppllyy PPooiinnttss ooff SSeerrvviiccee –– UUnnppllaannnneedd IInntteerrrruuppttiioonnss ((ll iisstteedd aallpphhaabbeettiiccaallllyy))
Poin
t of S
ervi
ce
11/1
2 N
umbe
r
12/1
3 N
umbe
r
1111//11
22 UU
nnssee
rrvveedd
EE
nneerr
ggyy
% x
100
12/1
3 U
nser
ved
Ener
gy %
x10
0
5 Yr
Ave
rage
N
umbe
r
5 Yr
Avg
. Uns
erve
d En
ergy
% x
100
Poin
t of S
ervi
ce
11/1
2 N
umbe
r
12/1
3 N
umbe
r
1111//11
22 UU
nnssee
rrvveedd
EE
nneerr
ggyy
% x
100
12/1
3 U
nser
ved
Ener
gy %
x10
0
5 Yr
Ave
rage
N
umbe
r
5 Yr
Avg
. Uns
erve
d En
ergy
% x
100
Albany 110 kV 1 0 0.12 0.00 0.6 0.64 Mt Maunganui 33 kV 1 1 0.43 1.03 0.8 0.70 Albany 33 kV 0 1 0.00 0.09 0.6 0.50 Mt Roskill 110 kV 1 0 0.13 0.00 0.4 0.09 Bombay 110 kV 1 0 0.26 0.00 0.4 0.20 Mt Roskill 22 kV 1 0 0.01 0.00 0.4 0.14 Bombay 33 kV 1 0 0.44 0.00 0.6 1.13 National Park 5 0 1.60 0.00 2.0 1.60 Bream Bay 1 0 0.27 0.00 0.6 0.21 New Plymouth 33 kV 1 0 1.15 0.00 0.3 0.38 Brunswick 1 0 0.24 0.00 0.2 0.05 Ohakune (A) 3 0 3.22 0.00 0.8 0.94 Bunnythorpe 33 kV 1 0 0.69 0.00 0.2 0.14 Ohakune (B) 2 0 3.75 0.00 0.6 1.17 Bunnythorpe 55 kV 1 0 1.18 0.00 0.2 0.24 Ongarue 3 0 4.21 0.00 1.0 3.33 Cambridge 2 1 0.51 12.06 0.6 2.51 Opunake 3 0 13.62 0.00 0.8 2.82 Carrington St 1 0 0.69 0.00 0.6 0.27 Otahuhu 22 kV (A) 1 0 0.19 0.00 0.4 0.27 Central Park 11 kV 0 0 0.00 0.00 0.4 0.37 Otahuhu 22 kV (B) 0 0 0.00 0.00 0.0 0.00 Central Park 33 kV 1 0 0.10 0.00 0.6 0.50 Owhata 1 0 1.10 0.00 0.4 0.70 Dannevirke 1 1 0.51 0.29 0.6 0.18 Pakuranga 1 0 0.04 0.00 0.4 0.15 Edgecumbe 1 0 0.52 0.00 0.2 0.10 Paraparaumu 2 0 0.89 0.00 0.4 0.18 Fernhill 1 1 0.32 1.84 0.4 0.43 Pauatahanui 1 0 0.21 0.00 0.2 0.04 Gisborne 2 3 0.82 5.25 1.0 1.21 Penrose 110 kV 1 0 0.08 0.00 0.4 0.10 Glenbrook (A) 0 0 0.00 0.00 0.2 0.61 Penrose 22 kV 1 0 0.12 0.00 0.6 0.67 Glenbrook (B) 0 0 0.00 0.00 0.8 1.20 Penrose 25 kV - 0 - 0.00 0.0 0.00 Gracefield 4 0 3.60 0.00 1.0 0.77 Penrose 33 kV (A) 1 0 0.14 0.00 0.6 0.73 Greytown 1 1 1.67 0.41 0.4 0.41 Penrose 33 kV (B) 0 0 0.00 0.00 0.2 0.00 Hamilton 11 kV 1 1 0.35 0.13 0.4 0.10 Piako - 0 - 0.00 0.0 0.00 Hamilton 33 kV 1 0 0.13 0.00 0.2 0.03 Redclyffe 1 1 0.62 1.02 0.4 0.33 Hamilton 55 kV 0 0 0.00 0.00 0.0 0.00 Rotorua 11 kV 1 0 0.48 0.00 0.4 0.10 Hangatiki 3 0 2.89 0.00 1.0 1.18 Rotorua 33 kV 1 0 0.45 0.00 0.2 0.09 Hawera (A) 2 0 3.02 0.00 0.6 0.88 Silverdale 1 1 0.01 0.04 0.8 0.59 Hawera (B) 1 0 2.19 0.00 0.2 0.44 Southdown 25 kV - 0 - 0.00 0.0 0.00 Haywards 11 kV 2 1 1.03 1.72 0.6 0.55 Stratford 1 0 0.68 0.00 0.2 0.14 Haywards 33 kV 1 1 0.19 0.00 0.4 0.04 Takanini 1 0 0.28 0.00 0.4 0.16 Henderson 1 0 0.00 0.00 0.6 0.25 Takapu Road 1 0 0.40 0.00 0.2 0.08 Hepburn Road 1 0 0.08 0.00 0.6 0.70 Tangiwai 11 kV 1 0 1.07 0.00 0.4 0.30 Hinuera 2 1 0.71 0.53 1.0 0.72 Tangiwai 55 kV 0 1 0.00 0.00 0.2 0.00 Huirangi 1 0 0.09 0.00 0.4 0.08 Tarukenga 2 0 2.03 0.00 0.4 0.41 Huntly 1 0 0.30 0.00 0.2 0.06 Taumarunui 4 4 0.03 0.12 3.2 0.88 Kaikohe 0 1 0.00 0.37 0.5 0.18 Tauranga 11 kV 1 1 0.42 0.85 0.6 0.45 Kaitimako 1 1 0.98 0.53 0.5 0.38 Tauranga 33 kV 1 1 1.65 2.32 0.6 1.18 Kaiwharawhara 2 1 0.36 0.23 1.2 0.74 Te Awamutu 2 0 0.70 0.00 1.6 2.18 Kawerau (A) 0 0 0.00 0.00 0.0 0.00 Te Kaha 20 1 14.70 3.83 13.8 34.21 Kawerau (B) 1 0 0.39 0.00 0.4 0.60 Te Kowhai 1 0 1.31 0.00 0.2 0.26 Kensington 1 0 0.37 0.00 0.6 0.99 Te Matai 1 0 0.33 0.00 0.6 0.22 Kinleith 11 kV 2 1 0.02 0.56 1.2 0.29 Tokaanu (A) 1 0 0.32 0.00 0.4 0.34 Kinleith 33 kV 1 0 1.63 0.00 1.0 1.03 Tuai 0 1 0.00 0.33 1.0 0.43 Kopu 0 0 0.00 0.00 0.0 0.00 Upper Hutt 1 0 0.82 0.00 0.2 0.16 Lichfield 0 0 0.00 0.00 0.0 0.00 Waihou 1 0 0.01 0.00 0.8 0.09 Linton 3 0 2.51 0.00 0.6 0.50 Waikino 1 0 0.27 0.00 0.2 0.05 Mangahao 2 0 3.75 0.00 0.4 0.75 Waiotahi 2 0 1.58 0.00 0.8 1.02 Mangamaire 1 0 1.11 0.00 0.2 0.22 Waipawa 33 & 11 kV 2 3 0.30 5.95 1.6 1.48 Mangere 110 kV 1 0 0.35 0.00 0.4 0.11 Wairakei 1 0 1.64 0.00 0.2 0.33 Mangere 33 kV 1 0 0.13 0.00 0.4 0.15 Wairau Road - 0 - 0.00 0.0 0.00 Marton 2 0 1.12 0.00 0.4 0.22 Wairoa 2 1 1.49 4.50 0.8 1.21 Masterton 1 0 0.83 0.00 0.2 0.17 Wanganui 2 2 1.91 0.39 0.8 0.46 Mataroa 0 0 0.00 0.00 0.4 0.48 Waverley 1 1 3.04 0.12 0.6 0.92 Maungatapere - 0 - 0.00 0.0 0.00 Wellsford 0 0 0.00 0.00 0.2 0.68 Maungaturoto 2 1 0.45 0.47 1.0 1.38 Whakatu 2 0 0.50 0.00 0.4 0.10 Melling 11kV 1 0 1.30 0.00 0.4 0.29 Whirinaki 2 0 2.20 0.00 1.2 2.96 Melling 33 kV 1 0 1.71 0.00 0.2 0.34 Wilton 1 0 0.04 0.00 0.2 0.01 Meremere 1 1 0.08 1.79 0.8 1.24 Wiri 1 0 0.22 0.00 0.8 0.25 Motunui 0 0 0.00 0.00 0.2 0.20 Woodville 0 0 0.00 0.00 0.2 1.59 New connections averaged for years in service

© 2013 Transpower New Zealand Limited Page 21
TTaabbllee 55:: NNoorrtthh IIssllaanndd SSuuppppllyy PPooiinnttss ooff SSeerrvviiccee –– UUnnppllaannnneedd IInntteerrrruuppttiioonnss ((ll iisstteedd bbyy ffiivvee--yyeeaarr aavveerraaggee uunnsseerrvveedd eenneerrggyy))
Poin
t of S
ervi
ce
11/1
2 N
umbe
r
12/1
3 N
umbe
r
1111//11
22 UU
nnssee
rrvveedd
EE
nneerr
ggyy
% x
100
12/1
3 U
nser
ved
Ener
gy %
x10
0
5 Yr
Ave
rage
N
umbe
r
5 Yr
Avg
. Uns
erve
d En
ergy
% x
100
Poin
t of S
ervi
ce
11/1
2 N
umbe
r
12/1
3 N
umbe
r
1111//11
22 UU
nnssee
rrvveedd
EE
nneerr
ggyy
% x
100
12/1
3 U
nser
ved
Ener
gy %
x10
0
5 Yr
Ave
rage
N
umbe
r
5 Yr
Avg
. Uns
erve
d En
ergy
% x
100
Te Kaha 20 1 14.70 3.83 13.8 34.21 Wairakei 1 0 1.64 0.00 0.2 0.33 Ongarue 3 0 4.21 0.00 1.0 3.33 Tangiwai 11 kV 1 0 1.07 0.00 0.4 0.30 Whirinaki 2 0 2.20 0.00 1.2 2.96 Kinleith 11 kV 2 1 0.02 0.56 1.2 0.29 Opunake 3 0 13.62 0.00 0.8 2.82 Melling 11kV 1 0 1.30 0.00 0.4 0.29 Cambridge 2 1 0.51 12.06 0.6 2.51 Carrington St 1 0 0.69 0.00 0.6 0.27 Te Awamutu 2 0 0.70 0.00 1.6 2.18 Otahuhu 22 kV (A) 1 0 0.19 0.00 0.4 0.27 National Park 5 0 1.60 0.00 2.0 1.60 Te Kowhai 1 0 1.31 0.00 0.2 0.26 Woodville 0 0 0.00 0.00 0.2 1.59 Henderson 1 0 0.00 0.00 0.6 0.25 Waipawa 33 & 11 kV 2 3 0.30 5.95 1.6 1.48 Wiri 1 0 0.22 0.00 0.8 0.25 Maungaturoto 2 1 0.45 0.47 1.0 1.38 Bunnythorpe 55 kV 1 0 1.18 0.00 0.2 0.24 Meremere 1 1 0.08 1.79 0.8 1.24 Mangamaire 1 0 1.11 0.00 0.2 0.22 Gisborne 2 3 0.82 5.25 1.0 1.21 Marton 2 0 1.12 0.00 0.4 0.22 Wairoa 2 1 1.49 4.50 0.8 1.21 Te Matai 1 0 0.33 0.00 0.6 0.22 Glenbrook (B) 0 0 0.00 0.00 0.8 1.20 Bream Bay 1 0 0.27 0.00 0.6 0.21 Hangatiki 3 0 2.89 0.00 1.0 1.18 Bombay 110 kV 1 0 0.26 0.00 0.4 0.20 Tauranga 33 kV 1 1 1.65 2.32 0.6 1.18 Motunui 0 0 0.00 0.00 0.2 0.20 Ohakune (B) 2 0 3.75 0.00 0.6 1.17 Dannevirke 1 1 0.51 0.29 0.6 0.18 Bombay 33 kV 1 0 0.44 0.00 0.6 1.13 Kaikohe 0 1 0.00 0.37 0.5 0.18 Kinleith 33 kV 1 0 1.63 0.00 1.0 1.03 Paraparaumu 2 0 0.89 0.00 0.4 0.18 Waiotahi 2 0 1.58 0.00 0.8 1.02 Masterton 1 0 0.83 0.00 0.2 0.17 Kensington 1 0 0.37 0.00 0.6 0.99 Takanini 1 0 0.28 0.00 0.4 0.16 Ohakune (A) 3 0 3.22 0.00 0.8 0.94 Upper Hutt 1 0 0.82 0.00 0.2 0.16 Waverley 1 1 3.04 0.12 0.6 0.92 Mangere 33 kV 1 0 0.13 0.00 0.4 0.15 Hawera (A) 2 0 3.02 0.00 0.6 0.88 Pakuranga 1 0 0.04 0.00 0.4 0.15 Taumarunui 4 4 0.03 0.12 3.2 0.88 Bunnythorpe 33 kV 1 0 0.69 0.00 0.2 0.14 Gracefield 4 0 3.60 0.00 1.0 0.77 Mt Roskill 22 kV 1 0 0.01 0.00 0.4 0.14 Mangahao 2 0 3.75 0.00 0.4 0.75 Stratford 1 0 0.68 0.00 0.2 0.14 Kaiwharawhara 2 1 0.36 0.23 1.2 0.74 Mangere 110 kV 1 0 0.35 0.00 0.4 0.11 Penrose 33 kV (A) 1 0 0.14 0.00 0.6 0.73 Edgecumbe 1 0 0.52 0.00 0.2 0.10 Hinuera 2 1 0.71 0.53 1.0 0.72 Hamilton 11 kV 1 1 0.35 0.13 0.4 0.10 Hepburn Road 1 0 0.08 0.00 0.6 0.70 Penrose 110 kV 1 0 0.08 0.00 0.4 0.10 Mt Maunganui 33 kV 1 1 0.43 1.03 0.8 0.70 Rotorua 11 kV 1 0 0.48 0.00 0.4 0.10 Owhata 1 0 1.10 0.00 0.4 0.70 Whakatu 2 0 0.50 0.00 0.4 0.10 Wellsford 0 0 0.00 0.00 0.2 0.68 Mt Roskill 110 kV 1 0 0.13 0.00 0.4 0.09 Penrose 22 kV 1 0 0.12 0.00 0.6 0.67 Rotorua 33 kV 1 0 0.45 0.00 0.20 0.09 Albany 110 kV 1 0 0.12 0.00 0.6 0.64 Waihou 1 0 0.01 0.00 0.8 0.09 Glenbrook (A) 0 0 0.00 0.00 0.2 0.61 Huirangi 1 0 0.09 0.00 0.4 0.08 Kawerau (B) 1 0 0.39 0.00 0.4 0.60 Takapu Road 1 0 0.40 0.00 0.2 0.08 Silverdale 1 1 0.01 0.04 0.8 0.59 Huntly 1 0 0.30 0.00 0.2 0.06 Haywards 11 kV 2 1 1.03 1.72 0.6 0.55 Brunswick 1 0 0.24 0.00 0.2 0.05 Albany 33 kV 0 1 0.00 0.09 0.6 0.50 Waikino 1 0 0.27 0.00 0.20 0.05 Central Park 33 kV 1 0 0.10 0.00 0.6 0.50 Haywards 33 kV 1 1 0.19 0.00 0.4 0.04 Linton 3 0 2.51 0.00 0.6 0.50 Pauatahanui 1 0 0.21 0.00 0.2 0.04 Mataroa 0 0 0.00 0.00 0.4 0.48 Hamilton 33 kV 1 0 0.13 0.00 0.2 0.03 Wanganui 2 2 1.91 0.39 0.8 0.46 Wilton 1 0 0.04 0.00 0.2 0.01 Tauranga 11 kV 1 1 0.42 0.85 0.6 0.45 Hamilton 55 kV 0 0 0.00 0.00 0.0 0.00 Hawera (B) 1 0 2.19 0.00 0.2 0.44 Kawerau (A) 0 0 0.00 0.00 0.0 0.00 Fernhill 1 1 0.32 1.84 0.4 0.43 Kopu 0 0 0.00 0.00 0.0 0.00 Tuai 0 1 0.00 0.33 1.0 0.43 Lichfield 0 0 0.00 0.00 0.0 0.00 Greytown 1 1 1.67 0.41 0.4 0.41 Maungatapere - 0 - 0.00 0.0 0.00 Tarukenga 2 0 2.03 0.00 0.4 0.41 Otahuhu 22 kV (B) 0 0 0.00 0.00 0.0 0.00 Kaitimako 1 1 0.98 0.53 0.5 0.38 Penrose 25 kV - 0 - 0.00 0.0 0.00 New Plymouth 33 kV 1 0 1.15 0.00 0.3 0.38 Penrose 33 kV (B) 0 0 0.00 0.00 0.2 0.00 Central Park 11 kV 0 0 0.00 0.00 0.4 0.37 Piako - 0 - 0.00 0.0 0.00 Melling 33 kV 1 0 1.71 0.00 0.2 0.34 Southdown 25 kV - 0 - 0.00 0.0 0.00 Tokaanu (A) 1 0 0.32 0.00 0.4 0.34 Tangiwai 55 kV 0 1 0.00 0.00 0.2 0.00 Redclyffe 1 1 0.62 1.02 0.4 0.33 Wairau Road - 0 - 0.00 0.0 0.00 New connections averaged for years in service OVERALL AVERAGE 1.01 0.41 0.83 MIDDLE AVERAGE 0.74 0.30 0.47 Middle Average excludes highest five and lowest five.
Page 22 © 2013 Transpower New Zealand Limited
TTaabbllee 66:: SSoouutthh IIssllaanndd SSuuppppllyy PPooiinnttss ooff SSeerrvviiccee –– UUnnppllaannnneedd IInntteerrrruuppttiioonnss ((ll iisstteedd aallpphhaabbeettiiccaallllyy))
Poin
t of S
ervi
ce
11/1
2 N
umbe
r
12/1
3 N
umbe
r
1111//11
22 UU
nnssee
rrvveedd
EE
nneerr
ggyy
% x
100
12/1
3 U
nser
ved
Ener
gy %
x10
0
5 Yr
Ave
rage
N
umbe
r
5 Yr
Avg
. Uns
erve
d En
ergy
% x
100
Poin
t of S
ervi
ce
11/1
2 N
umbe
r
12/1
3 N
umbe
r
1111//11
22 UU
nnssee
rrvveedd
EE
nneerr
ggyy
% x
100
12/1
3 U
nser
ved
Ener
gy %
x10
0
5 Yr
Ave
rage
N
umbe
r
5 Yr
Avg
. Uns
erve
d En
ergy
% x
100
Addington 11 kV 1 0 0.00 0.00 0.2 0.00 Islington 33 kV 0 0 0.00 0.00 0.0 0.00 Addington 66 kV 0 0 0.00 0.00 0.0 0.00 Islington 66 kV 0 0 0.00 0.00 0.0 0.00 Albury 1 2 1.57 2.64 2.2 3.60 Kaiapoi 0 0 0.00 0.00 0.0 0.00 Arthurs Pass 12 1 7.77 14.40 4.4 7.74 Kikiwa 1 0 0.65 0.00 1.0 1.58 Ashburton 33 kV 1 0 1.09 0.00 0.2 0.22 Kumara 0 0 0.00 0.00 1.0 1.29 Ashburton 66 kV 0 0 0.00 0.00 0.2 0.03 Middleton 0 0 0.00 0.00 0.0 0.00 Ashley 0 0 0.00 0.00 0.0 0.00 Motueka 0 1 0.00 0.29 0.2 0.06 Atarau 0 0 0.00 0.00 0.2 0.28 Motupipi 0 0 0.00 0.00 0.4 0.47 Balclutha 0 0 0.00 0.00 0.2 0.00 Murchison 0 0 0.00 0.00 0.2 0.06 Bells Pond 0 2 0.00 3.99 0.7 1.33 Naseby 0 0 0.00 0.00 0.0 0.00 BlackPoint 2 0 2.39 0.00 2.0 1.01 North Makarewa 1 0 0.38 0.00 0.2 0.08 Blenheim 0 0 0.00 0.00 0.0 0.00 Oamaru 0 0 0.00 0.00 1.2 0.23 Bromley 11 kV 0 0 0.00 0.00 0.2 1.23 Orowaiti 0 0 0.00 0.00 0.2 0.08 Bromley 66 kV 1 0 1.55 0.00 0.4 1.23 Otira 1 0 0.33 0.00 1.2 0.57 Brydone 0 0 0.00 0.00 0.2 0.07 Palmerston 1 1 2.05 0.35 1.0 0.70 Brydone 0 0 0.00 0.00 0.0 0.00 Reefton 0 0 0.00 0.00 0.0 0.00 Castle Hill 13 1 30.18 7.58 4.8 10.99 South Dunedin 0 0 0.00 0.00 0.0 0.00 Clyde 0 0 0.00 0.00 0.0 0.00 Southbrook 0 0 0.00 0.00 0.0 0.00 Coleridge 0 1 0.00 1.29 1.6 10.21 Springston 33 kV 0 0 0.00 0.00 0.4 0.88 Cromwell 1 0 0.21 0.00 0.2 0.04 Springston 66 kV 0 0 0.00 0.00 0.0 0.00 Culverden 1 0 0.68 0.00 0.4 0.20 Stoke 0 1 0.00 0.18 0.4 0.24 Culverden 0 0 0.00 0.00 0.0 0.00 Studholme 1 0 0.31 0.00 0.2 0.06 Dobson 0 0 0.00 0.00 1.0 0.86 Tekapo A 1 3 0.76 0.71 2.6 2.04 Edendale 0 0 0.00 0.00 0.0 0.00 Temuka 0 2 0.00 0.02 0.6 0.34 Frankton (A) 1 0 0.27 0.00 0.4 0.32 Timaru 0 0 0.00 0.00 0.2 0.38 Frankton (B) 1 0 0.15 0.00 0.4 0.45 Tiwai 0 0 0.00 0.00 0.0 0.00 Gore 0 0 0.00 0.00 0.4 0.09 Twizel (A) 0 0 0.00 0.00 0.0 0.00 Greymouth 0 0 0.00 0.00 0.8 0.49 Twizel (B) 0 0 0.00 0.00 0.0 0.00 Halfway Bush 0 0 0.00 0.00 0.2 0.00 Twizel (C) 0 0 0.00 0.00 0.0 0.00 Hokitika 0 1 0.00 0.38 1.6 2.21 Waipara 33 kV 0 0 0.00 0.00 0.0 0.00 Hororata 33 kV 0 0 0.00 0.00 0.4 0.76 Waipara 66 kV 0 0 0.00 0.00 0.0 0.00 Hororata 66 kV 0 0 0.00 0.00 0.2 0.14 Waitaki 1 0 0.39 0.00 0.2 0.08 Invercargill 0 0 0.00 0.00 0.0 0.00 Westport 0 1 0.00 0.29 0.4 0.08 New connections averaged for years in service
© 2013 Transpower New Zealand Limited Page 23
Table 7: South Island Supply Points of Service – Unplanned Interruptions (listed by five-year average unserved energy
Poin
t of S
ervi
ce
11/1
2 N
umbe
r
12/1
3 N
umbe
r
1111//11
22 UU
nnssee
rrvveedd
EE
nneerr
ggyy
% x
100
12/1
3 U
nser
ved
Ener
gy %
x10
0
5 Yr
Ave
rage
N
umbe
r
5 Yr
Avg
. Uns
erve
d En
ergy
% x
100
Poin
t of S
ervi
ce
11/1
2 N
umbe
r
12/1
3 N
umbe
r
1111//11
22 UU
nnssee
rrvveedd
EE
nneerr
ggyy
% x
100
12/1
3 U
nser
ved
Ener
gy %
x10
0
5 Yr
Ave
rage
N
umbe
r
5 Yr
Avg
. Uns
erve
d En
ergy
% x
100
Castle Hill 13 1 30.18 7.58 4.8 10.99 Westport 0 1 0.00 0.29 0.4 0.08 Coleridge 0 1 0.00 1.29 1.6 10.21 Brydone 0 0 0.00 0.00 0.2 0.07 Arthurs Pass 12 1 7.77 14.4
4.4 7.74 Motueka 0 1 0.00 0.29 0.2 0.06
Albury 1 2 1.57 2.64 2.2 3.60 Murchison 0 0 0.00 0.00 0.2 0.06 Hokitika 0 1 0.00 0.38 1.6 2.21 Studholme 1 0 0.31 0.00 0.2 0.06 Tekapo A 1 3 0.76 0.71 2.6 2.04 Cromwell 1 0 0.21 0.00 0.2 0.04 Kikiwa 1 0 0.65 0.00 1.0 1.58 Ashburton 66 kV 0 0 0.00 0.00 0.2 0.03 Bells Pond 0 2 0.00 3.99 0.7 1.33 Addington 11 kV 1 0 0.00 0.00 0.2 0.00 Kumara 0 0 0.00 0.00 1.0 1.29 Addington 66 kV 0 0 0.00 0.00 0.0 0.00 Bromley 11 kV 0 0 0.00 0.00 0.2 1.23 Ashley 0 0 0.00 0.00 0.0 0.00 Bromley 66 kV 1 0 1.55 0.00 0.4 1.23 Balclutha 0 0 0.00 0.00 0.2 0.00 BlackPoint 2 0 2.39 0.00 2.0 1.01 Blenheim 0 0 0.00 0.00 0.0 0.00 Springston 33 kV 0 0 0.00 0.00 0.4 0.88 Brydone 0 0 0.00 0.00 0.0 0.00 Dobson 0 0 0.00 0.00 1.0 0.86 Clyde 0 0 0.00 0.00 0.0 0.00 Hororata 33 kV 0 0 0.00 0.00 0.4 0.76 Culverden 0 0 0.00 0.00 0.0 0.00 Palmerston 1 1 2.05 0.35 1.0 0.70 Edendale 0 0 0.00 0.00 0.0 0.00 Otira 1 0 0.33 0.00 1.2 0.57 Halfway Bush 0 0 0.00 0.00 0.2 0.00 Greymouth 0 0 0.00 0.00 0.8 0.49 Invercargill 0 0 0.00 0.00 0.0 0.00 Motupipi 0 0 0.00 0.00 0.4 0.47 Islington 33 kV 0 0 0.00 0.00 0.0 0.00 Frankton (B) 1 0 0.15 0.00 0.4 0.45 Islington 66 kV 0 0 0.00 0.00 0.0 0.00 Timaru 0 0 0.00 0.00 0.2 0.38 Kaiapoi 0 0 0.00 0.00 0.0 0.00 Temuka 0 2 0.00 0.02 0.6 0.34 Middleton 0 0 0.00 0.00 0.0 0.00 Frankton (A) 1 0 0.27 0.00 0.4 0.32 Naseby 0 0 0.00 0.00 0.0 0.00 Atarau 0 0 0.00 0.00 0.2 0.28 Reefton 0 0 0.00 0.00 0.0 0.00 Stoke 0 1 0.00 0.18 0.4 0.24 South Dunedin 0 0 0.00 0.00 0.0 0.00 Oamaru 0 0 0.00 0.00 1.2 0.23 Southbrook 0 0 0.00 0.00 0.0 0.00 Ashburton 33 kV 1 0 1.09 0.00 0.2 0.22 Springston 66 kV 0 0 0.00 0.00 0.0 0.00 Culverden 1 0 0.68 0.00 0.4 0.20 Tiwai 0 0 0.00 0.00 0.0 0.00 Hororata 66 kV 0 0 0.00 0.00 0.2 0.14 Twizel (A) 0 0 0.00 0.00 0.0 0.00 Gore 0 0 0.00 0.00 0.4 0.09 Twizel (B) 0 0 0.00 0.00 0.0 0.00 North Makarewa 1 0 0.38 0.00 0.2 0.08 Twizel (C) 0 0 0.00 0.00 0.0 0.00 Orowaiti 0 0 0.00 0.00 0.2 0.08 Waipara 33 kV 0 0 0.00 0.00 0.0 0.00 Waitaki 1 0 0.39 0.00 0.2 0.08 Waipara 66 kV 0 0 0.00 0.00 0.0 0.00 New connections averaged for years in service OVERALL AVERAGE 0.77 0.49 0.80 MIDDLE AVERAGE 0.20 0.10 0.32 Middle Average excludes highest five and lowest five.

Page 24 © 2013 Transpower New Zealand Limited
Point of Service Performance - Generators
Table 8: Generator Points of Service – Unplanned Interruptions (listed alphabetically) Po
int o
f Ser
vice
11/1
2 N
umbe
r
12/1
3 N
umbe
r
11/1
2 D
urat
ion
(m
ins)
12/1
3 D
urat
ion
(m
ins)
5 Yr
Ave
rage
N
umbe
r
5 Yr
Ave
rage
D
urat
ion
(min
s)
Poin
t of S
ervi
ce
11/1
2 N
umbe
r
12/1
3 N
umbe
r
11/1
2 D
urat
ion
(m
ins)
12/1
3 D
urat
ion
(m
ins)
5 Yr
Ave
rage
N
umbe
r
5 Yr
Ave
rage
D
urat
ion
(min
s)
Arapuni 1 1 81 27 0.4 22 Ohakuri 0 0 0 0 0.0 0 Aratiatia 1 0 175
0 0.4 357 Ohau A 0 0 0 0 0.0 0
Argyle 0 1 0 46 1.8 122 Ohau B 0 0 0 0 1.0 26 Atiamuri 0 0 0 0 0.0 0 Ohau C 0 0 0 0 0.6 38 Aviemore 1 0 142
0 0.4 295 Otahuhu A 110 kV 0 0 0 0 0.0 0
Benmore 220 kV 0 0 0 0 0.0 0 Otahuhu C 220 kV 0 0 0 0 0.0 0 Berwick 1 2 47 162 4.0 360 Poihipi 1 0 127 0 0.4 27 Clyde 0 0 0 0 0.0 0 Rangipo 2 1 2428 477 0.6 581 Cobb 0 0 0 0 0.2 13 Rotorua 110 kV 1 0 124 0 0.4 39 Coleridge 0 1 0 24 0.2 5 Roxburgh 110 kV 0 0 0 0 0.0 0 Glenbrook Generation 0 1 0 120 0.2 24 Roxburgh 220 kV 2 0 1037 0 0.4 207 Hawera (A) 1 0 109 0 0.2 22 Southdown 0 0 0 0 0.2 11 Hawera (B) 1 0 113 0 0.2 23 Stratford 1 0 3622 0 0.8 1053 Huntly 1 1 357 58 1.0 252 Tararua Windfarm C 0 0 0 0 0.0 0 Kaponga 2 0 574 0 1.0 131 Te Apiti Wind Farm 0 0 0 0 0.2 5 Karapiro 1 0 35 0 0.4 47 Te Kowhai 0 0 0 0 0.0 0 Kawerau Geo 0 0 0 0 0.0 0 Te Mihi 0 0 0 0 0.0 0 Kumara 0 0 0 0 1.0 19 Tekapo A 1 3 40 45 2.6 116 Manapouri 0 0 0 0 0.0 0 Tekapo B 0 2 0 19 0.8 35 Mangahao 2 0 944 0 0.4 189 Tokaanu 0 0 0 0 0.0 0 Maraetai 1 2 71 267 1.6 249 Tuai 0 1 0 170 0.4 36 Matahina (A) 0 0 0 0 0.0 0 Waipapa 1 2 72 269 1.4 222 Matahina (B) 0 1 0 132 0.4 55 Wairakei 0 0 0 0 0.0 0 McKee 0 1 0 197 1.0 197 Waitaki 1 0 461 0 0.4 111 Nga Awa Purua 1 0 22 0 0.5 61 West Wind 0 2 0 18 4.2 1408 Ngatamariki 0 0 0 0 0.0 0 Whakamaru 0 0 0 0 0.2 5 Ohaaki 0 0 0 0 0.0 0 Whirinaki 0 1 0 64 0.4 21
New connections averaged for years in service

© 2013 Transpower New Zealand Limited Page 25
Table 9: Generator Points of Service – Unplanned Interruptions (listed by five-year average duration) Po
int o
f Ser
vice
11/1
2 N
umbe
r
12/1
3 N
umbe
r
11/1
2 D
urat
ion
(m
ins)
12/1
3 D
urat
ion
(m
ins)
5 Yr
Ave
rage
N
umbe
r
5 Yr
Ave
rage
D
urat
ion
(min
s)
Poin
t of S
ervi
ce
11/1
2 N
umbe
r
12/1
3 N
umbe
r
11/1
2 D
urat
ion
(m
ins)
12/1
3 D
urat
ion
(m
ins)
5 Yr
Ave
rage
N
umbe
r
5 Yr
Ave
rage
D
urat
ion
(min
s)
West Wind 0 2 0 18 4.2 1408 Arapuni 1 1 81 27 0.4 22 Stratford 1 0 362
0 0.8 1053 Hawera (A) 1 0 109 0 0.2 22
Rangipo 2 1 242
477 0.6 581 Whirinaki 0 1 0 64 0.4 21 Berwick 1 2 47 162 4.0 360 Kumara 0 0 0 0 1.0 19 Aratiatia 1 0 175
0 0.4 357 Cobb 0 0 0 0 0.2 13
Aviemore 1 0 142
0 0.4 295 Southdown 0 0 0 0 0.2 11 Huntly 1 1 357 58 1.0 252 Coleridge 0 1 0 24 0.2 5 Maraetai 1 2 71 267 1.6 249 Te Apiti Wind Farm 0 0 0 0 0.2 5 Waipapa 1 2 72 269 1.4 222 Whakamaru 0 0 0 0 0.2 5 Roxburgh 220 kV 2 0 103
0 0.4 207 Atiamuri 0 0 0 0 0.0 0
McKee 0 1 0 197 1.0 197 Benmore 220 kV 0 0 0 0 0.0 0 Mangahao 2 0 944 0 0.4 189 Clyde 0 0 0 0 0.0 0 Kaponga 2 0 574 0 1.0 131 Kawerau Geo 0 0 0 0 0.0 0 Argyle 0 1 0 46 1.8 122 Manapouri 0 0 0 0 0.0 0 Tekapo A 1 3 40 45 2.6 116 Matahina (A) 0 0 0 0 0.0 0 Waitaki 1 0 461 0 0.4 111 Ngatamariki 0 0 0 0 0.0 0 Nga Awa Purua 1 0 22 0 0.5 61 Ohaaki 0 0 0 0 0.0 0 Matahina (B) 0 1 0 132 0.4 55 Ohakuri 0 0 0 0 0.0 0 Karapiro 1 0 35 0 0.4 47 Ohau A 0 0 0 0 0.0 0 Rotorua 110 kV 1 0 124 0 0.4 39 Otahuhu A 110 kV 0 0 0 0 0.0 0 Ohau C 0 0 0 0 0.6 38 Otahuhu C 220 kV 0 0 0 0 0.0 0 Tuai 0 1 0 170 0.4 36 Roxburgh 110 kV 0 0 0 0 0.0 0 Tekapo B 0 2 0 19 0.8 35 Tararua Windfarm C 0 0 0 0 0.0 0 Poihipi 1 0 127 0 0.4 27 Te Kowhai 0 0 0 0 0.0 0 Ohau B 0 0 0 0 1.0 26 Te Mihi 0 0 0 0 0.0 0 Glenbrook Generation 0 1 0 120 0.2 24 Tokaanu 0 0 0 0 0.0 0 Hawera (B) 1 0 113 0 0.2 23 Wairakei 0 0 0 0 0.0 0 New connections averaged for years in service

Page 26 © 2013 Transpower New Zealand Limited
1100 Transpower Individual Price-Quality Path The Commerce Act (Transpower Individual Price-Quality Path) Determination 2010 included five performance measures, with targets, caps, and collars for four of these. During the Regulatory Control Period 1 (RCP1; 2011/12 to 2014/15), Transpower is required to report annual performance against these targets. In subsequent years there will be incentive payments and penalties associated with these or similar measures.
Table 10 Performance Measures from Transpower Individual Price-Quality Path
2012/13 Result
Target
Cap (for
rewards)
Collar (for
penalties)
Weighting
Number of Unplanned Events
Number > 0.05 System minutes 12 21 10 31 25%
Number > 1.0 System minutes 2 3 1 5 25%
Planned & Unplanned system minutes 7.62 16.69 4.31 29.07 25%
HVAC Circuits Unplanned Unavailability 0.032% 0.054%# 0.029% 0.083% 25%
HVDC Unplanned Unavailability (Pole 2) 0.684% * - - - # HVAC Unplanned Unavailability target was 0.056% for 2011/12, 0.054% for next three years. * No target has yet been set for HVDC Unplanned Unavailability, but Transpower is required to report on the measure for 2012/13.
Historical performance for these measures with the targets, caps, and collars is shown in the following figures.
In 2012/13 all of the targets for RCP1 were bettered.
Figure 26 Planned & Unplanned Supply Interruptions
Figure 27 Unplanned Events > 0.05 System Minutes
Figure 28 Unplanned Events > 1.0 System Minutes
Figure 29 HVAC Circuits Unplanned Unavailability
0
10
20
30
08/09 09/10 10/11 11/12 12/13
Sys
tem
Min
utes
Target Cap Collar
Unplanned Planned
0
10
20
30
40
08/09 09/10 10/11 11/12 12/13
Num
ber
Target Cap Collar
0
2
4
6
08/09 09/10 10/11 11/12 12/13
Num
ber
Target Cap Collar
0.00 0.02 0.04 0.06 0.08 0.10
08/09 09/10 10/11 11/12 12/13
Una
vaila
bilit
y %
Target Cap Collar

© 2013 Transpower New Zealand Limited Page 27
Figure 30 HVDC Pole 2 Unplanned Unavailability
In addition to the performance measures defined in the Individual Price-Quality Path Determination, we have also undertaken to track and report on two other possible measures, viz:- average unplanned outage duration for circuits and transformers. Historical performance for these measures is shown in Figure 31 and Figure 32. For this calculation, outages with long durations are capped at seven days.
Figure 31 HVAC Circuits Average Unplanned Outage Duration
Figure 32 Power Transformers Average Unplanned Outage Duration
Performance as indicated by both of these measures has improved in 2012/13 with both being better (lower) than the five-year average.
0.00 0.25 0.50 0.75 1.00 1.25
08/09 09/10 10/11 11/12 12/13
Una
vaila
bilit
y %
5 Year Average
0
3
6
9
12
08/09 09/10 10/11 11/12 12/13
Hou
rs
Five Year Average
0
3
6
9
12
08/09 09/10 10/11 11/12 12/13
Hou
rs
Five Year Average
Page 28 © 2013 Transpower New Zealand Limited
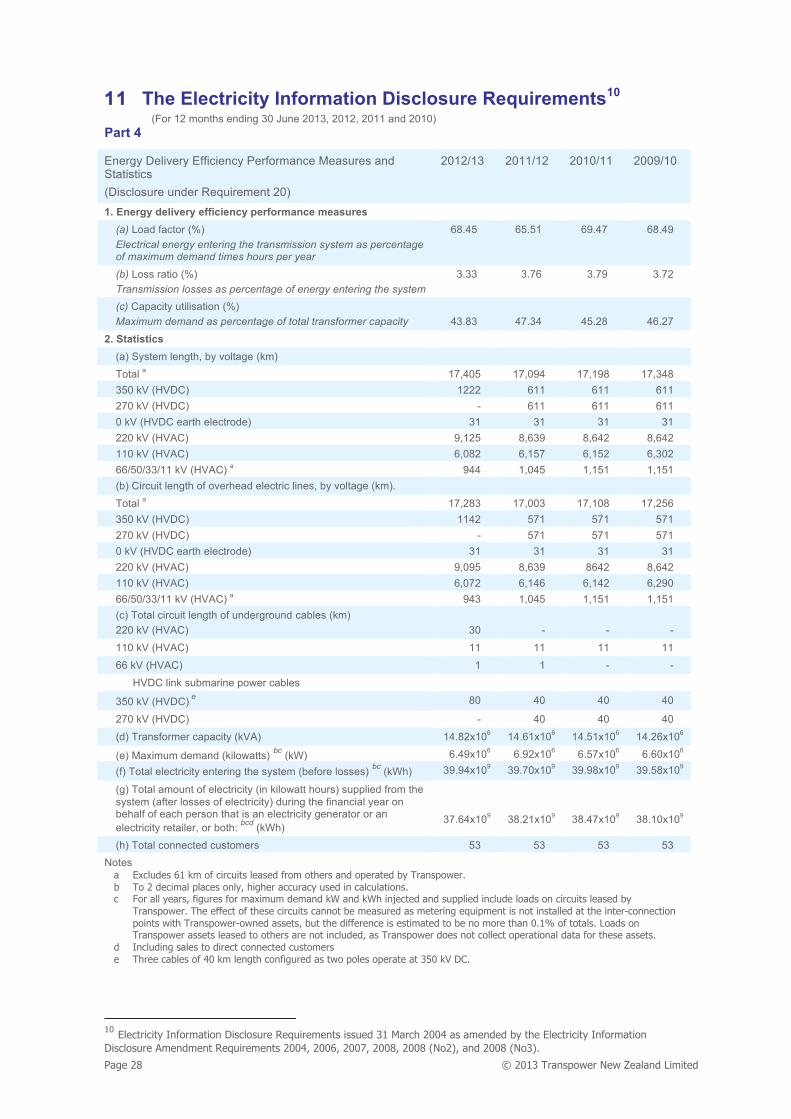
1111 The Electricity Information Disclosure Requirements10 (For 12 months ending 30 June 2013, 2012, 2011 and 2010)
Part 4
Energy Delivery Efficiency Performance Measures and Statistics (Disclosure under Requirement 20)
2012/13 2011/12 2010/11 2009/10
1. Energy delivery efficiency performance measures (a) Load factor (%) Electrical energy entering the transmission system as percentage of maximum demand times hours per year
68.45 65.51 69.47 68.49
(b) Loss ratio (%) Transmission losses as percentage of energy entering the system
3.33 3.76 3.79 3.72
(c) Capacity utilisation (%) Maximum demand as percentage of total transformer capacity
43.83
47.34
45.28
46.27
2. Statistics
(a) System length, by voltage (km)
Total a 17,405 17,094 17,198 17,348 350 kV (HVDC) 1222 611 611 611 270 kV (HVDC) -
611 611 611
0 kV (HVDC earth electrode) 31 31 31 31 220 kV (HVAC) 9,125 8,639 8,642 8,642 110 kV (HVAC) 6,082 6,157 6,152 6,302 66/50/33/11 kV (HVAC) a 944 1,045 1,151 1,151 (b) Circuit length of overhead electric lines, by voltage (km).
Total a 17,283 17,003 17,108 17,256 350 kV (HVDC) 1142 571 571 571 270 kV (HVDC) -
571 571 571
0 kV (HVDC earth electrode) 31 31 31 31 220 kV (HVAC) 9,095 8,639 8642 8,642 110 kV (HVAC) 6,072 6,146 6,142 6,290 66/50/33/11 kV (HVAC) a 943 1,045 1,151 1,151 (c) Total circuit length of underground cables (km) 220 kV (HVAC)
30
-
-
-
110 kV (HVAC) 11 11 11 11
66 kV (HVAC) 1 1 - -
HVDC link submarine power cables
350 kV (HVDC) e 80 40 40 40
270 kV (HVDC) - 40 40 40
(d) Transformer capacity (kVA) 14.82x10⁶ 14.61x10⁶ 14.51x10⁶ 14.26x10⁶
(e) Maximum demand (kilowatts) bc (kW) 6.49x10⁶ 6.92x10⁶ 6.57x10⁶ 6.60x10⁶ (f) Total electricity entering the system (before losses) bc (kWh) 39.94x10⁹ 39.70x10⁹ 39.98x10⁹ 39.58x10⁹
(g) Total amount of electricity (in kilowatt hours) supplied from the system (after losses of electricity) during the financial year on behalf of each person that is an electricity generator or an electricity retailer, or both: bcd (kWh)
37.64x10⁹
38.21x10⁹
38.47x10⁹
38.10x10⁹
(h) Total connected customers 53 53 53 53 Notes
a Excludes 61 km of circuits leased from others and operated by Transpower. b To 2 decimal places only, higher accuracy used in calculations. c For all years, figures for maximum demand kW and kWh injected and supplied include loads on circuits leased by
Transpower. The effect of these circuits cannot be measured as metering equipment is not installed at the inter-connection points with Transpower-owned assets, but the difference is estimated to be no more than 0.1% of totals. Loads on Transpower assets leased to others are not included, as Transpower does not collect operational data for these assets.
d Including sales to direct connected customers e Three cables of 40 km length configured as two poles operate at 350 kV DC.
10 Electricity Information Disclosure Requirements issued 31 March 2004 as amended by the Electricity Information Disclosure Amendment Requirements 2004, 2006, 2007, 2008, 2008 (No2), and 2008 (No3).

© 2013 Transpower New Zealand Limited Page 29
The Electricity Information Disclosure Requirements (For 12 months ending 30 June 2013, 2012, 2011 and 2010)
Part 6
Reliability Performance Measures to be Disclosed by Transpower a (Disclosure Under Requirement 21)
2012/13 2011/12 2010/11 2009/10
1. Total number of unplanned interruptions b Resulting from 41 loss of supply events in 2012/13
54 198 89 106
2. Electricity customer interruptions in system minutes c 7.6 14.5 15.2 23.5 Planned 0.8 2.4 3.6 1.2 Unplanned 6.9 12.0 11.6 22.2
3. Underlying electricity customer interruptions in system minutes c Underlying interruptions are those interruptions of one system
minute or less duration
3.0
5.2
4.0
5.3
Planned 0.8 1.4 1.1 1.2 Unplanned 2.2 3.9 2.9 4.0
4. Average supply reliability (%) Measured by the energy supplied divided by the sum of the
energy supplied and not supplied
99.9978
99.9956
99.9957
99.9932
5. Uneconomic generation due to planned and unplanned transmission system unavailability (%) d
- - - -
6. Uneconomic generation due to HVDC system unavailability (%)d
- - - -
7. Uneconomic generation due to unplanned transmission system unavailability (%)d
- - - -
8. Planned interruption restoration performance (%) 84.2 91.3 68.6 77.5 9. Unplanned interruption response (%) 100.0 99.5 100.0 99.1 Notes a The information compiled using estimated information includes Part 6 sections 2, 3 and 4. The methodology used to calculate
the estimated information is documented and available from Transpower upon request. The reliability performance measures given in Part 6 do not include the performance of the 34km of circuit leased to other
parties because Transpower does not collect operational data for these assets. b Where two supply voltages, or two customers, at the same station are both interrupted this is counted as two interruptions. c Any minor differences between the total and the sum of planned and unplanned are due to rounding. System minutes of interruptions do not include energy made up by backfeed from another point of supply or by embedded
generation within a customer’s network. d Uneconomic generation (Part 6 sections 5, 6 and 7) is not relevant in the market environment because scheduling is now
based on offered price, not economic cost. In the market, ‘offers to generate’ are made after taking constraints into account and it is not possible to predict what a generator would have offered if the constraint was not present. As a result data is not available to allow a calculation and a null entry has been returned.

Page 30 © 2013 Transpower New Zealand Limited
Maps of High Voltage Transmission System As at 30 June 2013
North Island National Grid and Major Generation Stations
West Wind
© 2013 Transpower New Zealand Limited Page 31
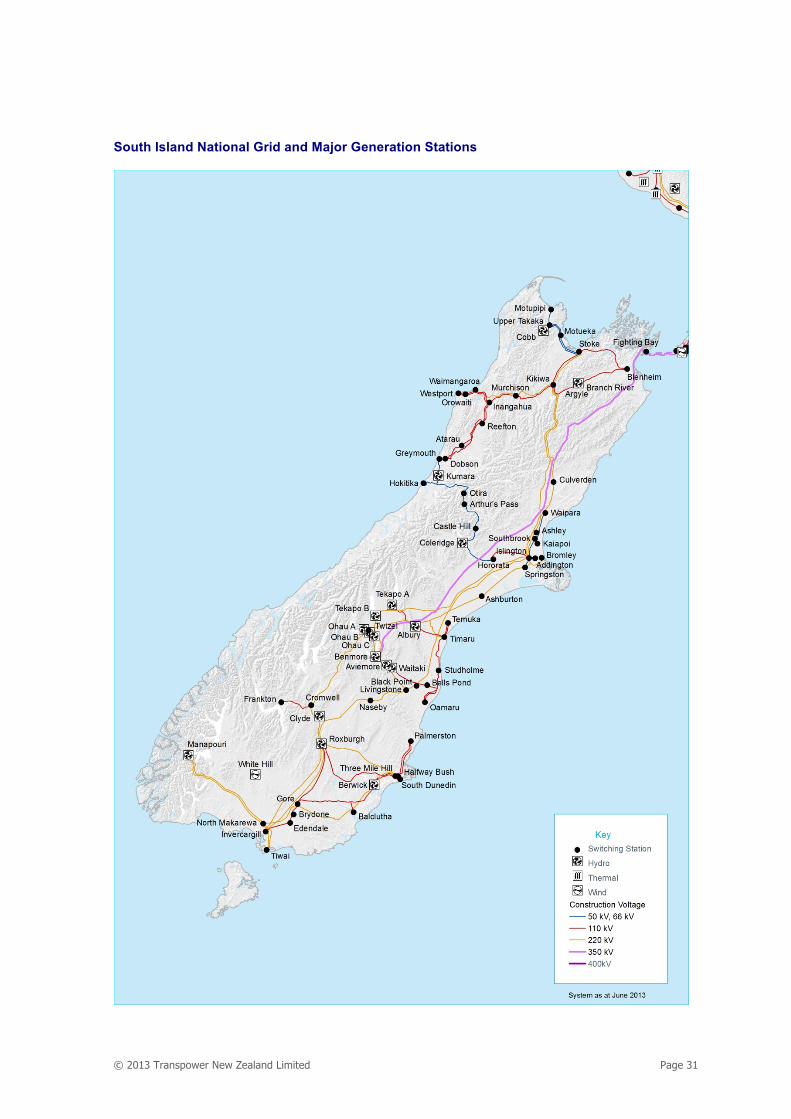
South Island National Grid and Major Generation Stations
Page 32 © 2013 Transpower New Zealand Limited
Significant Events from 1987 to 2013
Table 11 Significant Events from March 1987 to June 2013
Date
System Minutes
Event description
18/04/13 2.4 Redclyffe interconnecting transformer tripped on high temperature. 18/12/12 2.2 Cambridge 11 kV supply bus damaged and tripped when bus support insulator flashed over. 13/12/11 6.9 Huntly generation tripped causing Automatic Under-Frequency Load Shedding (AUFLS). 15/08/11 1.3 Strong winds and snow to very low levels in Lower North Island and Taranaki 22/02/11 3.2 Bromley transformers tripped by major earthquake. 2/12/10 3.4 Glenbrook 33 kV bus tripped when a bus insulator flashed over. 4/09/10 2.2 Transformers at Islington, Springston, and Hororata tripped by major earthquake.
22/04/10 1.3 Wilton 110 kV bus fault when maintenance equipment dropped onto bottom bus. 11/03/10 2.3 Kawerau 11 kV bus trip caused by a rat inside switchgear. 25/01/10 6.4 Line faults on Otahuhu Whakamaru C line caused by a tree and a subsequent fire resulted in rolling
load cuts in Auckland region. 30/10/09 8.2 A container hoist operating under the Henderson-Otahuhu line caused a line fault and widespread
loss of supply in North Auckland and Northland. 17/03/09 1.0 Disconnector at Timaru opened on load causing 110 kV bus fault. 07/03/09 1.1 Kaitimako-Tauranga-Mt Maunganui protection failed to clear fault causing outages in Bay of Plenty 03/02/09 4.1 Penrose 33 kV supply transformers tripped following a fault on one bank. 01/09/08 4.9 Whirinaki 11 kV cable fault resulted in partial interruption to Pan Pac 12/10/07 14.1 Kawerau paper mill shut down to investigate and rectify arc noises on 11 kV bus 07/10/07 3.9 Part of Westport 11 kV bus exploded following a close-in lightning strike 24/09/07 1.9 Protection relay at Kinleith failed to operate, resulting in interruptions at five points of service 15/10/06 1.1 Kaikohe-Kaitaia line out of service to repair conductor damage caused by quarry operations 14/09/06 1.8 Earth sticks left on Islington 220 kV bus in error caused 220 kV bus fault and supply interruptions. 28/08/06 1.1 At Kawerau, a switching error combined with misleading indication resulted in loss of supply 25/08/06 1.3 Glenbrook 33 kV bus tripped when a bus insulator failed 12/06/06 29.8 Earth wire failed at Otahuhu causing 110 kV bus fault and widespread loss of load in Auckland area 11/05/06 1.0 Protection maloperation at Tarukenga resulted in forced disconnection of load in the Bay of Plenty 16/03/05 1.1 Tap changer problem caused tripping of both 33 kV supply banks at Hamilton 12/04/01 4.2 Mouse caused flashover on 11 kV bus at Whirinaki
25-6/09/00 4.4 Heavy wind and snow storm on East Coast, North Island 26/07/98 1.5 Edgecumbe supply transformer damaged as a result of a human error 4/06/97 1.1 Hamilton 11 kV supply transformer tripped because of a tap changer fault
29/11/96 2.2 Widespread outage in Auckland area following circuits trippings during a lightning storm 19/11/96 1.3 Bird proofing netting blown off Kawerau 110 kV bus in high winds 8/10/96 2.2 Human error caused tripping of Islington 66 kV bus 3/03/96 2.4 HVDC pole tripped incorrectly for fault on other pole - protection design problem
12/07/94 3.9 Kawerau transformer cable bushing fault 13/01/94 3.5 Tree contacted HVDC lines 9/03/93 6.9 HVDC bipole trip due to communication circuit crossover
23/10/92 1.8 Glenbrook transformer tripped due to pollution flashover 28/08/92 11.4 Heavy snow storms in Canterbury 26/07/92 1.1 Albany transformer tripped due to lightning 6/08/91 1.4 Tower failure on Opunake-Stratford line
16/07/91 1.1 Transformer Buchholz operated during transformer maintenance at Penrose 30/05/91 6.1 Bus fault at Wilton during maintenance activities 28/05/91 7.0 Bus fault at Islington due to a circuit breaker dropper failure 26/04/91 1.6 Supply bank cable fault at Kinleith 10/09/90 1.7 Conductor joint failure on Hinuera-Karapiro line 20/01/89 3.5 Non Transpower contractor felled tree onto Otahuhu-Mt Roskill line 9/12/87 * A 110 kV circuit breaker failed to open correctly at Haywards
29/06/87 * Circuit breakers at Takapu Road failed to trip for a line fault 2/03/87 * Bay of Plenty earthquake
* System minute figures for years prior to 1987/88 are not available

2012/13QUALITY PERFORMANCE REPORTQUALITY PERFORMANCE REPORT 2012/13
www.transpower.co.nz