1,2 1*, S. Abdullah1 and M.R. Abu Mansor -...
13
Journal of Mechanical Engineering and Sciences (JMES) ISSN (Print): 2289-4659; e-ISSN: 2231-8380 Volume 10, Issue 3, pp. 2275-2287, December 2016 © Universiti Malaysia Pahang, Malaysia DOI: https://doi.org/10.15282/jmes.10.3.2016.6.0212 2275 Numerical investigation of soot mass concentration in compression ignition diesel engine F. Ibrahim 1,2 , W.M.F. Wan Mahmood 1* , S. Abdullah 1 and M.R. Abu Mansor 1 1 Department of Mechanical and Materials Engineering, Faculty of Engineering and Built Environment, Universiti Kebangsaan Malaysia, 43600 Bangi, Selangor, Malaysia. 2 Mechanical and Aerospace Technology Division, Science and Technology Research Institute for Defence (STRIDE), 43000 Kajang, Selangor, Malaysia. *Email: [email protected] Phone: +60389216513; Fax: +60389252546 ABSTRACT Soot particles, carbon monoxide, oxides of nitrogen, oxides of sulphur, and hydrocarbon are the emissions produced from diesel engine combustion. Those emissions species are undesirable since they give detrimental impacts to the atmosphere and human well-being. Several numerical investigations conducted by various researchers provide different soot mass concentration values. As an alternative, this study was carried out to investigate the soot mass level produced by a single cylinder diesel engine, using a commercial multidimensional computational fluid dynamic software. The result obtained from simulation effort was then validated by experimental testing during the same engine condition (engine speed of 1600 rpm at 40% load). Soot mass predicted by simulation gives a value of 3.43 × 10 -8 kg at end of simulation, while measured soot mass via experimental testing gives a value of 1.52 × 10 -8 kg. Both results differ by 56% thus indicating that the simple soot model applied was not sufficient to represent the actual soot mass emitted through exhaust manifold. This leads to the conclusion that more detailed soot model is needed to make the simulation results more meaningful and comparable to the experimental testing. Keywords: Soot; diesel engine; CONVERGE CFD; Hiroyasu-NSC; soot model. INTRODUCTION Global increase in the total number of on-road vehicles triggers the growing problem of air pollution due to exhaust emissions. Although the efforts in reducing and controlling the vehicle emissions are continuously undertaken all around the globe, it seems to be insufficient at this moment. More significant investigations and testing need to be carried out to ease the problem. Besides carbon monoxide (CO), oxides of nitrogen (NOx), oxides of sulphur (SOx), and hydrocarbon (HC), soot is another emission produced from diesel engine combustion [1-3]. As a major part of particulate matters (PM), it is undesirable as it gives bad impact to the atmosphere and human well-being. Soot and other exhaust emissions were proven to cause global warming, acid rain, smog, odours, respiratory and other health hazards [4-6]. Various researchers successfully demonstrated the poisonous effect of soot that affected human health [7-10] and its effect of decreasing the overall engine performances [11-14]. The pioneer countries in enforcing the emission control such US, Europe, Japan and China have become an example for other developing countries to do the same. European countries, for example, have taken appropriate actions to stringent the emission regulation for their government as summarised in Table 1
Transcript of 1,2 1*, S. Abdullah1 and M.R. Abu Mansor -...

Journal of Mechanical Engineering and Sciences (JMES)
ISSN (Print): 2289-4659; e-ISSN: 2231-8380
Volume 10, Issue 3, pp. 2275-2287, December 2016
© Universiti Malaysia Pahang, Malaysia
DOI: https://doi.org/10.15282/jmes.10.3.2016.6.0212
2275
Numerical investigation of soot mass concentration in compression ignition diesel engine
F. Ibrahim1,2, W.M.F. Wan Mahmood1*, S. Abdullah1 and M.R. Abu Mansor1
1Department of Mechanical and Materials Engineering, Faculty of Engineering and
Built Environment, Universiti Kebangsaan Malaysia, 43600 Bangi, Selangor, Malaysia. 2Mechanical and Aerospace Technology Division, Science and Technology Research
Institute for Defence (STRIDE), 43000 Kajang, Selangor, Malaysia.
*Email: [email protected]
Phone: +60389216513; Fax: +60389252546
ABSTRACT
Soot particles, carbon monoxide, oxides of nitrogen, oxides of sulphur, and hydrocarbon
are the emissions produced from diesel engine combustion. Those emissions species are
undesirable since they give detrimental impacts to the atmosphere and human well-being.
Several numerical investigations conducted by various researchers provide different soot
mass concentration values. As an alternative, this study was carried out to investigate the
soot mass level produced by a single cylinder diesel engine, using a commercial
multidimensional computational fluid dynamic software. The result obtained from
simulation effort was then validated by experimental testing during the same engine
condition (engine speed of 1600 rpm at 40% load). Soot mass predicted by simulation
gives a value of 3.43 × 10⁻⁸ kg at end of simulation, while measured soot mass via
experimental testing gives a value of 1.52 × 10⁻⁸ kg. Both results differ by 56% thus
indicating that the simple soot model applied was not sufficient to represent the actual
soot mass emitted through exhaust manifold. This leads to the conclusion that more
detailed soot model is needed to make the simulation results more meaningful and
comparable to the experimental testing.
Keywords: Soot; diesel engine; CONVERGE CFD; Hiroyasu-NSC; soot model.
INTRODUCTION
Global increase in the total number of on-road vehicles triggers the growing problem of
air pollution due to exhaust emissions. Although the efforts in reducing and controlling
the vehicle emissions are continuously undertaken all around the globe, it seems to be
insufficient at this moment. More significant investigations and testing need to be carried
out to ease the problem. Besides carbon monoxide (CO), oxides of nitrogen (NOx), oxides
of sulphur (SOx), and hydrocarbon (HC), soot is another emission produced from diesel
engine combustion [1-3]. As a major part of particulate matters (PM), it is undesirable as
it gives bad impact to the atmosphere and human well-being. Soot and other exhaust
emissions were proven to cause global warming, acid rain, smog, odours, respiratory and
other health hazards [4-6]. Various researchers successfully demonstrated the poisonous
effect of soot that affected human health [7-10] and its effect of decreasing the overall
engine performances [11-14]. The pioneer countries in enforcing the emission control
such US, Europe, Japan and China have become an example for other developing
countries to do the same. European countries, for example, have taken appropriate actions
to stringent the emission regulation for their government as summarised in Table 1

Numerical investigation of soot mass concentration in compression ignition diesel engine
2276
(example given is for light duty diesel powered vehicle or passenger car, GVW ≤
2500 kg).
Table 1. Emission Standards implemented by European countries [15, 16].
Standard Date Implemented Particulate Mass
(g/km)
Particulate Number
(#/km)
Euro 1 July 1992 0.14 -
Euro 2 January 1996 0.08 -
Euro 3 January 2000 0.05 -
Euro 4 January 2005 0.025 -
Euro 5a September 2009 0.005 -
Euro 5b September 2011 0.005 6 × 10¹¹
Euro 6 September 2014 0.005 6 × 10¹¹
Since decades ago, numerous techniques were introduced by researchers,
manufacturers and government agencies with the aim to eliminate the emissions effects
by improving the engine technologies, exhaust after-treatment devices and renewable
energy enhancement [17-23]. Details physical and chemical characteristics of soot and
other emissions from their multiple sources – in-cylinder, in exhaust and in-oil, are still
actively debated and continuously investigated either experimentally or computationally
[24, 25]. Although computational analyses require further validation process, its
undisputable advantages in terms of time and cost saving should not be neglected.
Furthermore, modern computer programs nowadays have been developed with high
environment. Examples given here are the researchers who investigated the emissions
characteristics but with various engine parameters using different computer software such
as KIVA [26-32], Star-CD [33-35], open foam CFD [36, 37], AVL FIRE [38, 39],
Converge CFD [40, 41] and also ANSYS Fluent [42-45]. Although there are many
investigations conducted through several simulation software, the results reporting on
soot mass concentration are varied. Therefore, as an alternative, this study is carried out
using a commercial Computational Fluid Dynamic (CFD) software, CONVERGE CFD.
This software is relatively recent, and its capability has not been fully explored. The
objective of this study is to investigate the in-cylinder soot mass concentration via its
formation and oxidation process, within pre-set engine conditions using a specific soot
model.
METHODS AND MATERIALS
Pre-Processing Setup
In this paper, the combustion process of a single-cylinder diesel engine was simulated
using multidimensional CFD software, CONVERGE CFD. This software was developed
by Convergent Science Inc, initiated by engine simulation experts, which purposely can
be used for both engine and non-engine simulations. The simulation is based on the in-
house direct injection diesel engine, Yanmar TF90M. This horizontal, single cylinder, 4
cycles, water-cooled diesel engine is mainly used for agricultural purposes. The engine
has a bowl-in-piston and the schematic diagram for crown piston configuration is shown
in Figure 1. The simulation was carried out for the close-cycle combustion environment
from inlet valve closing (IVC) at -168° Crank Angle (CA) After Top Dead Centre
(ATDC) to exhaust valve opening (EVO) at 138° CA ATDC. The detailed specification
Ibrahim et al. / Journal of Mechanical Engineering and Sciences 10(3) 2016 2275-2287
2277
of the engine, operating conditions, and initial conditions used in the software is shown
in Tables 2-4.
Table 2. Diesel engine specification.
Parameters Specifications
Engine type Water-cooled 4 cycle
Engine capacity (cc) 493
Number of cylinder 1
Bore × Stroke 85 × 87 mm
Injection system Direct injection
Injection nozzle (n × Ø d) 4 × Ø 0.22 mm
Compression ratio 18.0:1
Table 3. Engine operating condition.
Parameters Specifications
Engine speed 1600 rpm (max. torque)
Initial Swirl ratio 1.8
Start of Injection (SOI) -18° ATDC
Injection period 10°
Injection pressure 196 bar
Injection quantity 19 mg
Table 4. Engine initial conditions.
Parameters Specifications
In-cylinder temperature 315 K
In-cylinder pressure 105 KPa
Piston head temperature 363 K
Cylinder liner temperature 319 K
Piston temperature 403 K
Model of the combustion chamber was firstly generated using computer aided
design (CAD) software, Siemens Unigraphic NX 10.0 before it was exported to the pre-
processing software, CONVERGE CFD for the geometry checking and clean-up [46].
Figure 2 shows the model of combustion chamber created by Unigraphic NX 10.0 and
then cleaned-up by CONVERGE CFD.
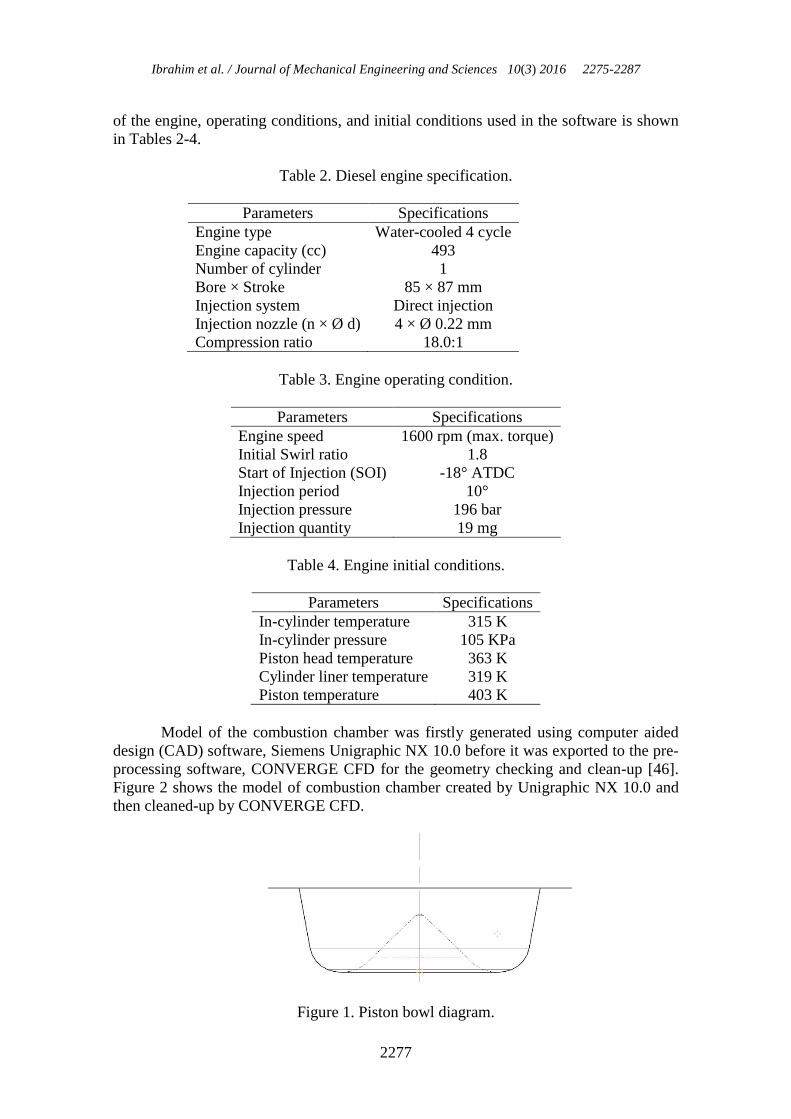
Figure 1. Piston bowl diagram.

Numerical investigation of soot mass concentration in compression ignition diesel engine
2278
Figure 2: Model of the combustion chamber created by Unigraphic NX 10.0 (above)
and cleaned-up by CONVERGE CFD (below).
Mathematical Modelling
Using relatively simple soot model as a solver, net soot mass was simulated during the
combustion process. Soot formation processes were solved by Hiroyasu soot formation
[47], coupled with the Nagle and Strickland-Constable (NSC) [48] soot oxidation
expressions. Soot formation equation can be written as [49];
)/(5.0 isf RTE
ifvi
sfiePNM
dt
dM (1)
where Msfi is the soot formation concentration, dt is the time step interval, N is soot
particle formation multiplication factor, Mfvi is the fuel vapour concentration (considered
as source of soot formation), P is the pressure, Esf is the activation energy for soot
formation (12,500 cal/mole), R is the gas constant (1.987), and T is the in-cylinder
temperature. The current time step is represented by I, while soot oxidation process
equation can be written as follows [44];
)1()1(
xpkxpk
pkR B
z
ANSC
(2)
where x is the surface fraction covered by more reactive side on the carbon surface
(namely as A) and 1-x is the fraction covered by less reactive side (namely as B).
The two-step model of soot calculation is considered sufficient for this
investigation. Considering n-heptane (C7H16) as fuel, the reaction mechanism which
contains 4 elements and 42 species is applied in this study to model diesel combustion
chemistry. In addition to the soot model, other dedicated sub-models are used to solve

Ibrahim et al. / Journal of Mechanical Engineering and Sciences 10(3) 2016 2275-2287
2279
each sub-process, including spray breakup, turbulence, and combustion. These sub-
models are listed in Table 5.
Table 5. The computational sub-models applied.
Phenomenon Model
Soot formation Hiroyasu-NSC [47, 48]
NOx formation Extended Zeldovich [50]
Spray breakup KH-RT model [51, 52]
Drop drag Dynamic model [53]
Collision and coalescence NTC model [54]
Spray-wall interaction Rebound/slide model [55, 56]
Vaporization Multi component fuel
Turbulence RNG k-Ɛ model [57]
Combustion SAGE [58]
All these mathematical models are executed by solver and the results can be
visualised using post-processing software, EnSight 10.1. This particular post-processor is
primarily designed to animate or visualise the complex datasets obtained from
computational analyses [59]. In this case, all the calculated results regarding soot mass as
well as other gas emissions are well executed and presented in the next section.
Figure 3. Total cells used in the simulation.
Mesh Setup
In this study, the overall mesh resolution of 1.0 mm was found to sufficiently produce
grid independent results, as the comparison of different mesh sizes is clearly discussed in
[60]. Meanwhile, injector region which is considered as the most important segment was
set to 0.375 mm of mesh size. The meshing size for injector region will only be activated
from -18° CA onwards. This extra feature of the software so-called Adaptive Mesh
Refinement (AMR) reduces the computational time significantly as it allows users to
customise their mesh setup according to certain spatial and temporal conditions. Figure 3
shows the number of total cells of 624,556 during the start of the simulation and it keeps
decreasing to the lowest number of 63,726 due to compression stroke of the engine. The
0
100000
200000
300000
400000
500000
600000
700000
-200 -150 -100 -50 0 50 100 150
Cel
l N
um
ber
Crank Angle (Degree)

Numerical investigation of soot mass concentration in compression ignition diesel engine
2280
number of cells suddenly increases when AMR feature is activated and it keeps increasing
until reaching its end value of 576,858 during the expansion stroke of the engine. This
total cell number used indicates its effect during the critical simulation time (the start of
ignition and through combustion process). As the smaller cell size used will increase the
total cell number, hence more accurate calculation is expected.
Experimental Validation
As to validate the net soot mass obtained from computational analysis, an experimental
testing was conducted during the same engine condition (engine speed of 1600 rpm at
40% load). A combustion analyser, DEWE-5000, was facilitated to measure the in-
cylinder pressure of the engine. Meanwhile for soot mass calculation, smoke opacity was
measured during the engine running by Bosch analyser, BEA 350. The conversion of
opacity measured to soot mass concentration using Alkidas equation [61] is as below;
𝐵𝑛 = 𝑁 × 10 (3)
𝐶 = 581.4 [𝑙𝑛 (10
10−𝐵𝑛)]
1.413
(4)
where Bn is Bosch number (in range 1 to 10), N is opacity in %, and C is soot mass
concentration in mg/m3. This soot mass concentration is then multiplied by the in-cylinder
volume during EVO (0.000478 m3) to acquire soot mass at that time. Finally, the soot
mass measured by the equation is compared with soot mass concentration obtained by
simulation. The experimental result obtained at exhaust manifold is assumed to be
representable to the simulation result at EVO.
RESULTS AND DISCUSSION
In-cylinder Pressure Effects
In-cylinder pressure is the greatest factor affecting any parameters on the sooting process
by increasing all of the reaction rates involved in soot formation and oxidation. As
pressure is increased, the rate of oxidation increases more rapidly than the rate of
formation [62]. In order to discuss the effect of the pressure to the soot mass concentration
in the next sub-section, the changes of this variable both from simulation and
experimental setup are plotted and shown in Figure 4. Calculated pressure by simulation
shows very well agreed with the experimental result, which leads to the assumption that
net soot mass predicted by computational analysis are considerably similar to the actual
result by experimental testing. Therefore, the changes of pressure values directly affect
all of the reaction rates involved in soot formation and oxidation process as explained in
the subsequent sub-section.
Soot Mass Concentration
Based on Hiroyasu soot model, net soot mass, ms is calculated by competition between
soot mass formation rate and the soot mass oxidation rate, as follows [63];
oxidation
s
formation
ss
dt
dm
dt
dm
dt
dm
(5)
Ibrahim et al. / Journal of Mechanical Engineering and Sciences 10(3) 2016 2275-2287
2281
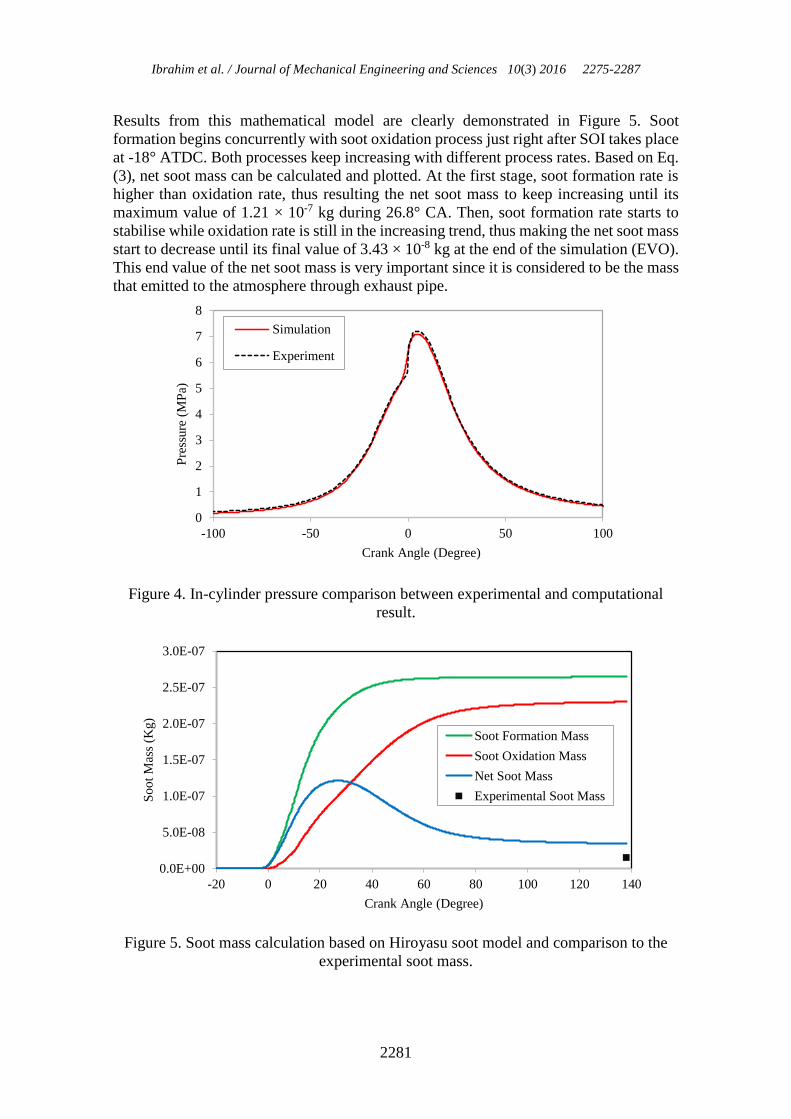
Results from this mathematical model are clearly demonstrated in Figure 5. Soot
formation begins concurrently with soot oxidation process just right after SOI takes place
at -18° ATDC. Both processes keep increasing with different process rates. Based on Eq.
(3), net soot mass can be calculated and plotted. At the first stage, soot formation rate is
higher than oxidation rate, thus resulting the net soot mass to keep increasing until its
maximum value of 1.21 × 10⁻⁷ kg during 26.8° CA. Then, soot formation rate starts to
stabilise while oxidation rate is still in the increasing trend, thus making the net soot mass
start to decrease until its final value of 3.43 × 10⁻⁸ kg at the end of the simulation (EVO).
This end value of the net soot mass is very important since it is considered to be the mass
that emitted to the atmosphere through exhaust pipe.
Figure 4. In-cylinder pressure comparison between experimental and computational
result.
Figure 5. Soot mass calculation based on Hiroyasu soot model and comparison to the
experimental soot mass.
0
1
2
3
4
5
6
7
8
-100 -50 0 50 100
Pre
ssure
(M
Pa)
Crank Angle (Degree)
Simulation
Experiment
0.0E+00
5.0E-08
1.0E-07
1.5E-07
2.0E-07
2.5E-07
3.0E-07
-20 0 20 40 60 80 100 120 140
So
ot
Mas
s (K
g)
Crank Angle (Degree)
Soot Formation Mass
Soot Oxidation Mass
Net Soot Mass
Experimental Soot Mass

Numerical investigation of soot mass concentration in compression ignition diesel engine
2282
This value is then compared to the experimental result which is calculated by
substituting the opacity conversion number into Alkidas equation. In this case, opacity
measured was 12%, thus providing net soot mass concentration, C = 31.78 mg/ m3. Hence,
the value of net soot mass at EVO with the volume, v = 0.000478 m3 will be, m = 1.52 ×
10-8 kg. This measured value is different to the predicted value from simulation by 56%
error. The large variation of this end value is primarily due to simple soot model applied,
which does not take into account other important soot sub-process (nucleation,
condensation and coagulation) [60, 64]. Although the simulation results obtained here do
not sufficiently represent the experimental result, it is still within the soot mass range as
reported by Symonds et. al (2007) [65].
Figure 6. Soot mass concentration in combustion chamber along the simulation time.
Figure 6 shows the visualisation of net soot mass concentration on a cross-
sectional plane view of the combustion chamber, which was post-processed. Plotting from
0° CA to EVO, with every 40° CA of time interval, it is well comparable to the net soot
mass in Fig. 5 during the combustion process. This qualitative result can provide an
additional perspective on how the soot mass is distributed and concentrated inside
combustion chamber. As depicted in the figure, heavier soot mass value is more
concentrated at the centre and bottom part of the cylinder (i.e. squish/bowl region) instead
of the upper side of the cylinder. As oxidation rate starts to increase higher than formation
rate towards the end of simulation, almost all the lower soot mass values occupy’ the
upper side and near the cylinder wall. These lighter soot particles are assumed to be
emitted during exhaust stroke while a part of it will remain and be deposited onto the
cylinder wall.
Ibrahim et al. / Journal of Mechanical Engineering and Sciences 10(3) 2016 2275-2287
2283
CONCLUSIONS
In this study, investigation for in-cylinder soot mass concentration was carried out to
simulate the soot mass concentration within the pre-set engine condition. Net soot mass
reached its final value of 3.43 × 10⁻⁸ kg at the end of the simulation (EVO), which
indicates that this is the value of soot mass that emitted to the atmosphere during exhaust
stroke of the engine. Meanwhile, soot mass value through experimental testing was 1.52
× 10-8 kg. This makes the predicted value from simulation of 56% error, due to disregard
of the other important soot sub-process (nucleation, condensation, and coagulation). The
qualitative results through post-processing method also give an additional viewpoint on
how the soot mass is distributed and concentrated inside the combustion chamber. It was
depicted that lighter soot mass particles are assumed to be emitted during exhaust stroke
while heavier soot mass particles will remain and be deposited onto the cylinder wall.
The present study contributes to the exhaust soot mass concentration in limited
close-cycle investigation. Since Hiroyasu-NSC soot model is considered as a simple soot
model and it only resolves the two-step equation from overall soot formation process, it
is necessary to perform the analysis with a more complex mathematical model that will
consider multi-steps equation. This advance soot model can resolve total soot mass, soot
size distribution, soot volume fraction, and soot number density. This is to ensure that the
results obtained are more comparable to the actual testing, thus providing more
meaningful contribution to the exhaust emission regulation. In addition to the study of
soot particle in a diesel engine, similar procedure is projected to investigate the soot
problem in biodiesel or any other alternative fuels.
ACKNOWLEDGEMENTS
The authors would like to acknowledge their gratefulness to Ministry of Higher Education
of Malaysia for supporting this study through its research grant of FRGS/1/2013/TK01
/UKM/02/2. Special thanks to Mechanical and Aerospace Technology Division, Science
and Technology Research Institute for Defence (STRIDE), Ministry of Defence,
Malaysia for granting the use of its facilities regarding this project.
REFERENCES
[1] Muharam Y, Mahendra M, Gayatri D, Kartohardjono S. Simulation of ignition
delay time of compressed natural gas combustion. International Journal of
Automotive and Mechanical Engineering. 2015;12:3125-40.
[2] Mat MH, Badrulhisam NH, Hanafiah AQ, Abdullah NR, Mamat AMI.
Characteristics of K3-Vei4 engine performance using swirl generator, air intake
tank and exhaust gas recirculation modification. International Journal of
Automotive and Mechanical Engineering. 2015;11:2484-94.
[3] Adam IK, A. Aziz AR, Yusup S. Determination of diesel engine performance
fueled biodiesel (rubber seed/palm oil mixture) diesel blend. International Journal
of Automotive and Mechanical Engineering. 2015;11:2675-85.
[4] Eastwood P. Particulate emissions from vehicles: John Wiley & Sons; 2008.
[5] Pulkrabek WW. Engineering fundamentals of the internal combustion engine:
Prentice Hall; 2004.

Numerical investigation of soot mass concentration in compression ignition diesel engine
2284
[6] Gómez-Rico MaF, Martı́n-Gullón I, Fullana A, Conesa JA, Font R. Pyrolysis and
combustion kinetics and emissions of waste lube oils. Journal of Analytical and
Applied Pyrolysis. 2003;68:527-46.
[7] Brunekreef B, Holgate ST. Air pollution and health. The lancet. 2002;360:1233-
42.
[8] Kagawa J. Health effects of diesel exhaust emissions—a mixture of air pollutants
of worldwide concern. Toxicology. 2002;181:349-53.
[9] Englert N. Fine particles and human health—a review of epidemiological studies.
Toxicology Letters. 2004;149:235-42.
[10] Kim K-H, Kabir E, Kabir S. A review on the human health impact of airborne
particulate matter. Environment International. 2015;74:136-43.
[11] Woschni G, Huber K. The influence of soot deposits on combustion chamber
walls on heat losses in diesel engines. SAE Technical Paper No. 910297; 1991.
[12] Mainwaring R. Soot and wear in heavy duty diesel engines. SAE Technical Paper
No. 971631; 1997.
[13] George S, Balla S, Gautam M. Effect of diesel soot contaminated oil on engine
wear. Wear. 2007;262:1113-22.
[14] George S, Balla S, Gautam V, Gautam M. Effect of diesel soot on lubricant oil
viscosity. Tribology International. 2007;40:809-18.
[15] ECOpoint. Emission standards. DieselNet; 2015.
[16] UNEP. Status of fuel quality and vehicle emission standards in Asia-Pacific.
United Nations Environment Programme; 2013.
[17] Ghafoori M, Ghobadian B, Najafi G, Layeghi M, Rashidi A, Mamat R. Effect of
nano-particles on the performance and emission of a diesel engine using biodiesel-
diesel blend. International Journal of Automotive and Mechanical Engineering.
2015;12:3097-108.
[18] Azad AK, Rasul M, Giannangelo B, Islam R. Comparative study of diesel engine
performance and emission with soybean and waste oil biodiesel fuels.
International Journal of Automotive and Mechanical Engineering. 2015;12:2866-
81.
[19] Dubey P, Gupta R. Study of the performance and emission characteristics for a
dual fuel powered single cylinder diesel engine. International Journal of
Automotive and Mechanical Engineering. 2016; 13(2):3373-87.
[20] Bhaskar K, Sendilvelan S, Muthu V, Aravindraj S. Performance and emission
characteristics of compression ignition engine using methyl ester blends of
jatropha and fish oil. Journal of Mechanical Engineering and Scienes. 2016;
10(2):1984-97.
[21] Yusop A, Mamat R, Mat Yasin M, Ali OM. Effects of particulate matter emissions
of diesel engine using diesel–methanol blends. Journal of Mechanical Engineering
and Sciences. 2014;6:959-67.
[22] Kamil M, Rahman MM. Effect of Injection Hole Diameter on Operational
Conditions of Common-Rail Fuel-Injection System for Port-Injection Hydrogen-
Fueled Engine. International Journal of Automotive and Mechanical Engineering.
2015;11:2383-95.
[23] Vashist D, Ahmad M. Statistical Analysis of Diesel Engine Performance for
Castor and Jatropha Biodiesel-Blended Fuel. International Journal of Automotive
and Mechanical Engineering. 2014;10:2155-69.

Ibrahim et al. / Journal of Mechanical Engineering and Sciences 10(3) 2016 2275-2287
2285
[24] Ibrahim F, Mahmood WMFW, Abdullah S, Mansor MRA. A review of soot
particle measurement in lubricating oil. Defence S and T Technical Bulletin.
2015;8:141-52.
[25] Ibrahim F, Mahmood WMFW, Abdullah S, Mansor MRA. Soot particle
measurement in engine cylinder. Jurnal Teknologi. 2016;78:187-95.
[26] Mahmood W, Faizal WM. Computational studies of soot paths to cylinder wall
layers of a direct injection diesel engine: University of Nottingham; 2011.
[27] Mahmood WMFW, LaRocca A, Shayler PJ, Bonatesta F, Pegg I. Predicted paths
of soot particles in the cylinders of a direct injection diesel engine. SAE Technical
Paper; 2012.
[28] Weber J, Peters N, Bockhorn H, Pittermann R. Numerical simulation of the
evolution of the soot particle size distribution in a DI diesel engine using an
emulsified fuel of diesel-water. SAE Technical Paper No. 2004-01-1840; 2004.
[29] Cui X, Zhou B, Matsunaga M, Fujii Y, Kusaka J, Daisho Y. A Numerical Study
of the Effects of FAME Blends on Diesel Combustion and Emissions
Characteristics Using a 3-D CFD Code Combined with Detailed Kinetics and
Phenomenological Soot Formation Models. SAE International Journal of Fuels
and Lubricants. 2013;6:839-51.
[30] Zuber MA, Mahmood WMFW, Harun Z, Abidin ZZ. Soot particle evolution and
transport in a direct injection diesel engine. Jurnal Teknologi. 2015;74:85-8.
[31] Zuber MA, Mahmood WMFW, Harun Z, Abidin ZZ, La Rocca A, Shayler P, et
al. Modeling of in-cylinder soot particle size evolution and distribution in a direct
injection diesel engine. SAE Technical Paper No. 2015-01-1075; 2015.
[32] Sukumaran S, Kong S-C. Modelling biodiesel–diesel spray combustion using
multicomponent vaporization coupled with detailed fuel chemistry and soot
models. Combustion Theory and Modelling. 2016;20:913-40.
[33] Raj RTK, Manimaran R. Effect of swirl in a constant speed DI diesel engine using
computational fluid dynamics. CFD Letters. 2012;4:214-24.
[34] Tutak W, Jamrozik A. Validation and optimization of the thermal cycle for a
diesel engine by computational fluid dynamics modeling. Applied Mathematical
Modelling. 2016;40:6293-309.
[35] Zhao F, Yu W, Su W. Sensitivity study of engine soot forming using detailed soot
modelling oriented in soot surface growth dynamic. Fuel. 2016;168:81-90.
[36] Sencic T, Medica V, Bukovac O. Soot model validation and development.
Advanced Engineering. 2010;4.
[37] Bissoli M, Cuoci A, Frassoldati A, Faravelli T, Ranzi E, Lucchini T, et al. Detailed
kinetic analysis of HCCI combustion using a new multi-zone model and CFD
simulations. SAE International Journal of Engines. 2013;6:1594-609.
[38] Kawanabe H, Ishiyama T. Computational fluid dynamics analysis of the
combustion process and emission characteristics for a direct-injection-premixed
charge compression ignition engine. International Journal of Engine Research.
2014;15:539-48.
[39] Wei S, Wang F, Leng X, Liu X, Ji K. Numerical analysis on the effect of swirl
ratios on swirl chamber combustion system of DI diesel engines. Energy
Conversion and Management. 2013;75:184-90.
[40] Wang Z, Srinivasan KK, Krishnan SR, Som S. A computational investigation of
diesel and biodiesel combustion and NOx formation in a light-duty compression
ignition engine. Mississippi State University; 2012.

Numerical investigation of soot mass concentration in compression ignition diesel engine
2286
[41] Ren Y, Abu-Ramadan E, Li X. Numerical simulation of biodiesel fuel combustion
and emission characteristics in a direct injection diesel engine. Frontiers of Energy
and Power Engineering in China. 2010;4:252-61.
[42] Pang KM, Ng HK, Gan S. In-cylinder diesel spray combustion simulations using
parallel computation: A performance benchmarking study. Applied Energy.
2012;93:466-78.
[43] Pang KM, Ng HK, Gan S. Simulation of temporal and spatial soot evolution in an
automotive diesel engine using the Moss–Brookes soot model. Energy
Conversion and Management. 2012;58:171-84.
[44] Tan SM, Ng HK, Gan S. Computational study of crevice soot entrainment in a
diesel engine. Applied Energy. 2013;102:898-907.
[45] Tan SM, Ng HK, Gan S. CFD modelling of soot entrainment via thermophoretic
deposition and crevice flow in a diesel engine. Journal of Aerosol Science.
2013;66:83-95.
[46] Richards KJ, Senecal PK, Pomraning E. CONVERGE (v2.2.0). In: Inc. CS, editor.
Madison, WI, WI: Convergent Science Inc.; 2014.
[47] Hiroyasu H, Kadota T. Models for combustion and formation of nitric oxide and
soot in direct injection diesel engines. SAE Technical Paper; 1976.
[48] Walls J, Strickland-Constable R. Oxidation of carbon between 1000–2400 C.
Carbon. 1964;1:333IN23335-334338.
[49] Zuber MA, Mahmood WMFW, Abidin ZZ, Harun Z. In-cylinder soot particle
distribution in squish region of a direct injection diesel engine. International
Journal of Mechanical and Mechatronics Engineering. 2014;14:51-8.
[50] Heywood J. Internal combustion engine fundamentals: McGraw-Hill Education;
1988.
[51] Reitz RD, Bracco F. Mechanisms of breakup of round liquid jets. Encyclopedia
of Fluid Mechanics. 1986;3:233-49.
[52] Ricart L, Xin J, Bower GR, Reitz RD. In-cylinder measurement and modeling of
liquid fuel spray penetration in a heavy-duty diesel engine. SAE Technical Paper;
1997.
[53] Liu A, Mather D, Reitz R. Modeling the effects of drop drag and breakup on fuel
sprays. Technical paper. Wisconsin Univ., Madison, WI (United States). Engine
Research Center; 1993.
[54] Schmidt DP, Rutland C. A new droplet collision algorithm. Journal of
Computational Physics. 2000;164:62-80.
[55] Naber J, Reitz RD. Modeling engine spray/wall impingement. SAE Technical
Paper; 1988.
[56] Lian ZW, Reitz RD. Modeling Diesel Engine Spray Vaporization and
Combustion. SAE Technical Paper; 1992.
[57] Han Z, Reitz RD. Turbulence modeling of internal combustion engines using
RNG κ-ε models. Combustion Science and Technology. 1995;106:267-95.
[58] Senecal P, Pomraning E, Richards K, Briggs T, Choi C, McDavid R, et al. Multi-
dimensional modeling of direct-injection diesel spray liquid length and flame lift-
off length using CFD and parallel detailed chemistry. SAE Technical Paper; 2003.
[59] CEI. EnSight User Manual for version 10.1. In: Inc. CEI, editor. USA;2013.
[60] Ibrahim F, Mahmood WMFW, Abdullah S, Mansor MRA. Numerical
investigation on soot particles emission in compression ignition diesel engine by
using particulate mimic soot model. MATEC Web of Conferences: EDP
Sciences; 2017. p. 01071.

Ibrahim et al. / Journal of Mechanical Engineering and Sciences 10(3) 2016 2275-2287
2287
[61] Alkidas AC. Relationships between smoke measurements and particulate
measurements. SAE Technical Paper; 1984.
[62] Tree DR, Svensson KI. Soot processes in compression ignition engines. Progress
in Energy and Combustion Science. 2007;33:272-309.
[63] Xi J, Zhong BJ. Soot in diesel combustion systems. Chemical Engineering
andTechnology. 2006;29:665-73.
[64] Ibrahim F, Mahmood WMFW, Abdullah S, Mansor MRA. Investigation of soot
particles in compression ignition diesel engine by CFD simulation using different
level of complexity of soot models. FISITA 2016 World Automotive Congress.
Busan, Korea; 2016.
[65] Symonds JP, Reavell KSJ, Olfert JS, Campbell BW, Swift SJ. Diesel soot mass
calculation in real-time with a differential mobility spectrometer. Journal of
Aerosol Science. 2007;38:52-68.