11Ð1 The W ork of Gregor Mendel Section 11Ð1 Section 11Ð...
18
Section 11–1 11–1 The Work of Gregor Mendel W hat is an inheritance? To most people, it is money or property left to them by a relative who has passed away. That kind of inheritance is important, of course. There is another form of inheritance, however, that matters even more. This inheritance has been with you from the very first day you were alive—your genes. Every living thing—plant or animal, microbe or human being—has a set of characteristics inherited from its parent or parents. Since the beginning of recorded history, people have wanted to understand how that inheritance is passed from generation to generation. More recently, however, scientists have begun to appreciate that heredity holds the key to under- standing what makes each species unique. As a result, the scientific study of heredity, is now at the core of a revolution in understanding biology. Gregor Mendel’s Peas The work of an Austrian monk named Gregor Mendel, shown in Figure 11–1, was particularly important to understanding biological inheritance. Gregor Mendel was born in 1822 in what is now the Czech Republic. After becoming a priest, Mendel spent several years studying science and mathematics at the University of Vienna. He spent the next 14 years working in the monastery and teaching at the high school. In addition to his teaching duties, Mendel was in charge of the monastery garden. In this ordinary garden, he was to do the work that changed biology forever. Mendel carried out his work with ordinary garden peas. He knew that part of each flower produces pollen, which contains the plant’s male reproductive cells, or sperm. Similarly, the female portion of the flower produces egg cells. During sexual reproduc- tion, male and female reproductive cells join, a process known as Fertilization produces a new cell, which develops into a tiny embryo encased within a seed. Pea flowers are normally self-pollinating, which means that sperm cells in pollen fertilize the egg cells in the same flower. The seeds that are produced by self-pollination inherit all of their characteristics from the single plant that bore them. In effect, they have a single parent. When Mendel took charge of the monastery garden, he had several stocks of pea plants. These peas were meaning that if they were allowed to self-pollinate, they would produce offspring identical to themselves. One stock of seeds would produce only tall plants, another only short ones. One line produced only green seeds, another only yellow seeds. These true-breeding plants were the basis of Mendel’s experiments. true-breeding, fertilization. genetics, Key Concepts • What is the principle of dominance? • What happens during segregation? Vocabulary genetics • fertilization true-breeding • trait • hybrid gene • allele • segregation gamete Reading Strategy: Finding Main Ideas As you read, find evidence to support the following statement: Mendel’s ideas about genetics were the beginning of a new area of biology. Figure 11–1 Gregor Mendel’s experiments with pea plants laid the foundations of the science of genetics. 1 FOCUS Objectives 11.1.1 Describe how Mendel stud- ied inheritance in peas. 11.1.2 Summarize Mendel’s con- clusion about inheritance. 11.1.3 Explain the principle of dominance. 11.1.4 Describe what happens dur- ing segregation. Vocabulary Preview Help students become comfortable with the language of genetics by showing them how the Vocabulary words are related to one another. For example, a true-breeding individual is the opposite of a hybrid; an allele is one form of a gene, and genes speci- fy particular traits. Construct a word web on the board to show these rela- tionships. Reading Strategy Students should mention Mendel’s research approach, as well as his results and interpretations, as support for the main idea. 2 INSTRUCT Gregor Mendel’s Peas Build Science Skills Observing Give students lilies, tulips, freesia, or other flowers with large stamens and pistils. Instruct them to cut off the stamens and pis- tils with small scissors and examine them under a dissecting microscope. If students carefully section the anther and the pistil, they may be able to observe pollen and egg cells on microscope slides with a com- pound microscope. Help them distinguish between pollen and sperm, and egg and ovule. Encourage students to draw labeled diagrams of their flowers. Introduction to Genetics 263 SECTION RESOURCES Print: • Teaching Resources, Section Review 11–1 • Reading and Study Workbook A, Section 11–1 • Adapted Reading and Study Workbook B, Section 11–1 • Lesson Plans, Section 11–1 Technology: • iText, Section 11–1 • Animated Biological Concepts Videotape Library, 19 • Transparencies Plus, Section 11–1 Section 11–1
-
Upload
duongthuan -
Category
Documents
-
view
220 -
download
0
Transcript of 11Ð1 The W ork of Gregor Mendel Section 11Ð1 Section 11Ð...

Section 11–111–1 The Work of Gregor Mendel
What is an inheritance? To most people, it is money orproperty left to them by a relative who has passed away.
That kind of inheritance is important, of course. There isanother form of inheritance, however, that matters even more.This inheritance has been with you from the very first day youwere alive—your genes.
Every living thing—plant or animal, microbe or humanbeing—has a set of characteristics inherited from its parent or parents. Since the beginning of recorded history, people have wanted to understand how that inheritance is passed from generation to generation. More recently, however, scientistshave begun to appreciate that heredity holds the key to under-standing what makes each species unique. As a result,
the scientific study of heredity, is now at the core of a revolution in understanding biology.
Gregor Mendel’s PeasThe work of an Austrian monk named Gregor Mendel, shown inFigure 11–1, was particularly important to understandingbiological inheritance. Gregor Mendel was born in 1822 in whatis now the Czech Republic. After becoming a priest, Mendelspent several years studying science and mathematics at theUniversity of Vienna. He spent the next 14 years working in themonastery and teaching at the high school. In addition to histeaching duties, Mendel was in charge of the monastery garden.In this ordinary garden, he was to do the work that changedbiology forever.
Mendel carried out his work with ordinary garden peas. Heknew that part of each flower produces pollen, which contains theplant’s male reproductive cells, or sperm. Similarly, the femaleportion of the flower produces egg cells. During sexual reproduc-tion, male and female reproductive cells join, a process known as
Fertilization produces a new cell, which developsinto a tiny embryo encased within a seed. Pea flowers are normallyself-pollinating, which means that sperm cells in pollen fertilizethe egg cells in the same flower. The seeds that are produced byself-pollination inherit all of their characteristics from the singleplant that bore them. In effect, they have a single parent.
When Mendel took charge of the monastery garden, he hadseveral stocks of pea plants. These peas were meaning that if they were allowed to self-pollinate, they wouldproduce offspring identical to themselves. One stock of seedswould produce only tall plants, another only short ones. One lineproduced only green seeds, another only yellow seeds. Thesetrue-breeding plants were the basis of Mendel’s experiments.
true-breeding,
fertilization.
genetics,
Key Concepts • What is the principle of
dominance?• What happens during
segregation?
Vocabularygenetics • fertilization true-breeding • trait • hybridgene • allele • segregationgamete
Reading Strategy:Finding Main Ideas As youread, find evidence to supportthe following statement:Mendel’s ideas about geneticswere the beginning of a newarea of biology.
� Figure 11–1 Gregor Mendel’sexperiments with pea plants laid thefoundations of the science ofgenetics.
1 FOCUSObjectives11.1.1 Describe how Mendel stud-
ied inheritance in peas.11.1.2 Summarize Mendel’s con-
clusion about inheritance.11.1.3 Explain the principle of
dominance.11.1.4 Describe what happens dur-
ing segregation.
Vocabulary PreviewHelp students become comfortablewith the language of genetics byshowing them how the Vocabularywords are related to one another. Forexample, a true-breeding individualis the opposite of a hybrid; an allele isone form of a gene, and genes speci-fy particular traits. Construct a wordweb on the board to show these rela-tionships.
Reading StrategyStudents should mention Mendel’sresearch approach, as well as hisresults and interpretations, as supportfor the main idea.
2 INSTRUCT
Gregor Mendel’sPeasBuild Science SkillsObserving Give students lilies,tulips, freesia, or other flowers withlarge stamens and pistils. Instructthem to cut off the stamens and pis-tils with small scissors and examinethem under a dissecting microscope.If students carefully section theanther and the pistil, they may beable to observe pollen and egg cellson microscope slides with a com-pound microscope. Help themdistinguish between pollen andsperm, and egg and ovule.Encourage students to draw labeleddiagrams of their flowers.
Introduction to Genetics 263
SECTION RESOURCES
Print:
• Teaching Resources, Section Review 11–1• Reading and Study Workbook A, Section 11–1• Adapted Reading and Study Workbook B,
Section 11–1• Lesson Plans, Section 11–1
Technology:
• iText, Section 11–1• Animated Biological Concepts Videotape
Library, 19• Transparencies Plus, Section 11–1
Tim
eSaver
Section 11–1
264 Chapter 11
Build Science SkillsClassifying Explain that much ofMendel’s success came from hischoice of experimental organism. Peaplants are useful for genetic studybecause they have many contrastingcharacters, they reproduce sexually,their crosses can be controlled, theyhave short life cycles, they produce alarge number of offspring, and theyare easy to handle in a laboratory.Invite students to apply these samecriteria to other organisms, such ashumans, fruit flies, bacteria, oaktrees, dogs, and mice. For eachorganism, students should explainwhy it would or would not be usefulfor genetic study. (Fruit flies, bacteria,and mice are most useful.)
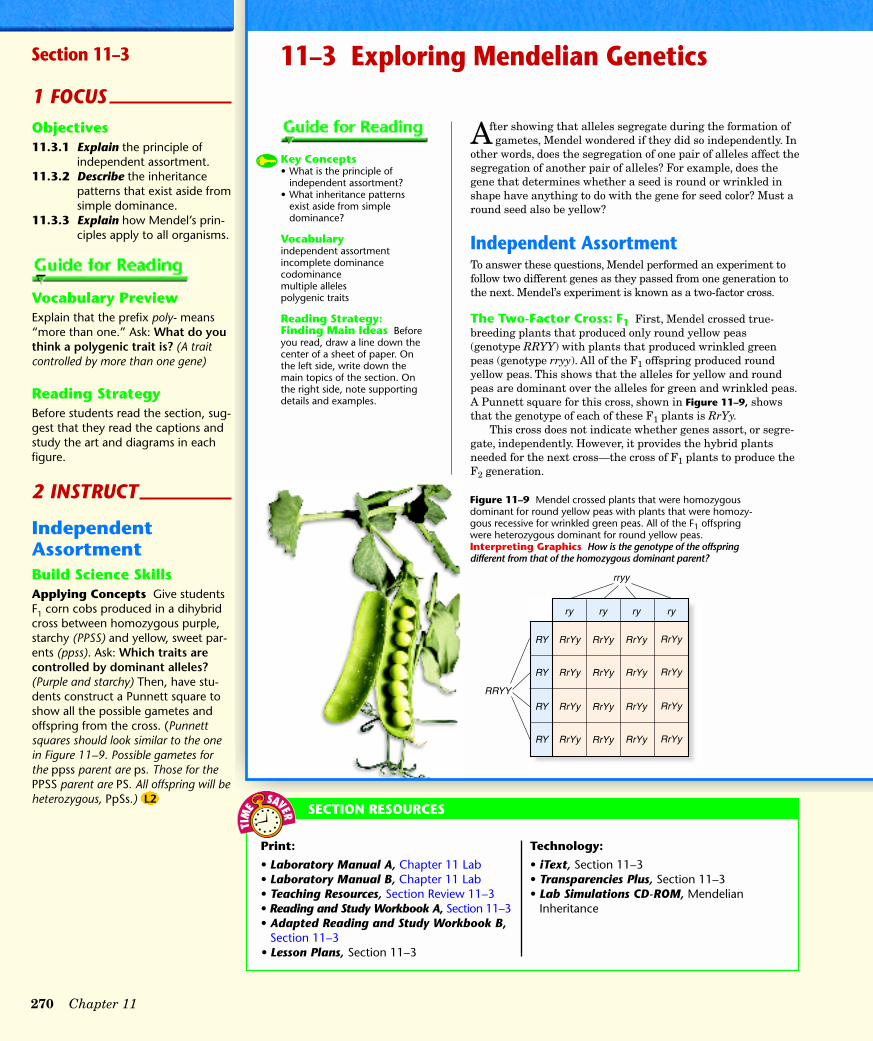
Genes andDominanceUse VisualsFigure 11–3 Review the results ofMendel’s crosses. Make sure studentscan identify which traits are dominantand which are recessive. Ask: Whywas Mendel surprised when the off-spring had the character of onlyone of the parents? (In Mendel’s time,people thought that characters of theparents blended to form the offspring.)Relate the terms genes and alleles tothe results shown in the table. Makesure students are comfortable with theterminology.
SeedShape
SeedColor
Seed CoatColor
PodShape
PodColor
FlowerPosition
PlantHeight
Round Yellow Gray Smooth Green Axial Tall
Round Yellow Gray Smooth Green Axial Tall
Wrinkled Green White Constricted Yellow Terminal Short
XXP
F1
X X X XX
Mendel’s Seven F1 Crosses on Pea Plants
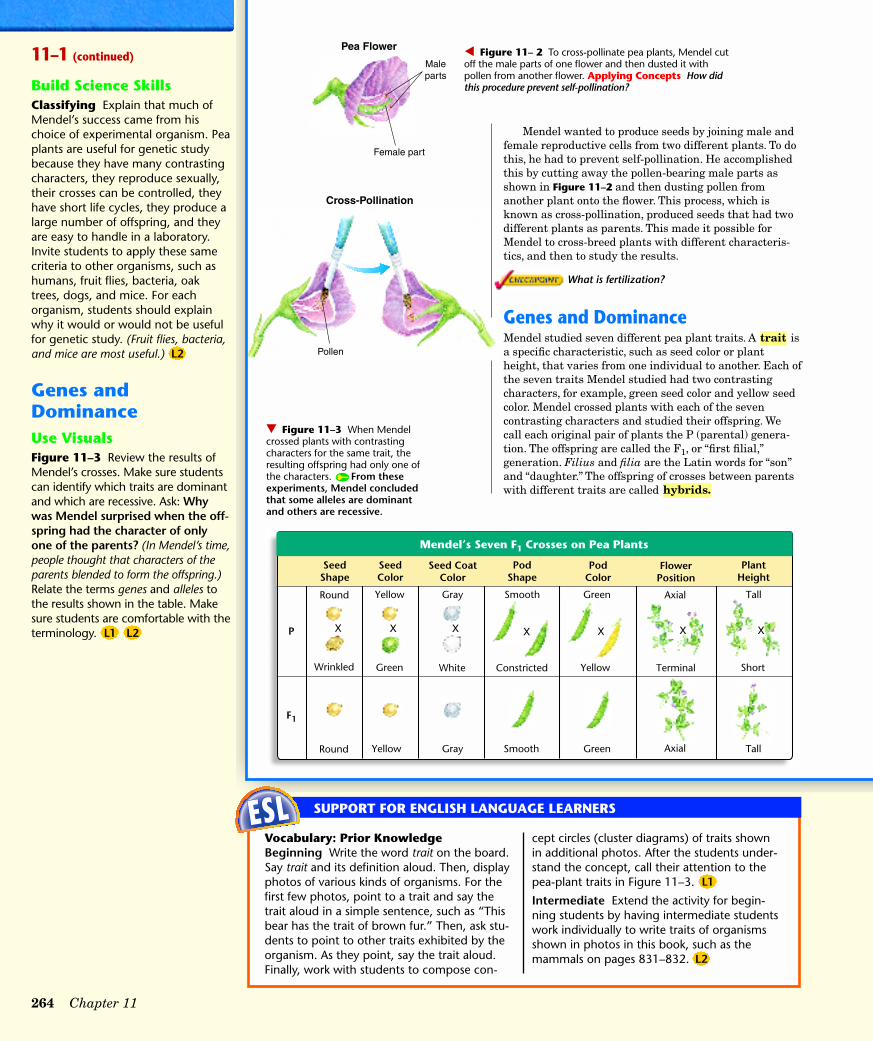
� Figure 11– 2 To cross-pollinate pea plants, Mendel cutoff the male parts of one flower and then dusted it withpollen from another flower. Applying Concepts How didthis procedure prevent self-pollination?
Cross-Pollination
Pea Flower
Pollen
Maleparts
Female part
Mendel wanted to produce seeds by joining male andfemale reproductive cells from two different plants. To dothis, he had to prevent self-pollination. He accomplishedthis by cutting away the pollen-bearing male parts asshown in Figure 11–2 and then dusting pollen fromanother plant onto the flower. This process, which isknown as cross-pollination, produced seeds that had twodifferent plants as parents. This made it possible forMendel to cross-breed plants with different characteris-tics, and then to study the results.
What is fertilization?
Genes and DominanceMendel studied seven different pea plant traits. A isa specific characteristic, such as seed color or plantheight, that varies from one individual to another. Each ofthe seven traits Mendel studied had two contrastingcharacters, for example, green seed color and yellow seedcolor. Mendel crossed plants with each of the sevencontrasting characters and studied their offspring. Wecall each original pair of plants the P (parental) genera-tion. The offspring are called the F1, or “first filial,”generation. Filius and filia are the Latin words for “son”and “daughter.” The offspring of crosses between parentswith different traits are called hybrids.
trait
� Figure 11–3 When Mendelcrossed plants with contrastingcharacters for the same trait, theresulting offspring had only one ofthe characters. From theseexperiments, Mendel concludedthat some alleles are dominantand others are recessive.
Vocabulary: Prior KnowledgeBeginning Write the word trait on the board.Say trait and its definition aloud. Then, displayphotos of various kinds of organisms. For thefirst few photos, point to a trait and say thetrait aloud in a simple sentence, such as “Thisbear has the trait of brown fur.” Then, ask stu-dents to point to other traits exhibited by theorganism. As they point, say the trait aloud.Finally, work with students to compose con-
cept circles (cluster diagrams) of traits shownin additional photos. After the students under-stand the concept, call their attention to thepea-plant traits in Figure 11–3.
Intermediate Extend the activity for begin-ning students by having intermediate studentswork individually to write traits of organismsshown in photos in this book, such as themammals on pages 831–832.
SUPPORT FOR ENGLISH LANGUAGE LEARNERS
11–1 (continued)

For: Articles on geneticsVisit: PHSchool.comWeb Code: cbe-4111
What were those F1 hybrid plants like? Did the characters ofthe parent plants blend in the offspring? Not at all. To Mendel’ssurprise, all of the offspring had the character of only one of theparents, as shown in Figure 11–3. In each cross, the character ofthe other parent seemed to have disappeared.
From this set of experiments, Mendel drew two conclusions.Mendel’s first conclusion was that biological inheritance is deter-mined by factors that are passed from one generation to the next.Today, scientists call the chemical factors that determine traits
Each of the traits Mendel studied was controlled by onegene that occurred in two contrasting forms. These contrastingforms produced the different characters of each trait. For exam-ple, the gene for plant height occurs in one form that produces tallplants and in another form that produces short plants. Thedifferent forms of a gene are called (uh-LEELZ).
Mendel’s second conclusion is called the principle of domi-nance. The principle of dominance states that some
alleles are dominant and others are recessive. An organismwith a dominant allele for a particular form of a trait will alwaysexhibit that form of the trait. An organism with a recessive allelefor a particular form of a trait will exhibit that form only whenthe dominant allele for the trait is not present. In Mendel’sexperiments, the allele for tall plants was dominant and theallele for short plants was recessive. The allele for yellow seedswas dominant, while the allele for green seeds was recessive.
SegregationMendel wanted the answer to another question: Had the reces-sive alleles disappeared, or were they still present in the F1plants? To answer this question, he allowed all seven kinds of F1hybrid plants to produce an F2 (second filial) generation by self-pollination. In effect, he crossed the F1 generation with itself toproduce the F2 offspring, as shown in Figure 11–4.
alleles
genes.
P Generation F1 Generation F2 Generation
Tall Short TallTallTallTallTall Short
XX
� Figure 11–4 When Mendelallowed the F1 plants to reproduceby self-pollination, the traits con-trolled by recessive alleles reappearedin about one fourth of the F2 plantsin each cross. Calculating Whatproportion of the F2 plants had a traitcontrolled by a dominant allele?
DemonstrationDisplay the parental corn cobs andthe F1 corn cobs produced in a crossbetween purple (PP) corn and yellow(pp) corn, as well as those produced ina cross between starchy (SS) corn andsweet (ss) corn. Have students identifythe traits associated with each allelefor each cross and which allele is dominant and which is recessive.
SegregationUse VisualsFigure 11–4 Walk students throughthe crosses that Mendel set up asthey are illustrated in the figure. Ask:Did Mendel cross-pollinate F1plants to get F2 plants? (No, heallowed them to self-pollinate.) Wasthe recessive allele for shortnesslost in the F1 generation? (No, itwas masked by the dominant allele fortallness.) Are the F1 plants true-breeding? (No, they did not produceoffspring identical to themselves.) Havestudent volunteers identify thegametes that each plant would pro-duce in the P generation and in theF1 generation.
Address MisconceptionsSome students might think it isimpossible for two tall pea plants toproduce short pea plants. For thesestudents, review the cross as shownin Figure 11–4. Make sure they seethat the tall pea plants came from atall plant crossed to a short plant.Ask: Why aren’t any offspringshort? (The allele for tallness is domi-nant and masks the allele forshortness.) Why do these plantshave an allele for shortness? (Oneof their parents was short and couldcontribute only alleles for shortness toits offspring.)
Introduction to Genetics 265
Methods of Mendel’s successMendel was the first scientist of his time to obtainsuccessful results from inheritance studies becauseof the methods he employed. In fact, his methodscontinue to be used today. Mendel studied onlyone trait at a time. He also took the time to verifythat the parent plants were true-breeding for the
particular trait he was studying. Mendel used aquantitative approach to analyze his results. Hecounted the number of offspring from every crossand used statistical analysis to interpret his num-bers. Most important, Mendel formulatedhypotheses to explain his results, and he devel-oped experimental tests to confirm them.
HISTORY OF SCIENCE
Answers to . . . The process during sex-
ual reproduction when male andfemale cells join
Figure 11–2 The flower no longerhad its own source of pollen.
Figure 11–4 Three fourths
Science News provides studentswith the most current informationon genetics.

The F1 Cross The results of the F1 cross were remarkable.When Mendel compared the F2 plants, he discovered that thetraits controlled by the recessive alleles had reappeared!Roughly one fourth of the F2 plants showed the trait controlledby the recessive allele. Why did the recessive alleles seem todisappear in the F1 generation and then reappear in the F2generation? To answer this question, let’s take a closer look atone of Mendel’s crosses.
Explaining the F1 Cross To begin with, Mendel assumedthat a dominant allele had masked the corresponding recessiveallele in the F1 generation. However, the trait controlled by therecessive allele showed up in some of the F2 plants. This reappearance indicated that at some point the allele for short-ness had been separated from the allele for tallness. How didthis separation, or of alleles occur? Mendel suggested that the alleles for tallness and shortness in the F1plants segregated from each other during the formation of the sex cells, or (GAM-eetz). Did that suggestionmake sense?
Let’s assume, as perhaps Mendel did, that the F1 plantsinherited an allele for tallness from the tall parent and an allelefor shortness from the short parent. Because the allele fortallness is dominant, all the F1 plants are tall. When each
F1 plant flowers and produces gametes, the two alleles
segregate from each other so that each gamete carries
only a single copy of each gene. Therefore, each F1 plant
produces two types of gametes—those with the allele for
tallness and those with the allele for shortness.
Look at Figure 11–5 to see how alleles separated duringgamete formation and then paired up again in the F2 genera-tion. A capital letter T represents a dominant allele. A lowercaseletter t represents a recessive allele. The result of this process isan F2 generation with new combinations of alleles.
gametes
segregation,
Segregation
Gametes
F1
F2
Tt Tt
T t
TT Tt
T t
Tt tt
� Figure 11–5 Duringgamete formation, alleles segre-gate from each other so that eachgamete carries only a single copyof each gene. Each F1 plantproduces two types of gametes—those with the allele for tallnessand those with the allele forshortness. The alleles are paired upagain when gametes fuse duringfertilization. The TT and Tt allelecombinations produce tall peaplants; tt is the only allele combina-tion that produces a short peaplant.
1. Key Concept What aredominant and recessive alleles?
2. Key Concept What issegregation? What happens toalleles during segregation?
3. What did Mendel concludedetermines biological inheri-tance?
4. Describe how Mendel cross-pollinated pea plants.
5. Why did only about one fourth ofMendel’s F2 plants exhibit therecessive trait?
6. Critical Thinking ApplyingConcepts Why were true-breeding pea plants importantfor Mendel’s experiments?
11–1 Section AssessmentUsing DiagramsUse a diagram to explainMendel’s principles of domi-nance and segregation. Your diagram should showhow the alleles segregate during gamete formation.
266 Chapter 11
Build Science SkillsCalculating Instruct students toplant F2 corn seeds produced in across between two plants heterozy-gous for green and white color (Gg).When the seeds sprout, studentsshould get a mixture of green plantsand white plants. Ask: Which alleleis dominant? (Green) Which isrecessive? (White) How do youknow? (More green plants) Have stu-dents calculate the ratio of greenplants to white plants. Discuss howtheir results compare with Mendel’s.(The class should have a ratio close to3 green : 1 white.)
3 ASSESSEvaluate UnderstandingAssign students a trait in pea plants.Have them set up a cross as Mendeldid to show the F1 and F2 offspring.Students should identify the domi-nant and recessive alleles.
ReteachHelp students devise a flowchart thatoutlines Mendel’s method for hisbreeding experiments in pea plants.Encourage students to include asmany Vocabulary words as possible.
11–1 (continued)
Students’ diagrams should be sim-ilar to Figures 11–3 and 11–5.Segregation of alleles ensures thateach gamete carries only a singlecopy of each gene.
If your class subscribes to the iText,use it to review the Key Concepts inSection 11–1.
11–1 Section Assessment1. Dominant: form of an allele whose trait
always shows up if it is present; recessive:form of an allele whose trait shows up onlywhen the dominant allele is not present
2. Separation of paired alleles; the alleles areseparated during the formation of gametes,with the result that each gamete carries onlya single allele from the original pair.
3. Factors that are passed from one generationto the next
4. Mendel cut away the male parts of oneflower, then dusted it with pollen fromanother flower.
5. Only one-fourth of the possible gamete com-binations did not have a dominant allele.
6. True-breeding pea plants have two identicalalleles for a gene, so in a genetic cross eachparent contributed only one form of a gene,making inheritance patterns more detectable.

11–2 Probability and Punnett Squares
Key Concepts• How do geneticists use the
principles of probability?• How do geneticists use
Punnett squares?
VocabularyprobabilityPunnett squarehomozygousheterozygousphenotypegenotype
Reading Strategy:Building Vocabulary Beforeyou read, preview the list of newvocabulary words. Predict therelationship between phenotypeand genotype. As you read,check to see if your predictionswere correct.
Whenever Mendel performed a cross with pea plants, hecarefully categorized and counted the many offspring.
Every time Mendel repeated a particular cross, he obtainedsimilar results. For example, whenever Mendel crossed twoplants that were hybrid for stem height (Tt), about three fourthsof the resulting plants were tall and about one fourth wereshort. Mendel realized that the principles of probability could beused to explain the results of genetic crosses.
Genetics and ProbabilityThe likelihood that a particular event will occur is called
As an example of probability, consider an ordinaryevent like the coin flip shown in Figure 11– 6. There are twopossible outcomes: The coin may land heads up or tails up. Thechances, or probabilities, of either outcome are equal. Therefore,the probability that a single coin flip will come up heads is 1chance in 2. This is 1/2, or 50 percent.
If you flip a coin three times in a row, what is the probabilitythat it will land heads up every time? Because each coin flip isan independent event, the probability of each coin’slanding heads up is 1/2. Therefore, the probability offlipping three heads in a row is:
�� � �� � �� = ���� .
As you can see, you have 1 chance in 8 of flippingheads three times in a row. That the individual proba-bilities are multiplied together illustrates an importantpoint—past outcomes do not affect future ones.
How is coin flipping relevant to genetics? The wayin which alleles segregate is completely random, like acoin flip. The principles of probability can be
used to predict the outcomes of genetic crosses.
What is the probability that a tossed coin willcome up tails twice in a row?
probability.
� Figure 11–6 The mathematical conceptof probability allows you to calculate thelikelihood that a particular event will occur.Predicting What is the probability that thecoin will land heads up?
1 FOCUSObjectives11.2.1 Explain how geneticists use
the principles of probability.11.2.2 Describe how geneticists use
Punnett squares.
Vocabulary Preview Ask: What suffix do the wordshomozygous and heterozygousshare? (-zygous) Tell students that -zygous means “yoked” or “joined,”and the prefix homo- means “same.”Also explain that a homozygousorganism has two identical alleles fora certain gene. Ask: If hetero- means“other,” what does heterozygousdescribe? (An organism with two dif-ferent alleles for a gene)
Reading StrategyEncourage students to write downthe main headings of the sectionbefore they begin reading. Tell themto leave room below each heading torecord important ideas as they read.
2 INSTRUCT
Genetics andProbabilityMake ConnectionsMathematics Give pairs of studentsa paper bag that has 4 items that areidentical except for color. The itemsshould be the same shape and size.Ask: What is the probability of pick-ing a red item? (1/4 or 25 percent)Of picking a red item two times ina row? (1/4 � 1/4 � 1/16) Then,instruct students to pick an item fromthe bag 20 times, then 50 times. Ask:Did your results equal your calcu-lated probabilities? (The more timesstudents pick from the bag, the closertheir actual results will be to the pre-dicted probability.)
Introduction to Genetics 267
Answers to . . . 1/4 or 25 percent
Figure 11–6 1/2 or 50 percent
SECTION RESOURCES
Print:
• Teaching Resources, Section Review 11–2,Enrichment
• Reading and Study Workbook A, Section 11–2• Adapted Reading and Study Workbook B,
Section 11–2• Lesson Plans, Section 11–2
Technology:
• iText, Section 11–2• Transparencies Plus, Section 11–2
Tim
eSaver
Section 11–2

Punnett SquaresThe gene combinations that might result from a geneticcross can be determined by drawing a diagram known asa The Punnett square in Figure 11–7shows one of Mendel’s segregation experiments. The typesof gametes produced by each F1 parent are shown alongthe top and left sides of the square. The possible genecombinations for the F2 offspring appear in the fourboxes that make up the square. The letters in thePunnett square represent alleles. In this example, Trepresents the dominant allele for tallness and t repre-sents the recessive allele for shortness. Punnett
squares can be used to predict and compare the
genetic variations that will result from a cross.
Organisms that have two identical alleles for a partic-ular trait—TT or tt in this example—are said to be
(hoh-moh-ZY-gus). Organisms that havetwo different alleles for the same trait are (het-ur-oh-ZY-gus). Homozygous organisms are true-breeding for a particular trait. Heterozygous organismsare hybrid for a particular trait.
All of the tall plants have the same orphysical characteristics. They do not, however, have thesame or genetic makeup. The genotype of onethird of the tall plants is TT, while the genotype of twothirds of the tall plants is Tt. The plants in Figure 11–8have the same phenotype but different genotypes.
genotype,
phenotype,
heterozygous
homozygous
Punnett square.
� Figure 11–7 The principles ofprobability can be used to predict theoutcomes of genetic crosses. ThisPunnett square shows the probability of each possible outcome of a crossbetween hybrid tall (Tt) pea plants.
T TT 25% Tt 25%
T t
t Tt 25% tt 25%
Tt
Tt
How are dimples inherited?
Materials copy of page from telephone book,calculator
Procedure1. Write the last 4 digits of any telephone number.
These 4 random digits represent the alleles of agene that determines whether a person will havedimples. Odd digits represent the allele for thedominant trait of dimples. Even digits stand for theallele for the recessive trait of no dimples.
2. Use the first 2 digits to represent a certain father’sgenotype. Use the symbols D and d to write hisgenotype, as shown in the example.
3. Use the last 2 digits the same way to find themother’s genotype. Write her genotype.
4. Use Figure 11–7 as an example to construct aPunnett square for the cross of these parents. Then,using the Punnett square, determine the probabil-ity that their child will have dimples.
5. Determine the class average of the percent ofchildren with dimples.
Analyze and Conclude1. Applying Concepts How does the class average
compare with the result of a cross of two heterozy-gous parents?
2. Drawing Conclusions What percentage of thechildren will be expected to have dimples if oneparent is homozygous for dimples (DD) and theother is heterozygous (Dd)?
4638
Father’s genotype is dd (2 even digits)
Mother’s genotype is Dd (1 even digit and 1 odd digit)
268 Chapter 11
Punnett Squares
Probability andSegregationAddress MisconceptionsBeginning genetics students oftenmisinterpret probable genotypic andphenotypic ratios as actual numbersof offspring. Provide opportuni-ties to calculate “actual” ratiosusing F2 corn cobs or experimen-tal data. Students should set upPunnett squares and compare thepredicted ratios with the “actual”ratios.
11–2 (continued)
Inclusion/Special NeedsGive students additional opportunities to practicecalculating probabilities by making available a“probabilities kit.” In this “kit,” provide coins anda grab bag with colored beads, colored sticks, orany other manipulative that differs only in color.You might have these students pair up withadvanced students to predict probabilities andobserve the outcomes.
Less Proficient ReadersChallenge students to write an instructional man-ual for using Punnett squares. Students shouldinclude a labeled diagram of a Punnett square intheir manual, as well as step-by-step directions onhow to use one and why Punnett squares are use-ful tools for geneticists.
Objective Students will be able toconclude how dimples are inherited.
Skills Focus Applying Concepts,Drawing ConclusionsMaterials copy of page from tele-phone book, calculatorTime 15 minutesAdvance Prep Photocopy severalpages from a telephone book.Strategies• Demonstrate the use of a 4-digit
number to represent the geno-types of the parents in a geneticcross.
• Show students how to set up anduse Punnett squares, if necessary.
Expected Outcomes Studentswill determine the probability ofhaving a child with dimples basedon the genotypes of the parents.Calculated probabilities will varydepending on the genotypes of theparents.Analyze and Conclude1. Class averages will vary but willusually be close to 75 percent dim-ples, the result of a cross betweentwo heterozygotes.2. 100 percent because the allele fordimples (D) is a dominant allele.

Probability and Segregation Look again at Figure 11–7. One fourth (1/4) of the F2 plants havetwo alleles for tallness (TT); 2/4, or 1/2, of the F2 plants have oneallele for tallness and one allele for shortness (Tt). Because theallele for tallness is dominant over the allele for shortness, 3/4of the F2 plants should be tall. Overall, there are 3 tall plantsfor every 1 short plant in the F2 generation. Thus, the ratio oftall plants to short plants is 3 : 1. This assumes, of course, thatMendel’s model of segregation is correct.
Did the data from Mendel’s experiments fit his model? Yes.The predicted ratio—3 dominant to 1 recessive—showed upconsistently, indicating that Mendel’s assumptions aboutsegregation had been correct. For each of his seven crosses,about 3/4 of the plants showed the trait controlled by thedominant allele. About 1/4 showed the trait controlled by therecessive allele. Segregation did indeed occur according toMendel’s model.
Probabilities Predict AveragesProbabilities predict the average outcome of a large number ofevents. However, probability cannot predict the precise outcomeof an individual event. If you flip a coin twice, you are likely toget one head and one tail. However, you might also get twoheads or two tails. To be more likely to get the expected 50 : 50ratio, you would have to flip the coin many times.
The same is true of genetics. The larger the number of off-spring, the closer the resulting numbers will get to expectedvalues. If an F1 generation contains just three or four offspring, itmay not match Mendelian predicted ratios. When an F1 genera-tion contains hundreds or thousands of individuals, however, theratios usually come very close to matching expectations.
� Figure 11–8 Although theseplants have different genotypes (TT and Tt), they have the samephenotype (tall). Predicting If youcrossed these two plants, would theiroffspring be tall or short?
TTHomozygous
TtHeterozygous
1. Key Concept How are theprinciples of probability used topredict the outcomes of geneticcrosses?
2. Key Concept How arePunnett squares used?
3. What is probability?4. Define the terms genotype and
phenotype.
5. Critical Thinking ProblemSolving An F1 plant that ishomozygous for shortness iscrossed with a heterozygous F1plant. What is the probability thata seed from the cross will pro-duce a tall plant? Use a Punnettsquare to explain your answerand to compare the probablegenetic variations in the F2plants.
11–2 Section AssessmentDrawing Punnett SquaresImagine that you came upona tall pea plant similar tothose Mendel used in hisexperiments. How could youdetermine the plant’s geno-type with respect to height?Draw two Punnett squares toshow your answer.
Probabilities PredictAveragesBuild Science SkillsDesigning Experiments Give stu-dents a coin or a bag with 2 or 3beads that differ in color. Ask them todesign an experiment to show thatprobabilities cannot predict the out-come of an individual event.
3 ASSESSEvaluate UnderstandingAssign students different traits inpeas. Then, instruct them to set up aPunnett square to show the crossbetween two heterozygous peaplants for their trait. Students shouldgive both the genotypic and pheno-typic ratio of the offspring.
ReteachGive student pairs a list of geneticcrosses between parents of variousgenotypes. Instruct pairs to usePunnett squares to show the possibleoutcomes of the crosses.
Introduction to Genetics 269
Answer to . . .
Figure 11–8 All of the offspringwould be tall.
The genotype of the tall pea plantis determined by allowing theplant to self-pollinate. If the plantis heterozygous, there is a 25 per-cent chance that an offspring willbe short. If the plant is homozy-gous, then all offspring will be tall.Students should draw Punnettsquares to show both possibilities.
If your class subscribes to the iText,use it to review the Key Concepts inSection 11–2.
11–2 Section Assessment1. The way in which the alleles segregate is ran-
dom, and probability allows the calculationof the likelihood that a particular allele com-bination will occur in offspring.
2. To predict and compare the genetic varia-tions that will result from a cross
3. The likelihood that a particular event willoccur
4. Genotype: actual alleles present for a trait, orgenetic makeup; phenotype: visible expres-sion of the alleles, or physical characteristics
5. 50 percent; Punnett square:
t tT Tt Ttt tt tt
11–3 Exploring Mendelian Genetics
Key Concepts • What is the principle of
independent assortment?• What inheritance patterns
exist aside from simpledominance?
Vocabularyindependent assortmentincomplete dominancecodominancemultiple allelespolygenic traits
Reading Strategy: Finding Main Ideas Beforeyou read, draw a line down thecenter of a sheet of paper. Onthe left side, write down themain topics of the section. Onthe right side, note supportingdetails and examples.
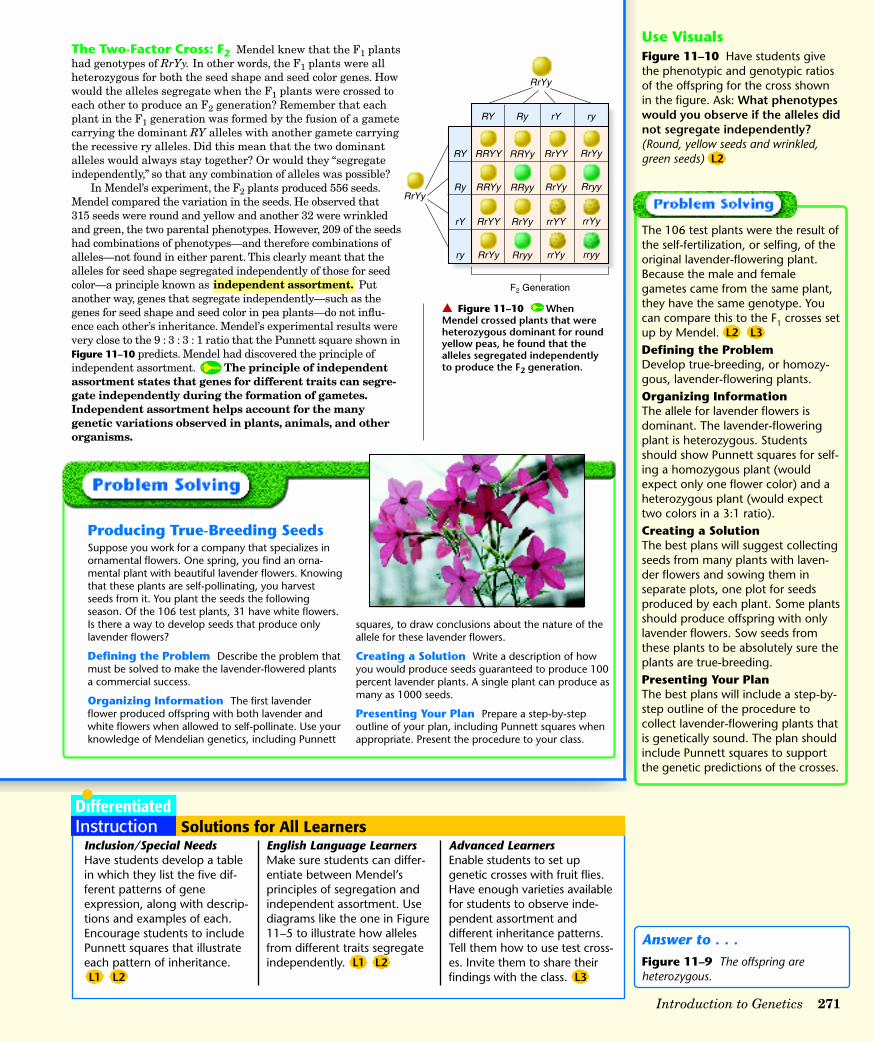
Figure 11–9 Mendel crossed plants that were homozygousdominant for round yellow peas with plants that were homozy-gous recessive for wrinkled green peas. All of the F1 offspringwere heterozygous dominant for round yellow peas.Interpreting Graphics How is the genotype of the offspringdifferent from that of the homozygous dominant parent?
After showing that alleles segregate during the formation ofgametes, Mendel wondered if they did so independently. In
other words, does the segregation of one pair of alleles affect thesegregation of another pair of alleles? For example, does thegene that determines whether a seed is round or wrinkled inshape have anything to do with the gene for seed color? Must around seed also be yellow?
Independent AssortmentTo answer these questions, Mendel performed an experiment tofollow two different genes as they passed from one generation tothe next. Mendel’s experiment is known as a two-factor cross.
The Two-Factor Cross: F1 First, Mendel crossed true-breeding plants that produced only round yellow peas (genotype RRYY) with plants that produced wrinkled greenpeas (genotype rryy). All of the F1 offspring produced roundyellow peas. This shows that the alleles for yellow and roundpeas are dominant over the alleles for green and wrinkled peas.A Punnett square for this cross, shown in Figure 11–9, showsthat the genotype of each of these F1 plants is RrYy.
This cross does not indicate whether genes assort, or segre-gate, independently. However, it provides the hybrid plantsneeded for the next cross—the cross of F1 plants to produce theF2 generation.
RY
RY
RY
RY
RrYy
RrYy
RrYy
RrYy
RrYy
RrYy
RrYy
RrYy
RrYy
RrYy
RrYy
RrYy
RrYy
RrYy
RrYy
RrYy
ry ry ry ry
rryy
RRYY
270 Chapter 11
1 FOCUSObjectives11.3.1 Explain the principle of
independent assortment.11.3.2 Describe the inheritance
patterns that exist aside fromsimple dominance.
11.3.3 Explain how Mendel’s prin-ciples apply to all organisms.
Vocabulary PreviewExplain that the prefix poly- means“more than one.” Ask: What do youthink a polygenic trait is? (A traitcontrolled by more than one gene)
Reading StrategyBefore students read the section, sug-gest that they read the captions andstudy the art and diagrams in eachfigure.
2 INSTRUCT
IndependentAssortmentBuild Science SkillsApplying Concepts Give studentsF1 corn cobs produced in a dihybridcross between homozygous purple,starchy (PPSS) and yellow, sweet par-ents (ppss). Ask: Which traits arecontrolled by dominant alleles?(Purple and starchy) Then, have stu-dents construct a Punnett square toshow all the possible gametes andoffspring from the cross. (Punnettsquares should look similar to the onein Figure 11–9. Possible gametes forthe ppss parent are ps. Those for thePPSS parent are PS. All offspring will beheterozygous, PpSs.)
SECTION RESOURCES
Print:
• Laboratory Manual A, Chapter 11 Lab• Laboratory Manual B, Chapter 11 Lab• Teaching Resources, Section Review 11–3• Reading and Study Workbook A, Section 11–3• Adapted Reading and Study Workbook B,
Section 11–3• Lesson Plans, Section 11–3
Technology:
• iText, Section 11–3• Transparencies Plus, Section 11–3• Lab Simulations CD-ROM, Mendelian
Inheritance
Tim
eSaver
Section 11–3
The Two-Factor Cross: F2 Mendel knew that the F1 plantshad genotypes of RrYy. In other words, the F1 plants were allheterozygous for both the seed shape and seed color genes. Howwould the alleles segregate when the F1 plants were crossed toeach other to produce an F2 generation? Remember that eachplant in the F1 generation was formed by the fusion of a gametecarrying the dominant RY alleles with another gamete carryingthe recessive ry alleles. Did this mean that the two dominantalleles would always stay together? Or would they “segregateindependently,” so that any combination of alleles was possible?
In Mendel’s experiment, the F2 plants produced 556 seeds.Mendel compared the variation in the seeds. He observed that 315 seeds were round and yellow and another 32 were wrinkledand green, the two parental phenotypes. However, 209 of the seedshad combinations of phenotypes—and therefore combinations ofalleles—not found in either parent. This clearly meant that thealleles for seed shape segregated independently of those for seedcolor—a principle known as Putanother way, genes that segregate independently—such as thegenes for seed shape and seed color in pea plants—do not influ-ence each other’s inheritance. Mendel’s experimental results werevery close to the 9 : 3 : 3 : 1 ratio that the Punnett square shown inFigure 11–10 predicts. Mendel had discovered the principle ofindependent assortment. The principle of independentassortment states that genes for different traits can segre-gate independently during the formation of gametes.Independent assortment helps account for the manygenetic variations observed in plants, animals, and otherorganisms.
independent assortment.
Producing True-Breeding SeedsSuppose you work for a company that specializes inornamental flowers. One spring, you find an orna-mental plant with beautiful lavender flowers. Knowingthat these plants are self-pollinating, you harvestseeds from it. You plant the seeds the followingseason. Of the 106 test plants, 31 have white flowers.Is there a way to develop seeds that produce onlylavender flowers?
Defining the Problem Describe the problem thatmust be solved to make the lavender-flowered plantsa commercial success.
Organizing Information The first lavenderflower produced offspring with both lavender andwhite flowers when allowed to self-pollinate. Use yourknowledge of Mendelian genetics, including Punnett
squares, to draw conclusions about the nature of theallele for these lavender flowers.
Creating a Solution Write a description of howyou would produce seeds guaranteed to produce 100percent lavender plants. A single plant can produce asmany as 1000 seeds.
Presenting Your Plan Prepare a step-by-stepoutline of your plan, including Punnett squares whenappropriate. Present the procedure to your class.
� Figure 11–10 WhenMendel crossed plants that wereheterozygous dominant for roundyellow peas, he found that thealleles segregated independentlyto produce the F2 generation.
RY
Ry
rY
ry
RRYY
RRYy
RrYY
RrYy
RRYy
RRyy
RrYy
Rryy
RrYY
RrYy
rrYY
rrYy
RrYy
Rryy
rrYy
rryy
RY Ry rY ry
RrYy
RrYy
F2 Generation
Use VisualsFigure 11–10 Have students givethe phenotypic and genotypic ratiosof the offspring for the cross shownin the figure. Ask: What phenotypeswould you observe if the alleles didnot segregate independently?(Round, yellow seeds and wrinkled,green seeds)
Introduction to Genetics 271
Answer to . . . Figure 11–9 The offspring are heterozygous.
Inclusion/Special NeedsHave students develop a tablein which they list the five dif-ferent patterns of geneexpression, along with descrip-tions and examples of each.Encourage students to includePunnett squares that illustrateeach pattern of inheritance.
English Language LearnersMake sure students can differ-entiate between Mendel’sprinciples of segregation andindependent assortment. Usediagrams like the one in Figure11–5 to illustrate how allelesfrom different traits segregateindependently.
Advanced LearnersEnable students to set upgenetic crosses with fruit flies.Have enough varieties availablefor students to observe inde-pendent assortment anddifferent inheritance patterns.Tell them how to use test cross-es. Invite them to share theirfindings with the class.
The 106 test plants were the result ofthe self-fertilization, or selfing, of theoriginal lavender-flowering plant.Because the male and femalegametes came from the same plant,they have the same genotype. Youcan compare this to the F1 crosses setup by Mendel.Defining the ProblemDevelop true-breeding, or homozy-gous, lavender-flowering plants.Organizing InformationThe allele for lavender flowers isdominant. The lavender-floweringplant is heterozygous. Studentsshould show Punnett squares for self-ing a homozygous plant (wouldexpect only one flower color) and aheterozygous plant (would expecttwo colors in a 3:1 ratio).Creating a SolutionThe best plans will suggest collectingseeds from many plants with laven-der flowers and sowing them inseparate plots, one plot for seedsproduced by each plant. Some plantsshould produce offspring with onlylavender flowers. Sow seeds fromthese plants to be absolutely sure theplants are true-breeding.Presenting Your PlanThe best plans will include a step-by-step outline of the procedure tocollect lavender-flowering plants thatis genetically sound. The plan shouldinclude Punnett squares to supportthe genetic predictions of the crosses.

W RW RW
W RW RW
R R
RR
WW
A Summary of Mendel’s PrinciplesMendel’s principles form the basis of the modern science ofgenetics. These principles can be summarized as follows:• The inheritance of biological characteristics is determined
by individual units known as genes. Genes are passed fromparents to their offspring.
• In cases in which two or more forms (alleles) of the gene fora single trait exist, some forms of the gene may be dominantand others may be recessive.
• In most sexually reproducing organisms, each adult has twocopies of each gene—one from each parent. These genes aresegregated from each other when gametes are formed.
• The alleles for different genes usually segregate independ-ently of one another.
Beyond Dominant and Recessive AllelesDespite the importance of Mendel’s work, there are importantexceptions to most of his principles. For example, not all genesshow simple patterns of dominant and recessive alleles. In mostorganisms, genetics is more complicated, because the majority ofgenes have more than two alleles. In addition, many importanttraits are controlled by more than one gene. Some allelesare neither dominant nor recessive, and many traits arecontrolled by multiple alleles or multiple genes.
Incomplete Dominance A cross between two four o’clock(Mirabilis) plants shows one of these complications. The F1 gener-ation produced by a cross between red-flowered (RR) and white-flowered (WW) plants consists of pink-colored flowers (RW), asshown in Figure 11–11. Which allele is dominant in this case?Neither one. Cases in which one allele is not completely domi-
nant over another are called In incomplete dominance, the heterozygous phenotype issomewhere in between the two homozygous phenotypes.
Codominance A similar situation is in which both alleles contribute to the phenotype. Forexample, in certain varieties of chicken, the allele forblack feathers is codominant with the allele for whitefeathers. Heterozygous chickens have a color describedas “erminette,” speckled with black and white feathers.Unlike the blending of red and white colors in heterozy-gous four o’clocks, black and white colors appear sepa-rately. Many human genes show codominance, too,including one for a protein that controls cholesterollevels in the blood. People with the heterozygous form ofthe gene produce two different forms of the protein, eachwith a different effect on cholesterol levels.
codominance,
incomplete dominance.
� Figure 11–11 Some allelesare neither dominant nor recessive.In four o’clock plants, for example, thealleles for red and white flowers showincomplete dominance. Heterozygous(RW) plants have pink flowers—a mix ofred and white coloring.
For: Links on Mendelian genetics
Visit: www.SciLinks.org
Web Code: cbn-4113
NSTA
272 Chapter 11
A Summary ofMendel’s Principles
Build Science SkillsApplying Concepts Challenge stu-dents to work in pairs to illustrate thesummarized list of Mendel’s princi-ples. For reference, they can studyfigures in this chapter and in Chapter12.
Beyond Dominantand Recessive AllelesUse VisualsFigure 11–11 Ask: What pheno-typic ratio would you expect to seeif two heterozygous plants withpink flowers were crossed? (1 red: 2pink: 1 white) Explain that for allelesthat show incomplete dominance,the alleles work together to producea “dosage effect.” For example, if aplant has one allele for red pigmentand one allele for no pigment (whichproduces white flowers), then onlyhalf as much red pigment is pro-duced, making the flowers pink.
Build Science SkillsUsing Models Challenge studentsto devise a model that shows the dif-ference between incompletedominance and codominance. Oneway to do this is to use paper andcrayons. In incomplete dominance,two colors are blended together toform a new color. In codominance,the two individual colors are still dis-tinctly visible; they are not blendedtogether.
Testing to identify F1 genotypesMendel was very thorough in his methodology,so it really comes as no surprise that he devised amethod to test his hypotheses in various ways.One method he used, which is used frequently bygeneticists today, has come to be known as thetestcross. A testcross is used to identify the geno-type of F1 hybrids. For this cross, F1 hybrids arecrossed back to the parent with the trait con-trolled by the recessive allele. When Mendel used
a testcross for his F1 offspring, he expected toobserve approximately equal numbers of off-spring with the traits controlled by the dominantand recessive alleles. That is what he observed.Today, a testcross is used to determine whetheran individual with the phenotype controlled bythe dominant allele is heterozygous or homozy-gous. If the individual is homozygous, none of theoffspring will have the phenotype controlled bythe recessive allele.
HISTORY OF SCIENCE
11–3 (continued)
NSTA
Download a worksheeton Mendelian genetics for studentsto complete, and find additionalteacher support from NSTASciLinks.

FIGURE 11–12 MULTIPLE ALLELES
Multiple Alleles Many genes have more than two allelesand are therefore said to have This does notmean that an individual can have more than two alleles. It onlymeans that more than two possible alleles exist in a population.One of the best-known examples is coat color in rabbits. Arabbit’s coat color is determined by a single gene that has atleast four different alleles. The four known alleles display apattern of simple dominance that can produce four possible coatcolors, as shown in Figure 11–12. Many other genes have multi-ple alleles, including the human genes for blood type.
Polygenic Traits Many traits are produced by the interac-tion of several genes. Traits controlled by two or more genes aresaid to be which means “having many genes.”For example, at least three genes are involved in making the reddish-brown pigment in the eyes of fruit flies. Differentcombinations of alleles for these genes produce very differenteye colors. Polygenic traits often show a wide range of pheno-types. For example, the wide range of skin color in humanscomes about partly because more than four different genesprobably control this trait.
What are multiple alleles?
polygenic traits,
multiple alleles.
Coat color in rabbits is determined by a single gene that has at least four differ-ent alleles. Different combinations of alleles result in the four colors you see here.Interpreting Graphics What allele combinations can a chinchilla rabbit have?
Full color: CC, Ccch, Cch, or Cc Chinchilla: cchch, cchcch, or cchc
Albino: ccHimalayan: chc or chch
KeyC = full color; dominant
to all other alleles
cch = chinchilla; partialdefect in pigmenta-tion; dominant to ch and c alleles
ch = Himalayan; color in certain parts ofbody; dominant to c allele
c = albino; no color;recessive to all other alleles
For: Links on Punnett squares
Visit: www.SciLinks.orgWeb Code: cbn-4112
NSTA
Address MisconceptionsStudents might try to apply the ideasof simple dominance to other typesof gene expression. Give studentsmany different examples of incom-plete dominance, codominance,multiple alleles, and polygenic traits.Collect pictures for students to com-pare the various phenotypes.
Use VisualsFigure 11–12 Explain that coatcolor in rabbits does show a patternof simple dominance among fouralleles. Have students study thegenotypes of the rabbits in the fig-ure. Challenge them to arrange thealleles for coat color in order fromthe most dominant to the least domi-nant. (C�cch�ch�c) Then, havestudents make up genetic crosses forcoat color in rabbits and exchangethem with partners. Partners shouldsolve the problems using Punnettsquares.
Applying Mendel’sPrinciplesDemonstrationSet up crosses between wild-type fruitflies and fruit flies with vestigial wings.Allow students to observe the parentsof the cross and the F1 offspring. Ask:Which trait is controlled by a domi-nant allele? (Normal wings) Then,have student volunteers diagram aPunnett square on the board to pre-dict the phenotypic ratio of the F2offspring. Count all the F2 progenyfrom the cross and have studentscompare the actual phenotypic ratiowith the predicted ratio.
Introduction to Genetics 273
When I teach introductory genetics, I find thatstudents often lose interest studying only theinheritance of traits in pea plants. To keep themmore interested, I like to relate inheritance totheir world and insert many examples of humantraits. Some human traits that show simple dom-inance include cystic fibrosis (recessive), freckles(dominant), and widow’s peak (dominant).Blood type is controlled by 3 alleles in which
A (IA) and B (IB) are codominant, and both aredominant over O (ii). I devise genetics problemsusing these and other human traits for studentsto practice setting up Punnett squares and iden-tifying genotypes and phenotypes.
—James BoalBiology TeacherNatrona County High SchoolCasper, WY
TEACHER TO TEACHER
NSTA
Download a worksheet on Punnett squares for students tocomplete, and find additionalteacher support from NSTASciLinks.
Answers to . . . Genes that have more
than two alleles
Figure 11–12 cchch, cchcch, or cchc

Applying Mendel’s PrinciplesMendel’s principles don’t apply only to plants. At the beginning ofthe 1900s, the American geneticist Thomas Hunt Morgan decidedto look for a model organism to advance the study of genetics. Hewanted an animal that was small, easy to keep in the laboratory,and able to produce large numbers of offspring in a short period oftime. He decided to work on a tiny insect that kept showing up,uninvited, in his laboratory. The insect was the common fruit fly,Drosophila melanogaster, shown in Figure 11–13.
Morgan grew the flies in small milk bottles stoppered withcotton gauze. Drosophila was an ideal organism for geneticsbecause it could produce plenty of offspring, and it did so quickly.A single pair of flies could produce as many as 100 offspring.Before long, Morgan and other biologists had tested every one ofMendel’s principles and learned that they applied not just to peaplants but to other organisms as well.
Mendel’s principles also apply to humans. The basic principlesof Mendelian genetics can be used to study the inheritance ofhuman traits and to calculate the probability of certain traitsappearing in the next generation. You will learn more abouthuman genetics in Chapter 14.
Genetics and the EnvironmentThe characteristics of any organism, whether bacterium, fruit fly,or human being, are not determined solely by the genes it inherits.Rather, characteristics are determined by interaction betweengenes and the environment. For example, genes may affect asunflower plant’s height and the color of its flowers. However,these same characteristics are also influenced by climate, soilconditions, and the availability of water. Genes provide a plan fordevelopment, but how that plan unfolds also depends on theenvironment.
� Figure 11–13 The commonfruit fly is a popular organism forgenetic research. Inferring Why arefruit flies easier to use for geneticresearch than large animals, such asdogs?
1. Key Concept Explainwhat independent assortmentmeans.
2. Key Concept Describetwo inheritance patterns besidessimple dominance.
3. What is the difference betweenincomplete dominance andcodominance?
4. Why are fruit flies an idealorganism for genetic research?
5. Critical Thinking Comparingand Contrasting A geneticiststudying coat color in animalscrosses a male rabbit having thegenotype CC with a femalehaving genotype Ccch. Thegeneticist then crosses a ccch malewith a Ccc female. In which of thetwo crosses are the offspringmore likely to show greatergenetic variation? Use Punnettsquares to explain your answer.
Problem SolvingConstruct a genetics problemto be given as an assignmentto a classmate. The problemmust test incomplete domi-nance, codominance, multi-ple alleles, or polygenic traits.Your problem must have ananswer key that includes all ofyour work.
11–3 Section Assessment
274 Chapter 11
Genetics and theEnvironmentBuild Science SkillsDesigning Experiments Give stu-dent groups two cuttings from thecoleus plant that you started in pot-ting soil about two weeks before.(The cuttings are genetically identi-cal.) Challenge students to use thesecuttings to design an experimentthat shows how the environmentaffects phenotype. Students mightgrow one of the plants with less day-light, at warmer temperatures, orwith added fertilizer.
3 ASSESSEvaluate UnderstandingPlay a game in which you ask studentteams to solve various problems ingenetics—from identifying the pat-tern of inheritance, such as simpledominance, incomplete dominance,or multiple alleles, to predicting theoutcome of dihybrid crosses.
ReteachStudents can make flashcards foreach of the Vocabulary words.Student pairs can quiz each other onthe meanings of the words.
Answer to . . .
Figure 11–13 They are small, easyto keep in the laboratory, and producelarge numbers of offspring in a shorttime.
11–3 (continued)
Students’ problems should followthe rules of genetics and includecorrect and complete answers.Have pairs of students exchangeand try to solve each other’s problems.
If your class subscribes to the iText,use it to review the Key Concepts inSection 11–3.
11–3 Section Assessment1. During gamete formation, pairs of alleles for
different traits segregate, or separate, inde-pendently of each other.
2. Answers include descriptions for any two:incomplete dominance, codominance, mul-tiple alleles, or polygenic traits.
3. In incomplete dominance, two alleles com-bine their effects to produce a singlein-between phenotype, such as pink flowersfrom red and white parents. In codominance,
each allele is expressed separately, as whenerminette chickens have both black andwhite feathers.
4. They are small, easy to keep in the labora-tory, and produce large numbers of off-spring in a short period of time.
5. The offspring in the second cross will showgreater variation because 100 percent of theoffspring from the first cross (CC x Ccch) willbe full color.

11–4 Meiosis
Gregor Mendel did not know where the genes he had discov-ered were located in the cell. Fortunately, his predictions of
how genes should behave were so specific that it was not longbefore biologists were certain they had found them. Genes arelocated on chromosomes in the cell nucleus.
Mendel’s principles of genetics require at least two things.First, each organism must inherit a single copy of every genefrom each of its “parents.” Second, when an organism producesits own gametes, those two sets of genes must be separated fromeach other so that each gamete contains just one set of genes.This means that when gametes are formed, there must be aprocess that separates the two sets of genes so that each gameteends up with just one set. Although Mendel didn’t know it,gametes are formed through exactly such a process.
Chromosome NumberAs an example of how this process works, let’s consider the fruitfly, Drosophila. A body cell in an adult fruit fly has 8 chromo-somes, as shown in Figure 11–14. Four of the chromosomes camefrom the fruit fly’s male parent, and 4 came from its femaleparent. These two sets of chromosomes are (hoh-MAHL-uh-guhs), meaning that each of the 4 chromosomesthat came from the male parent has a corresponding chromo-some from the female parent.
A cell that contains both sets of homologous chromosomes is said to be which means “two sets.” The number ofchromosomes in a diploid cell is sometimes represented by thesymbol 2N. Thus for Drosophila, the diploid number is 8,which can be written 2N = 8. Diploid cells contain two com-plete sets of chromosomes and two complete sets of genes.This agrees with Mendel’s idea that the cells of an adultorganism contain two copies of each gene.
By contrast, the gametes of sexually reproducing organisms,including fruit flies and peas, contain only a single set of chromo-somes, and therefore only a single set of genes. Such cells are saidto be which means “one set.” For Drosophila, this canbe written as N = 4, meaning that the haploid number is 4.
Phases of MeiosisHow are haploid (N) gamete cells produced from diploid (2N)cells? That’s where (my-OH-sis) comes in. Meiosis
is a process of reduction division in which the number of
chromosomes per cell is cut in half through the separa-
tion of homologous chromosomes in a diploid cell.
meiosis
haploid,
diploid,
homologous
Key Concepts• What happens during the
process of meiosis?• How is meiosis different from
mitosis?
Vocabularyhomologousdiploidhaploidmeiosistetradcrossing-over
Reading Strategy: Using Visuals Before youread, preview Figure 11–15. Asyou read, note what happens ateach stage of meiosis.
� Figure 11–14 These chromosomesare from a fruit fly. Each of the fruitfly’s body cells has 8 chromosomes.
1 FOCUSObjectives11.4.1 Contrast the chromosome
number of body cells andgametes.
11.4.2 Summarize the events ofmeiosis.
11.4.3 Contrast meiosis and mitosis.
Vocabulary PreviewExplain that the prefix hapl- comesfrom the Greek word haplous, whichmeans “single.” The word haploidrefers to cells that have a single set ofchromosomes. Ask: If the prefixdiplo- means “double,” what doesthe word diploid refer to? (A cellwith two sets of chromosomes)
Reading StrategyBefore students read the section,encourage them to preview theVocabulary words by finding thehighlighted, boldface terms in thesection and listing them. Tell stu-dents to leave space on their lists tomake notes as they read.
2 INSTRUCT
ChromosomeNumberUse VisualsFigure 11–14 Point out that thehomologous chromosomes in theillustration are the same color. Makesure students understand that onecomplete set of chromosomes—onegreen, one red, one yellow, and onepurple—came from each parent. Ask:What would happen if the gameteswere 2N? (Offspring would have 4Nchromosomes.)
Introduction to Genetics 275
SECTION RESOURCES
Print:
• Teaching Resources, Section Review 11–4,Chapter 11 Exploration
• Reading and Study Workbook A, Section 11–4• Adapted Reading and Study Workbook B,
Section 11–4• Lesson Plans, Section 11–4
Technology:
• iText, Section 11–4• Animated Biological Concepts Videotape
Library, 17, 18, 22• Transparencies Plus, Section 11–4• Lab Simulations CD-ROM, MeiosisTi
m
eSaver
Section 11–4

Each chromosome pairs with its corresponding homologous chromo-some to form a tetrad.
Prophase I
Spindle fibers attach to the chromosomes.
Metaphase I
The fibers pull the homologous chromo-somes toward oppo-site ends of the cell.
Anaphase I
Nuclear membranes form. The cell sepa-rates into two cells.
Telophase I
and CytokinesisCells undergo a round of DNA replication, forming duplicate chromosomes.
Interphase I
MEIOSIS I
Figure 11–15 During meiosis, the number of chromosomes per cell iscut in half through the separation of the homologous chromosomes. Theresult of meiosis is 4 haploid cells that are genetically different from oneanother and from the original cell.
Meiosis usually involves two distinct divisions, called meio-sis I and meiosis II. By the end of meiosis II, the diploid cell thatentered meiosis has become 4 haploid cells. Figure 11–15 showsmeiosis in an organism that has a diploid number of 4 (2N = 4).
Meiosis I Prior to meiosis I, each chromosome is replicated.The cells then begin to divide in a way that looks similar tomitosis. In mitosis, the 4 chromosomes line up individually inthe center of the cell. The 2 chromatids that make up eachchromosome then separate from each other.
In prophase of meiosis I, however, each chromosome pairs withits corresponding homologous chromosome to form a structurecalled a There are 4 chromatids in a tetrad. This pairingof homologous chromosomes is the key to understanding meiosis.
As homologous chromosomes pair up and form tetrads inmeiosis I, they exchange portions of their chromatids in a process called Crossing-over, shown in Figure 11–16, results in the exchange of alleles between homolo-gous chromosomes and produces new combinations of alleles.
What happens next? The homologous chromosomes separate,and two new cells are formed. Although each cell now has 4chromatids (as it would after mitosis), something is different.
crossing-over.
tetrad.
MEIOSIS
For: Meiosis activityVisit: PHSchool.comWeb Code: cbp-4114
For: Links on meiosisVisit: www.SciLinks.orgWeb Code: cbn-4114
NSTA
Phases of MeiosisUse VisualsFigure 11–15 Have volunteers usetheir own words to describe what isoccurring during each step of meio-sis. Ask: Which cell is diploid? (Theoriginal cell) Which cell is haploid?(The daughter cells of meiosis I throughthe daughter cells of meiosis II) Discussthe difference between the divisionsin meiosis I and meiosis II. Make surestudents understand that homolo-gous chromosomes separate duringmeiosis I and the centromeres andsister chromatids separate duringmeiosis II.
Address MisconceptionsSome students might confuse mitosisand meiosis. The most difficult pointto understand is that the daughtercells produced after meiosis I arealready haploid; they contain onlyone set of chromosomes. Have stu-dents compare diagrams of mitosisand meiosis. Point out that DNAreplication occurs in prophase I; how-ever, the duplicate chromosomes(sister chromatids) do not separateuntil meiosis II. Also point out thatthe division in meiosis II is like that ofmitosis—centromeres divide to sepa-rate the sister chromatids. Emphasizethat meiosis occurs only in cells thatform gametes; it does not occur inbody cells.
11–4 (continued)
For: Meiosis activityVisit: PHSchool.comWeb Code: cbe-4114Students interact with the art ofmeiosis online.
Inclusion/Special NeedsReview the location of chromo-somes in the cell. Diagram apair of homologous chromo-somes in a cell. Then, workbackward to show how onechromosome came from themother and one from thefather. Point out the location ofa gene. Show how it can havetwo alleles.
Less Proficient ReadersHave students develop a flow-chart that shows the phases ofmeiosis. Students can refer toFigure 11–15 but should drawtheir own diagrams and usetheir own words to describewhat is occurring during eachstep.
Advanced LearnersChallenge students to write astory about a chromosomegoing through meiosis for thefirst time. Encourage students touse illustrations and to be cre-ative, but they must giveaccurate information about themovement of chromosomes.
276 Chapter 11

MEIOSIS II
Meiosis I results in two haploid (N) daughter cells, each with half the number of chromosomes as the original cell.
Prophase II
The chromosomes line up in a similar way to the metaphase stage of mitosis.
Metaphase II
The sister chromatids separate and move toward opposite ends of the cell.
Anaphase II
Meiosis II results in four haploid (N) daughter cells.
Telophase II
and Cytokinesis
A
B
C
D
E
A
B
C
D
E
a
bc
d
e
a
bc
d
e
A
B
C
D
E
A
Bc
d
e
a
b
C
D
E
a
bc
d
e
A
B
C
D
E
AB
C
D
E
ab
cd
e
a
bc
d
e
2
3
1Because each pair of homologous chromosomes was separated,neither of the daughter cells has the two complete sets of chromo-somes that it would have in a diploid cell. Those two sets have beenshuffled and sorted almost like a deck of cards. The two cellsproduced by meiosis I have sets of chromosomes and alleles thatare different from each other and from the diploid cell that enteredmeiosis I.
Meiosis II The two cells produced by meiosis I now enter asecond meiotic division. Unlike the first division, neither cell goesthrough a round of chromosome replication before enteringmeiosis II. Each of the cell’s chromosomes has 2 chromatids.During metaphase II of meiosis, chromosomes line up in thecenter of each cell. In anaphase II, the paired chromatids sepa-rate. In this example, each of the four daughter cells produced inmeiosis II receives 2 chromatids. Those four daughter cells nowcontain the haploid number (N)—just 2 chromosomes each.
� Figure 11–16 Crossing-over occurs during meiosis. (1) Homologouschromosomes form a tetrad. (2) Chromatids cross over one another. (3) The crossed sections of the chromatids are exchanged. InterpretingGraphics How does crossing-over affect the alleles on a chromatid?
Build Science SkillsApplying Concepts Challenge stu-dents to draw diagrams of meiosisthat show how seed color and seedshape in Mendel’s peas are traitswhose genes assort independently.Make sure students realize that thegenes for seed shape and seed colorare on different chromosomes. Ask: Ifthe genes for seed shape and seedcolor had not assorted independ-ently, what could you assumeabout the genes for these traits?(The genes for these traits are locatedon the same chromosome.)
DemonstrationUse pipe cleaners of different colorsto show how a tetrad forms from twohomologous chromosomes. Connectsister chromatids together by thread-ing two pipe cleaners through abead. Ask: What structure does thebead represent? (Centromere)Overlap the pipe cleaners to simulatecrossing-over. Then, cut and tape thepipe cleaners to simulate the break-ing and recombination ofchromosomes to form the geneticallydifferent chromatids. Discuss the sig-nificance of crossing-over. Elicit fromstudents that crossing-over increasesgenetic diversity. Ask: Will crossing-over cause a different phenotypein the offspring of true-breedingparents? (No, the homologous chro-mosomes are homozygous for theparticular trait because they have thesame allele for the gene that encodesthe trait. Crossing-over will cause por-tions of the chromosomes to be mixed,but if the alleles are identical, crossing-over is not detected.)
Introduction to Genetics 277
I find that mitosis and meiosis are difficult for students to understand, so I use an overheadprojector and pipe cleaners to model bothprocesses. I demonstrate that chromosomesoccur in pairs and show how chromosomes areinvolved in genetic continuity and variety. After I finish, I have students actively participate inusing the overhead projector and pipe cleaners
to model the processes for their peers. Thisteaching strategy facilitates their understandingof these challenging topics.
—Tracy SwedlundBiology TeacherMedford Area Senior HighMedford, WI
TEACHER TO TEACHER
Answers to . . . Meiosis is a process of
reduction division in which the numberof chromosomes per cell is cut in half.
Figure 11–16 The alleles can beexchanged between chromatids ofhomologous chromosomes to producenew combinations of alleles.
NSTA
Download a worksheet on meiosis for students to com-plete, and find additional teachersupport from NSTA SciLinks.
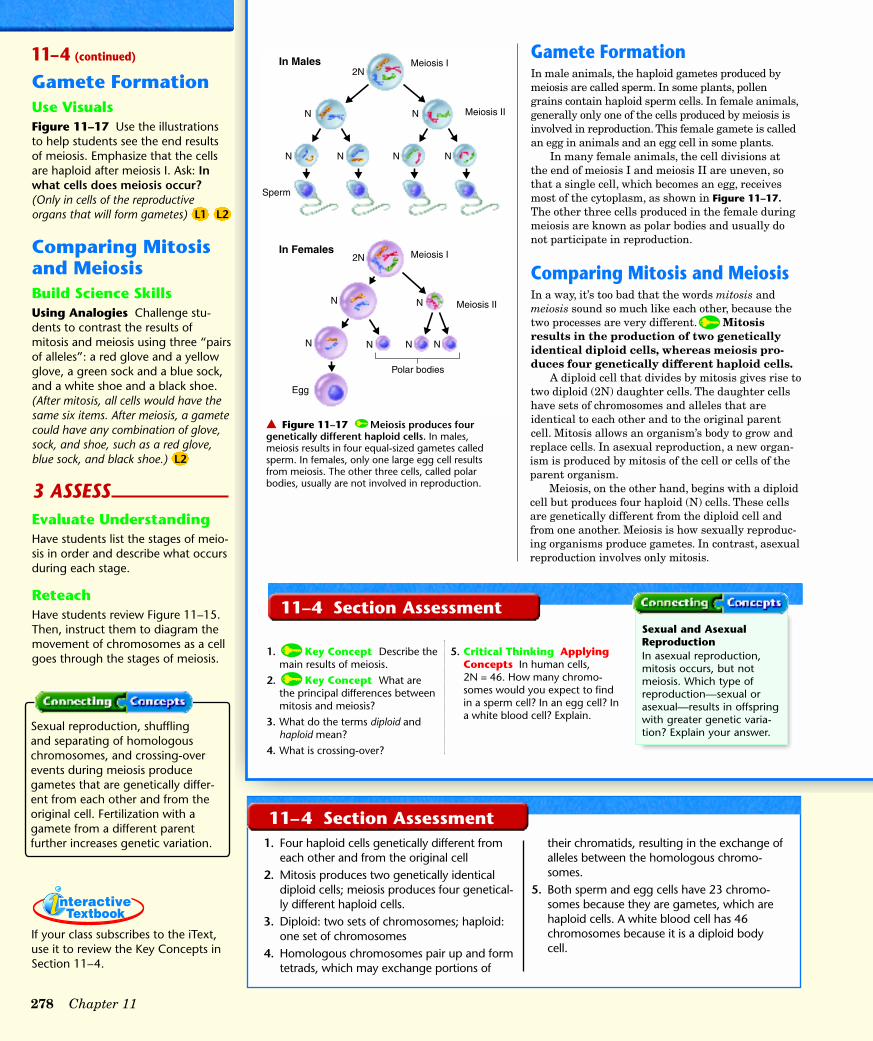
Gamete FormationIn male animals, the haploid gametes produced bymeiosis are called sperm. In some plants, pollen grains contain haploid sperm cells. In female animals,generally only one of the cells produced by meiosis isinvolved in reproduction. This female gamete is calledan egg in animals and an egg cell in some plants.
In many female animals, the cell divisions at the end of meiosis I and meiosis II are uneven, sothat a single cell, which becomes an egg, receivesmost of the cytoplasm, as shown in Figure 11–17.The other three cells produced in the female duringmeiosis are known as polar bodies and usually donot participate in reproduction.
Comparing Mitosis and MeiosisIn a way, it’s too bad that the words mitosis andmeiosis sound so much like each other, because thetwo processes are very different. Mitosis
results in the production of two genetically
identical diploid cells, whereas meiosis pro-
duces four genetically different haploid cells.
A diploid cell that divides by mitosis gives rise totwo diploid (2N) daughter cells. The daughter cellshave sets of chromosomes and alleles that areidentical to each other and to the original parentcell. Mitosis allows an organism’s body to grow andreplace cells. In asexual reproduction, a new organ-ism is produced by mitosis of the cell or cells of theparent organism.
Meiosis, on the other hand, begins with a diploidcell but produces four haploid (N) cells. These cellsare genetically different from the diploid cell andfrom one another. Meiosis is how sexually reproduc-ing organisms produce gametes. In contrast, asexualreproduction involves only mitosis.
Meiosis I
Meiosis I
Meiosis II
Meiosis II
Polar bodies
Egg
N
2N
N N
Sperm
N N N N
2N
N N
In Males
In Females
N N N
� Figure 11–17 Meiosis produces fourgenetically different haploid cells. In males,meiosis results in four equal-sized gametes calledsperm. In females, only one large egg cell resultsfrom meiosis. The other three cells, called polarbodies, usually are not involved in reproduction.
1. Key Concept Describe themain results of meiosis.
2. Key Concept What arethe principal differences betweenmitosis and meiosis?
3. What do the terms diploid andhaploid mean?
4. What is crossing-over?
5. Critical Thinking ApplyingConcepts In human cells, 2N = 46. How many chromo-somes would you expect to findin a sperm cell? In an egg cell? Ina white blood cell? Explain.
Sexual and AsexualReproductionIn asexual reproduction,mitosis occurs, but notmeiosis. Which type ofreproduction—sexual orasexual—results in offspringwith greater genetic varia-tion? Explain your answer.
11–4 Section Assessment
278 Chapter 11
Gamete FormationUse VisualsFigure 11–17 Use the illustrationsto help students see the end resultsof meiosis. Emphasize that the cellsare haploid after meiosis I. Ask: Inwhat cells does meiosis occur?(Only in cells of the reproductiveorgans that will form gametes)
Comparing Mitosisand MeiosisBuild Science SkillsUsing Analogies Challenge stu-dents to contrast the results ofmitosis and meiosis using three “pairsof alleles”: a red glove and a yellowglove, a green sock and a blue sock,and a white shoe and a black shoe.(After mitosis, all cells would have thesame six items. After meiosis, a gametecould have any combination of glove,sock, and shoe, such as a red glove,blue sock, and black shoe.)
3 ASSESSEvaluate UnderstandingHave students list the stages of meio-sis in order and describe what occursduring each stage.
ReteachHave students review Figure 11–15.Then, instruct them to diagram themovement of chromosomes as a cellgoes through the stages of meiosis.
11–4 (continued)
11–4 Section Assessment1. Four haploid cells genetically different from
each other and from the original cell2. Mitosis produces two genetically identical
diploid cells; meiosis produces four genetical-ly different haploid cells.
3. Diploid: two sets of chromosomes; haploid:one set of chromosomes
4. Homologous chromosomes pair up and formtetrads, which may exchange portions of
their chromatids, resulting in the exchange ofalleles between the homologous chromo-somes.
5. Both sperm and egg cells have 23 chromo-somes because they are gametes, which arehaploid cells. A white blood cell has 46 chromosomes because it is a diploid bodycell.
Sexual reproduction, shuffling and separating of homologouschromosomes, and crossing-overevents during meiosis producegametes that are genetically differ-ent from each other and from theoriginal cell. Fertilization with agamete from a different parentfurther increases genetic variation.
If your class subscribes to the iText,use it to review the Key Concepts inSection 11–4.

11–5 Linkage and Gene Maps
If you thought carefully about Mendel’s principle of independ-ent assortment as you analyzed meiosis, one question might
have been bothering you. It’s easy to see how genes located ondifferent chromosomes assort independently, but what aboutgenes located on the same chromosome? Wouldn’t they generallybe inherited together?
Gene LinkageThe answer to these questions, as Thomas Hunt Morgan firstrealized in 1910, is yes. Morgan’s research on fruit flies led himto the principle of linkage. After identifying more than 50Drosophila genes, Morgan discovered that many of themappeared to be “linked” together in ways that, at first glance,seemed to violate the principle of independent assortment. Forexample, a fly with reddish-orange eyes and miniature wings,like the one shown in Figure 11–18, was used in a series ofcrosses. The results showed that the genes for those traits werealmost always inherited together and only rarely became sepa-rated from each other.
Morgan and his associates observed so many genes thatwere inherited together that before long they could group all ofthe fly’s genes into four linkage groups. The linkage groupsassorted independently, but all of the genes in one group wereinherited together. Drosophila has four linkage groups. It alsohas four pairs of chromosomes, which led to two remarkableconclusions. First, each chromosome is actually a group oflinked genes. Second, Mendel’s principle of independent assort-ment still holds true. It is the chromosomes, however,
that assort independently, not individual genes.
How did Mendel manage to miss gene linkage? By luck, orby design, six of the seven genes he studied are on differentchromosomes. The two genes that are found on the same chro-mosome are so far apart that they also assort independently.
Key Concept• What structures actually assort
independently?
Vocabularygene map
Reading Strategy: Predicting Before you read,preview Figure 11–19. Predicthow a diagram like this one canbe used to determine how likelygenes are to assort independ-ently. As you read, note whetheror not your prediction wascorrect.
� Figure 11–18 The genes for thisfruit fly’s reddish-orange eyes andminiature wings are almost alwaysinherited together. The reason forthis is that the genes are closetogether on a single chromosome.
It is the chromosomes thatassort independently, not individ-ual genes.
d G
Gene Maps If two genes are found on the same chromosome, doesthis mean that they are linked forever? Not at all.Crossing-over during meiosis sometimes separatesgenes that had been on the same chromosomeonto homologous chromosomes. Crossover eventsoccasionally separate and exchange linkedgenes and produce new combinations of alleles.This is important because it helps to generategenetic diversity.
1 FOCUSObjectives11.5.1 Identify the structures
that actually assort independently.
11.5.2 Explain how gene maps areproduced.
Vocabulary PreviewHave student volunteers describewhat a map is. Elicit the fact thatmaps show the locations of placesand things. Ask: What do you thinka gene map is? (It shows the loca-tions of genes on a chromosome.)
Reading StrategyAs students read, encourage them towrite down the main ideas that leadthem to determine whether or nottheir prediction was correct.
2 INSTRUCT
Gene LinkageBuild Science SkillsUsing Models Students can con-struct a model of a chromosome withbeads threaded on a pipe cleaner. Thebeads represent genes, and the pipecleaner represents the chromosome.Challenge students to demonstratewhy linked genes do not usually assortindependently. Ask: Could there beexceptions to this? (Yes, if crossing-over occurs.) How could crossing-over affect the linked genes of afruit fly? (Alleles could be exchangedbetween a maternal chromatid and apaternal chromatid.)
Gene MapsUse VisualsFigure 11–19 As students study thegene map, ask: Would you expectmore crossing-over events to occurbetween star eye and speck wingor between star eye and blackbody? Explain. (Star eye and speckwing; because these genes are locatedfarther apart, it is more likely that acrossing-over event will occur between
(continued)
Introduction to Genetics 279
SECTION RESOURCES
Print:
• Teaching Resources, Section Review 11–5• Reading and Study Workbook A, Section 11–5• Adapted Reading and Study Workbook B,
Section 11–5• Biotechnology Manual, Lab 2• Lesson Plans, Section 11–5
Technology:
• iText, Section 11–5• Transparencies Plus, Section 11–5
Tim
eSaver
Section 11–5

In 1911, a Columbia University student was working parttime in Morgan’s lab. This student, Alfred Sturtevant, hypothe-sized that the rate at which crossing-over separated linked genescould be the key to an important discovery. Sturtevant reasonedthat the farther apart two genes were, the more likely they wereto be separated by a crossover in meiosis. The rate at whichlinked genes were separated and recombined could then be used to produce a “map” of distances between genes. Sturtevantgathered up several notebooks of lab data and took them back tohis room. The next morning, he presented Morgan with a
showing the relative locations of each known gene on one of theDrosophila chromosomes, as shown in Figure 11–19.Sturtevant’s method of using recombination rates, which meas-ure the frequencies of crossing-over between genes, has beenused to construct genetic maps, including maps of the humangenome, ever since.
map
gene
� Figure 11–19 This gene mapshows the location of a variety ofgenes on chromosome 2 of the fruitfly. The genes are named after theproblems abnormal alleles cause, notthe normal structure. InterpretingGraphics Where on the chromosomeis the “purple eye” gene located?
0.0 Aristaless (no bristles on antenna) 1.3 Star eye 13.0 Dumpy wing 31.0 Dachs (short legs)
48.5 Black body 51.0 Reduced bristles
54.5 Purple eye 55.0 Light eye
67.0 Vestigial (small) wing 75.5 Curved wing
0
10
20
30
40
50
60
70
80
90
100
110
99.2 Arc (bent wings) 104.5 Brown eye 107.0 Speck wing
Chromosome 2Exact location on chromosome
1. Key Concept How doesthe principle of independentassortment apply to chromo-somes?
2. What are gene maps, and howare they produced?
3. How does crossing-over makegene mapping possible?
4. Critical Thinking InferringIf two genes are on the samechromosome but usually assortindependently, what does thattell you about how close togetherthey are?
Cause-Effect ParagraphIn your own words, explainwhy the alleles for reddish-orange eyes and miniaturewings in Drosophila are usually inherited together.Include the idea of gene linkage. Hint: To organizeyour ideas, draw a cause-effect diagram that showswhat happens to the two alleles during meiosis.
11–5 Section Assessment
280 Chapter 11
them.) Explain that recombinationrates are calculated by determiningthe percentage of recombinants pro-duced in a cross. Recombinantoffspring have a phenotype that isdifferent from either parent. Forexample, in a cross between ahomozygous male with a black body(bb) and vestigial wings (vv) and het-erozygous female (BbVv) with abrown body and normal wings, mostof the F2 offspring will look like eitherparent. However some of the off-spring, about 20%, will have either ablack body and normal wings or abrown body and vestigial wings.
3 ASSESSEvaluate UnderstandingDraw a hypothetical gene map on theboard. Have students tell which geneswould have high frequencies of crossing-over and which would not.
ReteachHave students diagram a crossing-over event to show how genes thatare located close together have alower frequency of recombinationthan genes that are located far apart.
Answer to . . . Figure 11–19 The “purple eye” geneis located at 54.5.
11–5 (continued)
If your class subscribes to the iText,use it to review the Key Concepts inSection 11–5.
Paragraphs should explain that ifthe genes are usually inheritedtogether, they are located neareach other on the same chromo-some. If they were far apart,crossing-over events would makethem appear to be located on dif-ferent linkage groups.
11–5 Section Assessment1. It is the chromosomes that assort independ-
ently, not individual genes.2. A gene map shows the relative locations of
genes on a chromosome. The frequency ofcrossing-over between genes is used to pro-duce a map of distances between genes.
3. The farther apart two genes are, the morelikely they are to be separated during acrossover in meiosis. Therefore, the frequencyof crossing-over is equal to the distancebetween two genes.
4. The two genes are located very far apartfrom each other.