Especificacion Tecnica Transformadores de Corriente Subestaciones 115 kV PDVSA

CHASE BENTON – TEAM LEADERSENKO DIZDAREVIC – COMMUNICATION LEADERARIF IBRAHIM – WEBMASTER MAKOKO MUKUMBILWA – KEY CONCEPT HOLDER
SPONSOR: BLACK&VEATCH – ADAM LITERSKI, RAHUL RAMANANADVISOR: DR. VENKATARAMANA AJJARAPU
115 KV/34.5KV SOLAR PLANT/SUBSTATION

• Project Overview (Scope)
• Deliverables• Specification(Parameters)
• Solar Power Plant Design• Substation Design
• Simulations
AGENDA

• Chase Benton• From San Diego, California• Focus in power systems, graduating in May of 2016
• Senko Dizdarevic• From Johnston, Iowa• Focus in power systems, graduating in August of 2016
• Arif Ibrahim• From Glen Allen, Virginia • Focus in power/control systems, graduating in May of 2016
• Makoko Mukumbilwa• From Iowa City, Iowa• Focus in power/control systems, graduating in May of 2016
BACKGROUND

• Plant Location• Iowa• Iowa energy center – solar calculator tools
• 60 MW Solar Power Plant • Plant/component sizing• Plant layout• HelioScope Simulation & PVWatts Calculator
• Attached 115 kV/34.5 kV Substation• Substation one-line drawings• Substation three-line drawings
PROJECT OVERVIEW

• Solar power plant layout and conductor sizing• Plant and substation component connection
• Substation one-line drawings/three-line drawings• Drawing list • Production simulation data
• Engineering man hour budget and schedule
DELIVERABLES

• Location: Iowa
• Fixed Rack 325 W Hanwha Q Cells solar modules• 1670 kW Eaton Xpert inverter
• 1500 VDC string voltage
• ≈1.30 Inverter Load Ratio (ILR)
• Substation specification document• Arcadia single line diagram
SOLAR PLANT REQUIRED INPUT PARAMETERS
SUBSTATION REQUIRED INPUT PARAMETERS

• Using the Iowa energy center solar calculator tool
• Area most suitable: Southwest Iowa*
• But we are using Ames/Boone area due lack of temperature data in SW Iowa
SOLAR POWER PLANT LOCATION

ARRAY PARAMETER TOOL
String Size CB capacity
Min Temp -26 C Module width 3.28 ft Module/string Isc (series) 9.44 Amodule height 6.54 ft Isc continous current multiplier 1.25 see (a)
Voc 46.43 V Nom Isc 11.8 ARef temp 25 C Rack width 28 modules Isc irradiance correction 1.25 see (b)
Rack height 2 modules Max Isc string 14.75 ATemp Coeff of Voc -0.0029 per deg C Max Isc rack, at CB 29.5 ATemp delta -51 Rack width 91.84 ft Allowed current CB 400 Atemp correction 1.15 Rack height 13.08 ft Max current per CB 354 AVoc corrected 53.297 Strings per CB 27.118644
Frame width 1.38 in Number of CB per array 11String voltage/CB in 1500 V Actual strings per CB 24 ****String size 28.14417string size ( series ) 28 modulesString voltage calcul 1492.3 V
Electrical Rack Size

ARRAY PARAMETER TOOLArray Design Array Size Plant Totals
Racks per row 6 Tilt 15 Degrees Array Blocks 36Azimuth 180 Degrees see (d)
Rows per block 20 Rack height proj 12.63431 ft Number of CBs 396
Racks removed 2 Row spac 12 ft Inverters 36
Total Racks 118 Pitch 24.63431 ft Modules/Panels 237888
Total modules in Array 6608 Array height 492.6862 ft Total Strings 236Total Racks 472
Module DC capacity 325 W Array width 551.04 ft AC Plant Output 59.976 MW ACDC Array Output 77.314 MW DC
DC capacity 2147.6 kW Access road width 16 ftArray Size with access road & spacing: PV Plant Height 3132 ft ***
Inverter capacity 1666 kW Array height 508.6862 ft ** PV Plant Width 3386 ft ***Inverter S capcity 1831 kVA Array width 551.04 ftILR ->Inv in/Inv out 1.289076 Array Area 280306.4 ft^2 Solar Plant Area 10605348.8 ft^2 ***
26041.32 m^2 0.380 mi^2CB's per Array 11 Inverter skid 22 x 8.5ft 243.5 acres
Inverter skid area 187 ft^2 985269.1 m^2Power per CB 195.2364 kW Area of components 141936.5 ft^2
Power per Rack 18.2 kW Ground Coverage Ratio (GCR) 0.506362 see( c)

• 36 total arrays• Components – per array
• 118 racks per inverter• 11 combiners per inverter• 12 racks per combiner*• 2 strings per rack• 28 modules per string• 6608 modules per array
• Spacing – per array• 12 ft between racks• 16 ft inverter access road
in the middle
SOLAR POWER PLANT DESIGN – ONE ARRAY

DETAILED SOLAR ARRAY

• Irradiance correction factor of 1.25 applied• Referenced NEC 690(B) continuous current of 1.25
• Used NEC 310 guidelines to size conductors for solar power plant
• Referenced NEC 310 Table 300.50 for minimum burial depth requirements
• Referenced Table 310.15(B)(16) and Table 310.15(B)(17)
SOLAR ARRAY CONDUCTOR SIZING
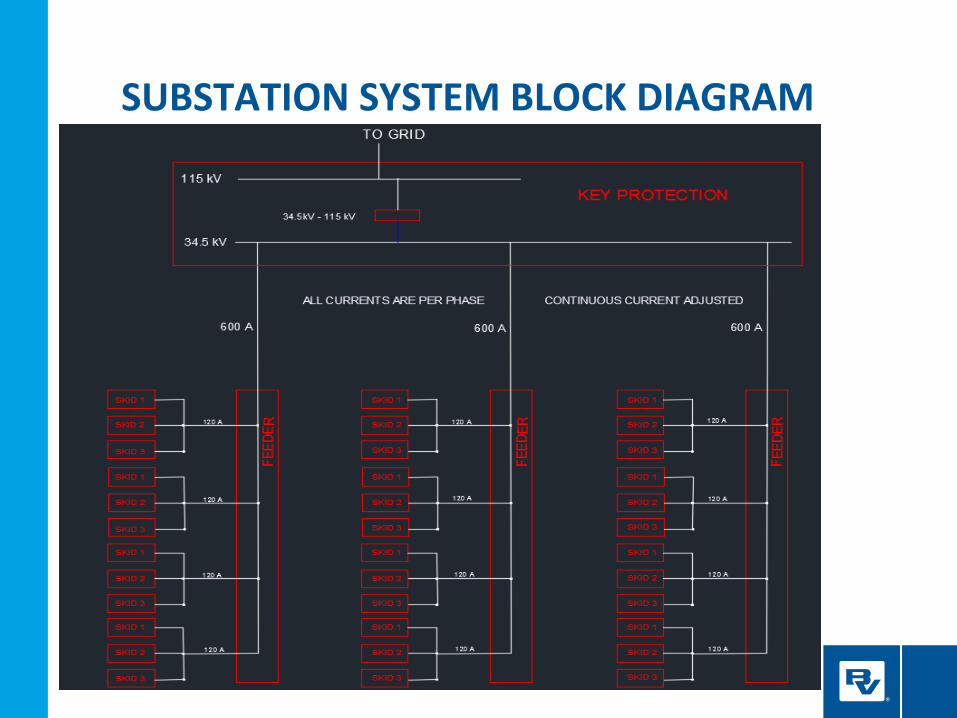
SUBSTATION SYSTEM BLOCK DIAGRAM

COLLECTOR

FEEDER

KEY PROTECTION

• 3 Phase AC Schematics
• DC Schematics [Air-Breaker Bypass Switches (ABS), SEL-451 (Primary Relay, SEL-351 (Feeder/Backup Relay)]
• Communication (RTU, Router, RLH Card and Ethernet Switches)
• AC and DC Load Centers• Panel Elevations
SUBSTATION 3 LINE DRAWINGS

AC THREE LINE DRAWING

PRIMARY RELAY DC DRAWINGS

COMMUNICATION

AC LOAD CENTER

PANEL ELEVATION

SOLAR POWER PLANT LAYOUT: 36 ARRAYS60 MW

ANNUAL SOLAR RADIATION

EXPECTED PRODUCTION
HelioScope Simulation: 99.73 million kWh/yearComparison: Spain‘s Olmedilla PV Park (60MW): 87.5 million kWh/year

ESTIMATED SYSTEM LOSSES DC power lossesTotal 17.9%
Helioscope Simulation

MAN HOUR BUDGET115 kV / 34.5 kV Solar Power Plant / Substation BLACK & VEATCH
Start WeekBreak Projected Overrun Billable Hours
Week 1 2 3 4 5 6 7 8 9 10 11 12 13 14 15 16Aug Sep Sep Sep Sep Oct Oct Oct Oct Nov Nov Nov Nov Nov Dec Dec31 7 14 21 28 5 12 19 26 2 9 16 23 30 7 14 Tasks/Assignements
Meetings-client & advisorsAssign tasks/ begin research
5 Team roles/advisors meetings1 Discuss project scope with client
0 Solar plant size determination
2 Project Plan V1Design document V1Solar array parameters
L Solar array layout
L Solar plant conductors
A Substation one-line drawings
F Substation three-line drawingsProject Plan V2Design Document V2Presentation slides and rehearsalFaculty presentationFinalize deliverables
SUM
Hours Budget 5.0 10.0 10.0 10.0 20.0 20.0 20.0 30.0 30.0 15.0 15.0 30.0 0.0 40.0 10.0 2.0 267.0
Hours Actual 4.0 10.0 8.5 16.5 25.0 16.5 44.0 37.0 24.0 16.0 18.0 31.5 0.0 59.0 29.5 1.0 340.5
% of Budget 80 100 85 165 125 83 220 123 80 107 120 105 0 148 3 1 127.5
Start WeekBreak Projected Overrun Billable Hours
Week 1 2 3 4 5 6 7 8 9 10 11 12 13 14 15 16Start Date Jan Jan Jan Feb Feb Feb Feb Feb Mar Mar Mar Mar Apr Apr Apr Apr
11 18 25 1 8 15 22 29 7 14 21 28 4 11 18 25 Tasks/AssignementsMeetings-client & advisors
6 Fall 2015 review
1 3-line ac drawings
0 3-line 89 drawings
2 3-line bank drawings3-line bu drawing3-line comm drawings
G 3-line dc drawings/ethernet
N 3-line feeder drawings
I Design document V3
R Optimization
P Presentation preperation
S BV presentationFaculty presentation
SUM
Hours Budget 8.0 8.0 8.0 8.0 8.0 10.0 10.0 8.0 15.0 0.0 10.0 20.0 20.0 10.0 20.0 2.0 165.0
Hours Actual 7.5 18.5 19.5 17.5 4.5 9.0 16.5 23.0 41.5 0.0 8.5 24.0 34.0 19.0 TBD TBD TBD
% of Budget 0.9 2.3 2.4 2.2 0.6 0.9 1.7 2.9 2.8 0.0 0.9 1.2 1.7 1.9 ##### ##### #VALUE!
Jan 11, 2016
Aug 31, 2015
Start Date
PRO
JECT
EDSC
HEDU
LE

• Industry terminology
• Lack of experience with AutoCAD• Team communications associated with tracking
large number of drawing and parameter revisions.• Familiarity with NEC code regulations
• Lack of solar panel parameter knowledge. Such as string voltage limitations, MPP, temperature affects of on panel voltage.
• Lack of face-to-face meetings with client/mentor.
INITIAL CHALLENGES AND DIFFICULTIES

• Design process, documentation, and man hour budget.
• Solar power generation parameters.
• How to maximize utilization of inverters by increasing DC capacity past inverter ratings.
• How to design modularity into solar arrays to allow flexibility of placement.
• Experience with substation relay circuitry & communication circuitry.
• Importance of NEC Code compliance.
• Minimizing cost, use aluminum for large conductors instead of copper.
• Simulation of expected kWh production.
WHAT WE LEARNED – QUICK SUMMARY

QUESTIONS?