
1132602
121
Development of Novel Carbon Sorbents for CO 2 Capture Final Technical Report Start Date: October 1, 2008 End Date: November 30, 2013 Principal Author: Dr. Gopala N. Krishnan, Associate Director Materials Research Laboratory Contributors: Dr. Marc Hornbostel, Dr. Jianer Bao, Dr. Jordi Perez, Mr. Anoop Nagar, and Dr. Angel Sanjurjo Date Report Issued: March 2014 DOE Award Number: Cooperative Agreement No. DE-NT0005578 Submitting Organization: SRI International 333 Ravenswood Avenue Menlo Park, CA 94025 Project Partners: ATMI, Inc. 7 Commerce Drive, Danbury, CT 06810 The University of Toledo Department of Chemical and Environmental Engineering, 3048 Nitschke Hall, 1610 N Westwood Ave, Toledo, OH 43607 Prepared for: U.S. Department of Energy National Energy Technology Center 3600 Collins Ferry Road Morgantown, WV 26505 Attention: Mr. Andrew O’Palko
-
Upload
ritesh-agarwal -
Category
Documents
-
view
213 -
download
0
description
CO2 Capture sorbent technology
Transcript of 1132602

Development of Novel Carbon Sorbents for
CO2 Capture
Final Technical Report
Start Date: October 1, 2008
End Date: November 30, 2013
Principal Author: Dr. Gopala N. Krishnan, Associate Director
Materials Research Laboratory
Contributors: Dr. Marc Hornbostel, Dr. Jianer Bao, Dr. Jordi Perez, Mr. Anoop Nagar, and Dr. Angel Sanjurjo
Date Report Issued: March 2014
DOE Award Number: Cooperative Agreement No. DE-NT0005578
Submitting Organization: SRI International
333 Ravenswood Avenue
Menlo Park, CA 94025
Project Partners: ATMI, Inc.
7 Commerce Drive, Danbury, CT 06810
The University of Toledo
Department of Chemical and Environmental Engineering,
3048 Nitschke Hall, 1610 N Westwood Ave, Toledo, OH 43607
Prepared for: U.S. Department of Energy
National Energy Technology Center
3600 Collins Ferry Road
Morgantown, WV 26505
Attention: Mr. Andrew O’Palko

P18775 Final Report

P18775 Final Report
P18775 Final Report
P18775 Final Report

P18775 Final Report

P18775 Final Report

P18775 Final Report

P18775 Final Report

P18775 Final Report

P18775 Final Report

P18775 Final Report

P18775 Final Report

P18775 Final Report

P18775 Final Report
P18775 Final Report
P18775 Final Report

P18775 Final Report

P18775 Final Report

P18775 Final Report

P18775 Final Report
P18775 Final Report
0.0
20.0
40.0
60.0
80.0
100.0
120.0
0.00 0.20 0.40 0.60 0.80 1.00 1.20
CO2 Partial Pressure (atm)
CO
2 A
ds
orb
ed
(c
m3/g
)
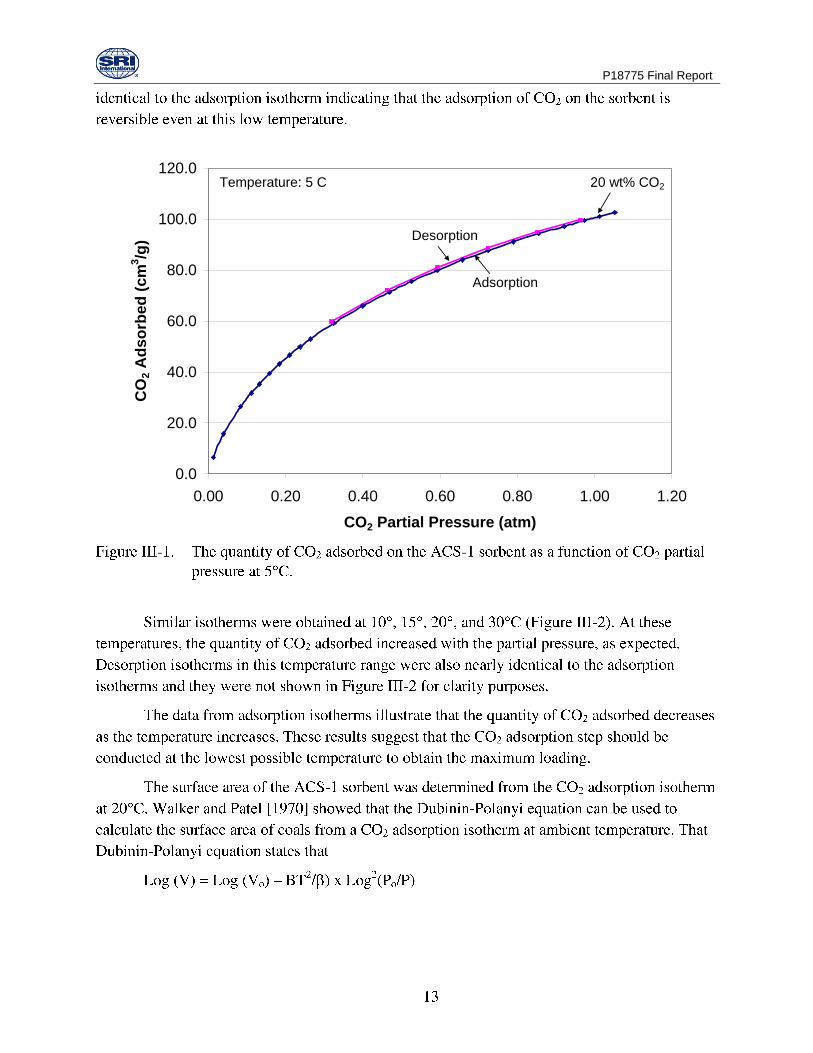
Adsorption
Desorption
Temperature: 5 C 20 wt% CO2

P18775 Final Report
0.0
20.0
40.0
60.0
80.0
100.0
120.0
0.0 0.2 0.4 0.6 0.8 1.0 1.2
CO2 Partial Pressure (atm)
CO
2 A
ds
orb
ed
(c
m3/g
)Temperature: 5 C
10°C
15°C
20°C
30°C

P18775 Final Report
y = -0.1298x + 2.2878
R2 = 0.9996
0.0
0.5
1.0
1.5
2.0
2.5
0 2 4 6 8 10 12 14
Log2 (Po/P)
Lo
g (
Vo
lum
e o
f C
O2 A
dso
rbed
/g)
P18775 Final Report
100
102
104
106
108
110
112
114
40 140 240 340 440 540
Elapsed Time (Minutes)
Rela
tive W
eig
ht
(%)
0
20
40
60
80
100
120
Tem
pera
ture
(°C
)
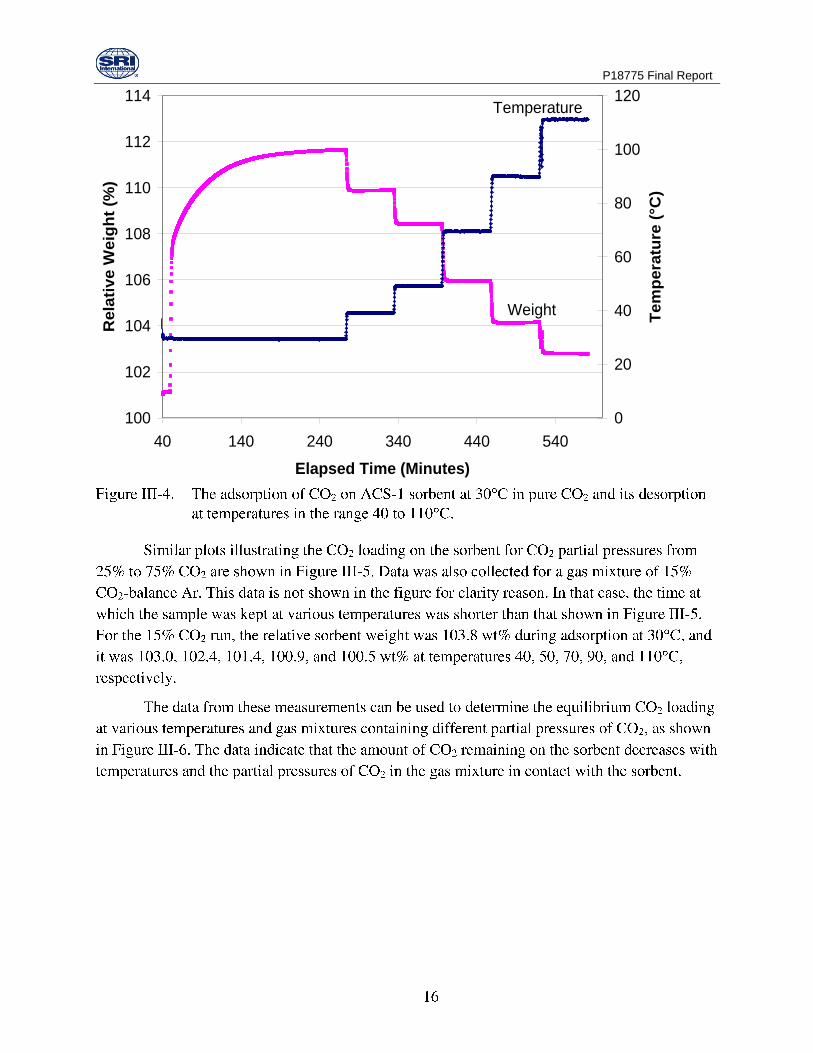
Temperature
Weight

P18775 Final Report
100
102
104
106
108
110
112
114
250 300 350 400 450 500 550 600
Elapsed Time (Minutes)
Rela
tive W
eig
ht
(%)
0
20
40
60
80
100
120
140
Tem
pera
ture
(°C
)
Temperature
100% CO2
75% CO2
50% CO2
25% CO2
0
2
4
6
8
10
12
0 20 40 60 80 100 120
Temperature (C)
Wt%
CO
2 o
n t
he
So
rbe
nt
%CO2 in CO2-Ar Gas Mixture
100
75
50
25
15

P18775 Final Report
2.5
3.0
3.5
4.0
4.5
5.0
5.5
6.0
6.5
7.0
3.2E-03 3.3E-03 3.4E-03 3.5E-03 3.6E-03 3.7E-03
Inverse Temperature (1/K)
Ln
Eq
uili
briu
m C
O2
Pre
ssu
re
60
65 cm3/g
35
30
25
20
15
10
55
4540
50
CO2 adsorbed:
P18775 Final Report
20
21
22
23
24
25
26
27
28
29
30
0 10 20 30 40 50 60 70
Quantity of CO2 Adsorbed (cm3/g)
Heat
of
Ad
so
rpti
on
(kJ/m
ol)
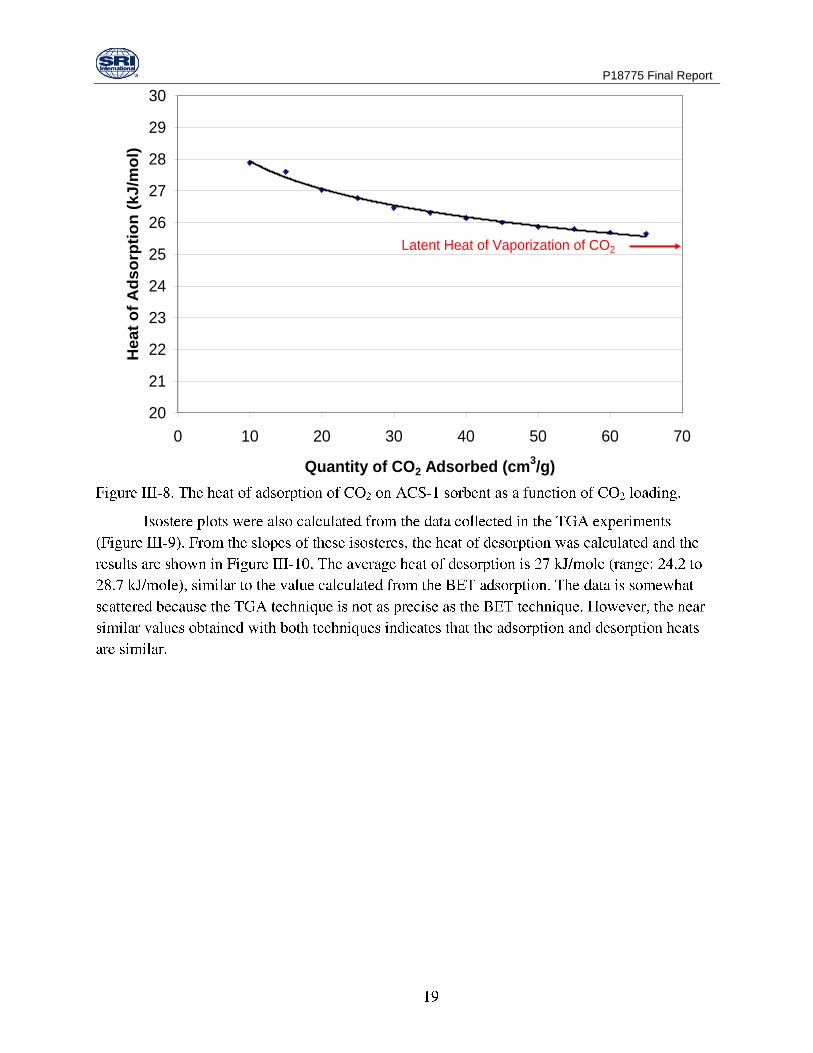
Latent Heat of Vaporization of CO2

P18775 Final Report
2.5
3.0
3.5
4.0
4.5
5.0
5.5
6.0
6.5
7.0
0.0027 0.0028 0.0029 0.0030 0.0031 0.0032 0.0033 0.0034
Inverse Temperature (1/K)
Ln
CO
2 P
art
ial
Pre
ssu
re
CO2 adsorbed: 5 cm3/g
10
15
20
30
40
25
0
5
10
15
20
25
30
0 5 10 15 20 25 30 35 40
Quantity of CO2 Adsorbed (cm3/g)
Heat
of
Ad
so
rpti
on
(kJ/m
ole
)
27 kJ/mole

P18775 Final Report
0
2
4
6
8
10
12
14
16
18
0 0.2 0.4 0.6 0.8 1 1.2
Pressure (atm)
Vo
lum
e o
f N
2 a
dso
rbed
(cm
3/g
)
5°C
15°C
20°C
25°C
10°C
P18775 Final Report
0
2
4
6
8
10
12
14
16
18
0 0.2 0.4 0.6 0.8 1 1.2
Pressure (atm)
Vo
lum
e o
f O
2 A
dso
rbed
(c
m3/g
)
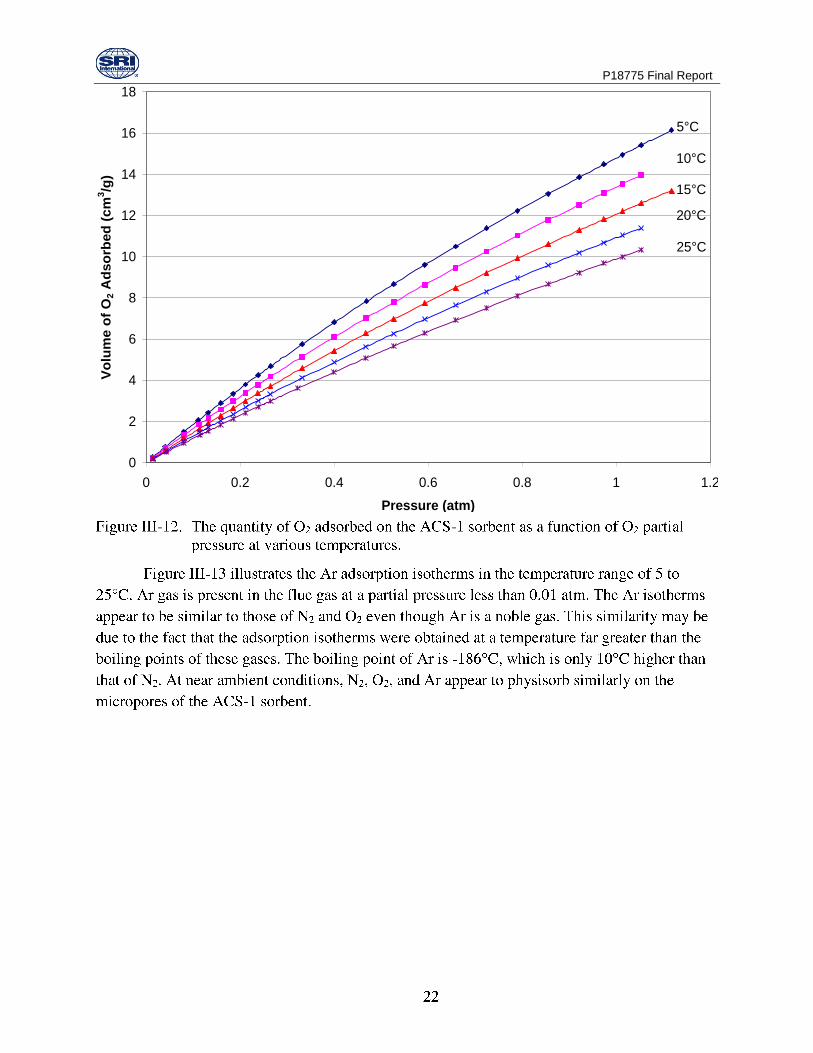
5°C
15°C
20°C
25°C
10°C

P18775 Final Report
0
2
4
6
8
10
12
14
16
18
0 0.2 0.4 0.6 0.8 1 1.2
Pressure (atm)
Vo
lum
e o
f A
r ad
so
rbed
(cm
3/g
)5°C
15°C
20°C
25°C
10°C
P18775 Final Report
0
50
100
150
200
250
300
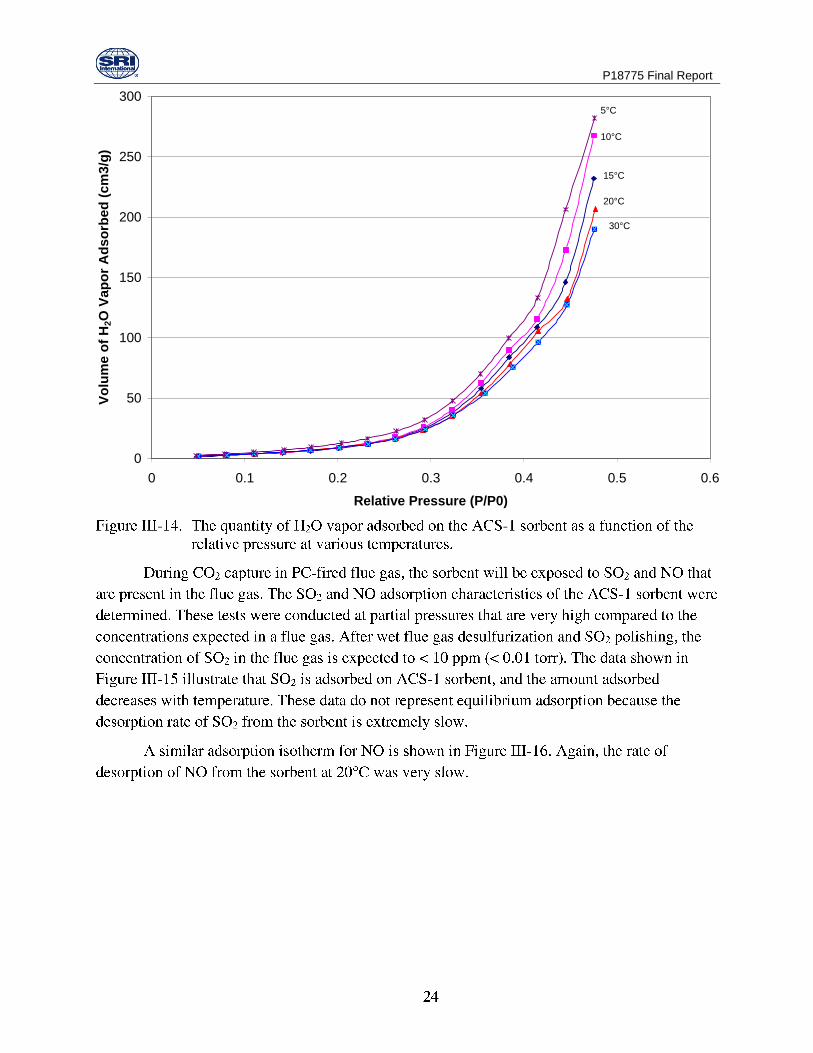
0 0.1 0.2 0.3 0.4 0.5 0.6
Relative Pressure (P/P0)
Vo
lum
e o
f H
2O
Vap
or
Ad
so
rbed
(cm
3/g
)5°C
10°C
15°C
20°C
30°C

P18775 Final Report
0.0
0.5
1.0
1.5
2.0
2.5
3.0
0 0.2 0.4 0.6 0.8 1 1.2
SO2 pressure (torr)
SO
2 a
dso
rbed
(cm
3/g
)
0.0
0.2
0.4
0.6
0.8
1.0
1.2
0 2 4 6 8 10 12
NO pressure (Torr)
Qu
an
tity
Ad
so
rbed
(cm
3/g
ST
P)

P18775 Final Report
10
11
12
13
14
15
16
17
18
19
20
0 2 4 6 8 10 12
Volume of Gas Adsorbed (cm3/g)
He
at
of
Ad
so
rpti
on
(k
J/m
ole
)
N2
O2
Ar
P18775 Final Report
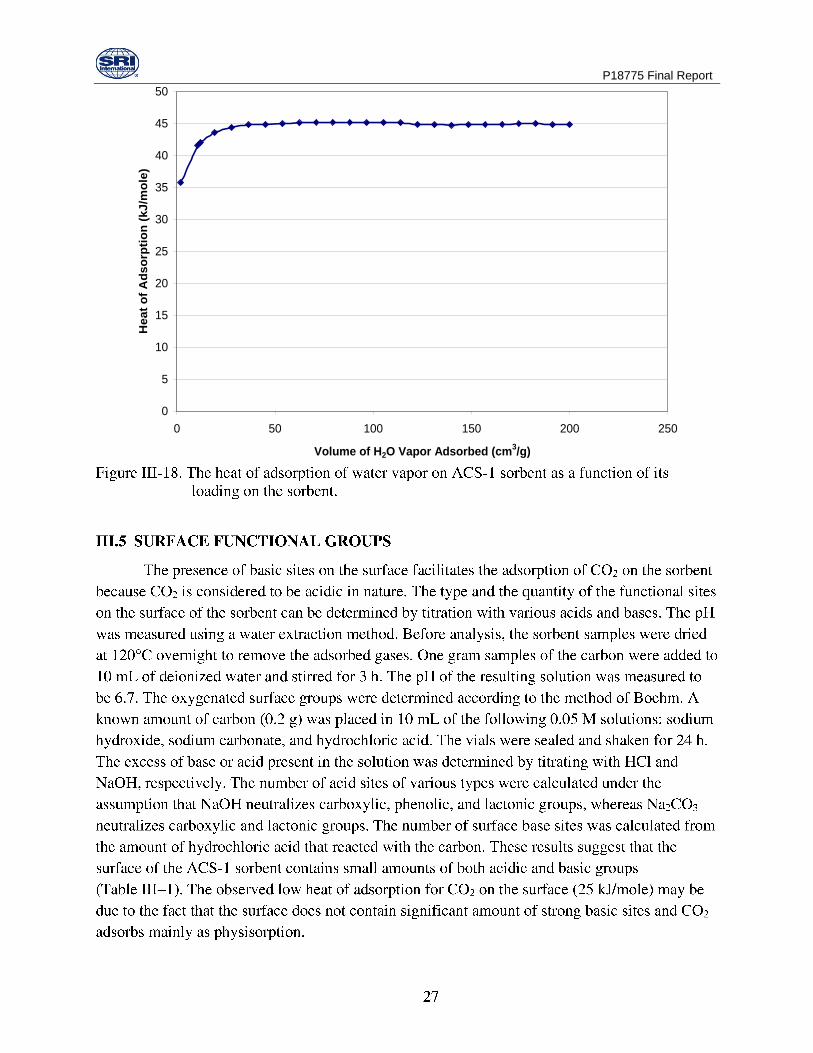
0
5
10
15
20
25
30
35
40
45
50
0 50 100 150 200 250
Volume of H2O Vapor Adsorbed (cm3/g)
Heat
of
Ad
so
rpti
on
(kJ/m
ole
)
P18775 Final Report
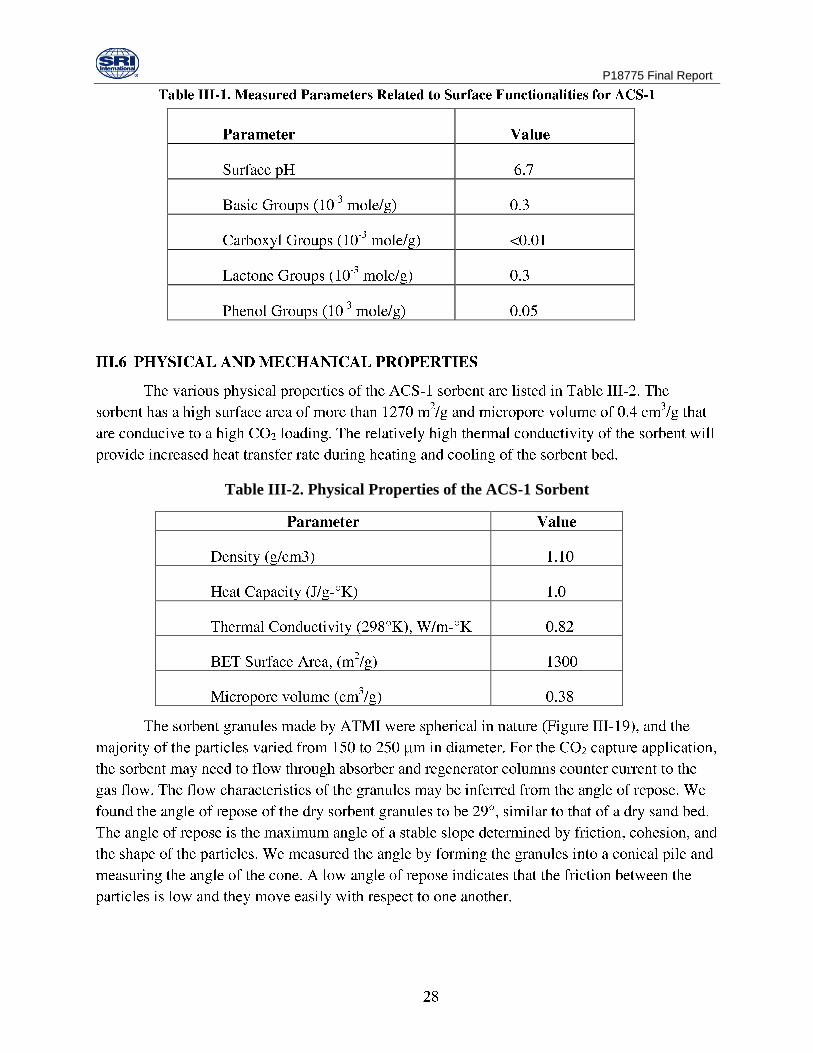
Table III-2. Physical Properties of the ACS-1 Sorbent

P18775 Final Report

P18775 Final Report
Table III-3. Attrition Resistance of the ACS-1 Sorbent
P18775 Final Report

P18775 Final Report
0
5
10
15
0 5 10 15 20 25 30 35 40
Time (min)
Pe
rce
nt
CO
2 in
th
e R
ea
cto
r E
xit
Blank Run
Empty
80% RH
40% RH
0% RH
0.0
5.0
10.0
15.0
20.0
25.0
0 10 20 30 40
Time(min)
CO
2 L
oad
ing
on
th
e S
orb
en
t (c
m3/g
)
40% RH
0% RH
80% RH

P18775 Final Report
0.00
10.00
20.00
30.00
40.00
50.00
0 10 20 30 40 50 60 70 80
Nominal RH (%)
Ad
so
rbed
Gas (
cm
3/g
)
5 C
10 C
25 C

P18775 Final Report
0
10
20
30
40
50
60
70
80
90
100
80 85 90 95 100 105 110
Time (min)
Te
mp
era
ture
(C
)
0
200
400
600
800
1000
1200
1400
1600
1800
2000
CO
2 F
low
Ra
te (
cc
/min
)
Temperature (C)
CO2 Flow Rate
0
20
40
60
80
100
120
70 75 80 85 90 95 100
Time (min)
CO
2 L
oad
ing
(cm
3/g
), T
em
pera
ture
(°C
)
CO2 Loading
Temperature
90 C
100 C
106 C

P18775 Final Report
100
101
102
103
104
105
106
107
108
109
110
0 500 1000 1500
Run time (min)
We
igh
t %
0
20
40
60
80
100
120
140
Te
mp
era
ture
(C
)

P18775 Final Report
1000
1100
1200
1300
1400
1500
1600
1700
ACS1 ACS2 ACS3
Su
rface a
rea (
m2/g
)
7.0
7.5
8.0
8.5
9.0
9.5
ACS1 ACS2 ACS3
Weig
ht
%

P18775 Final Report
P18775 Final Report
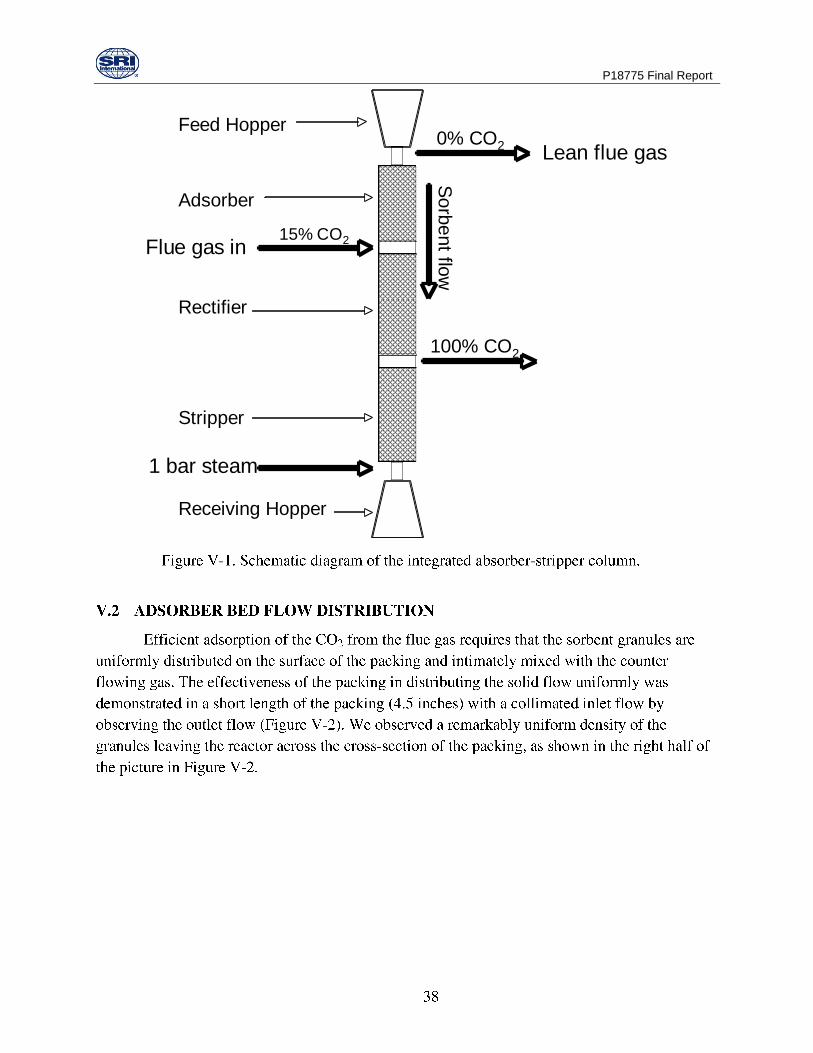
Feed Hopper
Adsorber
Rectifier
Stripper
Receiving Hopper
Flue gas in15% CO2
Lean flue gas0% CO2
100% CO2
1 bar steam
Sorb
ent flo
w

P18775 Final Report

P18775 Final Report

P18775 Final Report
0
1
2
3
4
5
6
7
8
0 5 10 15 20 25 30
Gas linear velocity (in/sec)
Gra
nu
le v
elo
cit
y (
in/s
ec
)

P18775 Final Report
0
0.2
0.4
0.6
0.8
1
1.2
1.4
0 10 20 30 40 50 60 70 80
Air Flow (SLM)
Pre
ss
ure
Dif
fere
nti
al
(in
ch
of
wa
ter)
Sorbent Flow
(0.3 gpm/ft^2)
No Sorbent Flow

P18775 Final Report
0
2
4
6
8
10
12
14
16
18
-100 -50 0 50 100 150 200 250 300
Time (sec)
Pe
rce
nt
CO
2
10 SLM
15 SLM
19 SLM
30 SLM
25 SLM
20 SLM

P18775 Final Report
0
20
40
60
80
100
120
10 12 14 16 18 20 22 24 26 28 30
Gas feed rate (SLM)
Ca
ptu
re E
ffic
ien
cy Capacity predicted from
adsorption isotherm data
P18775 Final Report
0
20
40
60
80
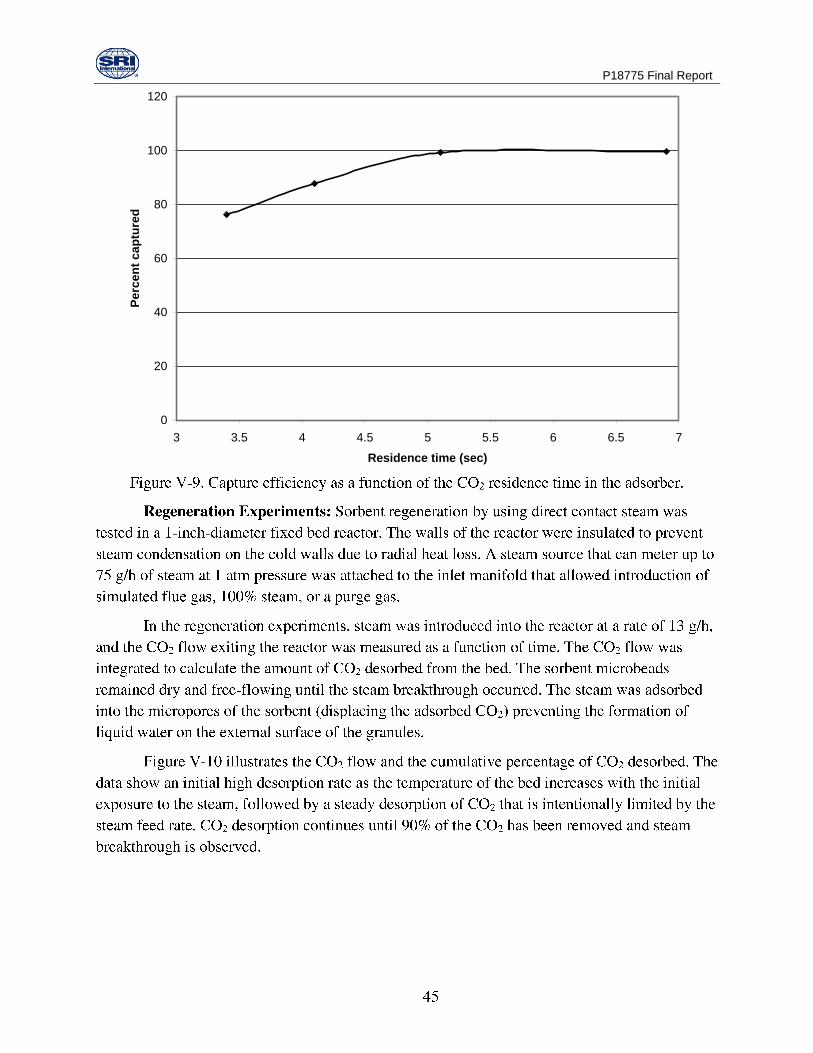
100
120
3 3.5 4 4.5 5 5.5 6 6.5 7
Residence time (sec)
Pe
rce
nt
ca
ptu
red

P18775 Final Report
0
20
40
60
80
100
120
140
160
180
200
0 2 4 6 8 10 12 14 16 18 20
Time (min)
CO
2 f
low
(s
td c
m3/m
in)
0
10
20
30
40
50
60
70
80
90
100
Perc
en
t d
eso
rbed
Percent desorbed
CO2 Flow Rate
P18775 Final Report
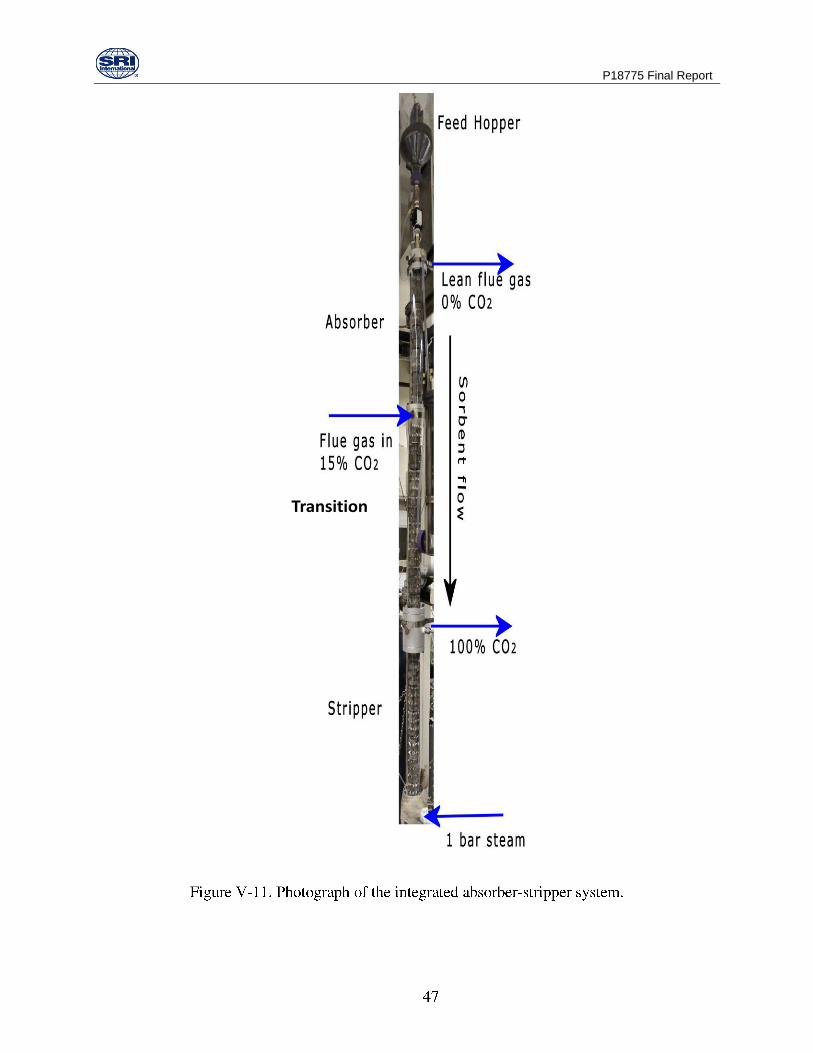
Transition

P18775 Final Report

P18775 Final Report
0
2
4
6
8
10
12
14
16
-100 -50 0 50 100 150 200 250 300 350 400 450
Run Time (sec)
Pe
rcen
t C
O2
So
rbe
nt
and
ste
am
flo
won
Ste
am
str
ipp
ing
off
So
rbe
nt flo
w o
ff
Pe
rce
nt
CO
2 in
th
e E
xit
Ga
s
0
2
4
6
8
10
12
14
16
-100 -50 0 50 100 150 200 250 300 350 400 450
Run Time (sec)
Pe
rcen
t C
O2
So
rbe
nt
and
ste
am
flo
won
Ste
am
str
ipp
ing
off
So
rbe
nt flo
w o
ff
0
2
4
6
8
10
12
14
16
-100 -50 0 50 100 150 200 250 300 350 400 450
Run Time (sec)
Pe
rcen
t C
O2
So
rbe
nt
and
ste
am
flo
won
Ste
am
str
ipp
ing
off
So
rbe
nt flo
w o
ff
Pe
rce
nt
CO
2 in
th
e E
xit
Ga
s
0
10
20
30
40
50
60
70
80
90
100
-100 -50 0 50 100 150 200 250 300 350 400 450
Run Time (sec)
Pe
rcen
t C
O2
So
rbe
nt
flo
w o
n
Ste
am
str
ipp
ing
off
So
rbe
nt
flo
w o
ff
Pe
rce
nt
CO
2 in
th
e E
xit
Ga
s
0
10
20
30
40
50
60
70
80
90
100
-100 -50 0 50 100 150 200 250 300 350 400 450
Run Time (sec)
Pe
rcen
t C
O2
So
rbe
nt
flo
w o
n
Ste
am
str
ipp
ing
off
So
rbe
nt
flo
w o
ff
0
10
20
30
40
50
60
70
80
90
100
-100 -50 0 50 100 150 200 250 300 350 400 450
Run Time (sec)
Pe
rcen
t C
O2
So
rbe
nt
flo
w o
n
Ste
am
str
ipp
ing
off
So
rbe
nt
flo
w o
ff
Pe
rce
nt
CO
2 in
th
e E
xit
Ga
s

P18775 Final Report
60
70
80
90
100
110
120
0 50 100 150 200 250
Run Time (sec)
Te
mp
eratu
re (
C)

P18775 Final Report
P18775 Final Report
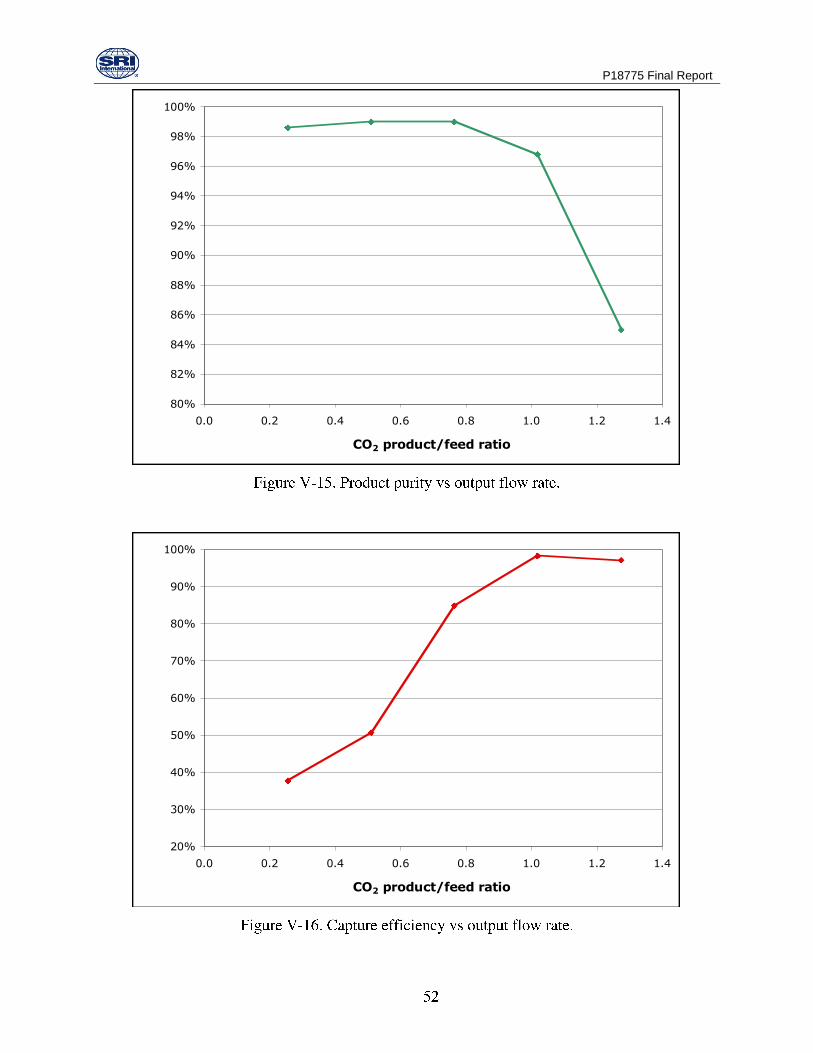
80%
82%
84%
86%
88%
90%
92%
94%
96%
98%
100%
0.0 0.2 0.4 0.6 0.8 1.0 1.2 1.4
CO2 product/feed ratio
Prod
uct
pu
rit
y
20%
30%
40%
50%
60%
70%
80%
90%
100%
0.0 0.2 0.4 0.6 0.8 1.0 1.2 1.4
CO2 product/feed ratio
Ca
ptu
re
eff
icie
ncy

P18775 Final Report
82.0%
84.0%
86.0%
88.0%
90.0%
92.0%
94.0%
96.0%
98.0%
100.0%
4 5 6 7
Gas residence time (sec)
Capture efficiency
CO2 purity

P18775 Final Report
Absorber
Transition
Regeneration
Sorbent Return
Steam
Dry Air
Condenser
CO2 Out
CO2 Depleted Air
Air-CO2 Recirculation
Transition
Dehydration
Simulated Flue Gas
Vent
Sorbent Cooling
CoolingWater

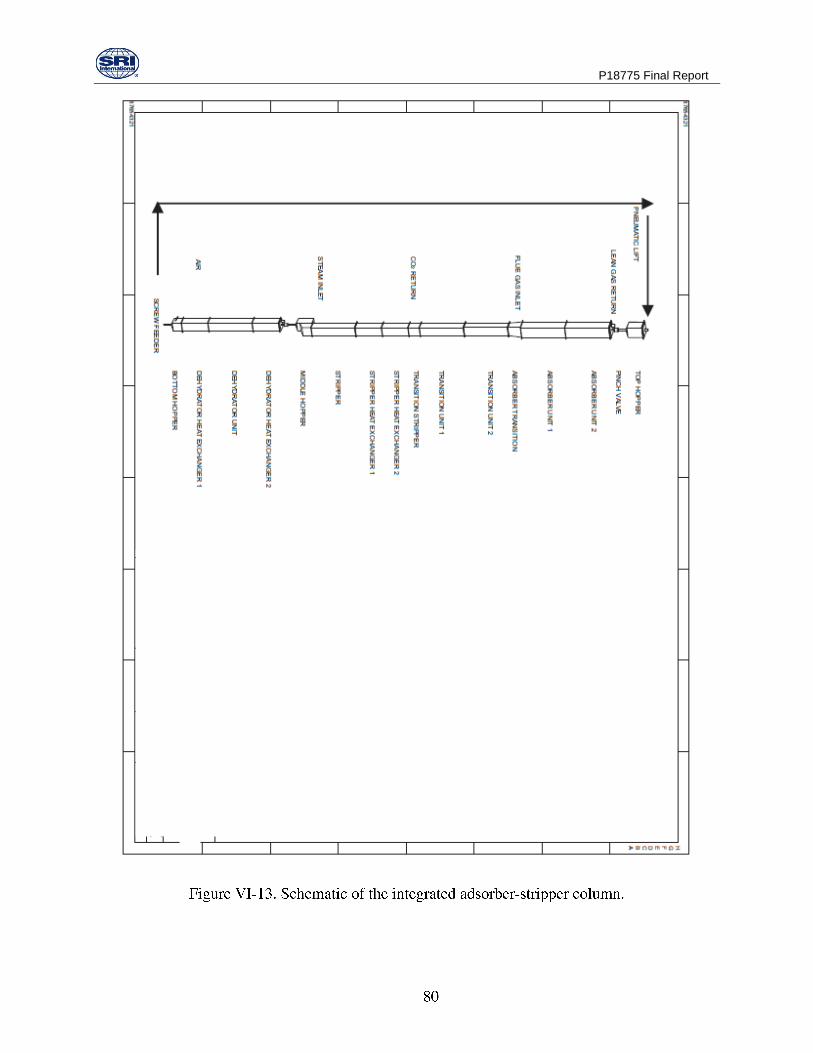
P18775 Final Report
Sorbent Cooler
CO2 Stripper
Rectifier
Absorber
12 ft
Sorbent Cooler
CO2 Stripper
Rectifier
Absorber
12 ft
Transition
P18775 Final Report

P18775 Final Report

P18775 Final Report

P18775 Final Report
P18775 Final Report
P18775 Final Report

P18775 Final Report
P18775 Final Report
P18775 Final Report
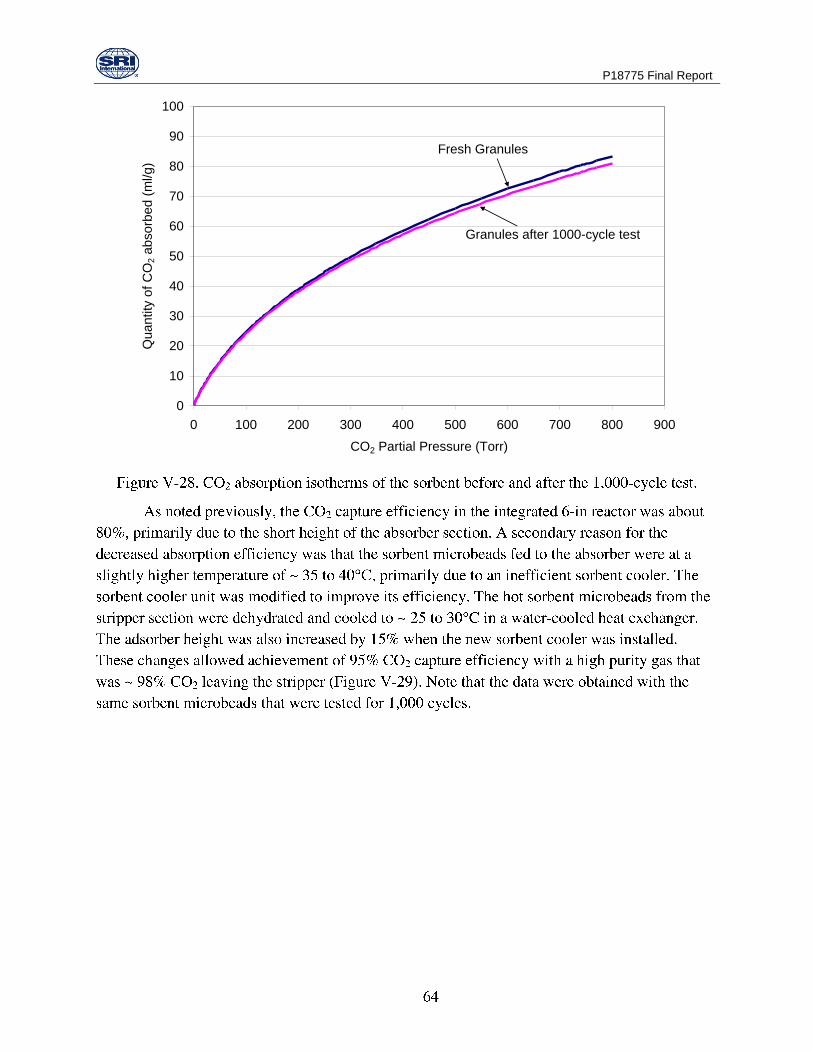
0
10
20
30
40
50
60
70
80
90
100
0 100 200 300 400 500 600 700 800 900
CO2 Partial Pressure (Torr)
Qu
an
tity
of
CO
2 a
bso
rbe
d (
ml/g
)Fresh Granules
Granules after 1000-cycle test

P18775 Final Report
0
10
20
30
40
50
60
70
80
90
100
Run Time
CO
2 C
on
cen
trat
ion
(%
)
% CO2 in theFeed Gas
% CO2 in theOutput Gas
% CO2 in theAbsorber ExitGas
Steady-State Operation (~1 h) Shut Down
~95% Capture
Startup
0
10
20
30
40
50
60
70
80
90
100
Run Time
CO
2 C
on
cen
trat
ion
(%
)
% CO2 in theFeed Gas
% CO2 in theOutput Gas
% CO2 in theAbsorber ExitGas
Steady-State Operation (~1 h) Shut Down
~95% Capture
Startup

P18775 Final Report

P18775 Final Report
Figure VI-1. The integrated reactor installed at the University of Toledo boiler site.
Reactor
assembly
Flue Gas
Chimney
Reactor
assembly
Flue Gas
Chimney

P18775 Final Report
FI
NaHCO3
COOLING
WATER
DCE
DESOx
FLUE GAS
IDF
FT
CO2
0-20%
DPT
COMPRESSED AIR
AIR
COOLING WATER IN
COOLING WATER OUT
STEAM IN
STEAM OUT
STEAM IN
STEAM OUT
DPT
TT
TT
FTCO2
0-100%
VENT
TT
ROTARY VALVE
BLOWER
TRAP
GAS
FILTER
STEAM
VENT
CO2
0-1%
SODIUM BICARBONATE
SOLUTION RESERVOIR
SCREW FEEEDER
TR
AN
SIT
ION
ST
RIP
PE
RA
BS
OR
BE
R
AIR/
MOISTURE

P18775 Final Report
Figure VI-4. A photograph of the sorbent inlet and flue gas outlet sections
Integrated Reactor
Flue Gas Chimney
Sorbent
Feed
Flue Gas
outlet Filter
Pneumatic
Feed Tube
Top of
Adsorber
Sorbent
Feed
Flue Gas
outlet Filter
Pneumatic
Feed Tube
Top of
Adsorber

P18775 Final Report
Stripper
Rotary Valve
Stripper
Rotary Valve
Sorbent
Dehydrator
Sorbent Cooler
Pneumatic Pickup
Screw Feeder
Sorbent
Dehydrator
Sorbent Cooler
Pneumatic Pickup
Screw Feeder

P18775 Final Report
. Process Parameters and Their Values Used in the Field Test at the
University of Toledo

P18775 Final Report
0
10
20
30
40
50
60
70
80
90
100
0 50 100 150 200 250 300
Time (Min)
CO
2 C
aptu
re o
r C
O2 in S
trip
per
(%)
0
1
2
3
4
5
6
7
8
9
10
Perc
enta
ge C
O2 in F
eed G
as (
%)
% CO2 in Feed Gas
% CO2 in Stripper Outlet Gas
% CO2 Capture
P18775 Final Report
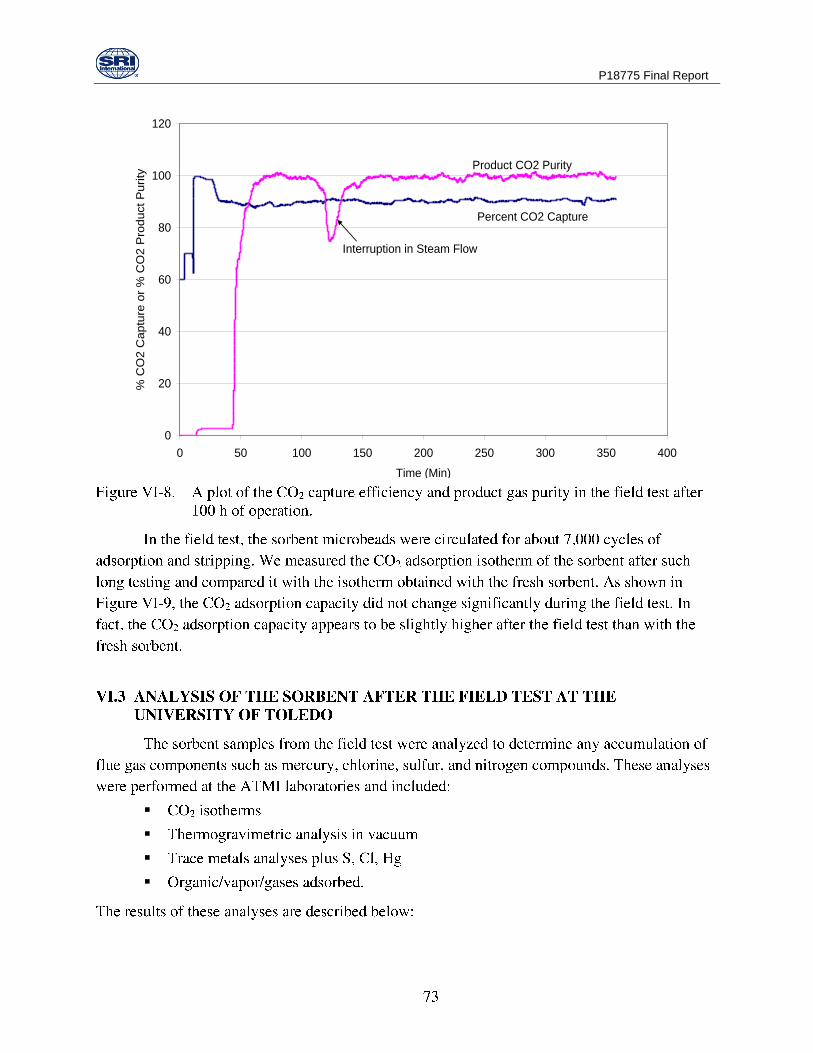
0
20
40
60
80
100
120
0 50 100 150 200 250 300 350 400
Time (Min)
% C
O2 C
aptu
re o
r %
CO
2 P
roduct
Purity
Interruption in Steam Flow
Product CO2 Purity
Percent CO2 Capture

P18775 Final Report
0
10
20
30
40
50
60
70
80
90
0 100 200 300 400 500 600 700 800 900
CO2 Pressure (Torr)
Cu
mu
alt
ive C
O2 a
dso
rbed
(cm
3/g
-ST
P)
Fresh
After 135 h of Testing

P18775 Final Report

P18775 Final Report
. Comparison of Inorganic Elements in the Fresh and Field Test Sorbents
. Comparison of Adsorbed Gases in the Fresh and Field Test Sorbents
Element Fresh Used
ppm ppm
Na 102 95
P 80 66
K 74 6
Ca 41 41
Mn <2 24
Fe <2 1234
Zn <2 15
Cl 468 611
S 19 132
Hg <0.06 0.31
Contaminant Fresh Used
ppb ppm
Acetone 3.24 9.02
NO N.D. 3210
CO2 N.D. 758
Methylbutane N.D. 19.6
Methylisocyanide N.D. 67.1
Pentane N.D. 30.1
Benzene N.D. 40
Acetic Acid N.D. 284

P18775 Final Report
cheaper
Table VI-4. Design Parameters and Their Values Used in the Field Test at NCCC

P18775 Final Report

P18775 Final Report
P18775 Final Report

P18775 Final Report

P18775 Final Report

P18775 Final Report

P18775 Final Report
0.0
5.0
10.0
15.0
20.0
25.0
0 2 4 6 8 10 12
Differential Pressure (Inch Water)
Ou
tput
Sig
nal (m
A)

P18775 Final Report
0.0
1.0
2.0
3.0
4.0
5.0
6.0
7.0
8.0
9.0
0 200 400 600 800 1000
CO2 Flow (Liters/min) at 20 C
Sig
nal (m
A)
0
2
4
6
8
10
12
14
16
0 20 40 60 80 100 120 140 160
Temperature (C)
Sig
nal (m
A)

P18775 Final Report
0
5
10
15
20
25
0 100 200 300 400 500 600
Air Flow (Liters/min) at 20 C
Sig
nal (m
A)

P18775 Final Report

P18775 Final Report

P18775 Final Report

P18775 Final Report
0
10
20
30
40
50
60
70
0 20 40 60 80 100 120 140 160 180 200
Time (Minutes)
Pe
rce
nta
ge
CO
2 in
Ga
s
Flue Gas
CO2-Lean Flue Gas
CO2-Rich Product Gas

P18775 Final Report
CO2 Capture No Yes No Yes
Gross Power Output (kW) 580,260 663,445 581,034 679,911
Auxiliary Power Requirement (kW) 30,110 117,450 31,016 129,485
Net Power Output (kW) 550,150 545,995 550,018 550,426
Net Plant HHV Efficiency (%) 39.1% 27.2% 38.9% 27.1%
Net Plant HHV Heat Rate (Btu/kW-hr) 8,721 12,534 8,859 12,590
Coal Flowrate (lb/hr) 411,282 586,627 414,000 594,000
CO2 Emissions (lb/MWh) 1,773 254 1,790 252
Total Plant Cost ($ x 1000) 866,391 1,567,073 872,118 1,586,765
Total Plant Cost ($/kW) 1,575 2,870 1,586 2,883
LCOE (¢/kWh) 6.33 11.48 6.40 11.58
NETL SRI

P18775 Final Report

P18775 Final Report
PC
BoilerForced Draft Fans
Primary Air Fans
Air
Air
Illinois #6 Bottom
Ash
SCR BaghouseInduced
Draft Fans
Fly Ash
FGD
Limestone
Slurry
AirWater
Gypsum
Slurry
Stack
Gas
HP
Turbine
LP
TurbineLP Turbines
Generator
Hot Reheat
HP Steam
Cold
Reheat
Condenser
Feedwater
Preheater
System

P18775 Final Report
SRI Supercritical Power Plant NETL Supercritical Power Plant
Net Power Output, MW 550 550
Steam Cycle, (psig,°F,°F) 3500,1100,1100 3500,1100,1100
Coal Illinois #6 Illinois #6
Condenser pressure, mmHg 50.8 50.8
Cooling water to condenser, °F 67.5 60
Cooling water from condenser, °F 94.5 80
Stack Temperature, °F 131.0 135.0
SO2 Control Wet Limestone Forced Oxidation Wet Limestone Forced Oxidation
FGD Efficiency, % SO2 Removal 98.0 98.0
NOx Control Low NOx Burners w/OFA and SCR Low NOx Burners w/OFA and SCR
SCR Efficiency, % NOx Removal 86.0 86.0
Ammonia Slip, ppmv 2.0 2.0
Particulate Control Fabric Filter Fabric Filter
Fabric Filter Efficiency, % Ash Removal 99.8 99.8
Mercury Control Co-Benefit Capture Co-Benefit Capture
Mercury Removal Efficiency, % 90.0 90.0
CO2 Capture, % N/A N/A
NETL SRICO2 Capture No No
Gross Power Output (kW) 580,260 581,034
Auxiliary Power Requirement (kW) 30,110 31,016
Net Power Output (kW) 550,150 550,018
Net Plant HHV Efficiency (%) 39.1% 38.9%
Net Plant HHV Heat Rate (Btu/kW-hr) 8,721 8,859
Coal Flowrate (lb/hr) 411,282 414,000
CO2 Emissions (lb/MWh) 1,773 1,790
Total Plant Cost ($ x 1000) 866,391 872,118
Total Plant Cost ($/kW) 1,575 1,586
LCOE (¢/kWh) 6.33 6.40

P18775 Final Report
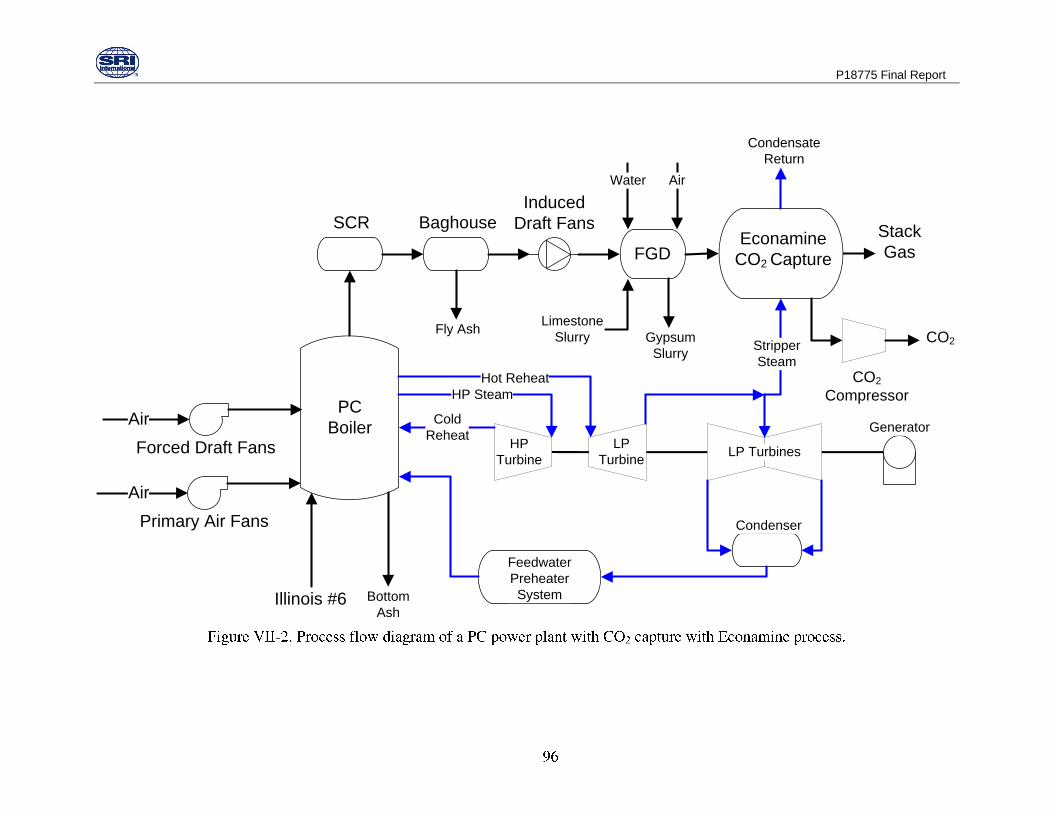
P18775 Final Report
PC
BoilerForced Draft Fans
Primary Air Fans
Air
Air
Illinois #6 Bottom
Ash
SCR BaghouseInduced
Draft Fans
Fly Ash
FGD
Limestone
Slurry
AirWater
Gypsum
Slurry
Stack
Gas
HP
Turbine
LP
TurbineLP Turbines
Generator
Hot Reheat
HP Steam
Cold
Reheat
Condenser
Feedwater
Preheater
System
Econamine
CO2 Capture
Stripper
Steam
Condensate
Return
CO2
Compressor
CO2

P18775 Final Report
SRI Supercritical Power Plant
w/ Econamine FG+ CO2 Captue
NETL Supercritical Power Plant
w/ Econamine FG+ CO2 Captue
Net Power Output, MW 550 550
Steam Cycle, (psig,°F,°F) 3500,1100,1100 3500,1100,1100
Coal Illinois #6 Illinois #6
Condenser pressure, mmHg 50.8 50.8
Cooling water to condenser, °F 64.5 60
Cooling water from condenser, °F 85.5 80
Stack Temperature, °F 74.0 74.0
SO2 Control Wet Limestone Forced Oxidation Wet Limestone Forced Oxidation
FGD Efficiency, % SO2 Removal 98.0 98.0
NOx Control Low NOx Burners w/OFA and SCR Low NOx Burners w/OFA and SCR
SCR Efficiency, % NOx Removal 86.0 86.0
Ammonia Slip, ppmv 2.0 2.0
Particulate Control Fabric Filter Fabric Filter
Fabric Filter Efficiency, % Ash Removal 99.8 99.8
Mercury Control Co-Benefit Capture Co-Benefit Capture
Mercury Removal Efficiency, % 90.0 90.0
CO2 Control Econamine FG Plus Econamine FG Plus
CO2 Capture, % 90 90
CO2 Sequestration Off-site Saline Formation Off-site Saline Formation
NETL SRICO2 Capture Yes Yes
Gross Power Output (kW) 663,445 679,911
Auxiliary Power Requirement (kW) 117,450 129,485
Net Power Output (kW) 545,995 550,426
Net Plant HHV Efficiency (%) 27.2% 27.1%
Net Plant HHV Heat Rate (Btu/kW-hr) 12,534 12,590
Coal Flowrate (lb/hr) 586,627 594,000
CO2 Emissions (lb/MWh) 254 252
Total Plant Cost ($ x 1000) 1,567,073 1,586,765
Total Plant Cost ($/kW) 2,870 2,883
LCOE (¢/kWh) 11.48 11.58

P18775 Final Report
Parameter Unit No CO2 Capture
CO2 Capture with
Econamine
Steam Turbine Gross Power kWe 581,034 679,911
Auxiliary Load
Coal Handling & Conveying kWe 508 729
Limestone Handling & Reagent Preparation kWe 1,004 1,441
Pulverizers kWe 3,472 4,981
Ash Handling kWe 803 1,152
Primary Air Fans kWe 1,262 1,810
Forced Draft Fans kWe 1,324 1,900
Induced Draft Fans kWe 7,165 28,581
SCR kWe 218 313
Baghouse kWe 558 788
FGD Pumps & Agitators kWe 4,664 7,061
Econamine Plus Auxiliaries kWe 0 16,733
CO2 Compressor kWe 0 48,999
Miscellaneous Balance-of-Plant kWe 1,453 1,700
Condensate Pumps kWe 1,085 820
Circulating Water Pumps kWe 3,977 4,050
Cooling Tower Fans kWe 2,070 6,728
Transformer Losses kWe 1,453 1,700
Auxillary Power Requirements kWe
Total kWe 31,016 129,485
Net Plant Performance
Auxiliary Load kWe 31,016 129,485
Net Plant Power kWe 550,018 550,426
Net Plant Efficiency (HHV) 38.9% 27.1%
Net Plant Heat Rate (HHV) Btu/kWhr 8,859 12,590
Coal Feed Flowrate lb/hr 414,000 594,000
Thermal Input1 kWth 1,415,453 2,030,867
Limestone Sorbent Feed lb/hr 41,089 58,953
CO2 Emitted lb/hr 984,315 138,598
CO2 Captured lb/hr 0.0% 1,247,382
CO2 Removal 0 90.0%
Water Requirement lb/s 707 1,417

P18775 Final Report

P18775 Final Report
PC
BoilerForced Draft Fans
Primary Air Fans
Air
Air
Illinois #6 Bottom
Ash
SCR BaghouseInduced
Draft Fans
Fly Ash
FGD
Limestone
Slurry
AirWater
Gypsum
Slurry
Stack
Gas
HP
Turbine
LP
TurbineLP Turbines
Generator
Hot Reheat
HP Steam
Cold
Reheat
Condenser
Feedwater
Preheater
System
Carbon
Sorbent
CO2 Capture
Stripper
Steam
Condensate
Return
CO2
Compressor
CO2

P18775 Final Report
101
SRI Supercritical Power Plant
w/ Carbon Sorbent CO2 Captue
NETL Supercritical Power Plant
w/ Econamine FG+ CO2 Captue
Net Power Output, MW 550 550
Steam Cycle, (psig,°F,°F) 3500,1100,1100 3500,1100,1100
Coal Illinois #6 Illinois #6
Condenser pressure, mmHg 50.8 50.8
Cooling water to condenser, °F 64.5 60
Cooling water from condenser, °F 85.5 80
Stack Temperature, °F 74.0 74.0
SO2 Control Wet Limestone Forced Oxidation Wet Limestone Forced Oxidation
FGD Efficiency, % SO2 Removal 98.0 98.0
NOx Control Low NOx Burners w/OFA and SCR Low NOx Burners w/OFA and SCR
SCR Efficiency, % NOx Removal 86.0 86.0
Ammonia Slip, ppmv 2.0 2.0
Particulate Control Fabric Filter Fabric Filter
Fabric Filter Efficiency, % Ash Removal 99.8 99.8
Mercury Control Co-Benefit Capture Co-Benefit Capture
Mercury Removal Efficiency, % 90.0 90.0
CO2 Control Econamine FG Plus Econamine FG Plus
CO2 Capture, % 90 90
CO2 Sequestration Off-site Saline Formation Off-site Saline Formation
Base Case Econamine FG+ Carbon Sorbent
CO2 Capture No Yes Yes
Gross Power Output (kW) 581,034 679,911 640,421
Auxiliary Power Requirement (kW) 31,016 129,485 90,246
Net Power Output (kW) 550,018 550,426 550,175
Net Plant HHV Efficiency (%) 38.9% 27.1% 35.1%
Net Plant HHV Heat Rate (Btu/kW-hr) 8,859 12,590 9,717
Coal Flowrate (lb/hr) 414,000 594,000 458,280
CO2 Emissions (lb/MWh) 1,790 252 194
Total Plant Cost ($ x 1000) 872,118 1,586,765 1,224,213
Total Plant Cost ($/kW) 1,586 2,883 2,225
LCOE (¢/kWh) 6.40 11.58 9.23
Increase in COE (%) 0.0% 80.9% 44.2%

P18775 Final Report
102
Parameter Units
Carbon Sorbent Econamine
Steam Turbine Gross Power kWe 640,415 679,911
Auxiliary Load
Coal Handling & Conveying kWe 563 729
Limestone Handling & Reagent Preparation kWe 1,112 1,441
Pulverizers kWe 3,844 4,981
Ash Handling kWe 889 1,152
Primary Air Fans kWe 1,397 1,810
Forced Draft Fans kWe 1,466 1,900
Induced Draft Fans kWe 13,528 28,581
SCR kWe 241 313
Baghouse kWe 615 788
FGD Pumps & Agitators kWe 5,246 7,061
Carbon Sorbents/Econoamine Plus Auxiliaries kWe 5,484 16,733
CO2 Compressor kWe 41,966 48,999
Miscellaneous Balance-of-Plant kWe 1,601 1,700
Condensate Pumps kWe 1,053 820
Circulating Water Pumps kWe 5,002 4,050
Cooling Tower Fans kWe 4,638 6,728
Transformer Losses kWe 1,601 1,700
Total kWe 90,246 129,485
Net Plant Performance
Auxiliary Load kWe 90,246 129,485
Net Plant Power kWe 550,170 550,426
Net Plant Efficiency (HHV) 35.1% 27.1%
Net Plant Heat Rate (HHV) Btu/kWhr 9,718 12,590
Coal Feed Flowrate lb/hr 458,280 594,000
Thermal Input1 kWth 1,566,845 2,030,867
Limestone Sorbent Feed lb/hr 45,483 58,953
CO2 Emitted lb/hr 106,944 138,598
CO2 Captured lb/hr 962,496 1,247,382
CO2 Removal 90.0% 90.0%
Water Requirement pounds/s 917 1,417
CO2 Capture by

P18775 Final Report
103

P18775 Final Report
104
Parameter Units Base Case
Reboiler
Steam
Pressure
Reboiler
Steam
Pressure
Flue Gas
Pressure
Drop
Flue Gas
Pressure
Drop
Reboiler
Heat Input
Reboiler
Heat Input
Reboiler Steam Pressure psia 17.7 53.1 131.1 17.7 17.7 17.7 17.7
Flue Gas Pressure Drop psia 0.54 0.5 0.5 1.0 2.0 0.5 0.5
Reboiler Heat Input BTU/lb-CO2 250 250 250 250 250 350 500
Max Absorber Inlet Temperature °F 70 70 70 70 70 70 70
Absorbent CO2 Capacity wt% 6.7% 6.7% 6.7% 6.7% 6.7% 6.7% 6.7%
CO2 Capture Capital Cost $/(lb/hr-CO2) 191 191 191 191 191 191 191
Net Plant HHV Efficiency % 35.1% 34.8 34.5 34.9 34.5 34.8 34.4
Gross Plant Output MW 640 641 642 644 653 641 643
Coal Flowrate tons/hr 458 463 467 461 467 462 468
Power Plant Capital c/kWh 5.23 5.28 5.33 5.26 5.33 5.27 5.34
Power Plant Fuel c/kWh 2.11 2.13 2.15 2.12 2.15 2.13 2.15
Variable Plant O&M c/kWh 0.93 0.93 0.94 0.93 0.94 0.93 0.94
Fixed Plant O&M c/kWh 0.58 0.58 0.58 0.58 0.58 0.58 0.58
CO2 Transport, Monitoring, & Storage c/kWh 0.38 0.38 0.38 0.38 0.38 0.38 0.38
Cost of Electricity (COE) c/kWh 9.23 9.30 9.38 9.28 9.38 9.30 9.39
Increase in COE % 44.2% 45.3% 46.6% 45.0% 46.6% 45.3% 46.7%

P18775 Final Report
105
Parameter Units Base Case
Max
Absorb.
Inlet Temp
Max
Absorb.
Inlet Temp
Absorbent
CO2
Capacity
Absorbent
CO2
Capacity
CO2
Capture
Capital
Cost
CO2
Capture
Capital
Cost
Optimized
Case
Reboiler Steam Pressure psia 17.7 17.7 17.7 17.7 17.7 17.7 17.7 17.7
Flue Gas Pressure Drop psia 0.54 0.5 0.5 0.5 0.5 0.5 0.5 0.5
Reboiler Heat Input BTU/lb-CO2 250 250 250 250 250 250 250 250
Max Absorber Inlet Temperature °F 70 50 100 70 70 70 70 50
Absorbent CO2 Capacity wt% 6.7% 6.7% 6.7% 10.0% 5.0% 6.7% 6.7% 10.0%
CO2 Capture Capital Cost $/(lb/hr-CO2) 191 191 191 191 191 96 127 96
Net Plant HHV Efficiency % 35.1% 34.9 35.1 35.1 35.0 35.1 35.1 34.9
Gross Plant Output MW 640 645 640 640 643 640 640 645
Coal Flowrate tons/hr 458 461 458 458 460 458 458 461
Power Plant Capital c/kWh 5.23 5.26 5.23 5.23 5.25 4.47 4.72 4.50
Power Plant Fuel c/kWh 2.11 2.12 2.11 2.11 2.12 2.11 2.11 2.12
Variable Plant O&M c/kWh 0.93 0.93 0.93 0.93 0.93 0.93 0.93 0.93
Fixed Plant O&M c/kWh 0.58 0.58 0.58 0.58 0.58 0.58 0.58 0.58
CO2 Transport, Monitoring, & Storage c/kWh 0.38 0.39 0.38 0.38 0.38 0.38 0.38 0.39
Cost of Electricity (COE) c/kWh 9.23 9.28 9.22 9.22 9.26 8.47 8.72 8.50
Increase in COE % 44.2% 44.9% 44.1% 44.1% 44.7% 32.3% 36.3% 32.8%

P18775 Final Report
106
. Characteristics of the CO2 Capture System
Parameter Units Original Revised
Reboiler Steam Pressure psia 17.7 17.7
Flue Gas Pressure Drop psia 0.54 1
Reboiler Heat Input BTU/lb-CO2 250 500
Max Absorber Inlet Temperature °F 70 70
Absorbent CO2 Capacity wt% 10 5
CO2 Capture Capital Cost $/(lb/hr-CO2) 96 96

P18775 Final Report
107
. Characteristics of a Supercritical Power Plant with CO2 Capture
SRI Supercritical Power Plant with
Carbon Sorbent CO2 Captue
NETL Supercritical Power Plant
with Econamine FG+ CO2 Captue
Net Power Output, MW550 550
Steam Cycle, (psig,°F,°F)3500,1100,1100 3500,1100,1100
CoalIllinois #6 Illinois #6
Condenser pressure, mmHg50.8 50.8
Cooling water to condenser, °F64.5 60
Cooling water from condenser, °F85.5 80
Stack Temperature, °F74.0 74.0
SO2 ControlWet Limestone Forced Oxidation Wet Limestone Forced Oxidation
FGD Efficiency, % SO2 Removal98.0 98.0
NOx ControlLow NOx Burners w/OFA and SCR Low NOx Burners w/OFA and SCR
SCR Efficiency, % NOx Removal86.0 86.0
Ammonia Slip, ppmv2.0 2.0
Particulate ControlFabric Filter Fabric Filter
Fabric Filter Efficiency, % Ash Removal99.8 99.8
Mercury ControlCo-Benefit Capture Co-Benefit Capture
Mercury Removal Efficiency, %90.0 90.0
CO2 ControlAdvanced Carbon Sorbent Econamine FG Plus
CO2 Capture, %90 90
CO2 SequestrationOff-site Saline Formation Off-site Saline Formation

P18775 Final Report
108
. Auxiliary Loads and Power Plant Performance
Parameter Unit No CO2 Capture
CO2 Capture
with Economine
FG+
CO2 Capture
with the Carbon
Sorbent
Steam Turbine Gross Power kWe 580,400 662,800 642,113
Auxiliary Load
Coal Handling & Conveying kWe 440 510 556
Limestone Handling & Reagent Prep kWe 890 1,250 1,078
Pulverizers kWe 2,780 3,850 3,703
Ash Handling kWe 530 740 860
Primary Air Fans kWe 1,300 1,800 1,342
Forced Draft Fans kWe 1,660 2,300 1,410
Induced Draft Fans kWe 7,050 11,120 17,020
SCR kWe 50 70 253
Baghouse kWe 70 100 642
FGD Pumps & Agitators kWe 2,970 4,110 5,047
Econamine FG Plus Auxiliaries kWe 0 20,600 6,000
CO2 Compressor kWe 0 44,890 43,274
Miscellaneous Balance-of-Plant kWe 2,000 2,000 2,395
Steam Turbine Auxiliaries kWe 400 400 0
Condensate Pumps kWe 800 560 811
Circulating Water Pumps kWe 4,730 10,100 4,376
Ground Water Pumps kWe 480 910 4,477
Cooling Tower Fans kWe 2,440 5,230 1,588
Transformer Losses kWe 1,820 2,290 3,922
Total kWe 30,410 112,830 98,751
Net Plant Performance
Auxiliary Load kWe 30,410 112,830 98,751
Net Plant Power kWe 549,990 549,970 543,362
Net Plant Efficiency (HHV) 39.3% 28.4% 36.0%
Net Plant Heat Rate (HHV) Btu/kWhr 8,687 12,002 9,472
Coal Feed Flowrate lb/hr 409,528 565,820 441,178
Thermal Input kWth 1,400,163 1,934,520 1,508,374
Limestone Sorbent Feed lb/hr 40,646 57,245 43,508
CO2 Emitted lb/hr 972,382 134,193 102,924
CO2 Captured lb/hr 0 1,207,730 926,317
CO2 Removal 90.0% 90.0% 90.0%
Water Requirement 1000s gpd 4,252 7,300 7,072

P18775 Final Report
109
. Cost of CO2 Capture
Parameter Unit No CO2 Capture
CO2 Capture
with Economine
FG+
CO2 Capture
with the Carbon
Sorbent
Capacity Factor 85% 85% 85%
Capital Charge Factor 11.65% 12.43% 12.43%
20-year Levelization Factors
Fuel 1.2089 1.2089 1.2089
Non-Fuel Variable O&M 1.1618 1.1618 1.1618
Fixed O&M 1.1618 1.1618 1.1618
Plant Operating Life years 30 30 30
Power Production @100% Capacity GWh/yr 4,818 4,818 4,760
Power Plant Capital c/kWh 3.17 5.96 4.40
Power Plant Fuel c/kWh 1.42 1.96 1.55
Variable Plant O&M c/kWh 0.51 0.87 0.66
Fixed Plant O&M c/kWh 0.80 1.30 0.96
Power Plant Total c/kWh 5.89 10.10 7.56
CO2 TS&M c/kWh 0.56 0.54
BOTTOM LINE TOTAL c/kWh 5.89 10.66 8.10
Increase in COE % 0.0% 80.2% 37.2%
CO2 Emissions lb/MWh 1,768 244 189

P18775 Final Report
110

P18775 Final Report
111
1. The performance of the process will be demonstrated using a flue gas stream
from an operating PC-fired power plant for an extended period of time.
2. The system design will focus on the materials of construction to reduce the
cost of CO2 capture to acceptable levels. The capital cost of the system is a
major factor in the cost of CO2 capture.
3. Thermal integration concepts can be evaluated at a preliminary level.
Although thermal requirements cannot be defined precisely at this scale, we
will obtain a reasonable estimate of steam requirements, which is a major
operating cost.

P18775 Final Report
112


