11:15 12:15 Analyze This! - FMT Consultants · Analyze This! Get Better Insight with Power BI for...
29
Analyze This! Get Better Insight with Power BI for Office 365 Jeff Fenn, BI & Development Practice Manager FMT Consultants 11:15 – 12:15
Transcript of 11:15 12:15 Analyze This! - FMT Consultants · Analyze This! Get Better Insight with Power BI for...

Analyze This! Get Better Insight with Power BI for
Office 365
Jeff Fenn, BI & Development Practice Manager
FMT Consultants
11:15 – 12:15
• Agile BI
• Self-Service BI in Excel
• Power BI for Office 365
• Infrastructure Services for Power BI
• Q & A
Agenda

Agile BI
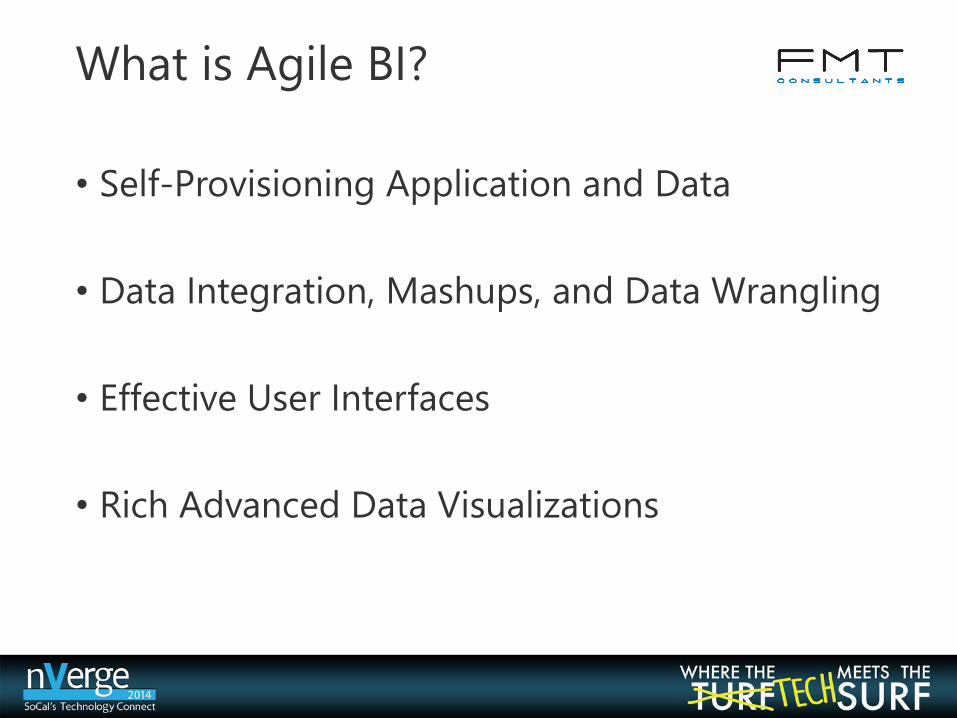
• Self-Provisioning Application and Data
• Data Integration, Mashups, and Data Wrangling
• Effective User Interfaces
• Rich Advanced Data Visualizations
What is Agile BI?
Self Service BI Features
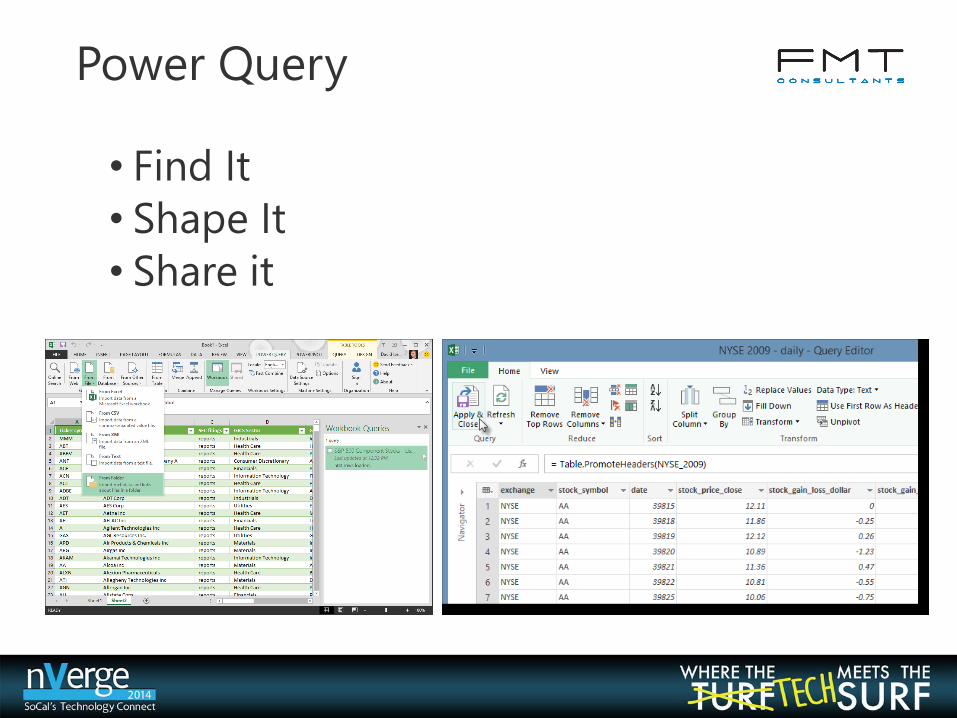
• Find It
• Shape It
• Share it
Power Query
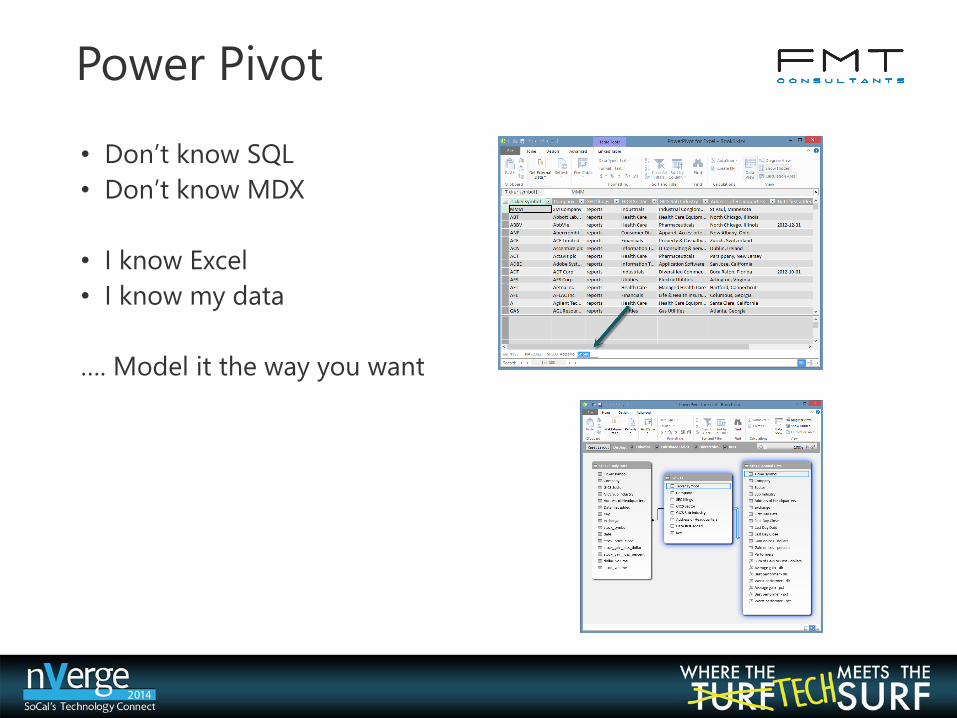
• Don’t know SQL
• Don’t know MDX
• I know Excel
• I know my data
…. Model it the way you want
Power Pivot
Power Query vs Power Pivot

Demo
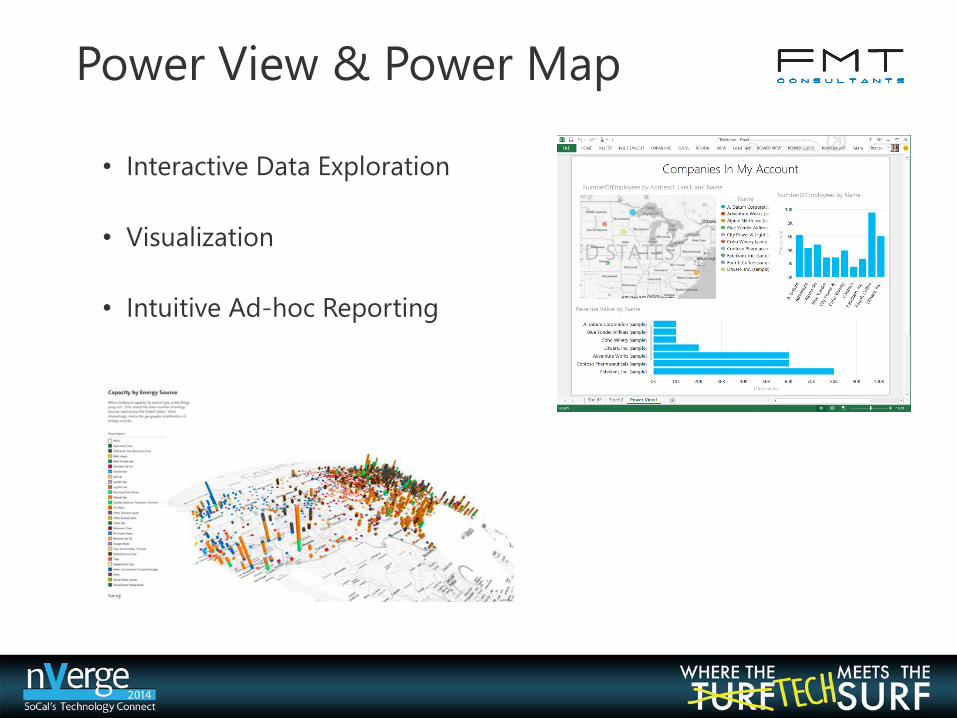
Power View & Power Map
• Interactive Data Exploration
• Visualization
• Intuitive Ad-hoc Reporting
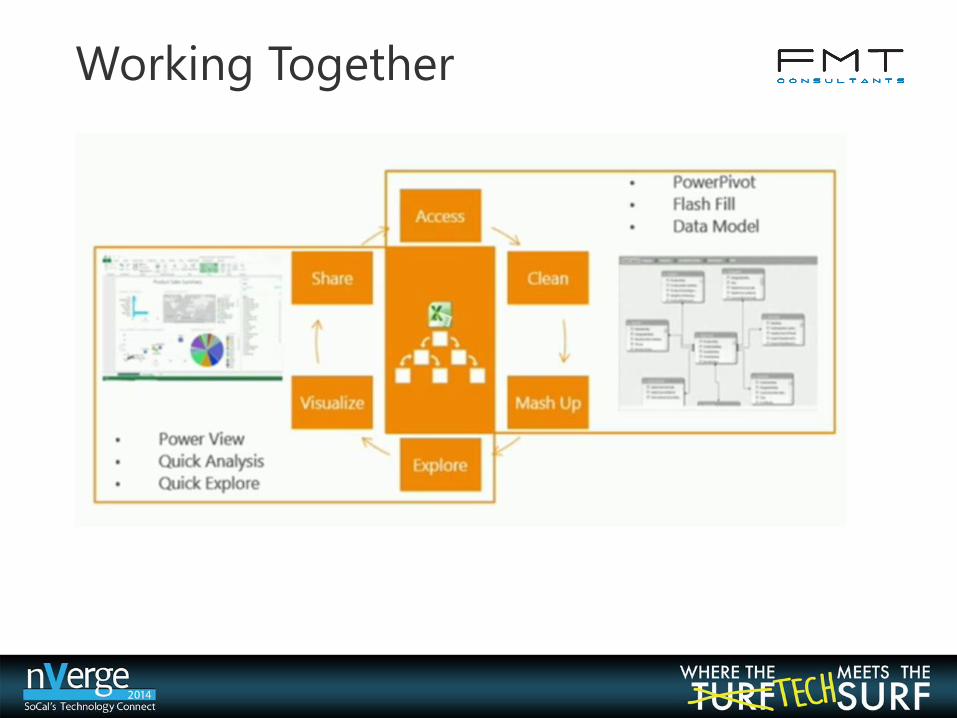
Working Together

Demo
Power BI for Office 365
• Share You Creations
• Ask Questions, Get Answers
• Access From Anywhere
Power BI for Office 365

Demo
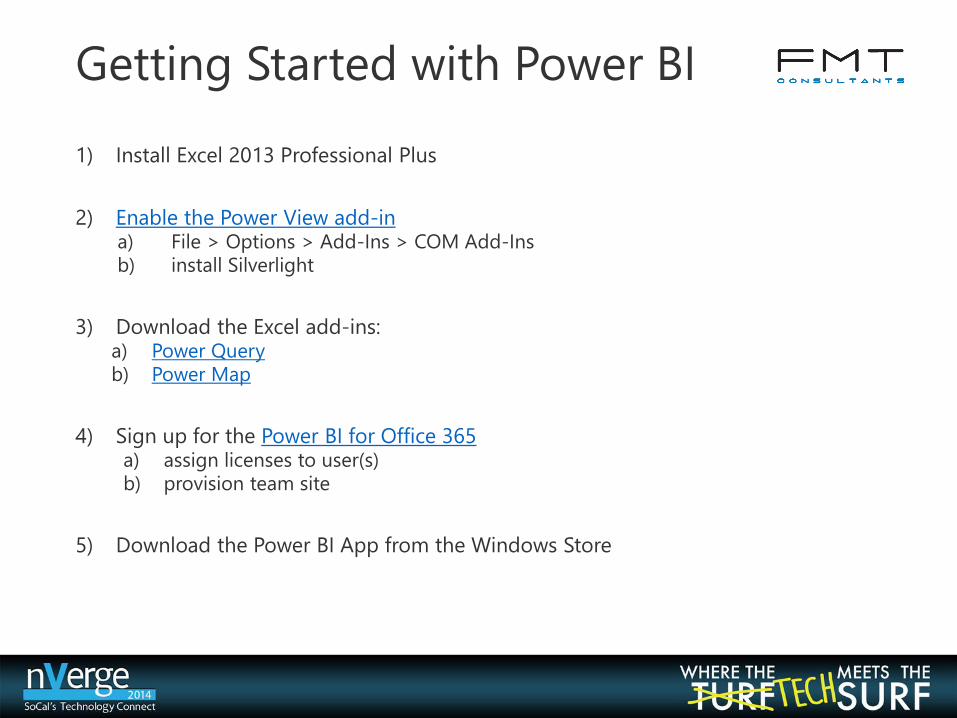
1) Install Excel 2013 Professional Plus
2) Enable the Power View add-ina) File > Options > Add-Ins > COM Add-Ins
b) install Silverlight
3) Download the Excel add-ins:a) Power Query
b) Power Map
4) Sign up for the Power BI for Office 365 a) assign licenses to user(s)
b) provision team site
5) Download the Power BI App from the Windows Store
Getting Started with Power BI

Q&A
Power BI is an umbrella name for many technologies and tools that blend well together. Excel is the “center of the universe” for all these tools, and works in combination with SharePoint Online.
Power BI is an environment power business reporting in the cloud. It lets you easily extract and transform data from both on-premises and cloud sources using Power Query. Then, you can shape your data model, enrich it with business logic using Power Pivot, and create gorgeous reports with both Power Map and Power View. Power BI sites allows you to share reports and data views via SharePoint Online, and Power BI Mobile allows those same reports to be seen on a mobile device. Data on-premises can be easily refreshed in the cloud thanks to the Data Management Gateway. Finally, Power BI Q&A allows you to query for data by entering a question and seeing the answer instantaneously.
PowerBI
• Power Query - Enables customers to easily search and access public data and their organization's data, all within Excel (formerly known as "Data Explorer").
• Power Pivot - For creating and customizing flexible data models within Excel
• Power View - For creating interactive charts, graphs and other visual representations of data
• Power Map - A 3D data visualization tool for mapping, exploring and interacting with geographic and temporal data.
Self Service BI Features
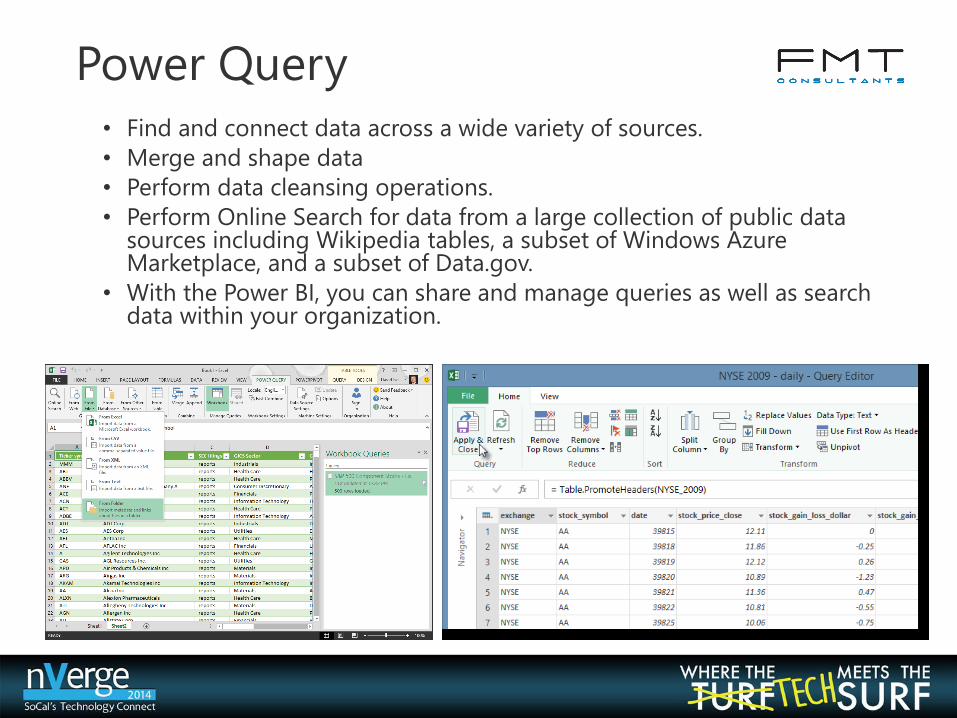
• Find and connect data across a wide variety of sources.
• Merge and shape data
• Perform data cleansing operations.
• Perform Online Search for data from a large collection of public data sources including Wikipedia tables, a subset of Windows Azure Marketplace, and a subset of Data.gov.
• With the Power BI, you can share and manage queries as well as search data within your organization.
Power Query
Power Query
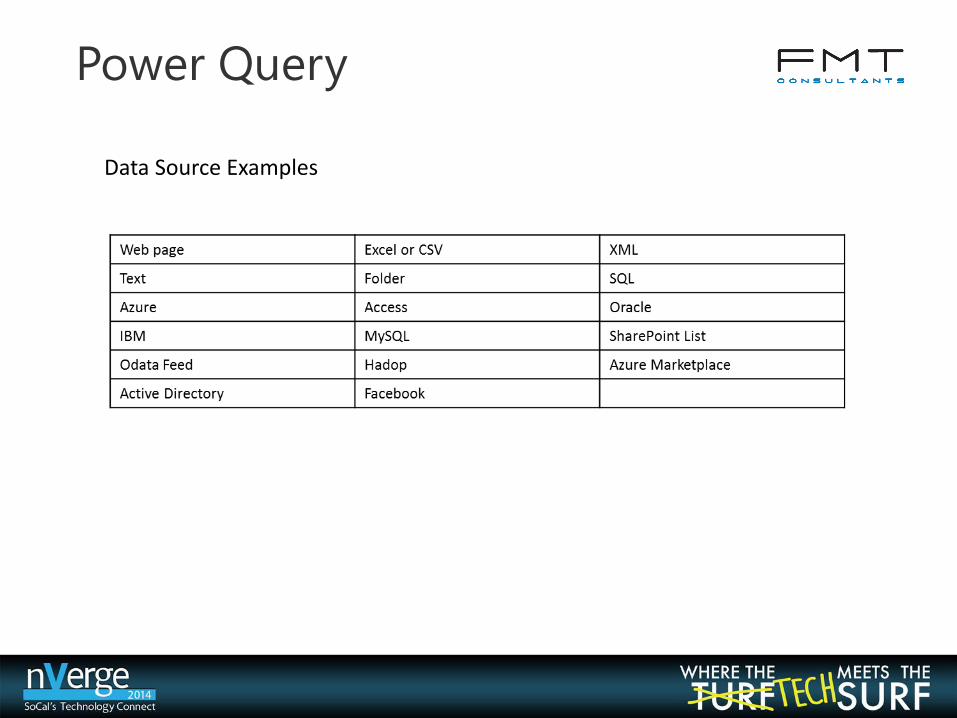
Data Source Examples
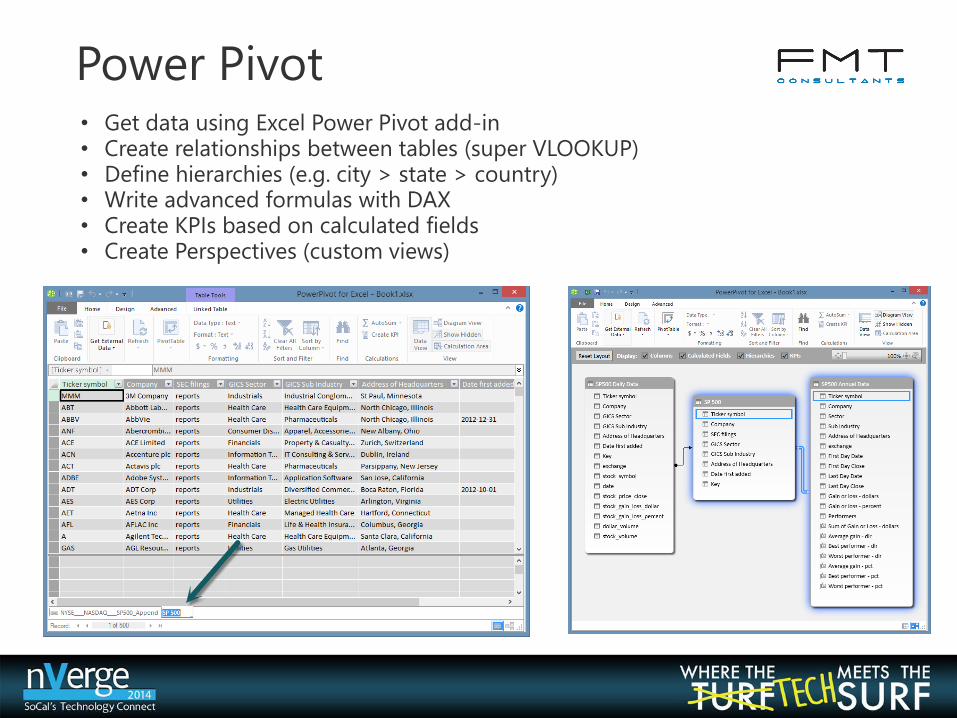
• Get data using Excel Power Pivot add-in• Create relationships between tables (super VLOOKUP)• Define hierarchies (e.g. city > state > country)• Write advanced formulas with DAX• Create KPIs based on calculated fields• Create Perspectives (custom views)
Power Pivot
Power View
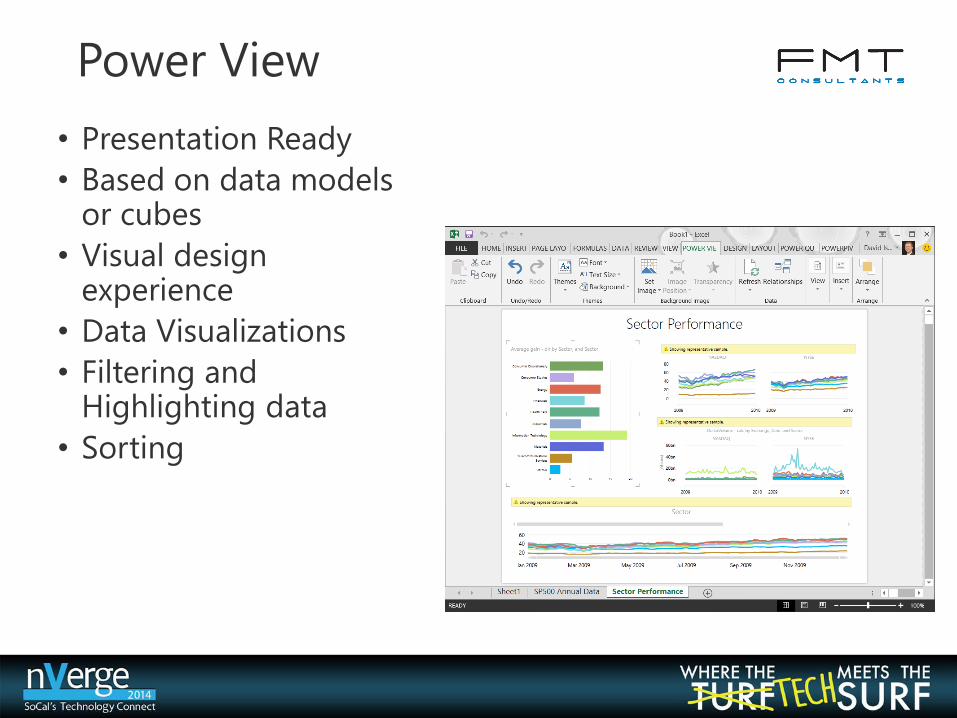
• Presentation Ready
• Based on data models or cubes
• Visual design experience
• Data Visualizations
• Filtering and Highlighting data
• Sorting
Power Map
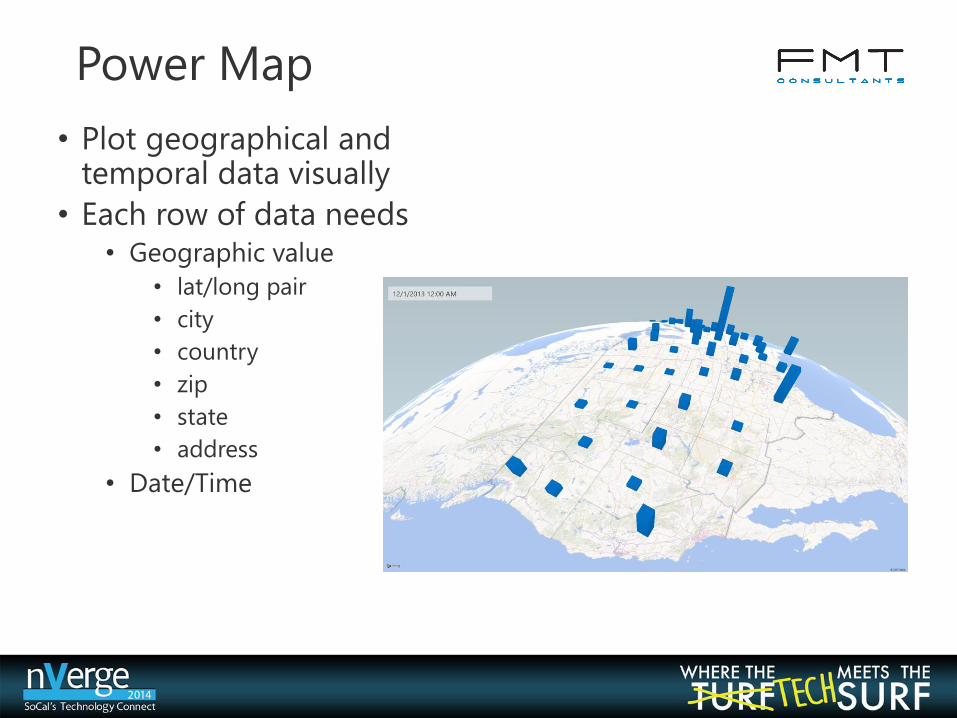
• Plot geographical and temporal data visually
• Each row of data needs• Geographic value
• lat/long pair
• city
• country
• zip
• state
• address
• Date/Time
• Power BI for Office 365 offers the Power BI sites application, which transforms a SharePoint Online site into a more robust, dynamic location to share and find Excel workbooks and provides a visual, interactive view tailored to BI. It also gives you easy access to other BI features available in Power BI for Office 365.
• The Power BI sites app is available when you subscribe to Power BI for Office 365 Preview. You can apply it to a new or an existing site in SharePoint Online Enterprise.
Power BI Sites

• Uses natural language query technology to provide you with immediate answers in the form of interactive charts and graphs based on the questions you type into the speech bubble.
• Cloud only feature for now but if successful will make it into On Prem versions of the software.
Power BI Q & A
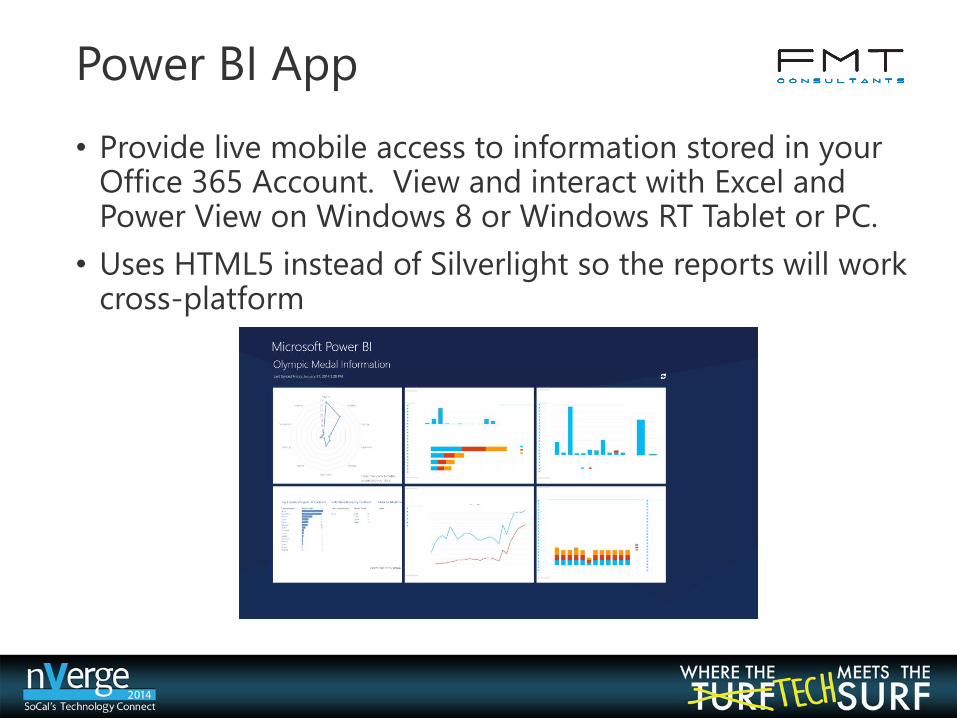
• Provide live mobile access to information stored in your Office 365 Account. View and interact with Excel and Power View on Windows 8 or Windows RT Tablet or PC.
• Uses HTML5 instead of Silverlight so the reports will work cross-platform
Power BI App
• Setup a Data Management Gateway for access to on prem data.
• Manually refresh data for report.
• Schedule refresh for report
• Data refresh of Power Query connections is not supported in the preview.
Data Management Gateway