1.1.1.1 Industrial and Financial Economics 1.2 Master’s Thesis
105
Graduate Business School School of Economics and Commercial Law Göteborg University Tutor: Knut Fahlén 1.1.1.1 Industrial and Financial Economics 1.2 Master’s Thesis EVALUATING COSTS AND BENEFITS WHEN IMPLEMENTING AN INFORMATION SYSTEM - A PDM system at Autoliv Inc. 1.2.1 Michael Tegstam & Joakim Weiner
Transcript of 1.1.1.1 Industrial and Financial Economics 1.2 Master’s Thesis

Graduate Business School School of Economics and
Commercial Law Göteborg University
Tutor: Knut Fahlén
1.1.1.1 Industrial and Financial Economics
1.2 Master’s Thesis
EVALUATING COSTS AND BENEFITS WHEN IMPLEMENTING AN INFORMATION SYSTEM
- A PDM system at Autoliv Inc. 1.2.1 Michael Tegstam & Joakim Weiner

1
ABSTRACT In the beginning of 1998, Autoliv Inc. took the decision to invest in a global information system (IS), and attention on how this investment could be evaluated was raised. In this thesis, a case study of Autoliv Sverige will be conducted, serving as an example for the rest of the Autoliv group.
The purpose of this thesis is to evaluate the potential IS benefits and dis-benefits, and to supply a decision base to facilitate an efficient further implementation of the IS at Autoliv Inc. This study includes an identification of cash inflows as well as cash outflows resulting from the system. It also includes an investigation and analysis of the potential subjective value effects resulting from the IS.
Primary data collected through interviews gave the required information about the current situation at Autoliv Sverige. Questionnaires were sent to three different groups in Autoliv Inc. to collect information about intangible benefits.
The case study on tangibles shows that the time to transfer the product data into the IS highly affects the result of the investment. The time it takes to learn the IS is vital for realizing the benefits. The proposed network has a large impact on the net present value of the investment.
The case study on intangibles shows that there is an overall consensus of opinions between the groups in the company about the PDM systems’ excellence in realizing the identified intangible benefit types. Autoliv Sverige is highly dependent on the other companies in the Autoliv group implementing the IS. Only then Autoliv Sverige is able to realize most of the benefits.
Key words: information system, information technology, product data management, IS – benefits & dis-benefits, evaluation, time-release, multiple –
2
gap analysis, Autoliv Inc.
Acknowledgements
We are grateful for the continuous help and support that we have received from primarily two persons.
Knut Fahlén, PhD at the School of Economics and Commercial Law, Göteborg University has provided irreplaceable methodological support and structural guidance throughout the entire process.
Magnus Dahlén, Manager of Engineering Process Development at Autoliv Inc. has always contributed with his time and valuable expertise when needed.

3
TABLE OF CONTENTS
1 INTRODUCTION ______________________________________________ 7
1.1 THE ASSIGNMENT ______________________________________7
1.2 BACKGROUND _________________________________________8
1.3 AUTOLIV INC. – THE ASSIGNER ___________________________9
1.4 PRODUCT DATA MANAGEMENT SYSTEM ___________________10
1.4.1 Matrix PDM system__________________________________10
1.5 STRUCTURAL DISPOSITION ______________________________11
2 PROBLEM, PURPOSE AND LIMITATIONS ________________________ 14
2.1 THE ROLE OF INFORMATION SYSTEMS TO ORGANIZATIONS______14
2.2 DIFFICULTIES IN MEASURING IS BENEFITS __________________16
2.3 PROBLEM DEFINITION __________________________________18
2.4 PURPOSE ____________________________________________19
2.5 SCOPE AND LIMITATIONS _______________________________19
3 METHOD ___________________________________________________ 21
3.1 RESEARCH DESIGN_____________________________________21
3.1.1 Case studies________________________________________23
3.2 DATA COLLECTION ____________________________________24
3.2.1 Type of Data _______________________________________24
3.2.2 Collected data ______________________________________25
3.2.3 Secondary data in the research_________________________26
3.2.4 Primary data in the research___________________________26
3.2.4.1 Personal interviews ____________________________________27
3.2.4.2 Questionnaires________________________________________30
3.3 SOURCES OF RESEARCH ERRORS__________________________35
3.4 SAMPLING PROCEDURE _________________________________37
3.4.1 Interview Sampling design ____________________________38
3.4.2 Questionnaire sampling design_________________________38
3.5 EVALUATION OF THE RESEARCH __________________________39
3.5.1 Validity ___________________________________________39

4
3.5.2 Reliability _________________________________________40
4 LITERATURE STUDY _________________________________________ 42
4.1 EVALUATION MODELS FOR TANGIBLE VALUE EFFECTS_________43
4.1.1 Cost avoidance _____________________________________43
4.1.2 Decision analysis____________________________________43
4.1.3 Impact or time release analysis_________________________45
4.1.4 Nominal breakeven analysis ___________________________46
4.2 EVALUATION MODELS FOR INTANGIBLE VALUE EFFECTS _______47
4.2.1 Return on Management _______________________________47
4.2.2 Strategic match analysis ______________________________48
4.2.3 Value analysis ______________________________________48
4.2.4 User attitude analysis ________________________________49
4.3 TECHNIQUES TO HANDLE THE FINANCIAL DATA ______________52
4.3.1 Net Present Value (NPV)______________________________52
4.3.2 Internal Rate of Return _______________________________55
4.3.3 Payback method ____________________________________56
4.3.4 Option Pricing Models _______________________________57
4.4 SUMMARY ___________________________________________59
5 COST BENEFIT CASE STUDY__________________________________ 60
5.1 IDENTIFIED TANGIBLE COSTS_____________________________60
5.2 IDENTIFIED TANGIBLE BENEFITS (TIME RELEASE) _____________64
5.3 COST BENEFIT ANALYSIS ________________________________70
5.3.1 Scenario calculations ________________________________71
5.3.2 Sensitivity analyses __________________________________73
5.3.2.1 Discount rate analysis __________________________________74
5.3.2.2 Transition time analysis_________________________________74
5.3.2.3 Learning time analysis__________________________________76
5.4 COST BENEFIT SUMMARY _______________________________78
6 CASE STUDY ON INTANGIBLES________________________________ 79
6.1 INTANGIBLE COSTS ____________________________________79
6.2 INTANGIBLE BENEFITS __________________________________81
6.3 GAP RESULTS _________________________________________85

5
6.4 GAP ANALYSIS _______________________________________88
6.4.1 Response variability _________________________________92
6.4.2 Performance analysis ________________________________94
6.5 OPEN ENDED QUESTION ANALYSIS ________________________95
6.6 SUMMARY ___________________________________________96
7 CONCLUSIONS AND RECOMMENDATIONS ______________________ 96
7.1 TANGIBLES __________________________________________97
7.2 INTANGIBLES _________________________________________97
7.3 FURTHER RESEARCH ___________________________________98
BIBLIOGRAPHY_________________________________________________ 100
APPENDICES ______________________________________________104 1 INTERVIEW GUIDE____________________________________________
2a Questionnaire and cover letter; Top management ________________
2b Questionnaire and cover letter; SPDM ________________________
2c Questionnaire and cover letter; End users ______________________
3a Tangible costs ____________________________________________
3b Tangible costs with network _________________________________
4 NPV CALCULATION ______________________________________________

6
List of figures and tables FIGURE 1.1 DISPOSITION OF THE THESIS ............................................. 12
FIGURE 3.1: TYPE OF RESEARCH ............................................................ 22
FIGURE 3.2; QUESTIONNAIRE DESIGN ................................................. 31
FIGUR 3.3 SOURCES OF RESEARCH ERRORS ...................................... 36
FIGURE 3.4: SAMPLING PROCEDURES .................................................. 38
FIGURE 4.1 DECISION ANALYSIS MODEL ............................................ 44
FIGURE 4.2: GAP ANALYSIS CONCEPT ................................................. 51
TABLE 5.2 TRAINING COSTS .................................................................... 63
TABLE 5.3. TIME RELEASE........................................................................ 68
TABLE 5.4 TIME RELEASE IN FINANCIAL TERMS .............................. 69
FIGURE 5.1 DISCOUNT RATE SENSITIVITY .......................................... 74
FIGURE 5.2 TRANSITION TIME ANALYSIS............................................ 75
FIGURE 5.3 LEARNING CURVE ................................................................ 77
TABLE 5.5 LC ALTERNATIVES................................................................. 77
FIGURE 6.1: GAP ANALYSIS CONCEPT ................................................. 86
TABLE 6.1 QUESTIONNAIRE RESULTS .................................................. 87
FIGURE 6.2: QUESTIONNAIRE RESULT SNAKE DIAGRAM. .............. 88
TABLE 6.2: QUESTION GAPS..................................................................... 91
FIGURE 6.3: GAP SNAKE DIAGRAM........................................................ 92
TABLE 6.3 RESPONSE VARIABILITY ...................................................... 93
TABLE 6.4 PERFORMANCE SCORE EVALUATION ............................. 94
TABLE 6.5 USER REMARK FREQUENCY TABLE.................................. 95

7
2 INTRODUCTION
2.1 The assignment Autoliv Inc. had taken the decision to invest in a global information system (IS), and the attention was turned towards how this investment could be evaluated. From the experience of other companies and the technical specification of the IS, Autoliv reasoned that the system will improve the various areas of the engineering process. The engineering time for searching information, such as information about drawings and change documents, could be reduced as well as drawing transfers between companies and change management administration. If all or some of these areas in the engineering process improve, it will naturally reduce costs in the corporation. The question is to what extent, and how much it translates to in money saved. Will other departments’ processes also be positively affected? Some components of the engineering process might greatly gain from the IS, but these benefits are not possible to quantify. The IS will, for example, make it possible to efficiently transfer projects from one location to another within the organization. Furthermore, it will make it possible to run truly global projects with members at different locations. This research study will evaluate the tangible1 benefits and costs of the IS, and attempt to analyze intangible2 benefits and dis-benefits (dis-benefits are the same as value effects that negatively affect the result). An evaluation of the IS on a global scale is too extensive a task for a Master’s thesis in the limited time period available. Instead, a case study of Autoliv Sverige (ALS)3 will be performed and work as an example for the rest of the corporation.
1 Value effects that directly affects the profitability. 2 Value effects that indirectly affects the profitability. 3 From now on ALS will be used in the thesis.

8
2.2 Background The role of information technology (IT) in the business arena has continuously shifted in the last decades. Information Technology (IT) is an expression for computer based decision processes and information handling in organizations. The systems that are created with IT as a base for different applications aimed to handling information are commonly referred as Information Systems (IS) (Curtis 1995). At the time it became a commercial reality more than forty years ago, IS applications automated clerical and operational functions, such as transaction processing for payroll and order processing. These early business applications focused on highly structured problems and the forecasting of resulting benefits and costs of these investments were quite precise (Cash, McFarlan and McKenney, 1992). The information systems have been transformed from the simple local data administrative system to global enterprise systems providing information communication on a highly complex level (Cash, McFarlan and Mckenney, 1992). With the sophistication and richness of the systems, come the investment costs. In the last five years, many large corporations have spent millions of dollars in new IS. They have also employed vast numbers of staff, including programmers, computer managers, project managers, IS directors, etc. In addition, the implementation of these systems requires many resources, for example when training personnel. Many top managers are becoming more and more uncomfortable with the rate of IS spending, and the inability to clearly see its financial benefits and costs. Many corporations evaluate their IS but most of them run into difficulties, as they are unable to find appropriate methods and measures. Naturally, these investment evaluations are of highest interest to those corporations developing and selling the IS. They often also offer their customers evaluation services. However, their opinion is subjective in this issue and the managers would rather like an objective IS evaluation performed. This research paper aims at performing an evaluation of the benefits and dis-

9
benefits resulting from an implementation of an information system in an industrial corporation.
2.3 Autoliv Inc. – The Assigner Autoliv Inc. is a global corporation, which about one year ago started a huge implementation process of an information system that connects all product data globally in the Autoliv group. The corporation with the headquarters in Sweden is developing, manufacturing, and marketing car occupant restraint systems,. All major car manufacturers are customers of Autoliv, and the market share is extra high in those companies leading the development of car safety4. In 1997, Autoliv AB merged with an American company, Morton ASP. The two companies were of approximately the same size before the merger and strong competitors. Through the merger they became one of the leading companies in their market. In 1998, Autoliv became the sales leader in its industry with total sales close to $ 3,5 billion, an increase of 7%. Net income increased by 2%, although the R&D expenses increased by 15%. According to the annual report, the company strategy consists of four major areas:
• Global expansion • Product line expansion • Cost reduction • Excellence in quality
The organization has become very large in a short period of time. The number of employees has grown from about 9,000 before the merger to about 25,000 currently employed. The company has operations in around 30 countries and the number of factories is continuously increasing. The corporation is often the development partner to the car manufacturer when new car safety systems are developed. In order to realize the goals of the company strategy, Autoliv Inc. must develop strong management tools. Autoliv has invested in such a
4 Autoliv Annual Report 1998.
10
tool when they took the decision to purchase a global information system, more specifically a Product Data Management system.
2.4 Product Data Management system Product Data Management systems (PDM)5 provide a structure in which all types of information used for manufacturing and supporting products are stored, managed, and controlled. Typically, PDM will be used for electronic documents, digital files, and database records. Examples may include: CAD drawings, product configurations, specifications, images, part definitions, geometric models, project plans, etc. In short, any information needed throughout a product’s life can be managed by a PDM, making correct data accessible to all people and systems that have a need to use them (CIMdata, 1999). Furthermore, PDM is a tool that helps engineers and others to manage both data and the product development process. IT keeps track of the huge amounts of data and information required to design, manufacture or build, and then support and maintain products. PDM is not limited to managing only the design cycle but can also manage product conception, manufacturing, prototyping and testing, operation, and maintenance. The product development process as well as the data are managed. PDM systems can also control product information, states, approval processes, authorizations, and other activities that impact on product data. 2.4.1 Matrix PDM system Matrix is a PDM system developed by a U.S. company named MatrixOne Inc. The company was founded in 1995 and is consequently a young company but has a solid and very successful flagship product in the Matrix system. They already have over 300 customers and about 50,000 licenses sold all over the world. By working with global system integration and consultant partners
5 From now on, Product Data Management System is referred to as PDM.

11
such as the Big Five6, Oracle Corp., and Computer Science Corp., their global expansion continues to grow rapidly. A number of upgraded versions of the Matrix system have been released. Currently, Matrix is marketing their newest version, the eMatrix, which is a web-based application. Autoliv AB did not have a PDM system at the time of the merger with Morton ASP, but was about to make such an investment. Morton ASP purchased a PDM system as early as in 1993 from Sherpa Corporation. By July 1994, all engineering data was controlled by and run through the PDM system. Thus, it was integrated with the CAD system and the ERP system7. From then on, the system was enhanced and improved and before the merger it was effectively used in all Morton U.S. plants as well as in the Amsterdam plant and Stuttgart plant. After the merger, discussions were held in the newly formed company regarding the information system strategy. It was concluded that the PDM system from Sherpa needed to be updated to successfully handle the year 2000. Finally, in 1998, a decision was made to invest in a new global PDM system supplied by MatrixOne Inc.
2.5 Structural disposition This thesis consists of seven chapters. The work process and the contents of each chapter are described in the figure below. 6 Big Five is a collective name for the five largest, leading consultancy firms; Andersen Consulting, Deloitte & Touche, Ernst & Young, KPMG, PriceWaterhouseCoopers. 7 CAD stands for Computer Aided Design; ERP stands for Enterprise Resource Planning.
1. Intoduction
2. Problem
3. Methodology
5. Cost benefit case study
6. Case study on intangibles
4. Tangible model evaluation
Intangible model evaluation

12
Figure 1.1 Disposition of the thesis
In Chapter 2 the research problem will be discussed and defined. The purpose with as well as the scope and limitations of the study will be specified. In the third chapter we discuss the choice of method and the research design. A presentation of the techniques to collect primary data in the case study is offered. We also discuss factors that might influence the validity and the reliability of the findings. In Chapter 4 a presentation of the findings of the literature study is made. Two parallel studies are conducted, one on the models that aim to evaluate the tangible benefits that result from an IS and another study on the models that aim to evaluate the intangible benefits. The relevant models are discussed and evaluated as are the proper techniques to handle the financial data. In Chapter 5 the course of action in the Cost benefit case study is presented. The result and analysis of the cost benefit research are also presented in this chapter. A parallel study, the case study on the intangibles is presented in Chapter 6. The course of action as well as result and analysis of the study are also presented here. The seventh chapter consists of the conclusions that can be drawn from our research, separately and combined. We also provide suggestions as to what contribution the results together can make to facilitate and improve the further

13
implementation process at Autoliv. Proposals for further research are also given.

14
3 Problem, Purpose and Limitations According to Farbey, Land and Target (1993), the explosion of the interest in IT and IS is based on two factors: (1) Technological development and (2) Competition situation. The technological development within areas such as telecommunication cables and computer processor speed pushes the development in IT and IS and continuously creates new opportunities. The organization’s competition situation more or less demands better and faster systems and technologies to be able to compete on the increasingly global market. There are obvious difficulties in measuring the effectiveness of the IT department due to the multifaceted organizational effects IS (and IT in general) generates. Since the IT department is competing for resources with other departments, it is essential that there are credible ways not only of identifying the benefits of information systems, both tangible and intangible, but also of measuring them.
3.1 The role of information systems to organizations The role of IS was previously more of a support; today IS is a central strategic resource to the organization. Much capital is invested in IS, often with unsatisfactory knowledge of the effects, and what is demanded in order to succeed with the implementation (Appelgate 1988). The information system alone creates no value to the organization. Value added can be achieved only when the technology and the system are applied and in use. When an IS is chosen, the important process of implementation begins. Much of the system’s future success is actually decided in this phase. The IS has to be adjusted to the reality and to some extent the organization has to adjust to the new IS. To succeed with the implementation education, flexibility, patience and probably also support from external professionals are needed. Factors that affect the result of the implementation process are often very complex with both direct and indirect dependency relations, which make this phase difficult to control. The deeper the knowledge of the IS, the

15
organization and the people within it is, the more custom-made implementation programs can be made, which most likely will result in a more successful implementation. The value of IS has been discussed extensively in the literature. The so called “productivity paradox” declares that there is no statistical significant evidence that IS increases the productivity in the organization (Hitt, 1996). Lately, however, research has shown that the paradox is uncertain. The main problem for Autoliv is that the organization is uncertain as to how to evaluate benefits and dis-benefits of the PDM system. Thus, the organization will not be able to decide whether the undertaken PDM system investment was valuable or not. Furthermore, Autoliv is uncertain of how to evaluate the implementation performed so far. As Autoliv is currently implementing the system worldwide, and still has a substantial part of the organization to cover, the continuous implementation plays a large role in the final evaluation of the investment. The system will be implemented in all plants worldwide with a set of standard functions. In the first implementation phase, the system will handle three major areas:
• Part structure, which is how parts are connected to each other. • CAD system with drawings • Change management of part structure and CAD data
By making these three areas more effective, Autoliv hopes that the system will improve the engineering process in the following areas:
• Reduce the engineering time for searching information, drawing transfer between companies, change management administration, etc.
• Make it possible to efficiently transfer projects from one location to another within the organization.

16
• Make it possible to run truly global projects with members at different locations.
If all or some of these components in the engineering process are improved, it will naturally reduce costs in the organization. The question is to what extent the engineering process will improve, and how much it translates to in real money saved. Will other departments’ processes also be positively affected? The PDM system has the potential to be one of the most important tools when improving the organization. It is therefore vital that not just a few departments but the entire organization create the competence needed in the IS. According to Eason (1998 ) and others, preparations and continuous improvements as well as education are the most vital aspects in order to succeed with the IS investment.
3.2 Difficulties in measuring IS benefits To be able to evaluate an IS one has to have a good command of the techniques of measuring the value effects occurring from the system. Remenyi (1997) describes two generic categories of IS benefit, which can be referred to as tangible and intangible. A tangible IS benefit is one which directly affects the profitability, whereas an intangible IS benefit is one which can be seen to have a positive effect on the business, but does not necessarily directly influence the profitability. Within the broad categories of tangible and intangible benefits a further classification is required, as different types of benefits may be quantifiable or unquantifiable. A quantifiable tangible IS benefit is one which directly affects the profitability and the effect of which is such that it may be objectively measured. Examples are reduction in costs or an increase in revenue. An unquantifiable tangible IS benefit can also be seen to directly affect the profitability, but the precise extent to which it does cannot be directly measured. Intangible benefits can also be sub-classified in the same way. This thesis deals with the task of identifying all possible benefits that the PDM

17
system at Autoliv might lead to. As discussed above, this does not mean that each and every identified benefit is possible to quantify accurately. The quantifiable intangible benefits, for example obtaining information faster, improving staff satisfaction or achieving better customer satisfaction, are possible to measure, but it demands several assumptions and approximations. It is, however, the case that one needs full information about the situation both before implementation and after the system has been running for a time. Since we are in the middle of the implementation process when conducting this research, there is no possibility of receiving the data necessary. The only benefits possible to quantify are the tangible quantifiable benefits. From now on when we refer to tangible benefits, we mean quantifiable tangible benefits. When referring to intangible benefits, we include unquantifiable tangible benefits. There is no such thing as an implementation of a new system without any dis-benefits8: that is, no downside. It is important to understand the possible dis-benefits, to be able to discover them quickly, and minimize the magnitude of them. According to Remenyi (1995), potential dis-benefits are of two kinds: (a) those, which are caused by a badly executed implementation, and (b) those that are inherent in the change, which no amount of planning or forethought could completely eliminate. In the first kind, the problem might be a failure to achieve the level of benefits forecast. It might also involve some unforeseen negative factors of the implementation, for example poor communication leading to industrial action. In the second kind, the task is to recognize the existence of dis-benefits, and to manage them. These inherent dis-benefits are not the same as a lack of benefits, and they might more usefully be thought of as costs. The purpose of the IS investment is most crucial to the process of defining the approach to its evaluation and to its performance measurement. IS investment that is used to improve efficiency requires efficiency measuring techniques. IS investment which has been implemented to enhance management
8 A dis-benefit is equal to a negative value effect. Thus, direct cost is one kind of dis-benefit.

18
effectiveness, business advantage, or business transformation requires more difficult measuring techniques, such as strategic analysis, relative competitive performance, etc.
3.3 Problem definition Information technology investments are increasingly important to organizations and they require more and more resources. Autoliv Inc. has made an information system investment that aims to further integrate the companies within the Autoliv group and create new opportunities to increase their competitive advantage in the field of automobile safety restraint systems. The difficulties in measuring the value effects of such an investment make it complex and time-consuming to evaluate, but not less important. The main problem for this research is: how can Autoliv Sverige improve the remaining implementation process of the PDM system, in order to minimize potential dis-benefits and costs and maximize potential benefits? The problem can be divided into the following sub-problems: 1A There are a number of models that deal with the task of measuring the
tangible values resulting from an IS investment. The first sub-problem is that the literature does not provide a single model for measuring the tangible value effects in the complicated case of Autoliv and the global PDM system.
B The empirical problem is that Autoliv does not know which tangible benefits and dis-benefits the investment results in, and how to evaluate them. The identification of the benefits and dis-benefits provides information about the possible cost saving locations and also where additional resources should be directed. Together with the collected information the model works as the basis for evaluating the tangible benefits and dis-benefits of the PDM-system at ALS.
2A As previously discussed, one single model cannot measure all types of benefits and dis-benefits. The problem is the lack of models that

19
measure intangible benefits in the literature. Autoliv cannot evaluate the PDM investment accurately without regarding the intangible value effects that arise.
B The empirical problem is that Autoliv does not know what intangible benefits and dis-benefits that arise from the PDM investment, and how to evaluate them.
3.4 Purpose The purpose of this thesis is to evaluate the potential IS benefits and dis-benefits, and supply a decision base to facilitate an efficient further implementation of the PDM system at Autoliv Inc. This includes an identification of cash inflows as well as cash outflows resulting from the system. It also includes an investigation and analysis of the potential subjective value effects resulting from the IS. The main purpose is divided into two sub purposes to gain a better understanding of what the thesis aimes at performing. 1) By a literature study identify and describe existing models and evaluate their usefulness in the Autoliv case. The degree of usefulness is determined by the coherence with the model’s initial assumptions about type of IS, point in time to perform the evaluation, etc. 2) Apply relevant (chosen) models to the Autoliv case and produce information for improved decisions and in the extension for a more efficient implementation.
3.5 Scope and Limitations • A future fully developed PDM system at Autoliv Inc. will include
several features that this study does not investigate. The focus of this research will be on the features of the first version of the PDM system,
20
which includes three major areas: (1) Part structure, (2) CAD systems with drawings and (3) change management of part structure and CAD data.
• The PDM system is going to be implemented at all the six major companies in the Autoliv group. This study only covers the PDM system of ALS. The benefits of the PDM system at ALS will of course be heavily dependent on the fact that the other companies are implementing it as well. However, it is too big an assignment to investigate the entire Autoliv Inc.
• The cost benefit analysis cannot be directly applied to other companies within the Autoliv group. Reasons include different initial situations regarding systems and timing. In addition, the analysis is performed on a marginal costing basis.
21
4 Method This chapter contains a thorough description of how this research is conducted. We will explain the design of the research as well as the different types of data collected. We will also discuss possible sources oferror and discuss the validity and reliability of the research.
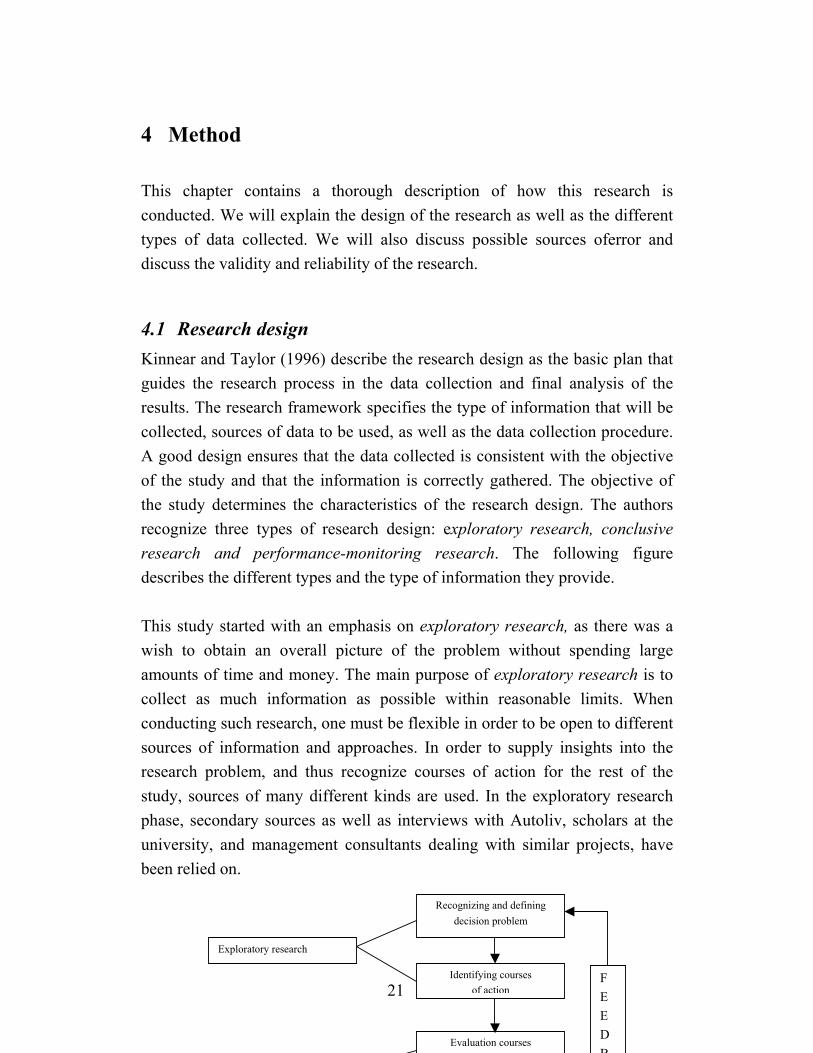
4.1 Research design Kinnear and Taylor (1996) describe the research design as the basic plan that guides the research process in the data collection and final analysis of the results. The research framework specifies the type of information that will be collected, sources of data to be used, as well as the data collection procedure. A good design ensures that the data collected is consistent with the objective of the study and that the information is correctly gathered. The objective of the study determines the characteristics of the research design. The authors recognize three types of research design: exploratory research, conclusive research and performance-monitoring research. The following figure describes the different types and the type of information they provide. This study started with an emphasis on exploratory research, as there was a wish to obtain an overall picture of the problem without spending large amounts of time and money. The main purpose of exploratory research is to collect as much information as possible within reasonable limits. When conducting such research, one must be flexible in order to be open to different sources of information and approaches. In order to supply insights into the research problem, and thus recognize courses of action for the rest of the study, sources of many different kinds are used. In the exploratory research phase, secondary sources as well as interviews with Autoliv, scholars at the university, and management consultants dealing with similar projects, have been relied on.
Exploratory research
Recognizing and defining decision problem
Identifying courses of action
Evaluation courses
F E E D B

22
Figure 3.1: Type of research (Kinnear and Taylor, 1996)
Conclusive research provides information which helps the manager evaluate and select a course of action. Moreover, this type of research is characterized by formal research procedures. A detailed questionnaire is often used together with a formal sampling plan. The research approaches are surveys, experiments, observations, and simulations. The hypotheses established in the exploratory research are investigated. This investigation can be structured in a descriptive and a casual type of research. The research changed emphasis toward a conclusive research design as questionnaires and personal interviews were carried out. The questionnaire is a descriptive form of research and the personal interview is a casual form of research. Both forms are described below. The descriptive form of research is used for describing relationships or states, which are either history or can be currently observed. The vast majority of marketing research studies involves descriptive research. It is appropriate when the research objectives, as in our case, include: (a) describing the characteristics and determining the frequency of occurrence; (b) determining

23
the degree to which variables are associated; (c) making predictions regarding the occurrence of the different phenomena. The casual research is designed to collect facts or verification of the cause-and-effect relationships present for example in the marketing system. As the decision-making process requires assumptions to be made about these cause-and-effect relationships, businessmen and scholars are interested in the reality. It requires a planned and structured design that will not only minimize systematic errors and maximize reliability, but will permit reasonably unambiguous conclusions regarding causality. The interview research is a casual form of research since its research objective is to understand which variables are the causes of what is being predicted and to focus on understanding why things happen. 4.1.1 Case studies As described earlier, identifying tangible and intangible benefits and costs is a complex task, which is really in focus when evaluating information system investments. Case studies are “especially useful in situations in which a complicated series of variables interact to produce the problem” (Kinnear and Taylor, 1996). Theories and models in the area of evaluating IS investments are still rather young and therefore not extensively developed. In addition, every IS investment is rather specific to the company in question. The possibility to draw specific conclusions from such a study and apply to other companies is very limited. At best, some general conclusions can be drawn. In such situation, a case study approach is appropriate to use. It is defined by Yin (1984) as: “… an empirical inquiry that: investigates a contemporary phenomenon within its real-life context, especially when the boundaries between phenomenon and context are not clearly evident”.

24
A case study enables the researcher to deeply study complex economical phenomena in the real environment of the study object. Moreover, the study will be up to date as the researcher is accessing fresh data from the company’s everyday operations. The case study of ALS will most probably give valuable information and guidelines for Autoliv Inc., since several companies in the corporation are similar to ALS in organizational structure and working methods. The disadvantages of performing a case study depend on the purpose of the study, the skills of the researcher, and the cooperation of the study object. The case study is a very deep but narrow study. If the narrowness causes problems, it could be a disadvantage. Another disadvantage is possibly caused by the bias resulting from the collected and presented data. Finally, the company in question may not want sensitive information to be disclosed. Therefore, interesting data might have to be concealed.
4.2 Data Collection One purpose of this thesis is to describe existing models by a literature study and evaluate their usefulness in the Autoliv case. For this, secondary data has to be collected. Another purpose is to apply relevant (chosen) models to the Autoliv case. For this to be possible, a case study is performed and primary data has to be collected. This section will present the type of data in the thesis and how it has been collected. It will also discuss the secondary data as well as the primary data in the thesis. The instruments used for the collection of primary data will be described and justified. 4.2.1 Type of Data A research method can be either qualitative, quantitative or a mixture of the two (triangulation).
According to Lekwall and Wahlbin (1993), quantitative data is primarily used when the questions are: How often? How much? How many, or how usual? In other words, there is an aspiration is to quantify the result. Hence, the

25
collected material is expressed in numbers and analyzed in a quantified way. The advantage with this method is the possibility that a prediction on the total population is possible, from an abundant sample. Quantitative data is generally equivalent with conclusive research methods. In the cost-benefit research, data is collected through personal interviews that are typically quantitative. The questions are: How much time does it take? and How often does this happen? The collected material is expressed in numbers and analyzed in a quantified way. From the sample interviewed a prediction on the total population is made. Kinnear and Taylor (1996) state that qualitative data is best used when the purpose is to understand or find a specific pattern in the area investigated. This approach is not intended to provide statistically or scientifically accurate data. Qualitative research is generally conducted as case studies or surveys with small samples, according to Lekwall and Wahlbin (1993). 4.2.2 Collected data The data sources available to the researcher can be classified as secondary or primary. Secondary data is already published data collected for purposes other than the specific research needs at hand. Such data can be classified as internal or external. Internal data is available within the organization, and external secondary data is provided by sources outside the organization. Primary data are data that has not been collected by anyone but has to be collected by us for this specific study. This thesis is based on both secondary and primary data.
In the beginning of a research project it is wise to seek information about the subject that has already been collected by other persons. The documents and the literature that are used in this thesis to find relevant secondary data are books, financial journals and articles. The information about relevant literature is collected from the library computer system GUNDA, CD-rom databases, the World Wide Web, and E-mail contacts with consultancy firms in Sweden.

26
4.2.3 Secondary data in the research The central advantage of using secondary data in comparison with primary data is savings in cost and time. It is important to search secondary data sources before proceeding to primary sources. Secondary data will not completely fulfill the requirements of our research project but they will (1) assist in the formulation of the decision problem, (2) help in the suggestion of methods and types of data for meeting the information needs, and (3) serve as a source of comparative data by which primary data can be interpreted and evaluated. Using secondary sources also brings a number of factors of uncertainty. One major disadvantage of secondary data relates to the extent of which the data fits the information needs of this specific project, that is the data is collected for another purpose than our specific research and therefore does not completely fit. Another disadvantage is that the data could be old and therefore inappropriate to our study. There are also difficulties of evaluating the accuracy of the data. There are a number of sources of error in the sampling, data collection, analysis and reporting stages of the research process that influence the accuracy of the data. These sources of error can be more easily evaluated when the researcher participates directly in the research process, as is the situation with primary research. To evaluate the accuracy of the secondary data sources used in this research the following questions were asked for each source:
• Who collected the data, an original source or an acquired source? • Could there be reasons for the author to distort the results of the
research? • For what purpose was the data collected? • With what methods was the data collected?
4.2.4 Primary data in the research Primary data is collected from interviews with employees at Autoliv and management consultants working with IT system issues. To get the required

27
information about the current situation at Autoliv, interviews with the future end users of the PDM system are performed. Questionnaires are used for collecting information about intangible benefits.
4.2.4.1 Personal interviews
A great measurable tangible benefit of the PDM system is the reduction of the engineering process time. This benefit was broken down to measurable smaller processes and tasks, which are described in section 5.1 Identified tangible benefits. The cost calculations are made on ALS basis, which makes it necessary to measure the total tangible benefits for all relevant departments in ALS. These include the production development, production, quality, purchasing, and marketing department. To be able to measure the real time saved, one has to know the “before-implementation” values and the “after-implementation” values. The purpose of the interviews is to collect information to create the average person in each department. To get the total time saving of the department, the values for the average person are multiplied with the number of users in the department. The “after-implementation” values were found by practical tests. The authors performed and clocked all the different tasks in the PDM system, except the performance of an engineering change. The looptime of an engineering change at ALS using PDM cannot currently be measured since the PDM system is not yet in operation. The measured values of the remaining tasks form the normal case scenario. Since no engineering process time studies have been performed at Autoliv before, the “before-implementation” values had to be collected as well. The alternative methods of how to collect this primary data were observations, questionnaires or interviews. For reasons discussed above we chose the latter method. Questions about time consumption were asked for each identified process/task. A general interview guide was designed (see Appendix 1) to help us structure the interviews. The guide was discussed and also tested in

28
two pre-interviews.9 The interview guide gave a new insight into the engineering process, which resulted in additional smaller processes and tasks that had to be measured. It also helped us to formulate the questions in an understandable way. A total of 40 interviews were performed. Each interview lasted between 30 minutes and one hour depending on the department. The interviewees were employees from each department directly affected by the new PDM system. Below is a description of the respondents in each department and which tasks and processes they are involved in. Production development department This department is the largest in size when it comes to the number of engineers affected by the PDM system. From totally 66 engineers that are affected, 17 were interviewed. The designers can be sub-divided into (a) group manager engineers and (b) engineers. Due to the differences in the work tasks between these two groups, interviews were made with persons in both groups. This department and the production department are the ones most affected by the PDM system. Most of their tasks will be affected by the system. Production department This department consists of four sub-departments; three product area departments and one production preparation department. Only 27 employees are directly affected by the PDM system and considered for an interview. Seven engineers were interviewed from these departments. A difference in PDM affected working tasks between this department and the production development department is that this department rarely handles external drawings, which the production development department spends time on. Furthermore, this department seldom spends time on informing external co-workers on drawing and change issues.
9 Since the five departments have different working tasks, some of the questions are not relevant to all departments.

29
Quality department This department has a total of 20 employees directly affected by the PDM system. Five of them were interviewed. These five persons work in different groups within the department. The quality department uses drawings continuously as the base for many of their working tasks. A problem for the quality engineers is that they have to retrieve the drawings from the Product development department or keep their own archive. If they wish to retrieve drawings from the other department, they spend much time running there. If they keep their own paper archive, they spend time on it. Every now and then they forget to file or update, and they have to run to the other department anyway. Currently, the quality department retrieves all their drawings from the product development department. Purchasing department In the purchasing department, 16 persons are directly affected by the PDM system. Four persons were interviewed. This department is not extensively affected by the PDM system. Most of the time spent on drawing and engineering change matters is, as in the quality department, because they need to retrieve and and check material. The purchasers need drawings to base their quotation requests on, and of course they need the correct issue. This department also keeps track of all Production Part Approval Process10 (PPAP). One fulltime employee administers a separate PPAP database, which in the future can be managed by the PDM system. Marketing department In the marketing department, 28 persons are directly affected by the PDM system. Seven employees were interviewed. This department is only slightly affected by the PDM system.
10 An approval process from QS-9000 all products have to pass before start of production.

30
4.2.4.2 Questionnaires
To investigate the intangible benefits that may occur from the PDM system a set of three questionnaires was used and distributed to three different groups of people in the organization. The questionnaires are aimed to measure the user information satisfaction as well as gaps in attitudes towards the PDM system between the groups. They include the same set of questions but with response options designed specifically for each group. The questionnaire is distributed through e-mail to all the respondents, which simplifies the distribution substantially in comparison to other forms of distribution (i.e. traditional mail or telefax distribution). The questionnaire was sent to three different groups in the organization. The first group, Top management, who has been involved with the IS specification of requirements and the final decision to invest, was required to state the relevance of each benefit type to the system by rating the benefit on a four point scale. This is a measure of the need which the firm has for each of the benefit types. There are four top managers. The second measure of benefits was obtained by asking the system developer project managers, the SDPM-group11, to answer the same set of questions relating to the 14 different benefit types. This data provides a second view of the potential benefits by obtaining an opinion as to what extent the project team believes the system, as it has been developed, can actually achieve the stated benefits. This is a measure of the expectations of IS professionals who have developed the system. There are eight SDPMs. The third measure of benefits was obtained by asking the users to complete a similar questionnaire. The questionnaire is attempting to collect data on the actual performance of the system. There are 998 end users. We are in the advantageous situation that we are able to collect user satisfaction data before the system is implemented. Our object of study is ALS
11 Within Autoliv called the EPT(Engineering Process Team) group

31
but at ASP the exact same PDM system has been in use for 1,5 years. This enables us to question the users in the U.S.A. and compare the answers to those of the international SDPM-group and the managers in Sweden. After deciding how primary data will be collected and from whom it will be collected, the design of the questionnaire will be discussed below. Questionnaire design According to Kinnear and Taylor (1990), the design of a proper questionnaire can be organized in seven steps. The sequence of the steps is arranged in such way that tasks early in the sequence will often influence decisions later in the sequence.
Figure 3.2; Questionnaire design (Kinnear and Taylor, 1990)
Before designing the questionnaire, several decisions must be made in the research. The research design and the sources of data directly influence the
Decide on question sequence
Pretest, revision, and final draft
Decide on physical characteristics
Decide on question wording
Preliminary considerations
Decide on question content
Decide on response format

32
questionnaire design, so when deciding on research design and investigating the possible sources of data, parts of the questionnaire design will automatically be formed. The respondent group highly influences the design of the questionnaire. The less homogenous the respondent group is, the more difficult it is to construct a single questionnaire which is suitable for everyone. The respondent’s ability and/or willingness to respond accurately influence the content of the questions. Inaccurate data can appear because, (1) the respondent is uninformed, and (2) the respondent does not remember fully. This is, however, not a major problem in this research. The questions in our questionnaires measure opinions of the respondents. Every respondent has an opinion; the problem might be that it takes some effort to reach it. The unwillingness to respond accurately is a greater risk. It could be reflected in (1) refusing to respond to a question, which results in non-response error, (2) deliberately providing an incorrect or distorted response to questions, which results in measurement error. The respondent’s willingness to answer a question is a function of his or her understanding of whether the data is needed for a legitimate purpose. To reduce the measurement error in this regard, we briefly explained the purpose and the importance of the research in the cover letter attached to the questionnaire. The questionnaire does not contain any personal or in other ways embarrassing questions that might be a reason for an unwillingness to respond. The questions are, however, asking the respondent about their attitudes concerning broad benefit areas, which they might not have thought of before. This may mean that they have to put some extra effort into trying to figure out what their actual attitude is. This in turn can be a source of unwillingness to respond. Once the problems related to the content of the questions have been analyzed, the next issue concerns the response format to use. We are using two types of questions: 1) unstructured in the form of open-ended questions, and 2) structured response format in the form of multiple-choice questions: 1) Open-ended questions require the respondents to provide their own

33
answer to the question. The questionnaire contains one open-ended question at the end. Open-ended questions influence responses less than multiple-choice questions. Respondents are not influenced by a predetermined set of response alternatives and can freely express views diverging from the researcher’s expectations. They also provide the opportunity to find additional benefit areas, which have not been detected yet. A major disadvantage of open-ended questions lies in the time and effort required to summarize the diverging responses in a format useful for data analysis and presentation.
2) Multiple-choice questions require the respondent to choose an answer from a list provided in the question proper or following questions. This type of questions can overcome many of the disadvantages associated with open-ended questions. Most importantly, they reduce interviewer bias and the cost and time associated with data processing. It is also difficult to maintain respondent cooperation unless the bulk of the questions have a structured response format. The disadvantage with multiple-choice questions is that the design of effective questions requires considerable time and cost. An exploratory study using open-ended questions is often required to formulate the response alternatives.
The structured response format used in the questionnaire includes answers with a certain scaling. According to Bernard (1971), the definition of scaling is a “procedure for the assignment of numbers (or other symbols) to a property of objects in order to impart some of the characteristics of numbers to the properties in questions.” One example is assigning a number scale to the different levels of heat and cold and call it a thermometer. In this thesis, the objective of the questionnaire is to identify each respondent group’s collective attitude to the PDM system’s ability. In other words, the respondents are used as judges of the object presented to them. Therefore, the same scaling data is used in all three group questionnaires. A scale is either rating or ranking. A rating scale has multiple response categories and is used when the respondent is scoring an object or attitude
34
without comparing it with other objects or attitudes. As the Autoliv respondents only present their attitudes of one PDM system, a rating scale is appropriate. A ranking scale would be preferable if the objective was to make a comparison between two or more systems. Our scale response format using four alternatives was taken from questionnaire research performed at Henley Management College by Berthon, Deon and Leyland (1995) in similar research with a similar subject. All questions except the last one are multiple-choice questions with the same scale including mutually exclusive alternatives. An even number of alternatives gives the advantage of forcing the respondent to choose sides. We are anxious to find out the attitude of the respondent and have therefore excluded the option “no opinion”. Four alternatives are used because this is regarded to be sensitive enough when measuring attitudes. It is difficult enough for the respondent to rate his/her opinion on a four-point scale; a six- or eight-point scale would only make the answer more approximate. The respondents are asked to agree or disagree with each statement. Each answer is given a numerical score to reflect the degree of favorable attitude, and then the scores can be summed up to show the respondent’s total attitude. This type of scale, a Likert scale, is useful when an improvement project has been performed in a company, such as Autoliv, and one wants to judge if the desired effects of the project were reached or not. Regarding the degree of preference, a scale can be designed in such way that respondents are asked to choose answers according to their own preference, or it may be designed with a non-preference evaluation. In the latter, the respondents are asked not to reveal any personal preference toward the objects. The aim of the Autoliv questionnaire is, however, to collect personal attitudes, so the degree of preference should be as high as possible. When designing questions, it is essential to try to use clear words12 and a phraseology that is consistent with the vocabulary of the respondent. It is also
12 In this context words that are “clear” have only one single meaning, which is known to all the respondents.

35
crucial that the researcher and the respondent assign the same meaning to the questions asked. If not, serious measurement error will be present in the research results. Leading questions have been avoided since they cause a constant measurement error in research findings. A leading question is one where the respondent is given a hint as to what the answer should be. The sequencing of the questions can influence the nature of the respondent’s answers and be the cause of serious errors in the survey findings. The flow of the questioning process has been arranged logically from the respondent’s perspective. Questions concerning the same benefit area are placed together. Questions regarding the area that might be found more simple to answer are placed first, and those related to the area that might be thought of as more difficult to answer are placed later in the questionnaire. The physical characteristics can be influential in securing the cooperation of the respondent. It is important that the respondent gets a good impression of the questionnaire, and that the researcher at the same time simplifies the answering procedure as far as possible. The questionnaire is distributed through e-mail to all respondents. To make it as easy as possible to answer, it is constructed as an Excel-document with one option button for each response alternative. Before the questionnaire is ready to be launched, it needs to be pre-tested and revised. Pre-testing refers to the initial testing of one or more aspects of the research design. In order to get new ideas about questions that should be asked and questions that are not relevant, the questionnaire was tested on and discussed with two persons, both with great knowledge in the area. This was useful in order to detect errors in the phraseology of the questions.
4.3 Sources of Research Errors When research is performed, there is a risk that errors occur which will lead to

36
inaccurate results. These errors can occur during the entire research process. It is important to identify and analyze these sources of errors to be able to minimize the number of errors and their affect on the result. Lekvall & Wahlbin (1993) describe the sources of errors in the research process as follows: Figur 3.3 Sources of research errors (Lekvall and Wahlbin, 1993)
1) Wrong purpose. An inaccurate purpose leads to an inaccurate information base. The effect is that the result is not relevant for the decisions that are to be made. This is mainly the consequence of a poor problem analysis. 2) Wrong direction and content. If the research task has the wrong approach and wrong content, the result get skewed/biased in relation to the information need. The reason could be inaccurate research limitations or that the research is not performed within the frame of the purpose. 3) Inference error and measurement error. The research approach and the data collection method could result in inference errors and measurement errors of different kinds. How these kinds of errors may arise and affect the research when conducting a questionnaire research was described in the previous section. Even secondary data can be subject to measurement and inference errors. Kinnear and Taylor (1996) define the criteria for determining the accuracy of
Def of the research
task
Choice of approach
and method
Data collection
Analysis and inter-pretation
Research result
Decision analysis
Decision situation
Wrong purpose
Wrong Direction and content
Inference error
Measurement error
Interpretation error

37
secondary data as: the data source, the evaluation of the purpose of the publication, and the quality of the data. Data sources can be derived from original or acquired sources. It is required to secure data directly from the original source rather than using acquired sources, as the original source is generally more detailed and more accurate. Details of the data collection and analysis process are usually described in the original source, which simplifies the search for and estimation of data errors. The purpose of the publication is important, as it is necessary to detect sources that would misrepresent or distort data to serve their own needs. The quality of the data must be satisfactory to be relevant to the study. The source must be thoroughly investigated in terms of data collection procedure, sampling plan, questionnaire technique and data analysis procedure, to avoid irrelevant and inaccurate data. The actuality between the event described and the date of the source is referred to as the contemporaneousness of the source. Usually a long period of time passes between the data collection, the data presentation and the use of the data, which can make the data inaccurate or irrelevant. 4) Working and interpretation errors lead to inaccurate results. This can be caused by handling the data wrong, insufficient ability to analyze, miscalculations or insufficient knowledge of how to use methods for analyzing in practice.
4.4 Sampling procedure According to Kinnear and Taylor (1996), one distinguishes between two groups of sampling procedures: non-probability sampling and probability sampling, as illustrated in the figure below:
Sampling procedures
Non probability Sampling - Convenience sampling - Judgement sampling - Quota sampling
Probability procedures - Simple random sample - Stratified sample - Cluster sample a) Systematic b) Area
38
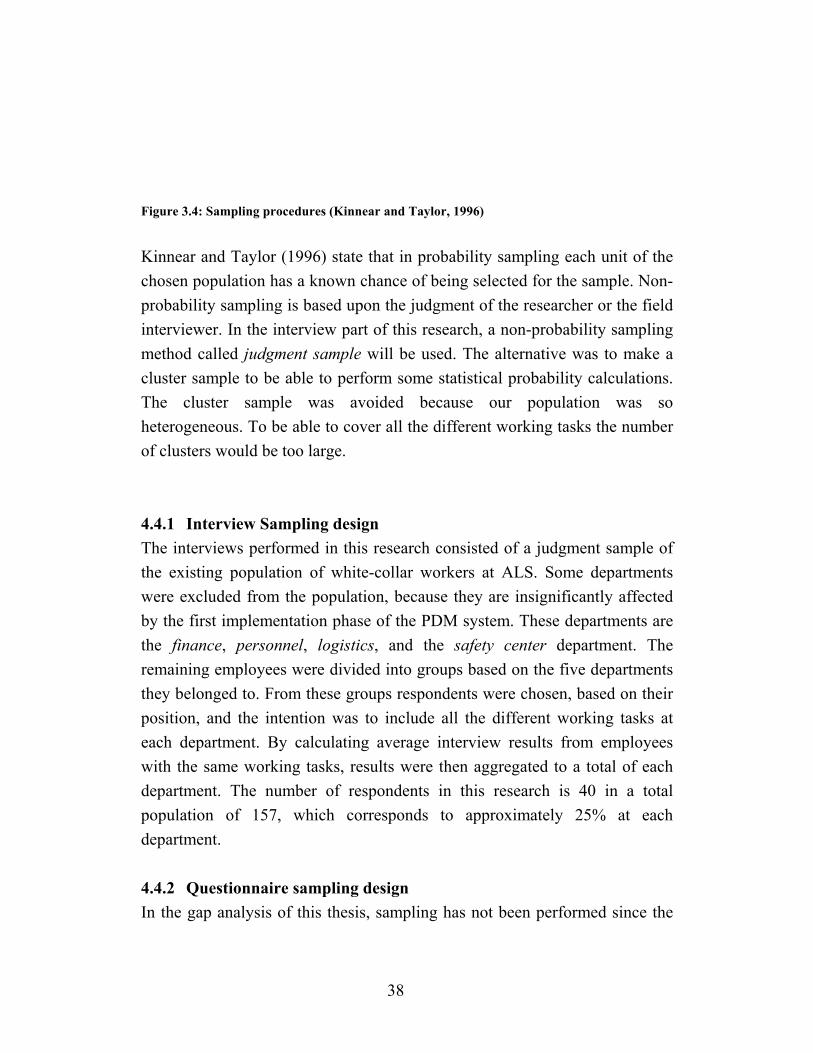
Figure 3.4: Sampling procedures (Kinnear and Taylor, 1996)
Kinnear and Taylor (1996) state that in probability sampling each unit of the chosen population has a known chance of being selected for the sample. Non-probability sampling is based upon the judgment of the researcher or the field interviewer. In the interview part of this research, a non-probability sampling method called judgment sample will be used. The alternative was to make a cluster sample to be able to perform some statistical probability calculations. The cluster sample was avoided because our population was so heterogeneous. To be able to cover all the different working tasks the number of clusters would be too large. 4.4.1 Interview Sampling design The interviews performed in this research consisted of a judgment sample of the existing population of white-collar workers at ALS. Some departments were excluded from the population, because they are insignificantly affected by the first implementation phase of the PDM system. These departments are the finance, personnel, logistics, and the safety center department. The remaining employees were divided into groups based on the five departments they belonged to. From these groups respondents were chosen, based on their position, and the intention was to include all the different working tasks at each department. By calculating average interview results from employees with the same working tasks, results were then aggregated to a total of each department. The number of respondents in this research is 40 in a total population of 157, which corresponds to approximately 25% at each department. 4.4.2 Questionnaire sampling design In the gap analysis of this thesis, sampling has not been performed since the

39
entire population of the three survey groups was targeted with a questionnaire distributed by e-mail. The number of responses can, however, be viewed as a simple random sample of the population. The problem arising then is if the sample can be viewed as representative of the population. The possible sources of inference and measurement errors are discussed in section 3.5.
4.5 Evaluation of the research There are methods to determine the validity and reliability of a research project. These methods are very complicated and time-consuming. Therefore, this evaluation does not aim to determine, but rather to discuss the validity and the reliability of the study. 4.5.1 Validity Traditionally, validity means that the reader should be able to evaluate whether the used instrument actually measures what it is supposed to measure (Starrin, 1991). One talks about inner and outer validity. Inner validity represents how well the concept of the model matches with the operational (measurable) definitions of it. Outer validity represents the match between reality and the measured value that is received when using an operational definition. The inner validity has been improved by supporting the questions asked by thorough literature studies, the interview questions as well as the questionnaire. Before the questionnaire was ready to be launched, it was pre-tested and revised. In order to test the phraseology and the content of the questions, two people, both with great knowledge of the area, were consulted through personal interviews. The literature used is deemed to be of high quality and has therefore contributed to increase the validity. The research by Berthon, Deon, and Leyland (1995) was performed in a similar way with a similar subject but was not scientifically reviewed. The questionnaire is nevertheless a part of a thesis done at the Henley Management College in 1995. It is therefore assumed to

40
have satisfactory validity. There are, however, conditions that lower the validity of the questionnaire research. The end-users questioned are from another country than the target company of this research, which means that they are working in an organization with different values and standards. The differences in the frame of reference between the employees in the USA and the employees in Sweden lower the representativity. Before implementing Matrix PDM system Autoliv ASP13 was using an older PDM system. ALS has never used any PDM system, as they are using Movex database for storing simple product data, combined with a paper system to handle product data. These differences between the two companies may have affected the representativity. However, the respondents were however requested to state their perception of the actual performance of the specific Matrix PDM system. This perception shall not be distorted by the fact that the starting situations were different. 4.5.2 Reliability Reliability means that the measurement tool must give reliable and stable results. If the measuring method really does measure exactly the aspects and facts that were set out be examined, the research has a high reliability (Wiedersheim, 1991). The method must also be independent from the researcher. A research project has high reliability if the researcher receives the same result every time he/she performs the analysis.
The questionnaires and the interview guide were designed to give results of high reliability. All but one question in the questionnaires are multiple-choice questions. In the attached introduction letter, great effort was made at explaining the purpose of the research. The questionnaire used clear words and a phraseology that is hopefully consistent with the vocabulary of the respondents. The number of end-user respondents that completed the questionnaire was, however, only 91. This corresponds to a high non-response rate. However, the 91 respondents can be viewed as a sample from the 13 All U.S. operations of Autoliv. From now on ASP is used in the text.

41
population. Then, statistical conclusions can be drawn based on this sample. The problem that may arise from assumption is that the respondents that answered might not be representative of the population. This source of sample error must be considered when interpreting the results for the end users.
According to statistical literature, a sample of >30 is enough to be able to approximate under normal distribution14. Under the assumptions of normality and equidistance15 it is possible to perform a T-Test and receive confidence intervals of the differences. Considering problems with mass-significance16 due to the number of questions, a 99% Confidence level (rather than 95%) for each question17 is used. The reliability of our calculations in the cost benefit case study is discussed in the theory section.
14 See for example Watson (1990). 15 Equidistance refers to that the distance between the response alternatives are the same. 16 For further information about mass-significance, see for example Rees (1990) or Aczel (1993). 17 The confidence intervals were calculated in the statistical analysis software SPSS.
42
5 Literature Study A sub-purpose of this thesis is to investigate and evaluate different models through literature to assess the performance of Autoliv’s PDM system. There are vast amounts of well-documented models, and academics continuously produce new or reshaped techniques, advocating the advantages of their particular findings. As a consequence, this chapter will principally discuss the models found useful to the Autoliv case. The literature study will also include shorter explanations of a few other models that have been examined, and which indirectly have affected our research. This is to give a more balanced picture of the large number of models that exist. They have been structured into two major groups: objective evaluation models, which concentrate on tangible values, and subjective evaluation models, which concentrate on intangible values. This chapter also deals with the techniques for handling the financial data received from the chosen models. Those techniques used are described and briefly explained. These techniques are the Net Present Value, Internal Rate of Return and the Payback technique. The use of Real Option Pricing technique is also explained. Because of the difficulties in estimating the volatility of the cash flows, no calculations using OPM are presented18. The purpose of the IS investment is most crucial to the process of defining the approach to its evaluation and to its performance measurement. IS investment that is used to improve efficiency requires efficient measuring techniques, such as a work-study or a cost benefit analysis. IS investment which has been implemented to enhance management effectiveness or business transformation requires more sophisticated models which include, for example, a value added analysis, a value chain assessment, a strategic analysis, a relative competitive performance, etc.
18 This is explained further in section 4.3.4.

43
5.1 Evaluation models for tangible value effects The objective evaluation models utilize quantitative data to identify and categorize tangible benefits and costs related to the IT investment. Such categorization gives a good picture of the financial flow, which is useful when conducting a deeper analysis. The most common and useful objective evaluation models are described below. 5.1.1 Cost avoidance Cost avoidance considers the cost of the IS investment and the costs which are avoided through the IS. This is typically used in the more traditional data processing environments where computers are used for replacing clerical workers or even sometimes blue collar workers. It is not really appropriate for situations where the IS will add value rather than reduce costs. By investigating which costs the company has avoided by investing in the IS it is possible to evaluate the system. Studying the relationship between the increase in turnover and the increase in personnel can identify these costs. The method assumes that an IT system can raise the turnover without adding more employees. A cost avoidance method is most appropriate in systems which automate businesses. 5.1.2 Decision analysis Remenyi and Sherwood-Smith (1997) state that a decision analysis attempts to evaluate the benefits to be derived from better information, which is assumed to lead to better decisions. In turn, better decisions are believed to be associated with better performance. As it is hard to define good information, let alone good decisions, cost benefit analysis conducted by using this method is difficult. Decision analysis is a classic informate situation, which requires a financial value to be associated with information. In some cases, it is relatively easy to measure the effect of information, although there will frequently be considerable noise in the environment which will obscure the effects of the system.
44
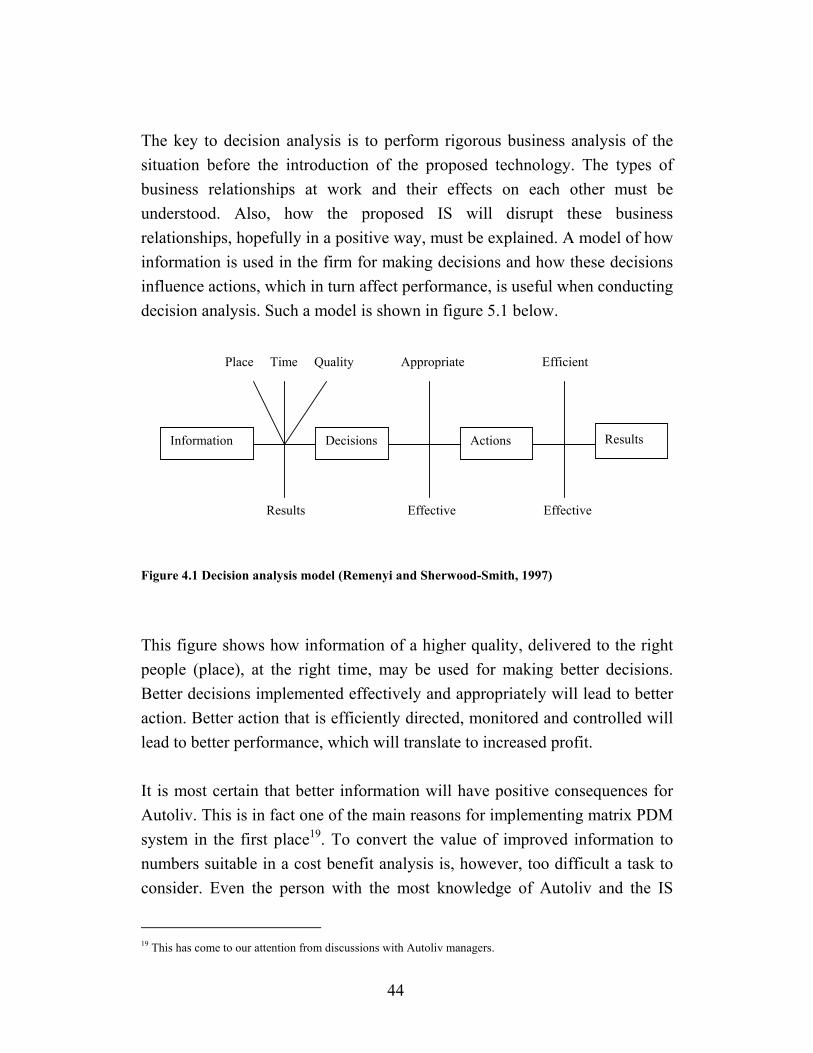
The key to decision analysis is to perform rigorous business analysis of the situation before the introduction of the proposed technology. The types of business relationships at work and their effects on each other must be understood. Also, how the proposed IS will disrupt these business relationships, hopefully in a positive way, must be explained. A model of how information is used in the firm for making decisions and how these decisions influence actions, which in turn affect performance, is useful when conducting decision analysis. Such a model is shown in figure 5.1 below. Figure 4.1 Decision analysis model (Remenyi and Sherwood-Smith, 1997)
This figure shows how information of a higher quality, delivered to the right people (place), at the right time, may be used for making better decisions. Better decisions implemented effectively and appropriately will lead to better action. Better action that is efficiently directed, monitored and controlled will lead to better performance, which will translate to increased profit. It is most certain that better information will have positive consequences for Autoliv. This is in fact one of the main reasons for implementing matrix PDM system in the first place19. To convert the value of improved information to numbers suitable in a cost benefit analysis is, however, too difficult a task to consider. Even the person with the most knowledge of Autoliv and the IS
19 This has come to our attention from discussions with Autoliv managers.
Information
Efficient Appropriate Place Time Quality
Decisions Actions Results
Effective Effective Results

45
system can only make subjective approximations of these consequences. Subjective evaluation should be minimized in a cost benefit analysis, which is why this thesis will not use the decision analysis model. 5.1.3 Impact or time release analysis Impact analysis attempts to quantify the effect which the IS can have on the physical performance of employees. Impact analysis may have automate, informate and even transformate elements, depending on the exact circumstances involved (Remenyi and Sherwood-Smith, 1997). The primary benefit of time release is that staff may do other work, and when this involves acquiring extra sales, it may contribute to a transformation of the business. Time release is one of the few benefit areas that is possible to measure directly. It is a suitable method to use in the Autoliv case for measuring the tangible benefits created from the matrix PDM system. To be able to insert the result of a time-release analysis to a cost benefit analysis several criteria have to be fulfilled:
• A statement why the IS will produce each benefit and how this benefit will be realized have to be worked out thoroughly.
• Details of current performance in the function, and how the situation will differ after the introduction of the IS.
• A plan for the measurement of the performance of the department after the IS application has been commissioned.
The methods to measure the time released by the IS are personal interviews and time studies in the PDM system. Through personal interviews with a sample of employees at each department directly affected by the IS, we are able to determine the time spent on each task that will be performed within the PDM system when implemented. Discussions with PDM system experts and experimentations with the actual system help us to determine the amount of time each of these tasks will take

46
after implementation. Together, they constitute the variables for constructing the tangible measurable benefits. 5.1.4 Nominal breakeven analysis The nominal breakeven analysis asks decision makers to determine subjectively how much the various services offered by the IS are worth to them. Once the cost of the system is covered by these subjective estimates the system is given a go-ahead. This approach to cost benefit analysis is used for subjectively quantifying both tangible and intangible benefits, and as such do not directly lend themselves to financial evaluation. To be able to include the result of a nominal breakeven analysis in a cost benefit analysis the following steps have to be considered:
• List any tangible benefits and state how the achievement of these may be measured.
• Establish the key performance indicators for these tangible benefits. • A detailed statement of how the values of the intangible benefits were
assessed.
It is vital to plan for an ex-post evaluation as well. Therefore, the nominal breakeven analysis also includes:
• A list of suggestions as to how the intangible benefits may be evaluated after implementation.
• A plan for measurement of performance of the department after the new IS has been commissioned, and a timetable for the occurrence of each of the above.
To keep a reasonable reliability this thesis separates the tangible benefits from the intangible benefits as far as possible. This means that no intangibles are quantified, since this always means that highly subjective approximations have to be made. The nominal breakeven model is therefore not used in this thesis.

47
5.2 Evaluation models for Intangible value effects Subjectively quantifying intangible value effects makes the cost benefit result irrelevant. Instead, two parallel separate areas of research are focused on in this thesis. The intangible value effects are defined and analyzed but not quantified. Several models exist in the literature and the most common and/or useful subjective evaluation models are described below. 5.2.1 Return on Management Return on management (ROM) is a concept proposed by Strassman (1985). It is a value added approach, which isolates the management added value and then divides this by the management cost. Strassman is convinced that IT must be assessed according to its impact on management and thus proposes that ROM be used to evaluate this technology. He believes that an IS is only worth what it can bring at an auction and has additional value only if surrounded by appropriate policy, strategy, methods for monitoring results, sound relationship, etc. The formula for return on management is:
Management value added is the residue after every contribution to a firm’s inputs is paid. If management value added is greater than management cost, management efforts are productive in the sense that their outputs exceed their inputs. This approach attributes surplus value to management rather than capital and as such, it is a departure from classical economics. It is based on the philosophical notion that in contemporary society, the most scarce resource is not capital, raw materials nor technology, but rather management. Good
Management value added Management cost
ROM =

48
management makes all the difference between success and failure and ROM recognizes this fact. In spite of the appealing thoughts in this method, it is complex to use and is therefore judged not to be a sufficiently suitable model for us to apply to the Autoliv case. 5.2.2 Strategic match analysis This subjective model is a ranking technique, which requires the IT systems to be assessed in terms of whether or not they support the firm’s general corporate strategy. For example, if Autoliv’s strategy is to reduce costs, and an IT system is reducing cost, there is a strategic match, and the firm is on the right track. The important thing is to evaluate all the IT systems in a corporation continuously, and thus get an overall notion of the direction of the IT investments. Although there is a belief that the matrix PDM system is matching the strategy of the company, this method is not appropriate since this study only evaluates one IS in the organization. 5.2.3 Value analysis This method emphasizes value rather than cost. Value analysis is a method that tries to combine the tangible and intangible value effects in one measure. This is done by quantifying both tangible and intangible benefits and dis-benefits through a specified process including six value factors and four risk factors (Parker, Benson and Trainor, 1988). The value factors are:
1. Yield (including value acceleration, etc.) 2. Strategic value (support existing strategy) 3. Competition advantages (new strategy, new products) 4. Decision value (monitoring, decision support) 5. The value of not being exposed to the risk of NOT undertaking the
investment 6. Strategic IS architecture ( if additional IS projects will be possible to
undertake) The four areas exposed to risk are:
1. Organizational 2. Technical

49
3. IS-infrastructure 4. Definition related
Users are asked to provide the analyst with feedback on the values and limitations of the solution obtained. Value analysis does not aim at a final solution but uses an evolutionary process to get to a “satisfying solution” which may be further improved. Among the advantages of Value analysis is that it is an evolutionary approach, which results in user-tailored systems. This in turn can provide greater user satisfaction than traditional methods (Wen, Yen and Lin, 1998). The method has also several disadvantages. Establishing the surrogate values for the intangibles can be a long and costly process, and there is also a natural difficulty in value qualitative factors. The lack of final costs and benefits may commit the management to unexpected future expenditures. 5.2.4 User attitude analysis User attitude analysis is a way of analyzing user information satisfaction (UIS). UIS is generally considered to be the result of a comparison of user expectations of the information system (IS) with the perceived performance or capability of the IS on a number of different facets of the IS. This is a model considered to be a holistic approach to system effectiveness. Overall attitudes to the IS function may be influenced by the size and direction of the discrepancies (or gaps) between expectations and performance. The perception of the intangible benefits among different groups is an essential problem to consider by the organization. This information shows how well the decision makers have succeeded in transferring their goals and expectations with the system to the rest of the organization. This is a way to evaluate the intangibles in the company. It also shows how well the specification of the system coincides with the requirement of the management. The deficiencies in communication create differences between the groups and can severely complicate the implementation and affect the result of the investment in a negative way. Being aware of these differences simplifies the

50
decisions in what areas the company must concentrate its resources. A variation of the above approach is to use the correlation between expectations and performance scores as a measure of “fit”. The correlations provide a means for assessing the overall effectiveness of the IS function, where high positive correlations can be taken to imply a consensus of views. Kyu (1990) states that UIS is considered to be influenced not only by post-implementation experience with the IS but also by pre-implementation expectations of the IS. The latter is captured through the user’s initial expectations of the IS. In this approach, UIS is measured by the discrepancy between the user’s perception score of the IS performance and the user’s expectation score of the IS. To measure the user satisfaction through perception a questionnaire is used which is aimed at three different respondent groups. The content of the questions is identical but the questions are asked differently to suit each specific group (Appendix 2a-2c). Three measures of a system’s benefit profiles are studied. The first measure is the perceived potential benefits that the Autoliv top management has of the systems. The executives, involved in the investment decision, were asked to state the relevance of each of the identified benefit types to the system, by rating the benefit on a four-point scale. This is a measure of the importance or need that the firm has for each of the benefit types. The second measure of benefits was obtained by asking the system developing project managers, programmers, system managers, and other members of the PDM project team (SDPM). They had to answer the same set of questions relating to the various benefit types. This information provides a second view of the potential benefits by obtaining an opinion of to what extent the system experts believe the system, as it has been developed, actually can achieve the stated benefits.

51
The third measure of benefits was obtained by requesting the PDM end users to complete a questionnaire with exactly the same questions but with answer alternatives aimed to mirror the performance of the system. There are three sets of data collected and therefore there are three potential sets of gaps in attitudes. Figure 4.2: Gap analysis concept (arbitrary from Remenyi 1995)
The first gap, GAP1, is the difference in attitudes between the system developing project managers (SDPM)20 in the Autoliv group and the top managers. The top managers who in turn based their investment decision on the promises from the original architects and the specification of requirements. The second gap, GAP2, is the difference in attitudes between the SDPM and the end users. That is the difference between what the SDPM thinks the system actually can achieve and what benefits the users claim that the system delivered. The third gap concerns differences in attitudes between the top management and the end users. That is the difference in attitudes towards the importance that the benefits occur and the attitudes of the actual system performance experienced by the end users.
20 Known as the EPT group at Autoliv Inc.
Rating by project
manager
Rating by user
Rating for specification
of requirements
Gap 1 Gap 2
Performance Questionnaire 3
Expected Questionnaire 2
Importance Questionnaire 1
Gap 3

52
5.3 Techniques to handle the financial data Once the data from the models described above has been received, there are different techniques to deal with it and present it. Below, the techniques used in this thesis are presented and discussed. 5.3.1 Net Present Value (NPV) According to Copeland and Weston (1992), NPV is a discounted cash flow technique and requires that all figures used actually represent cash dispensed or received by the company. Therefore, profit figures that include non-cash items, such as depreciation or reserves, should not be used. The NPV technique has the great advantage of considering the time value of revenues and costs. The net cash flows received for each year is discounted with an interest rate, which reflects the alternative cost of capital for the company adjusted for the specific risk of the project. The time aspect in the technique hinders the cash flows later in an investment horizon to be overvalued. The investment is viewed as profitable if the NPV is positive, as this is when the yield is more than what is required. When comparing two projects, the one with the highest NPV is superior. The following equation calculates the NPV:
01 )1(
Ir
NCFNPV
N
ii
i −+
= ∑=
iNCF : Net Cash Flow, year i
0I : Initial investment, year 0
r : discount rate To mirror the investment’s real financial effects, the tax-shield resulting from prospective depreciation should also be included. Alternative Investments

53
The NPV technique gives rise to certain difficulties when it is used on IS investments. During “normal” investment decisions, two or more alternatives are compared. Autoliv’s situation is different. It is difficult to see alternatives to invest in, mainly because the main purpose of the information system is to replace and change processes and routines, which is necessary for Autoliv to solve the problem of communication with subsidiary companies around the world. There were few alternatives to Matrix PDM system that could deliver the required specifications21. Which these alternatives were and which cash flows these investments would give rise to are not possible to evaluate for us. Another difficulty is that at the point in time when the valuation is done the appearance of the IS is decided and not possible to change. This means that sensitivity analysis, which is based on the possibility to change project parameters, is not totally reliable. The NPV analysis performed in this thesis, concerning the Matrix PDM system investment performed at Autoliv Inc, does not, by its own, aim to, provide an answer to the question of a right or wrong investment decision. The NPV calculation only contains the tangible benefits and the tangible dis-benefits and disregards any intangible values. The intangible values have to be included when evaluating the entire investment. The discount rate When the NPV technique is used, a very important part of its problem is to decide the discount rate, that is the interest rate to use when discounting the cash flows. According to Copeland and Weston (1992) the discount rate should be set to the opportunity cost of capital (OCC) or to the weighted average cost of capital (WACC). WACC states that the expected return on the firm’s assets is equal to a weighted average of the return on the firm’s debt and equity. In equilibrium the expected return on the firm’s assets is just the opportunity cost of capital since otherwise there would be an arbitrage opportunity. WACC takes into
21 According to Autoliv managers.

54
account all the risk factors in the company. The financial risks are included in rD (cost of debt) and the business risk is expressed in rE (the required rate of return on equity). One thing to notice about WACC is that all variables in it refer to the firm as a whole. As a result, the formula gives the right discount rate only for projects that are “carbon copies” of the firm undertaking them. The following equation is used. The (1-T) factor is used to mirror the tax-shield resulting from the debt.
ED rED
ETrED
DWACC *)1(**+
+−+
=
Where: D = total Debt
E = total Equity rD = cost of Debt rE = required return on equity T = Tax rate
To receive rE one can use the CAPM formula22. It is built on the theory that in equilibrium rates of return on all risky assets are a function of their covariance with the market portfolio. The following equation is used: CAPM: rE = rf + Eβ * [E(rm) - rf] Where: rf = the risk free rate
E(rm) = return on market βE = the factor showing how the stock price moves in comparison to the stock market index.
22 CAPM stands for Capital Asset Pricing Model. For further information about the assumptions behind CAPM, see Copeland and Weston (1992).

55
The β variable is very important when calculating the WACC. It is expressed as follows: βE = COV(rE, rm)/VAR(rm)
There are several difficulties associated with determining the discount rate. Investments include multi-faceted factors of risk and many of them become visible only later in the life of the investment. IS investments which are strategic (like the one Autoliv is undertaking) require the discount rate to be adjusted. To mirror the importance of a strategic investment to be undertaken the required rate of return is often adjusted downwards. On the other hand, IS investments are generally regarded as having high risk. The PDM investment is certainly not “in the line of ordinary business” at Autoliv. It is not a carbon copy of the company. It is, however, the case that the PDM investment is a strategic investment and will substantially affect the entire Autoliv group and the way it works. It can therefore be legitimate to use the WACC for Autoliv Inc. as the discount rate for the PDM investment. 5.3.2 Internal Rate of Return23 This method of evaluating an investment is still frequently used in the industry sector. The internal rate of return (IRR) is the rate of interest, which will cause the Net Present Value (NPV) to be zero. The calculated IRR is compared to the company’s discount rate. If the IRR is higher than the discount rate, the investment is profitable, and vice versa. Below is the formula for the IRR.
0)1( 0
1
=−+∑
=
IIRR
NCFN
ii
i
This method holds several weaknesses. IRR values of different investments cannot be compared with each other. Another weakness is that all cash flows are discounted to the internal rate of return, including the capital released
23 See Copeland and Weston (1992) for further information.

56
during the calculation period. As a result, the return will be too high and thus the evaluation result will be false. 5.3.3 Payback method24 The payback method is fairly simple, since it does not discount the cash flows in its simplest form. Instead it may be defined as the amount of time required for the original investment amount to be repaid by the cash inflows. The most popular form of payback method used today is referred to as the exhaust method. The exhaust method of payback calculation involves the deduction of each year’s cash inflows from the original investment until the original amount is reduced to zero. This method should be contrasted with the average payback method, which only gives a rough approximation of the period of time required to recover the investment amount when the cash inflows are relatively constant. Below is the formula of the exhaust method. Payback in time = investment – cumulative benefit The calculation of payback by the exhaust method is a repetitive process, which requires the cumulative benefit to be subtracted from the investment until the result is zero. The time at which the result is zero represents the period which is required for the investment amount to be returned. The average method is somewhat different: The average method is only useful if the annual benefits do not materially vary from the average. If there is any substantial variability in the annual benefits this method will produce meaningless results. The exhaust method will always be used in this thesis when calculating the payback time.
24 Ibid.
Payback in time = Investment______average annual benefit

57
5.3.4 Option Pricing Models The application of option pricing models (OPM) 25 to evaluate IS projects have been extensively discussed in recent research (Benaroch and Kauffman, 1999). It has many advantages compared to discounted cash flow analysis when the companies possess a deferral option to enter the investment. The PDM investment at Autoliv is already undertaken. This means that Autoliv has no longer the option to defer the investment. The OPM has therefore lost much of its appeal as a relevant evaluation model in this case. However, it is possible to apply OPM on other situations as well. These include: the possibility to terminate a project, the possibility to expand, the possibility to decrease an activity and the possibility to shift a strategy. OPM is therefore of great interest for optimizing the future IS investments that Autoliv plans to undertake in the future, within the frame of Matrix PDM but also other IS investments. It is therefore regarded as relevant to present the Real Option technique of valuing an IS investment. Several reasons are given as to why NPV and OPM approaches will treat the IS investment evaluation differently. Firstly, if the distribution of the expected returns on the IS investment is asymmetric, OPM is able to explicitly model this asymmetric distribution; it allows for a description of uncertain project revenues in terms of their expected value and their potential variability (or standard deviation). Using the NPV technique, an implicit way to account for this asymmetric distribution is to calculate the NPV for the worst, most likely and best case scenarios. This is done using one risk-adjusted discount rate, which applies equally well to all these scenarios.
25 For a more extensive explanation of Option theory the reader is referred to Hull, J, C: Options, Futures, and other derivatives (1997).

58
Secondly, the NPV and the OPM differ in the way they treat the company’s ability to defer the IS investment. NPV can be said to recognize the value of embedded deferral options, but only when the options mature immediately. The option to defer an investment for some time has a value. That is, an investment that can be postponed for some time has larger expected value than an identical investment that has to be undertaken now or never. By waiting, the company can get additional information to make a more informed investment decision. The fact that the value of this information could exceed any possible loss that occurs during a reasonable deferral justifies this. Following the NPV>0 decision rule of discounted cash flow (DCF) the analysis can be incorrect. Even if one were to modify the standard NPV rule to “invest at time t”, such that NPV is maximized, applying this rule involve difficulties. DCF analysis provides no way to incorporate new information that arrives, to update estimates of expected revenues. Calculating NPV for different points in time requires the analyst to estimate a different discount rate for each. Option pricing analysis avoids these difficulties by using models that take into account the fact that changes in revenue expectations will occur as time passes. No parameter adjustments like the discount rate or the expected value of revenues are needed. This kind of information is incorporated by explicitly considering the asymmetric distribution of expected revenues, and their perceived variability. The model parameter is called volatility and it reflects the variance of the expected rate of return on the project. The volatility in the underlying asset (the project cash flows) highly affects the value of the option. Higher volatility gives a higher option value. This is due to the fact of increasing probability that the option will give a positive payoff at expiration date. It is a key factor in option valuation and it is also the most difficult factor to estimate. To accurately use this factor the variance in the underlying asset has to be determined from the date of valuation of the option to the date of expiration. This represents the future scenario, which is most often impossible to calculate. Thus, an approximation has to be made
59
(for example from historical data, cleared from exceptional events). The authors of this thesis did not have enough information to calculate the volatility of the cash flows from the PDM investment and are therefore not able to apply this method to the case study.
5.4 Summary For the purpose of identifying and measuring the tangible value effects that the PDM system will generate Time release analysis was found to be the most useful model to apply in our case. Together with common techniques to handle the financial data, such as NPV, IRR and the Payback method, it is possible to evaluate the intangible benefits. The intangible benefits are dealt with through user attitude analysis. By investigating the attitudes towards the PDM system among different groups of people in the organization, intangible benefits and dis-benefits can be analyzed using a Gap approach.
60
6 Cost Benefit case study Performing a cost benefit case study of the PDM investment at ALS, will discover the tangible value effects of the system. Data was collected by interviews from the working environment before the PDM system to function as a base of benefit calculation26. Then, testing and measuring the different tasks in the PDM system established a measure of working tasks after implementation. The difference of the two sets of data resulted in the tangible benefits in the form of released time. The cost benefit calculation only considers the additional costs and benefits of the PDM system. Opportunity costs occurring if Autoliv would not invest in a new IS are neglected, as the scope of the research would have grown beyond the resources available, both regarding time and information. The estimated potential tangible benefits should be considered as normal-case values. That is, the time release is based on mean values under normal conditions. There exist disturbances in the old paper system that are substantial. There are also numerous disturbances that could appear in the PDM system, such as server breakdowns or low system speed. It is possible to measure the magnitude of disturbances in the paper system, but since there is no way to measure the actual magnitude of disturbances in the PDM system, a worst-case scenario is impossible to calculate.
6.1 Identified tangible costs The tangible costs of the PDM system investment at ALS were identified through personal interviews with employees at ALS. Several costs are realized for Autoliv Inc, and to quantify the share of costs for ALS, the group costs have been divided into six parts, since there are six PDM servers in Autoliv Inc. Some costs are given in USD, where an exchange rate of $1= 8,35 SEK (15 Nov 1999) has been used to convert the values to SEK. The total cost of
26 A total of 40 interviews were conducted in the period of October 8 to November 18, 1999.

61
an Autoliv high-level white-collar employee is 800,000 SEK per year27, while the cost of a normal white-collar employee is 680,000 SEK28. For an extensive overview of all identified costs, see appendices 3a and 3b. Below the identified costs are described in terms of scope and money. Due to company policy, some of the costs are classified information which we are not allowed to reveal. New system hardware such as servers and clients The PDM system requires more capacity in three new servers for ALS. More specifically, the servers are an Oracle server, a FTP server, and a Citrix Metaframe. The servers will also be utilized by ALS’s daughter/sister companies in Sweden, which means that only the percentage of ALS utilization will be regarded as a cost. This is reasonable since the daughter companies will be charged for the usage of servers. The costs of the servers are confidential information. Matrix software and installation The software and installation costs for Autoliv Inc. are confidential information. Matrix licenses The license costs for Autoliv Inc. are confidential information. Network: Telephone and/or digital lines The status of Autoliv Inc.’s telephone and digital network when the PDM system was initially started had and still has the capacity to run the PDM system. However, discussions are currently held whether the network will be able to handle the future PDM system. If not, Autoliv must invest in a new network. The cost of such investment is approximately $30,000 – 40,000 per month29. The reason for the uncertainties of the investment size is that Autoliv is currently in the quotation stage of this investment. An investment cost of
27 Includes salary, taxes, insurances, administrative costs (travel, telephone, secretary), employers costs. 28 Autoliv Sverige’s standard hourly cost of white-collar worker times standard annual working time. (400SEK *1700 h/year) 29 According to Tommy Bäck, Autoliv Inc.

62
$35,000 will be used in this study. The alternative to invest in the network as well as the alternative not to invest in the new network are considered in the cost benefit analysis ( see Appendix 3b). PDM project costs From the start of the project in the beginning of 1998, twelve people have been involved in the PDM project. Their working time in the project has represented four full time employees from January 1998 for 24 months, and four full time employees from March 1998 for 18 months.30 Their working tasks have been planning management, development, analysis and programming of the first phase of the PDM project. According to the above reasoning, ALS’ share of that cost is 1/6, which amounts to approximately 980,000 SEK in 1998 and 890,000 SEK in 1999. The first phase of the project will be completed in year 2000. An assumption has been made that two people will continue to work with the tasks implemented in the first phase. The remaining ten people will start working with the second phase of the project. Thus, from year 2000, the ALS costs will be about 270,000 growing with inflation each year. Support costs, internal and external From the moment the system is fully implemented in the Autoliv group, software problems, which would reduce the user satisfaction, like bugs and slow system, must be handled. In addition, the users need a helpdesk to contact for general user problems. Identifying the problems and then solving them have been estimated to occupy two full time employees at ALS, which would be 1,360,000 SEK per year31. Training costs of personnel During 1999, the employees at ALS have been educated in Matrix, the PDM software. Around 245 people have been trained for eight hours, and 100 of them have been trained for an additional 12 hours. The Autoliv standard man-hour cost of 400 SEK has been used. As both higher-level managers and some
30 According to Magnus Dahlén, Autoliv Inc. 31 Two full-time employees costing 680 000 SEK per year.

63
blue-collar workers are trained, the standard man-hour cost is reasonable to apply. In the year 2000, it has been estimated that 20 employees still have to finish the training due to missed training days in 1999. Half of them are estimated to need the full 20-hour training, and the remaining half receives the basic training of eight hours. In addition, approximately five new employees need to be trained eight hours every month for the coming years. An external consultant has been hired to develop the Swedish study material and perform the training. The consultant spent approximately 720 hours in year 1999, and the hourly cost of the consultant is 650 SEK. In 2000, the consultant will spend about 20 hours on the employees that missed the training in 1999 and around 10 additional hours per month for new employees. In 1999, 16 hours of pilot studies have been performed, including 14 persons. All in all, the training costs can be summarized as below. Training costs 1998 1999 2000 2001 2002 2003 2004 2005 Cost of lost working time due to training - 1 264 000 310 080 199 757 101 876 103 913 105 992 108 112Consultant & study material costs - 468 000 92 820 94 676 96 570 98 501 100 471 102 481Pilot studies 89 600 Total: - 1 821 600 402 900 294 433 198 446 202 415 206 463 210 592 Table 5.2 Training costs
IT specialist staff The Oracle PDM database will need support and service including backup services by a specialist with a deep knowledge of databases. Recruiting, training, and the salary of such an employee would amount to approximately 340,000 SEK32.
32 50% of one full-time employee costs 680 000 SEK per year.

64
Transition costs The current drawing data existing in paper form and in CAD must be converted to the PDM system. ALS has estimated that around 5,000 articles will be inserted into the PDM system. Each article will take about 45 minutes to convert and insert. In 1999, around 200 articles will be processed and the remaining 4,800 in 2000. The costs for the two years, with ALS standard man-hour cost of 400 SEK, amount to: 1999: 200 articles * (45/60) * 400 = 60,000 SEK 2000: 4800 articles * (45/60) * 400 = 1,440,000 SEK Backup equipment The PDM system will need backup equipment to enable security backup services. ALS has invested in an IBM ADSM33 Backup with a cost of 70,000 SEK. ALS’s percentage of utilization of this equipment will be around 95%. Thus the total cost of ALS is 66,500 SEK. Future software upgrades Upgrades of the Matrix software are included in the license costs.
6.2 Identified tangible benefits (time release) Through literature studies, personal interviews with employees at Autoliv, and advice from the consultancy firm KPMG, a number of working tasks have been identified with the potential of releasing valuable working time with the use of the PDM system. During the paper system, time has also been lost due to wrong drawing issues, parallel work on the same drawings or “engineering changes” (ECs). In addition, to avoid the problems mentioned above, controlling routines are performed. These mistakes are minimized with the PDM system, and the need for controlling routines is eliminated. Below is a short description of each task before and after implementing the PDM system. 1. Issue a new article number
33 ADSM = ADSTAR Distributed Storage Manager.
65
Before PDM: Engineers from the product development or production departments select a new number in a list of numbers in a centrally located binder. With PDM: New numbers are automatically allotted when engineers register a new article in the PDM system. 2. Obtain a local drawing Before PDM: Engineers from the product development or production departments obtain a drawing either electronically in the CATIA software or in paper form in the paper drawing archive. With PDM: Any engineers are obtaining a drawing through the PDM system with the assurance of getting the latest approved issue. Even though engineers at the product development and production are releasing time by the PDM system, engineers at the other departments spend new time obtaining drawings not performed by themselves earlier. 3. & 4. Obtain an external drawing Before PDM: Engineers obtain a drawing by contacting the owner of the drawing by phone, e-mail, or telefax. The time to activate the wish of receiving the drawing is called the direct time. The time from activating the wish to the point of receiving the drawing is called the loop time. The direct time can be valued as direct saved working time. The loop time, on the other hand, may not be valued in the same way, since it is possible for the employee to do other things while waiting (during the loop time). It is, however, the case that waiting is costly and in some situations the whole project is delayed because of the long loop time. It is difficult to value a reduction in loop time. For the record we have presented the reduction in loop time hours, and the monetary value when considering it being worth the same as direct time released. With PDM: Engineers are obtaining a drawing through the PDM system with the certainty of receiving the latest issue. 5. & 6. Perform an engineering change (EC) Before PDM: Engineers work with ECs in paper form. As approval signatures

66
are needed engineers spend much time “chasing” the correct persons to sign the EC (direct time). The time from the moment the EC is initiated to the final approval is called the loop time. The loop time is extensively affected by the waiting time, which is the time the EC is waiting in people’s e-mail in-basket. With PDM: Engineers work with electronic ECs directly in the PDM system. Approval signatures are executed directly on the monitor. The direct time will be reduced as people can observe each other in the EC process, and thus feel forced to act faster. In addition, the “chasing” can be carried out by phone instead of by foot. As people will receive the ECs by e-mail with pop-up notices, the risk of ECs being forgotten in a pile of paper in someone’s in-basket is limited, and thus the “waiting time” and the loop time will be reduced. 7. Inform internal co-workers on drawing and EC issues. Before PDM: Design Engineers spend unnecessary time informing internal co-workers on drawing issues, which could be handled by the co-workers themselves with PDM. With PDM: People handle minor drawing questions themselves through the PDM system. 8. Inform external co-workers on drawing and EC issues, which could have been handled by themselves with PDM Before PDM: Design Engineers spend unnecessary time informing external co-workers on drawing issues via phone or e-mail, which could be handled by the co-workers themselves with PDM. With PDM: People handle minor drawing questions themselves through the PDM system. 9. Updating, archiving personal drawing folder Before PDM: Numerous engineers use a personal drawing folder, which needs to be updated continuously. The risk of mistakes is greater, especially if drawing issues are changing often. With PDM: Personal drawing folders are pointless and redundant, as the PDM

67
system always shows the latest drawing issues. 10. Updating, archiving department drawing archive Before PDM: Several departments keep their own paper drawing archive. Engineers spend much time archiving new drawings, updating existing drawings, and correcting errors in these archives. With PDM: Department drawing archives are pointless and redundant, as the PDM system always shows the latest drawing issues. 11. Checking, retrieving drawings or ECs by the Quality and the Purchasing departments. Before PDM: Quality engineers and purchasers spend meaningless time checking and retrieving drawings and ECs due to the risk/suspicion of using the wrong drawing issues. With PDM: The risk of using the wrong drawing issues has been minimized with the PDM system. 12. Set up and changing article structure Before PDM: New article structures and modified existing structures are fed manually into the MRP system. With PDM: New article structures and modified existing structures are fed automatically into the MRP system from the PDM system. 13. EC/PPAP administration Before PDM: A person is administering a separate database containing all information concerning PPAPs of the company. With PDM: All information concerning PPAPs of the company is being incorporated into the PDM system. Thus, a separate database is not needed. 14. & 15. Lost time due to various mistakes Before PDM: Time lost because people occasionally work on old drawing issues. Time lost because people occasionally work parallel on the same drawing issues or ECs. Time lost because people spend time on tasks to ensure avoidance of the problems mentioned above.

68
With PDM: The risk of using the wrong drawing issues is minimized with the PDM system. Drawings are “checked out” from the system when used by engineers, and “checked in” again when jobs are finished. This minimizes the risk of parallel work on the same drawing issues. To determine the engineer time spent on each of these tasks, personal interviews were performed at ALS. A number of employees at each department were interviewed and an employee average time spent was found. The average was then aggregated up to the total number of employees affected by the PDM system at each department. Measured released time After identifying the tangible benefits before the PDM system implementation and after the implementation, the difference was calculated. This difference is the time released by the PDM system. Table 5.3. Time release
The table above illustrates how many hours of released time each working
Measured released time summery Product Production Quality Purchasing Marketing TOTAL RELEASED development department department department department HOURS A. Tasks department 1. Issue a new article number 17 0 0 0 0 17 2. Obtain a local drawing 33 8 -88 -70 -123 -239 3. Obtain an external drawing (loop time) 1 583 0 0 0 0 1 583 4. Obtain an external drawing (direct time) 4 0 0 0 0 4 5. Perform an engineering change (loop time) 3 022 0 0 0 0 3 022 6. EC approval "chasing" time (direct time) 228 79 0 0 0 307 7. Inform internal co-workers on drawing issues 561 351 0 0 0 912 8. Inform external co-workers on drawing issues 264 0 0 0 0 264 9. Updating, archiving personal drawing folder 53 1 12 0 0 66 10. Updating, archiving department drawing archive (h/month) 170 9 14 9 0 201 11. Checking, retrieving drawings or ECs (h/month) 0 0 34 44 0 78 12. Set up and changing article structure 0 0 56 0 0 56 13. EC/PPAP administration 0 0 0 64 0 64 B. Lost time due to various mistakes 14. Time worked on old drawing issues & parallel work (h) 44 0 0 0 0 44 15. Time spent on tasks to ensure avoidance of 8 and 9. (h) 22 0 0 0 0 22 TOTAL RELEASED HOURS (direct) 1 396 448 29 47 -123 1 796 TOTAL RELEASED HOURS (loop time) 4 605 0 0 0 0 4 605 (All figures in hours per month)
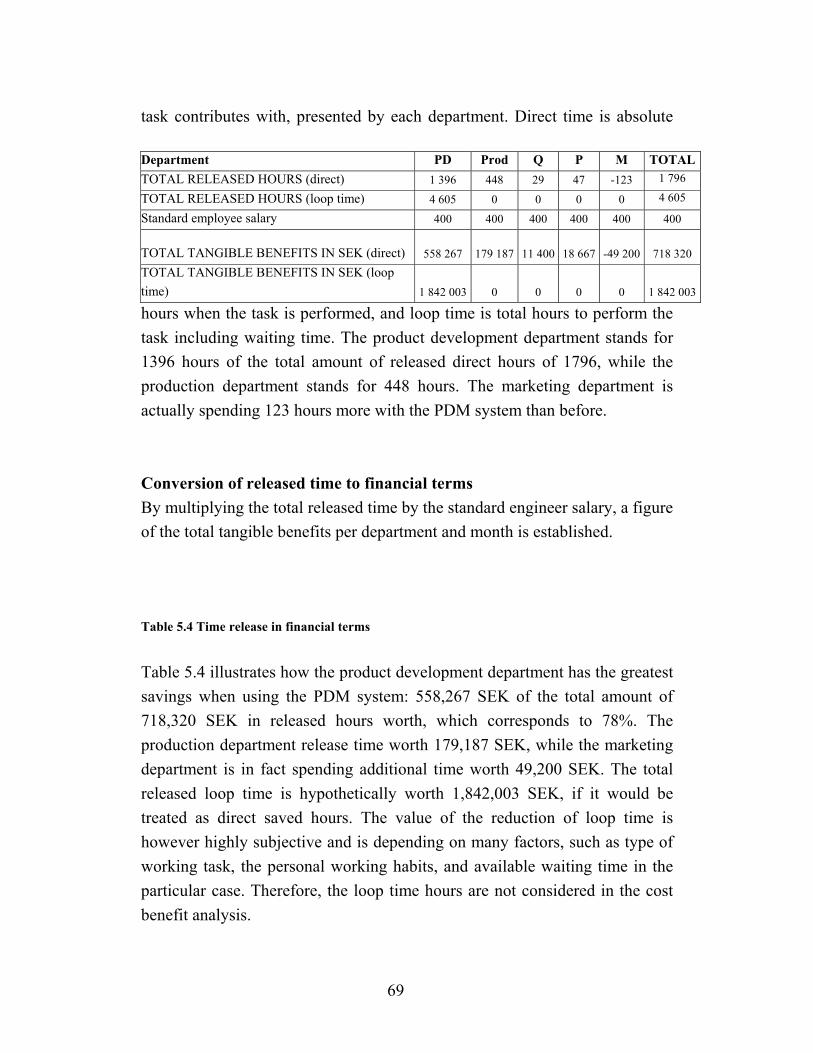
69
task contributes with, presented by each department. Direct time is absolute
hours when the task is performed, and loop time is total hours to perform the task including waiting time. The product development department stands for 1396 hours of the total amount of released direct hours of 1796, while the production department stands for 448 hours. The marketing department is actually spending 123 hours more with the PDM system than before. Conversion of released time to financial terms By multiplying the total released time by the standard engineer salary, a figure of the total tangible benefits per department and month is established. Table 5.4 Time release in financial terms
Table 5.4 illustrates how the product development department has the greatest savings when using the PDM system: 558,267 SEK of the total amount of 718,320 SEK in released hours worth, which corresponds to 78%. The production department release time worth 179,187 SEK, while the marketing department is in fact spending additional time worth 49,200 SEK. The total released loop time is hypothetically worth 1,842,003 SEK, if it would be treated as direct saved hours. The value of the reduction of loop time is however highly subjective and is depending on many factors, such as type of working task, the personal working habits, and available waiting time in the particular case. Therefore, the loop time hours are not considered in the cost benefit analysis.
Department PD Prod Q P M TOTALTOTAL RELEASED HOURS (direct) 1 396 448 29 47 -123 1 796
TOTAL RELEASED HOURS (loop time) 4 605 0 0 0 0 4 605
Standard employee salary 400 400 400 400 400 400
TOTAL TANGIBLE BENEFITS IN SEK (direct) 558 267 179 187 11 400 18 667 -49 200
718 320 TOTAL TANGIBLE BENEFITS IN SEK (loop time) 1 842 003 0 0 0 0 1 842 003

70
6.3 Cost benefit analysis Since ALS does not use any specific discount rate, an approximation for this particular study is necessary. As discussed in section 4.3.1, WACC can be used as an approximate discount rate.
ED rED
ETrED
DWACC *)1(**+
+−+
=
The figures were collected from the 1998 annual report (million dollars). The market value of equity is used. The market risk premium and the risk-free rate were received from
Stockholms Fondbörs. Where: D = 1 822
E = 1 846 rD = 5,2 % rE = 7,1 % T = 39,6 %
To receive the return on equity (rE) CAPM is used:
CAPM: rE = rf + *βE = [E(rm) - rf] rf = 5,5% (10 year Swedish bond) E(rm) = 10,5% (Swedish stock market) βE = 0.32 at the Swedish stock market and 0.35 at the New York Stock Exchange. rE = 0,055 + 0,32 * (0,105 – 0,055) rE = 0,071 WACC = 5,13 % using book value debt/equity ratio, and the βE for Sweden rE = 0,055 + 0,35 * (0,105 – 0,055) rE = 0,0725

71
WACC = 5,21 % using book value debt/equity ratio, and the βE for USA It is notable that the WACC is less than the risk-free rate and the bond rate34. This occurs partly because of the tax shield resulting from the debt, since interest costs are tax deductible. Another factor is that the βE = 0,32 for Autoliv Inc (as well as the other companies in the same business) is very low. The average βE for all listed companies is that of the market βE = 1. Which discount rate that is most accurate to use can be discussed forever. The most important issue in this case is to get an approximation of the discount rate, to use as a mean rate in a discount rate sensitivity analysis. The calculated WACC of 5,13% will serve as the approximated discount rate for the following scenario calculations. 6.3.1 Scenario calculations There is an infinite number of scenarios regarding the development of the future cash flows from the PDM investment. We have tried to distinguish the most interesting and/or realistic scenarios, which will be presented below. In addition to these comprehensive scenarios, a sensitivity analysis of each of the most important variables will be undertaken. Scenario 1: NPV with two-year learning curve (alt. 3) Applying this mean discount rate of 5,13 % to the cost benefit case study results in a positive NPV of 7,907,857,SEK (see Appendix 4). The base case NPV is incorporating a two-year learning curve before the tangible benefits can be fully exploited. In the first year, only 1/3 of the benefits can be realized and in the second year 1/2 of the benefits can be realized. The IS benefits are fully realized the third year (2002). The life of the PDM system is estimated to be six years35. This makes the life of the investment approximately eight years.
34 When using βE at the Swedish market. 35 After discussions with Magnus Dahlén, Autoliv Inc.

72
The project Internal rate of return (IRR) in this base case NPV is 31,4 %. This implies that with a WACC for Autoliv Inc. of 5,13%, the risk of the project could be essentially higher without resulting in a negative NPV. The Payback time for all the different scenarios is calculated with the investment starting point as the beginning of 1998. The payback time when including a two-year learning curve is 5 years. Autoliv’s target payback time is one year (calculated from the beginning of year 2000)36. If ALS is going to reach this target, the intangible benefits have to be worth at least 5,000,000 SEK at the end of year 200037. Scenario 2: NPV with fully realized benefits from the year 2000 Without regarding the learning curve, assuming that the intangible benefits will be fully realized from January 2000, the NPV of the PDM investment is 12,788,718 SEK. The IRR is 57% and the payback time is 3 years and 5 months. This scenario is not very realistic, but an interesting case for comparison. Scenario 3: NPV with fully realized benefits from the year 2001 If the implementation process is extended for another year for some reason, no benefits will be realized in the year 2000. The costs will, however, occur as calculated. This scenario, excluding any learning curve, will generate a NPV of 7,906,331 SEK. The IRR is 31% and the payback time is 4 years and 10 months. Scenario 4: NPV with network and learning curve (alt.3)
36 Ibid. 37 When using NPV scenario 1.

73
Autoliv has not decided if the PDM system will need a new network to be installed. The network will generate substantial costs in this context. There is not a coherent view of how much of the costs that the PDM system should bear and how much of the network, if any, can be used for other purposes. If we ignore the possibility that the network can be used for other purposes, the PDM investment generates a negative NPV of -5,200,449 SEK. The Payback time is 10 years and 4 months. Scenario 5: NPV with network and with fully realized benefits from the year 2000 Disregarding the learning curve and assuming that Autoliv can realize the benefits to 100 % from Jan. 2000 the result is more positive. The benefits will cover the costs and result in a positive NPV of 2,904,315 SEK. The IRR is 20 % and the payback time is 5 years and 3 months. Scenario 6: NPV with network and with fully realized benefits from the year 2001 A more realistic scenario might be that the benefits cannot be realized in the year 2000. The implementation process is not complete by January 2000 and some kind of installation period or learning period is most certainly going to be needed. Under the assumption that all the tangible benefits can be realized from January 2001, the investment generates a negative NPV of –1,978,072 SEK. The payback time is 8 years and 5 months. 6.3.2 Sensitivity analyses There are a number of important variables to analyze further. It is of great interest to know the impact on the profitability of small changes in the variables. The variables examined are (a) Discount rate, (b) Transition time and (c) Learning time.

74
6.3.2.1 Discount rate analysis
As explained above, the WACC of 5,13% is an approximate figure of the discount rate for the entire Autoliv Inc. Since this is a rate that can be questioned, it is useful to conduct a sensitivity analysis of the same. Using the NPV-scenario 1 as the basis the discount rate sensitivity is shown in figure 5.1 below.
Figure 5.1 Discount rate sensitivity
The figure reveals that the IRR of the PDM investment (under the above assumptions) is as high as 31%, which means that the investment’s tangible benefits justify the project, even if the risk associated with the investment is substantially higher than expected.
6.3.2.2 Transition time analysis
By looking at the number of articles and the time involved, one can easily conclude that the transition time bears a significant role in the cost benefit analysis with 1,500,000 SEK. In addition, a long transition time can result in huge indirect costs, since benefits cannot be fully realized until the product data is transferred into the PDM system. Assuming that one percentage of transferred data results in one percentage of realized benefits, the annual cash

75
inflows can be analysed by varying the point in time when the data is fully transferred. The chart below illustrates the transition time analysis using scenario 1 (with learning curve alternative 3 and no new network).
Figure 5.2 Transition time analysis The left-hand bars show the NPV when the transition of data is delayed, month by month in the year 2000. The right-hand bars show the magnitude of lost cash flows after tax for the corresponding month. The NPV decreases from 8,000,000 SEK to 6,200,000 over the year, while the lost cash inflows increase to 1,800,000 SEK. The assumptions imply that the benefits could be realized as soon as the data is transferred. It could, however, be argued that there is no chance of learning the system accurately without the data completely transferred. In that case, the two variables are dependent on each other, and the loss from increased transition time or/and increased learning time will be much greater. The number of such combinations is infinite and the two variables are therefore only analyzed separately.

76
6.3.2.3 Learning time analysis
The learning time highly affects the profitability of the PDM investment. Training and education must be offered on a regular basis, otherwise not only the implementation schedule can suffer, but also the quality of work. This can occur if people try to gain their PDM knowledge in real Autoliv projects instead of learning before practising their skills in “live” situations. Such situations often result in substantial rework. The concept of learning curves has been implemented to many activities, as it was discovered that the cost of doing most repetitive tasks decreases as "experience" is gained. This general concept of a learning curve (or "experience curve") can be applied to the analysis of cost behavior in industry pricing, manufacturing cost forecasting, and many other metrics regarding efficiency ("experience") versus volume. Learning curves are usually described by a percentage (%) value. This value is typically 1 minus the change rate of the measured value (Y) each time cumulative volume (X) doubles. Naturally it has not been possible to calculate a learning curve for the PDM system at Autoliv since no historical data is yet available. Lacking information about a general learning curve rate of performing working tasks in an IS makes it difficult to even approximate a reasonable rate. Instead, four learning curve scenarios have been employed. Below, a learning time sensitivity analysis is graphically presented by inserting four different learning curve alternatives in the NPV calculation. We assume that one percent of knowledge in the system leads to one percent of realized tangible benefits, and that the transition of data is complete.

77
Figure 5.3 Learning curve
The dashed curve figure 5.3 represents the increasing loss of cash flows after tax when the learning time increases. The full curve represents the decreasing NPV when the learning time increases. The different learning curve alternatives are presented in the table below.
LC ALTERNATIVE LEARNING RATE Year 2000 Year 2001 Year 2002 Year 2003 1 2/3 1/1 2 1/2 1/1 3 1/3 1/2 1/1 4 0 1/3 1/2 1/1
Table 5.5 LC alternatives
In alternative 4 we assume that it takes some base knowledge before the PDM system can be advantageous utilized at all. This required “base knowledge” is set to 1/3 of the systems applications, which means that the learning rate is

78
less than 1/3 (not necessarily zero).
6.4 Cost benefit summary Through literature studies and personal interviews, a number of working tasks with the potential for releasing valuable working time with the use of the PDM system were identified. The cost resulting from implementing the PDM system was also identified. Six base scenarios were distinguished and analyzed. Sensitivity analyses of the most interesting variables were also conducted. These were the discount rate, the transition time, and the learning time.

79
7 Case study on Intangibles Conducting a case study on the possible intangible benefits resulting from the PDM system will enable the identification of and possibility to analyze of these. The first section shows the identified intangible costs that were found. We then present the identified intangible benefits, which form the base for the content in the questionnaire. The result and the analysis of the Questionnaire research are then presented.
7.1 Intangible costs Wen, Yen and Lin (1998) classify IS risks into two general classes: Physical risks and Managerial risks. The risks involved in the PDM system investment at ALS can be classified in the same way. The physical risks include the vulnerability of computer hardware, software and data. Hardware is the most visible part of information systems. Because of its accessibility, hardware can be subject to theft, sabotage and other crimes against the owner. At ALS all the buildings are protected by alarms, and during working hours personal card keys are needed to access buildings and rooms. The card keys are adjusted for the person in question, so that he/she can only access the rooms needed. Computers are protected through personal user names and codes, and are not possible to operate without a proper user name and code. Software-related crimes occur in three ways: piracy, deletion and alteration of software. Piracy is not a relevant risk for ALS. Regarding deletion and alteration, the PDM system is quite safe, as it is not possible to delete or alter drawings and product data information, if the user is not authorized as “the owner” of the article in question. Both hardware and software are also subject to malfunction and obsolescence. The possible loss of valuable data is another major physical risk in information systems. Reconstructing lost data can be very costly and time-

80
consuming. An actual exposure of lost data can leak important inside information to competitors. Up-to-date backup equipment is used continuously at ALS, and as the PDM system is a separate database network with currently no external communication possibilities, the risk of electronic information leaks is limited, but still one to consider. Managerial risks in system design, development and implementation are the cause of many failures in IS investments. The managerial risks for ALS include:
(1) Failure to obtain the anticipated benefits, because the situation was not measured before the PDM project started. Hence, at the end of the project, no one has a clear idea of the benefits because there is no comparison before and after made. This thesis aims to eliminate such a risk.
(2) Costs of implementation that vastly exceed planned levels. A possible reason can be a weakly defined project strategy which could have the result that the technology acquired was not complete or sufficient.
(3) Time for implementation that is much greater than expected. The PDM system requires a Learning curve that is too long. Learning a technology may also require that you unlearn old habits that have proved useful in the past. This is particularly true in object-oriented programming versus traditional programming. Management may also divert people from learning the new technology by forcing them to maintain the old technology. Training and education must be offered on a regular basis, otherwise not only the implementation schedule can suffer, but also the quality of work. This can occur if people try to gain their knowledge through work on the project, often resulting in substantial rework.
(4) Unexpected end-user resistance or lack of interest in the system. Reasons can include that certain business units are difficult to motivate in the initial phase of the project. Instead of facing this problem, the project is pushed to implementation based on the belief that when the users see the technology installed, they will like it. This is unlikely if the users were not involved from the beginning.

81
(5) Performance of PDM system is unable to support tasks crucial to the project. For example, the system speed can seriously affect the performance of Matrix. When conducting the practical tests in order to find the post-implementation time values, an educational Matrix network was used.38 Therefore the post-implementation values are based on the process speed of this network. If the speed of the real, soon-to-be implemented, PDM system is deviating from the educational network, it will naturally affect the calculations of this thesis.
(6) Incompatibility of the system with the technology standards, developed later.
These risks cause both tangible and intangible effects. The tangible effects for some of the above risks are treated in the sensitivity analyses of the cost benefit analysis (see section 5.4.2). For instance, the learning time analysis is considering the failure of obtaining the anticipated IS benefits due to long learning time for employees. A reason for vastly exceeding the planned levels of implementation costs could be that Autoliv must invest in a new global network to run the PDM system. This alternative is also analyzed in Chapter 5. Intangible effects resulting from the managerial risks are partly analyzed in the gap analysis (see section 6.4) Most of the risk factors are possible to reduce or even eliminate. To successfully do so it is required that the risks are recognized and fully understood by people taking the investment decisions and by people managing the implementation process.
7.2 Intangible benefits In addition to the tangible benefits examined in the cost benefit analysis, the PDM system also results in a number of intangible benefits. Below, the identified intangible benefits will be discussed.
38 An internal Matrix network used by ALS in their training programs.

82
Data availability, reliability, security and integrity Up-to-date product data will always be available to all employees, ensuring that people work on the correct drawing issues. The distributed database network of the PDM system offers a single secure location for document storage. In addition, linking product data through a database is a major factor in assuring its integrity. Knowing and managing who is using data, and how, provide the foundation required to maintain information integrity. Data inconsistencies can be avoided and relationships among data maintained. Application that is manageable (IS) The PDM system gives the users a possibility to handle large amounts of data with limited resources. Users can easily get an overview of data and status of all the products they currently handle. Without spending valuable time, managers can check the status of running projects in real-time. Early evaluation of manufacturing processes The PDM system at Autoliv ensures that the production departments are involved early in the product development projects. Thus, the manufacturing process of each product is evaluated early enough to avoid large changes late in the development process. Late changes are extremely costly. Global standardization Document types, part names, and part numbers are standardized worldwide. Powerful search tools in the PDM system will make it possible to easily identify similar products, and thus efficient standardization projects can be performed. There are enormous standardization possibilities within the Autoliv group, since each company has been managed rather independently during the years. Multiple language support The PDM system supports English, French, German, Spanish, and Swedish. Local drawings and product data will suddenly be available in most users’ native languages, and will thereby be more useful in their jobs.
83
Improved Design Accuracy Project members all use the same set of information, which is always up to date. Overlapping or inconsistent designs are eliminated even as people are working on tasks simultaneously. This results in fewer design problems, which would emerge in the Quality department and Production department. There will be more “right-the-first-time” designs, and thus a shorter “time-to-market”. In addition, the very fact that the engineer can feel safe about using the latest drawing issue is a benefit. Improved Team problem solving Design engineers are rather conservative in their problem solving since most often there is not enough time to develop a totally new design, which may not even work. PDM would reduce the risk of failure since the risk is quickly spread to the right people early in the development process. This encourages team problem solving by allowing individuals to bounce ideas off each other, all looking at the same problem. Improve and expedite the engineering change process single world-wide system The change process of the company has gone through a revolution. All companies in the Autoliv group will now follow the same general change process with a few local adjustments. Changes affecting manufacturing plants in several countries will be managed uniformly and the risk of misunderstanding each other (perhaps causing stops in the production) is limited. New upgrades are now possible When the PDM system needs to be updated, the whole company group can switch at the same time, without the long process of adjusting every company’s individual system to each other. Reduce the design cycle time As the PDM system provides the designers with the correct data efficiently, they can spend more time actually designing. In the pre-PDM system,
84
designers spend much time simply handling information, looking for it, retrieving it, waiting for copies of drawings, and archiving new data. Even though we have tried to identify and quantify these benefits in the cost and benefit analysis, some of them are highly intangible and difficult to measure. The PDM system will, for example, eliminate the “reinvented wheel” syndrome. The amount of time designers spend solving problems that have probably been solved before is notorious. It is often considered quicker to solve it again than to track down design elements that could be re-used. With the PDM system, the identification, re-use, and modification of existing similar designs should become routine. Reengineering and process improvement can be more easily supported through modern technology and a proven IS partner In future reengineering and process improvement projects, Autoliv will stand on solid ground with a well-organized part structure and an efficient engineering change process. Furthermore, Matrix as an IS and PDM partner will do their utmost to support Autoliv in being a successful company in terms of information technology. Finally, modern technology gives good conditions for an improved network management and performance. Most of the intangible benefits for ALS are depending on that the other Autoliv companies also implements the PDM system. Major benefits require a truly global PDM system, such as better data availability, product standardization, improved change process, etc. As the car manufacturers in Sweden have become more and more global, there hardly exist any local projects anymore. As a result, a local PDM system would not contribute to any substantial value in comparison to the global PDM system. The intangible benefits discussed above have been collected from various sources, such as Autoliv employees, internal Autoliv documents, Matrix documents, PDMIC.com (PDM Information Center), and presentation material from a PDM seminar named ADRA. Based on the above, 13 questions were constructed to be included in the questionnaire. Each of the 13 questions represents a benefit type. These include the system’s ability to:

85
1. Reduce overall cost 2. Avoid new costs from occurring 3. Provide improved staff productivity 4. Provide capacity for increased production 5. Reduce errors in the engineering process 6. Provide competitive advantage 7. Catch up with competition 8. Provide improved management information 9. Provide improved management control 10. Provide improved management productivity 11. Provide improved staff morale 12. Provide improved corporate image 13. Provide improved customer service
7.3 Gap results The respondents were asked to state their opinion of the system’s ability to realize each of the 13 identified benefit types. The top managers were asked to state their opinion about the importance to the company that the system will be able to realize each benefit type (in the initial phase of the project). The SDPM were asked to state their opinion about what the system was actually designed to be able to do (when the system is under construction). The end users were asked to state their opinion about what the system actually was able to perform (when the system has been running for some time). Usually this kind of research will take about two years to complete. Since Autoliv is in the delicate situation where one part of the Autoliv group has already used the specific system for approximately 1,5 years, it is possible to perform this research at one point in time. After receiving 91 completed questionnaires from end users, 7 from SDPM and 3 from top managers, we were able to summarize the results as follows. As there are three sets of data collected, there is a potential for three distinct sets of discrepancies (figure 6.1).

86
Figure 6.1: Gap analysis concept (arbitrary from Remenyi 1995)
The three different data sets are shown in table 6.1. Each question is presented separately with the mean score within the group and the rank stating the score relative to the other benefit types.
Nr Question Importance Expectation Performance
Rank Mean Rank Mean Rank Mean
1 Reduce overall costs 1 3,67 5 3,29
11
3,14
2 Avoid costs 1 3,67 1 3,57
7
3,26
3 Improve staff productivity 1 3,67 1 3,57
1
3,52
4 Increased volume 13 2,33 12 2,43
9
3,25
5 Reduce error 1 3,67 4 3,43
2
3,42
6 Competitive advantage 5 3,33 9 2,86
7
3,26
7 Catch up with competition 5 3,33 12 2,43
10
3,18
8
Improved management information
5 3,33 1 3,57
6
3,37
9 Improved management control 10 3 7 3
2
3,42
Rating by project
manager
Rating by
user
Rating for specification
of requirements
Gap 1 Gap 2
Performance Questionnaire 3
Expected Questionnaire 2
Importance Questionnaire 1
Gap 3
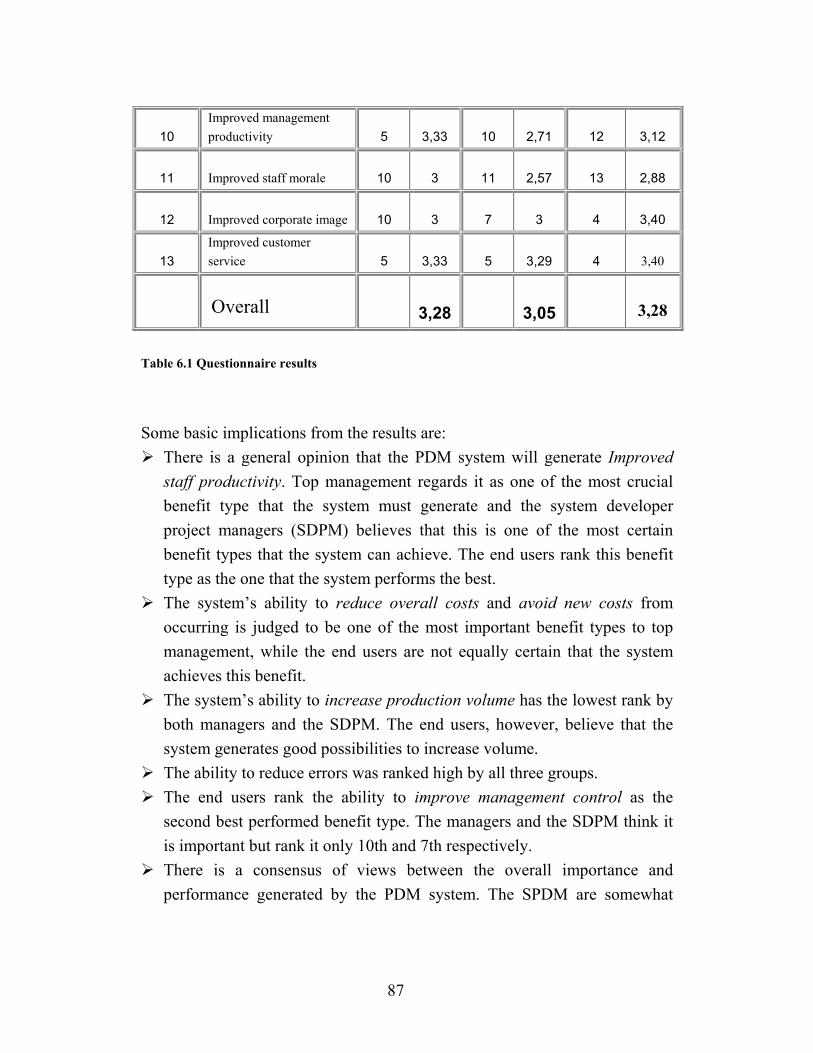
87
10 Improved management productivity 5 3,33 10 2,71
12
3,12
11 Improved staff morale 10 3 11 2,57
13
2,88
12 Improved corporate image 10 3 7 3
4
3,40
13 Improved customer service
5 3,33 5 3,29
4
3,40
Overall 3,28 3,05
3,28
Table 6.1 Questionnaire results
Some basic implications from the results are: There is a general opinion that the PDM system will generate Improved
staff productivity. Top management regards it as one of the most crucial benefit type that the system must generate and the system developer project managers (SDPM) believes that this is one of the most certain benefit types that the system can achieve. The end users rank this benefit type as the one that the system performs the best. The system’s ability to reduce overall costs and avoid new costs from
occurring is judged to be one of the most important benefit types to top management, while the end users are not equally certain that the system achieves this benefit. The system’s ability to increase production volume has the lowest rank by
both managers and the SDPM. The end users, however, believe that the system generates good possibilities to increase volume. The ability to reduce errors was ranked high by all three groups. The end users rank the ability to improve management control as the
second best performed benefit type. The managers and the SDPM think it is important but rank it only 10th and 7th respectively. There is a consensus of views between the overall importance and
performance generated by the PDM system. The SPDM are somewhat

88
more careful in their opinions of what benefit types the system will achieve. The SPDM are the group that is least positive to the PDM system with an overall opinion-score of 3,05. There are overall positive perceptions of what the PDM system will
perform for the company. All the groups have an overall opinion-score above 3,0.
The questionnaire result for each respondent group is presented graphically below.
2,00
2,50
3,00
3,50
4,00
1 2 3 4 5 6 7 8 9 10 11 12 13
ImportanceExpectationPerformance
Figure 6.2: Questionnaire result snake diagram.
7.4 GAP Analysis An analysis of the gaps is conducted with the purpose to explain why the specific discrepancies exist, and in the extend also what can be done to minimize them. The following variables are used: A = Importance scores B = Expectation scores C = Performance scores

89
GAP 1= (A - B) The first gap, GAP 1, is the differences in attitudes between the system developer project managers (SDPM) in the Autoliv group and the top managers. The top managers have in turn based their investment decision on the promises from the original architects and the specification of requirements. A – B = 3,28 – 3,05; GAP1 = 0,23. If (A - B) > 0 which is the case for Autoliv, the SDPM are claimed to have under-achieved in terms of what the top managers believed was possible. On the other hand, the top managers (or the original architects influencing the managers) could have been over-enthusiastic in their belief in what the system could perform, or the fact that the system was not fully understood at the outset. GAP 2 = (B - C) The second gap is the difference in attitudes between the SDPM and the end users. B – C = 3,05 – 3,28; GAP2 = - 0,23. If (B - C) > 0 the system users are claiming that the benefits have not been achieved in terms of what the SDPM believed was possible. They have developed a system that they believe can achieve more for the organization than what the end users believe. This does not appear to be the case for Autoliv. GAP2 < 0 for Autoliv which implies that the end users claim that the system has slightly over-performed in terms of what the SDPM believed was possible. Unexpected benefits have occurred from the use of the PDM system, or the already identified benefit areas are of a greater magnitude than expected. GAP 3 = (A - C) The third gap concerns difference in attitudes between the top management and the end users. That is the difference in attitudes towards the importance that the benefit is achieved and the attitudes of end-users that have
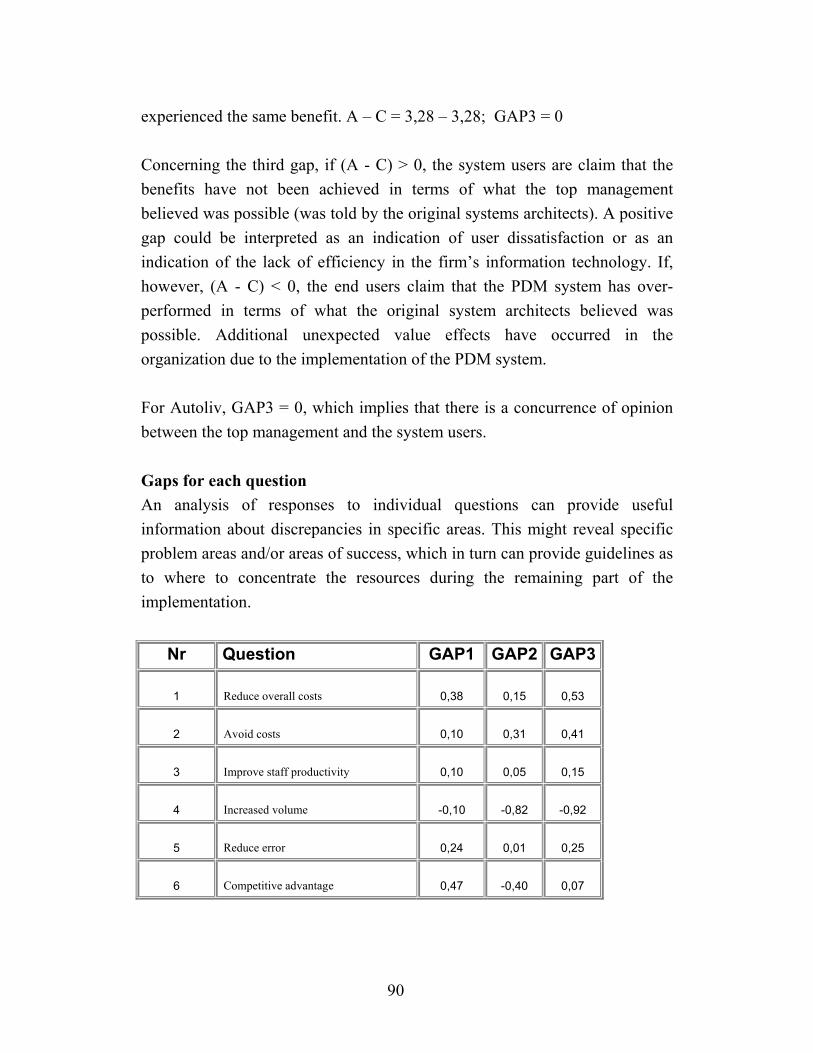
90
experienced the same benefit. A – C = 3,28 – 3,28; GAP3 = 0 Concerning the third gap, if (A - C) > 0, the system users are claim that the benefits have not been achieved in terms of what the top management believed was possible (was told by the original systems architects). A positive gap could be interpreted as an indication of user dissatisfaction or as an indication of the lack of efficiency in the firm’s information technology. If, however, (A - C) < 0, the end users claim that the PDM system has over-performed in terms of what the original system architects believed was possible. Additional unexpected value effects have occurred in the organization due to the implementation of the PDM system. For Autoliv, GAP3 = 0, which implies that there is a concurrence of opinion between the top management and the system users. Gaps for each question An analysis of responses to individual questions can provide useful information about discrepancies in specific areas. This might reveal specific problem areas and/or areas of success, which in turn can provide guidelines as to where to concentrate the resources during the remaining part of the implementation.
Nr Question GAP1 GAP2 GAP3
1 Reduce overall costs 0,38 0,15 0,53
2 Avoid costs 0,10 0,31 0,41
3 Improve staff productivity 0,10 0,05 0,15
4 Increased volume -0,10 -0,82 -0,92
5 Reduce error 0,24 0,01 0,25
6 Competitive advantage 0,47 -0,40 0,07

91
7 Catch up with competition 0,90 -0,75 0,15
8 Improved management information -0,24 0,20 -0,04
9 Improved management control 0 -0,42 -0,42
10 Improved management productivity 0,62 -0,41 0,21
11 Improved staff morale 0,43 -0,31 0,12
12 Improved corporate image 0 -0,40 -0,40
13 Improved customer service 0,04 -0,11 -0,07
Overall 0,23 -0,23 0,00
Table 6.2: Question gaps
Table 6.2 presents the specific gaps between the groups for each specific question. There are some implications:
There are no gaps exceeding 1 unit. This implies, overall, small discrepancies in views between the groups. Top managers and the SDPM totally agree in their opinion about the
systems ability to improve management control. The negative GAP2 and GAP3 imply that the end users feel that the system has improved the ability for management to control to a greater magnitude. Top managers and the SDPM totally agree about the system’s ability to
improve the corporate image. The negative GAP2 and GAP3 imply that the end users believe that the system has improved the corporate image to a greater extent. Management has not based the IS investment decision on the
importance of increasing production volume. According to the managers and the SDPM, increased volume is the least important benefit type for the IS to fulfill (see table 6.1), but the negative GAP2 and GAP3 show that the end users are of the opinion that the system provides much better opportunities for increased production volume.

92
Below the gaps for each question are presented graphically in a snake diagram:
GAP Result
-1,5
-1
-0,5
0
0,5
1
1 2 3 4 5 6 7 8 9 10 11 12 13
Question
Gap
val
ue GAP1GAP2GAP3
Figure 6.3: Gap snake diagram
7.4.1 Response variability The variability in responses within the groups, as measured by the standard deviation, can also provide useful information. The standard deviation for the end users (0,69) is lower than for the SDPM (0,86). This may imply that users are less able to discriminate in their responses to the questionnaire than the specialist. This in turn may suggest a need for additional user education in the system at ASP. For ALS this shows the importance of extensive education in the system from the very beginning. A larger standard deviation within the groups for each specific benefit type indicate a lower consensus of views among the respondents. The mean score can differ from the median because of high variability in the answers. This means that one can not conclude that for example the end users’ opinion was in average “good” based on a mean score of 3,0. This since there is a

93
possibility of scores of 4:s and 2:s exclusively, which implies that no one had the opinion “good”. The median together with the mean provide a better measurement.
Table 6.3 Response variability
The above table states the mean, standard deviation and the median for each question and respondent group. When comparing the mean and the median, it is obvious that most of the questions have a median that corresponds to their mean. For instance the first two questions, which show a median that is the closest whole number to the mean. For question number five, the systems ability to reduce errors, the median score does not correspond to the mean for the end users and the SPDM. The means are below 3,5 but the median scores are 4. The high standard deviations for the same question also imply a lower consensus of views.
End users SDPM Management
Question Mean Std dev Median Mean Std dev Median Mean Std dev Median
1 3,14 0,625 3 3,29 0,488 3 3,67 0,577 4
2 3,26 0,630 3 3,57 0,535 4 3,67 0,577 4
3 3,52 0,656 4 3,57 1,134 4 3,67 0,577 4
4 3,25 0,676 3 2,43 1,134 3 2,33 1,155 3
5 3,42 0,746 4 3,43 0,787 4 3,67 0,577 4
6 3,26 0,664 3 2,86 0,690 3 3,33 0,577 3
7 3,18 0,569 3 2,43 0,535 2 3,33 0,577 3
8 3,37 0,725 3 3,57 0,787 4 3,33 0,577 3
9 3,42 0,634 3 3,00 1,000 3 3,00 0,000 3
10 3,12 0,758 3 2,71 0,488 3 3,33 0,577 3
11 2,88 0,743 3 2,57 0,976 3 3,00 0,000 3
12 3,40 0,630 3 3,00 0,816 3 3,00 0,000 3
13 3,40 0,713 4 3,29 0,756 3 3,33 0,577 3

94
7.4.2 Performance analysis The simple mean performance scores show that all but one benefit type (Improved staff morale) can be said to perform “Good” with mean values of over 3,0. In order to establish the significance of the means and if the benefit types could possibly remain, the “Good” hypothesis a T-Test was performed where a 99% confidence interval was calculated, (Table 6.4 below). To qualify as “Good performance” the lower limit of the interval has to be > 3,0.
Test Value = 0
Question
t
df
Mean
Difference
99% Confidence Interval of the Difference
Lower Upper 1 47,979 90 3,1429 2,9705 3,3152 2 49,454 90 3,2637 3,0901 3,4374 3 51,139 90 3,5165 3,3355 3,6974 4 45,868 90 3,2527 3,0661 3,4394 5 43,682 90 3,4176 3,2117 3,6235 6 46,895 90 3,2637 3,0806 3,4469 7 53,199 90 3,1758 3,0187 3,3329 8 44,394 90 3,3736 3,1736 3,5736 9 51,454 90 3,4176 3,2428 3,5924 10 39,291 90 3,1209 2,9119 3,3299 11 36,970 90 2,8791 2,6742 3,0841 12 51,389 90 3,3956 3,2217 3,5695 13 45,428 90 3,3956 3,1989 3,5923
Table 6.4 Performance score evaluation using 99% confidence interval
The result shows that with 99% certainty 10 of the 13 benefit types are performed “Good” by the system, according to the opinion of the end users at ASP. The three areas that did not classify as “Good” performance are the system’s ability to: (1) reduce overall costs, (2) improve management productivity and (3) improve staff morale.
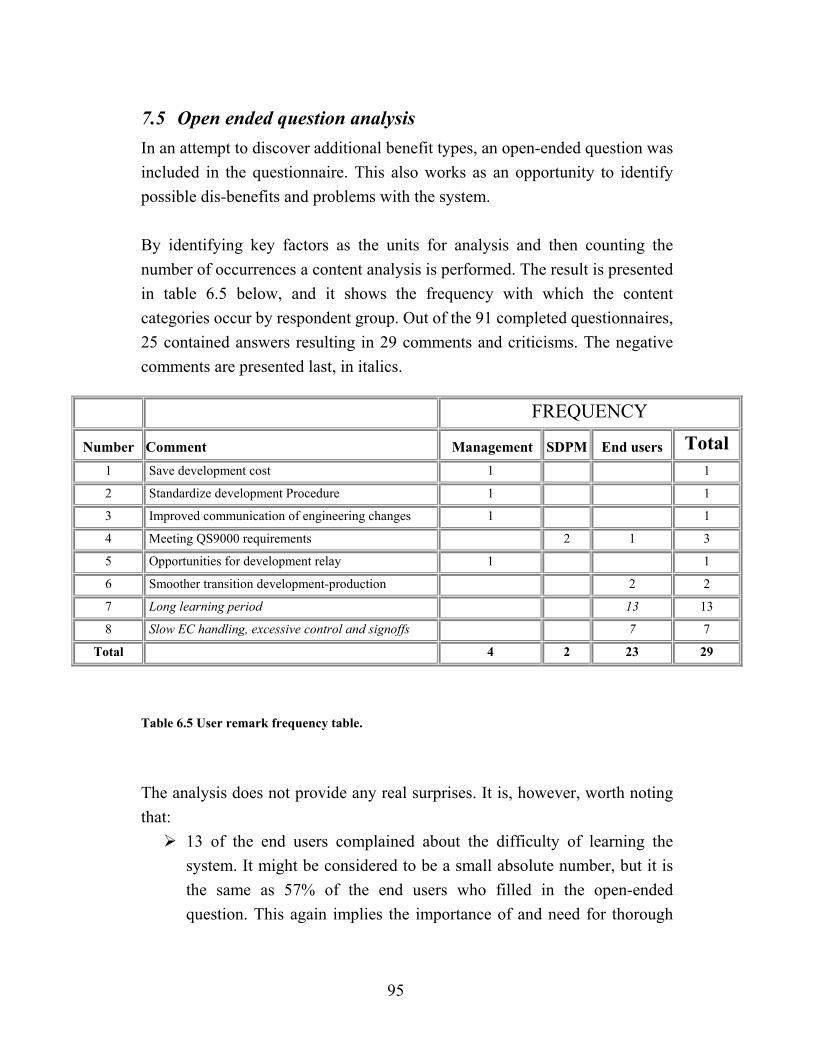
95
7.5 Open ended question analysis In an attempt to discover additional benefit types, an open-ended question was included in the questionnaire. This also works as an opportunity to identify possible dis-benefits and problems with the system. By identifying key factors as the units for analysis and then counting the number of occurrences a content analysis is performed. The result is presented in table 6.5 below, and it shows the frequency with which the content categories occur by respondent group. Out of the 91 completed questionnaires, 25 contained answers resulting in 29 comments and criticisms. The negative comments are presented last, in italics.
Table 6.5 User remark frequency table.
The analysis does not provide any real surprises. It is, however, worth noting that:
13 of the end users complained about the difficulty of learning the system. It might be considered to be a small absolute number, but it is the same as 57% of the end users who filled in the open-ended question. This again implies the importance of and need for thorough
FREQUENCY
Number Comment Management SDPM End users Total 1 Save development cost 1 1
2 Standardize development Procedure 1 1
3 Improved communication of engineering changes 1 1
4 Meeting QS9000 requirements 2 1 3
5 Opportunities for development relay 1 1
6 Smoother transition development-production 2 2
7 Long learning period 13 13
8 Slow EC handling, excessive control and signoffs 7 7
Total 4 2 23 29

96
education. 7 end users stated that the EC handling39 works slowly and
inefficiently. This could be an alarming fact, since one of the system’s greatest required benefits is to improve the efficiency in the EC handling.
7.6 Summary The findings in this chapter can be summarized in the following points: There is a consensus of views between the overall importance of and
performance generated by the PDM system. The SPDM are somewhat more careful in their opinions of what benefit types the system will achieve. There is a strong opinion that the PDM system will generate Improved
staff productivity. Top management regard it as one of the most crucial benefit types that the system must generate and the system developer project managers (SDPM) believe that this is one of the most certain benefit types that the system can achieve. The end users rank this benefit type as the one the system performs the best. There are no gaps exceeding 1 unit. This implies small discrepancies of
views between the groups overall. Many of the end users complained about the difficulty of learning the
system. This implies the importance of and need for thorough education in the IS applications.
8 Conclusions and Recommendations The major findings from the two researches in this paper are presented below.
39 EC is an abbreviation for engineering change, which is the work process resulting from a change on a drawing.
97
8.1 Tangibles The PDM project will generate a positive net present value. Monthly
released time amounts to over 700,000 SEK and the PDM system will generate additional direct costs for ALS of approximately 25 million SEK in the years 1998 to the end of 200540. The proposed network would increase the cost by 21 million SEK41 over the same period of time. The proposed network has a large impact on the NPV of the investment. Calculations show that if the PDM system is to bear the entire cost of the new network, ceteris paribus, the investment goes from a positive NPV of 7,9 million SEK to a negative NPV of -5,2 million SEK. The time to transfer the product data into the PDM system highly
affects the result of the investment. The direct transition cost for ALS is approximately 1,5 million SEK, (which equals 2 years’ full time work for 1 person), but the indirect cost occurring when the transition time increases and delays the start of the system is substantial. Without data in the IS, it is not possible to realize the potential benefits. Sensitivity analysis shows that the lost cash inflows after tax range from 144,000 SEK after one month to approximately 1,6 million SEK after 12 months. To avoid lost cash inflows, Autoliv should early concentrate major resources in this area. If ALS is going to reach a payback time of one year (calculated from
the beginning of year 2000) for the PDM investment, the intangible benefits has to be worth at least 5,000,000 SEK at the end of year 200042.
8.2 Intangibles There is an overall consensus of opinions between the groups in the
company about the PDM system’s excellence in realizing the identified
40 When using NPV scenario 1. 41 Nominal values. 42 When using NPV scenario 1.

98
intangible benefit types. The low response rate from the end users must, however, be considered. With 99% certainty, 10 of the 13 benefit types are performed “Good”
by the system, according to the opinion of the end users at ASP. The three areas that were not classified as “Good” performance are the system’s ability to: (1) reduce overall costs, (2) improve management productivity and (3) improve staff morale. Due to the differences in starting points between ALS and ASP the
learning period will probably be longer at ALS. In addition, the results of the open-ended question show that even the end users in the USA think the system is complicated and difficult to learn. To minimize the learning period and reduce the implementation time Autoliv needs to concentrate major resources on education and support as early as possible. ALS is highly dependent on the other companies to implement the
PDM system. Many of the benefits, both tangibles and intangibles, cannot be realized if ALS alone uses the PDM system.
8.3 Further research An extensive investigation of the volatility of future cash flows from the PDM system would create opportunities for applying real option pricing modeling on the investment. This could provide useful management information when incorporating information that is received later in the life of the investment. It would also reflect the value of the option to defer upgrades, the possibility to terminate a project, the possibility to expand, the possibility to decrease an activity and the possibility to shift a strategy. Finding the learning curve for the Autoliv PDM system would make it possible to deepen the analysis of the impact of the learning time on the investment profitability.

99
Performing a user attitude analysis at ALS when the system has been running for approximately two years as well as a new GAP analysis, would give valuable information of the real success of the PDM system and of the implementation procedure. It would also be possible to get an opinion of the accuracy of the findings from this thesis where the end users at ASP were used.

100
Bibliography
Aczel, A, D: Complete Business Statistics, Homewood: IL Irwin corp. 2nd ed. 1993.
Autoliv Inc, Annual Report 1998.
Bernoch, M; Kaufman, R: A case for using real options pricing analysis to evaluate information technology project investments, Information Systems Research, Vol 10, No 1, March 1999, pages 70 – 86.
Berthon, P; Deon, N; Leyland, P: Service quality in an information system department: assessing the internal gaps, HWP 9535, 1995. Cash,Jr, J; McFarlan, W, Mckenney, J: Corporate Information Systems Management, The issues facing senior executives, Third edition, Boston, 1992.
CIMdata, Product Data Management: The Definition, Fourth edition, 1996.
Cooper, D, R. & Schindler, P S.: Business research methods, Irwin/McGraw-Hill, sixth edition, 1998.
Copeland, T & Weston, F: Financial Theory and Corporate Policy, Addison-Wesley, Reading, 1992.
Eason, K: Information Technology and Organisational Change, Taylor and Francis, London, 1998.
Farbey, B; Land, F: IT Investment, Butterworth Heinemann, Oxford, 1993.
Ghauri, P; Grönhaug K; Kristianslund, I: Research methods in business studies, Prentice Hall, 1995.
Hitt, L; Brynjolfsson, E: Productivity, Business Profitability and Consumer

101
Surplus, MIS Quarterly, June 1996, p 121-142.
Holme, I, M. & Solvang, B, K: Forskningsmetodik, Studentlitteratur, Lund, 1997.
Hull, J, C: Options, Futures and other Derivatives, Third edition, Prentice – Hall. Inc, 1997.
Kinnear, T.C. & Taylor, J.R: Marketing research, an applied approach, McGraw-Hill, 1979.
Kinnear, T.C. & Taylor, J.R: Marketing research, an applied approach, McGraw-Hill, 1990.
Lekvall, P; Wahlbin, C: Information for marknadsföringsbeslut, 3rd ed. Göteborg, IHM, 1993.
Lientz, P. B; Rea, P. K: Breakthrough Technology Project Management, Academic Press 1999.
Parker, M; Benson, R; Trainor H: Information Economics, Prentice Hall, London, 1988.
Phillips, B, S: Social Research Strategy and Tactics, 2nd ed. Macmillan New York, 1971.
Rees, D, G: Essential Statistics, Chapman and Hall, Second Edition. 1990.
Remenyi, D; Money, A; Twite, A: Effective measurement & management of IT costs and Benefits, Butterworth-Heinemann, Oxford, 1995.
Remenyi, D; Sherwood-Smith, M: Achieving maximum value from information systems, A process Approach, John Wiley & Sons, Chichester, 1997.
Starrin, B: Från upptäckt till presentation: om kvalitativ metod och teorigenerering på empirisk grund, Lund studentlitteratur, Lund, 1991.
Strassman, P: The business value of computers, The Information Economic

102
Press, New Canaan, 1990.
Watsom, C, Billinsley, P; Croft, J; Huntsberger, D: Statistics for management and Economics, 4th ed. Allyn and Bacon Massachusetts, 1990.
Wen, J; Yen, D; Lin, B: Methods for measuring information technology investment payoff, Human Systems Management 17, 1998.
Wiedersheim-Paul, F; Eriksson, L T: Att utreda forska och rapportera, 6:th ed. Stockholm Liber ekonomi, 1997.
Yin, R, K: Case Study Research – Design and Methods, Sage Publications, 1984.

103

104
Appendices