1111 III Ill III III lI ll III II ill THE EFFECT OF POFA AS CEMENT ...
PERPUSTAKAAN UMP
1111 III Ill I Ill II III 0000092745
WATER QUALITY INDEX OF SUNGAT PAHANG
HAFIDZ ARIF BIN OSMAN
Report submitted in partial fulfilment of the requirements for the award of the degree of
Bachelor of Civil Engineering
Faculty of Civil Engineering and Earth Resources UNIVERSITI MALAYSIA PAHANG
JUNE 2013
ABSTRACT
Sungai Pahang is a river in Malaysia that is located at Pahang which is significantly degrading due to human activities as well as urbanization in the area. A study is conducted at selected area of the river to determine the water quality in Sungai Pahang at Kuala Pahang due to the development of Pekan during dry and wet time based on water quality parameters Biochemical Oxygen Demand (BOD), Chemical Oxygen Demand (COD), Dissolved Oxygen (DO), pH, Suspended Solids (SS) and Anmioniacal Nitrogen (NH3-N) in order to classify the river based on Water Quality Index (WQI) from the Department of Environment (DOE). DO and pH were analyzed as in-situ measurement while the rest of the parameters were analyzed in the laboratory. The selected stations was at near the restaurant area (Station 1), near to the recreational park (Station 2) and near to the construction site (Station 3). It was found that during dry time, the quality of water degrades significantly compared to during wet time for almost each water quality parameter. During dry time, Sungai Pahang can be classified as Class 2 while during wet time is classified under Class 3. Based on the outcomes, the water quality of Sungai Pahang is slightly polluted based on the calculation of WQI.
Vi
ABSTRAK
Sungai Pahang merupakan salah satu sungai di Malaysia yang terletak di Pahang clan semakin tercemar kesan daripada aktiviti manusia dan proses pembangunan di Pekan. Satu kajian dijalankan di sungai mi untuk menganalisis kualiti air Sungai Pahang, Pekan di kawasan yang terpilih semasa hari panas dan hari hujan berdasarkan kepada parameter-parameter kualiti air iaitu DO, BOD, COD, pH, SS clan NH3-N dengan tujuan untuk mengklasifikasikan sungai mi mengikut WQI-DOE. Parameter DO and pH dianalisa sebagai pengukuran in-situ manakala parameter-parameter lain dianalisa di makmal. Kawasan yang terpilih adalah kawasan sungai yang berdekatan dengan kawasan restauran (Stesen 1), kawasan berdekatan dengan pusat rekreasi (Stesen 2) clan kawasan yang berhampiran dengan kawasan pembinaan (Stesen 3). Setelah menjalankan analisis, didapati bahawa kualiti air merosot semasa hari panas jika dibandingkan dengan kualiti air semasa hari hujan bagi hamper setiap parameter kualiti air. Semasa hari panas, Sungai Pahang boleh dikelaskan sebagai Kelas 2 sementara kualiti air semasa hari hujan ialah berada di dalam kelas 3. Berdasarkan hasil kajian yang dibuat, kualiti air Sungai Pahang ialah sedikit tercemar berdasarkan pengiraan kualiti indek air.
VII
VIII
CHAPTER TITLE PAGE
DECLARATION OF STATUS THESIS i
DECLARATION OF SUPERVISOR
DECLARATION OF AUTHOR
DEDICATION iv
ACKNOWLEDGEMENTS v
ABSTRACT vi
ABSTRAK vii
TABLE OF CONTENTS viii
LIST OF TABLES xi
LIST OF FIGURES xii
LIST OF ABBREVIATIONS xiii
LIST OF APPENDIX xiv
1 INTRODUCTION
1.1 Introduction 1
1.2 Objectives 2
1.3 Scope of Works 2
1.4 Problem Statements 2
2 LITERATURE REVIEW
2.1 Introduction 4
2.2 Cause of River Pollution 5
2.2.1 Point Source Pollution 5
2.2.2 Non-Point Source Pollution 5
2.3 Water Quality Status in Malaysia 5
2.4 Water Quality Parameters 6
2.4.1 Dissolve Oxygen 7
2.4.2 Biochemical Oxygen Demand 9
2.4.3 Biochemical Oxygen Demand 10
2.4.4 pH 10
2.4.5 Ammoniacal Nitrogen 11
2.4.6 Suspended Solids 12
3 METHODOLOGY
3.1 Introduction 13
3.2 Data Collection 13
3.3 Preliminary Investigation 13
3.4 Sample Collection 14
3.5 Sample Preservation 14
3.6 Sample Analysis (In-Situ Test) 15
3.7 Sample Analysis (Laboratory Test) 15
3.8 Method Use for Laboratory Test 15
3.9 Equipment Used 16
3.10 Procedure 17
3.10.1 Biochemical Oxygen Demand 17
3.10.2 Chemical Oxygen Demand 17
3.10.3 Total Suspended Solid 18
3.10.4 Ammoniacal Nitrogen 19
3.10.5 Nitrate 19
3.10.6 Heavy Metals 20
3.11 Analysis Data and Result 20
4 RESULT AND ANALYSIS
4.1 Introduction 21
4.2 Water Quality Parameter 21
4.3 Data Analysis (In-Situ Test) 22
4.3,1 pH 22
4.3.2 Electrical Conductivity 23
4.3.3 Turbidity 23
4.3.4 Temperature 24
4.3.5 Dissolve Oxygen 25
4.3.6 Total Dissolve Solid 26
4.4 Data Analysis (Laboratory Test) 26
4.4.1 Biochemical Oxygen Demand 26
ix
x
4.4.2 Chemical Oxygen Demand 27
4.4.3 Total Suspended Solid 28
4.4.4 Ammoniacal Nitrogen 28
4.4.5 Nitrate 29
4.4.6 Heavy Metals 30
4.5 Water Quality Index 32
4.5.1 Dry Day 32
4.5.2 Wet Day 33
4.6 Data Analysis Class Overview 35
5 CONCLUSION AND RECOMMENDATIONS
5.1 Conclusion 37
5.2 Recommendations 38
REFERENCES 39
APPENDICES 40
Appendix A 41
Appendix B 43
Appendix C 46

LIST OF TABLES
Table No Title Page
3.1 Preservation technique 14
3.2 Laboratory test Methods 15
3.3 Laboratory Test Equipment 16
4.1 Sub Index for WQI Calculation at Station 1 (Dry Day) 32
4.2 Sub Index for WQI Calculation at Station 2 (Dry Day) 33
4.3 Sub Index for WQI Calculation at Station 3 (Dry Day) 33
4.4 Sub Index for WQI Calculation at Station 1 (Wet Day) 33
4.5 Sub Index for WQI Calculation at Station 2 (Wet Day) 34
4.6 Sub Index for WQI Calculation at Station 3 (Wet Day) 34
4.7 Classification of Water Quality based on difference parameter 35
(Dry)
4.8 Classification of Water Quality based on difference parameter 36
(Wet)
Xi
LIST OF FIGURES
Figure No Title Page
2.1 Number of River Basins Monitored Each Year and 6
Classification of River Basins Water Quality Trends (1990-
2001), (DOE, 2001)
2.2 Oxygen sag curve based on pollution loading (NERC, 2005) 7
2.3 Oxygen sag curve constituents (NERC, 2005) 7
4.1 Graph of pH value 22
4.2 Graph of Electrical Conductivity 23
4.3 Graph of Turbidity 24
4.4 Graph of Temperature 25
4.5 Graph of Dissolve Oxygen 25
4.6 Graph of Total Dissolve Solid 26
4.7 Graph of Biochemical Oxygen Demand 27
4.8 Graph of Chemical Oxygen Demand 27
4.9 Graph of Total Suspended Solid 28
4.10 Graph of Ammoniacal Nitrogen 29
4.11 Graph of Nitrate 29
4.12 Graph of Lead 30
4.13 Graph of Iron 31
4.14 Graph of Copper 31
4.15 Graph of Manganese 32
XII
LIST OF ABBREVIATIONS
BOD Biochemical Oxygen Demand
COD Chemical Oxygen Demand
DO Dissolved Oxygen
DOE Department of Environment
TDS Total Dissolve Solids
TSS Total Suspended Solids
EC Electrical Conductivity
NWQS National Water Quality Standard
NH3-N Ammonical Nitrogen
NO 3 Nitrate
mg/L Milligram per litre
NTU Nephelometric Turbidity Units
ps/cm Microsiemens per centimetre
WQI Water Quality Index
Fe Iron
Cu Copper
Pb Lead
Mn Manganese
XIII
LIST OF APPENDIX
Appendix No Title
A DOE Water Quality Classification
Index Range of Water Quality
National Water Quality Standard for Malaysia (NWQS)
B Total Suspende Solid Equipment
Atomic Absorption Spectrophotometer
Dissolve Oxygen Meter
Spectrophotometer DR5000
Horiba Apparatus
COD Reactor
C WQI Formula And Calculation
xiv
CHAPTER 1
INTRODUCTION
1.1 Introduction
Water is a vital resource, necessary for all aspects of human and ecosystem
survival and health. In addition, to drink and personal hygiene, water is needed for others
uses such as agricultural production, industrial and manufacturing processes,
hydroelectric power generation, waste assimilation, recreation, navigation enhancement
of fish and wildlife and variety of others purposes (Biswas, 1981).
Water quality is affected by a wide range of natural and human influences. The
most important of the natural influences are geological, hydrological and climatic,
since these affect the quantity and the quality of water available. Their influence is
generally greatest when available water quantities are low and maximum use must be
made of the limited.
The effects of human activities on water quality are both widespread and varied
in the degree to which they disrupt the ecosystem and/or restrict water use Pollution of
water by human faeces, for example, is attributable to only one source, but the reasons
for this type of pollution, its impacts on water quality and the necessary remedial
or preventive measures are varied.
1
2
1.2 Objective
The objectives of carrying out this study are
i. To determine the physico-chemical characteristics of Sungai Pahang
ii. To classify the water based on Water Quality Index (WQI)
1.3 Scope of Works
The area of research is based on the water quality index of Sungai Pahang and its
tributaries. Sampling points are predetermined for field and laboratory testing. In this
research, the various water quality parameters are obtained through field and laboratory
testing.
Water quality parameters involved for the in situ testing is dissolved oxygen (DO)
and pH while laboratory testing include biological oxygen demand (BOD), chemical
oxygen demand (COD), ammoniacal nitrogen (NI3-N) & total suspended solid (TSS).
Physico-chemical characteristic parameters involved for my study are nitrate
(NO3), turbidity, total dissolve solid (TDS), temperature, electricity conductivity (BC),
dissolve oxygen (DO), pH and heavy metals that consists of lead (Pb), iron (Fe),
manganese (Mn) and copper (Cu).
1.4 Problem Statements
Due to the rapid development and urbanization process around the area, the water
quality of Sungai Pahang is significantly degrading. The pollution of the river is
seemingly obvious because it could be easily judged by the look, colour and smell of the
river. The residents around the area also complained that the river is much polluted.
It is important to study the level of pollution in the river currently and determine
the causes of pollution in order to recommend suitable solutions to the problem. This can
be done by identifying the major constituents degrading the quality of the water in Sungai
Pahang. All this is ensure clean water supply and to protect the health of the people
around the area besides preserving the environment of the ecosystem of the river. The
need to collect data is to document existing water quality conditions in Sungai Pahang
which could be useful for future reference.
Quality water of Sungai Pahang effect by human activities such as construction
site, restaurant area and recreational park.
CHAPTER 2
LITERATURE REVIEW
2.1 Introduction
Rivers are a very important natural resource to our country. Not only majority of
our water supply comes from rivers, but in fact rivers also provide us with food as well
as generate income for the country through its aesthetic values. Therefore each and every
one of us needs to play a part in protecting our rivers. As can be seen in the diagram
below, only 3% of water on the earth is fresh water such as lakes, rivers and groundwater,
which is the only source of water available for human consumption while the rest consist
of sea water (Connell, 1974).
A river is a large natural waterway. The source of a river may be a lake or spring
known as headwaters. From their source, all rivers flow downhill, typically terminating
in the ocean. Smaller side streams that join a river are tributaries. The area drained by a
river and its tributaries is called its watershed. The flora and fauna of rivers are much
different from those of the ocean because the water is fresh or non-salty water (Da Cunha,
1985).
The most common point source of pollutant is probably sewage piped into rivers,
but chemical pollution is also common, and industrial accidents account for significant
destruction of aquatic life. Non-point source pollutants such as diffuse pollution from
agriculture, urbanization and construction activity are all recognized as sources of
sediment and other pollutants. Malaysia, in its objective to become a highly developed
nation in the near future, carries out many development activities currently which pose
threat to the environment,
4
5
2.2 Cause of River Pollution
River pollution is any human-caused contamination of water and river that
reduces its usefulness to humans and other organisms in nature. When our water supply
is contaminated, it is a threat to human, animal, and plant health unless it goes through a
costly purification procedure. According to Tchobanoglous and Schroeder (1985),
urbanization and uncontrolled development generally contributes significantly to river
pollution. There are many specific causes of water pollution, but firstly, it's important to
understand two broad categories of water pollution which are point source pollution and
non-point source pollution.
2.2.1 Point Source Pollution
Point source pollution occurs when harmful substances are emitted directly into a
body of water. An example of a point source of water pollution is a pipe from an industrial
facility discharging effluent directly into a river. These effluents contain chemical and
toxic waste which endangers living things. People throwing rubbish into the river is also
considered as point source pollution (McCaull and Crossland, 1974).
2.2.2 Non-Point Source Pollution
Non-point source delivers pollutants indirectly through transport or
environmental change. An example of a non-point-source of water pollution is when
fertilizer from a farm field is carried into a stream by rain through surface runoff (Whipple
and Hunter, 1977).
2.3 Water Quality Status in Malaysia
DOE's National River Water Quality monitoring started in 1978. It has now been
privatized to Syarikat Alam Sekitar Malaysia (ASMA). In 2001, a total of 931 stations
located within 120 river basins in Malaysia were monitored. Water samples taken from
these monitoring stations were analyzed to compute the Water Quality Index (WQI) based
6
on the following parameters such as BOD, COD, AN, pH, DO and SS. Other parameters
such as heavy metals and bacteria were also analyzed depending on site requirements.
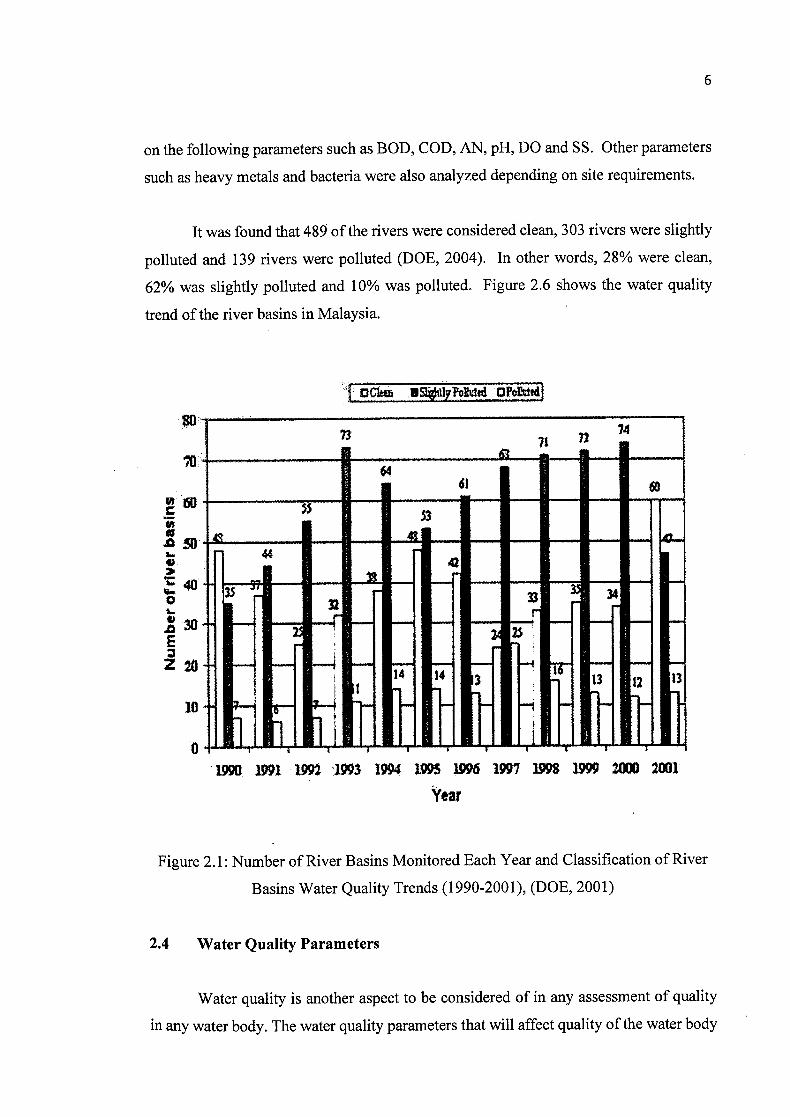
It was found that 489 of the rivers were considered clean, 303 rivers were slightly
polluted and 139 rivers were polluted (DOE, 2004). In other words, 28% were clean,
62% was slightly polluted and 10% was polluted. Figure 2.6 shows the water quality
trend of the river basins in Malaysia.
i. 1uih11
1990 1991 1992 1993 1994 1995 1996 1997 1998 1999 2000 2001
Year
Figure 2.1: Number of River Basins Monitored Each Year and Classification of River
Basins Water Quality Trends (1990-2001), (DOE, 2001)
2.4 Water Quality Parameters
Water quality is another aspect to be considered of in any assessment of quality
in any water body. The water quality parameters that will affect quality of the water body
7
such as DO, BOD, COD, pH, SS and AN. These 6 water quality parameters are according
to the DOE-WQI.
2.4.1 Dissolved Oxygen
Water should contain sufficient dissolved oxygen to maintain aerobic conditions.
It generally has been considered as significant in the protection of aesthetic qualities of
water as well as for the maintenance of fish and other aquatic life. The amount of
dissolved oxygen (DO) in water bodies is dependent upon temperature, salinity,
turbulence and atmospheric pressure. The concentration of dissolved oxygen is subject
to great variability due to temperature fluctuations, river discharge, biodepletion and re-
aeration processes. Gas solubility increases with decreasing temperature and salinity
(Meybeck et. al., 1989).
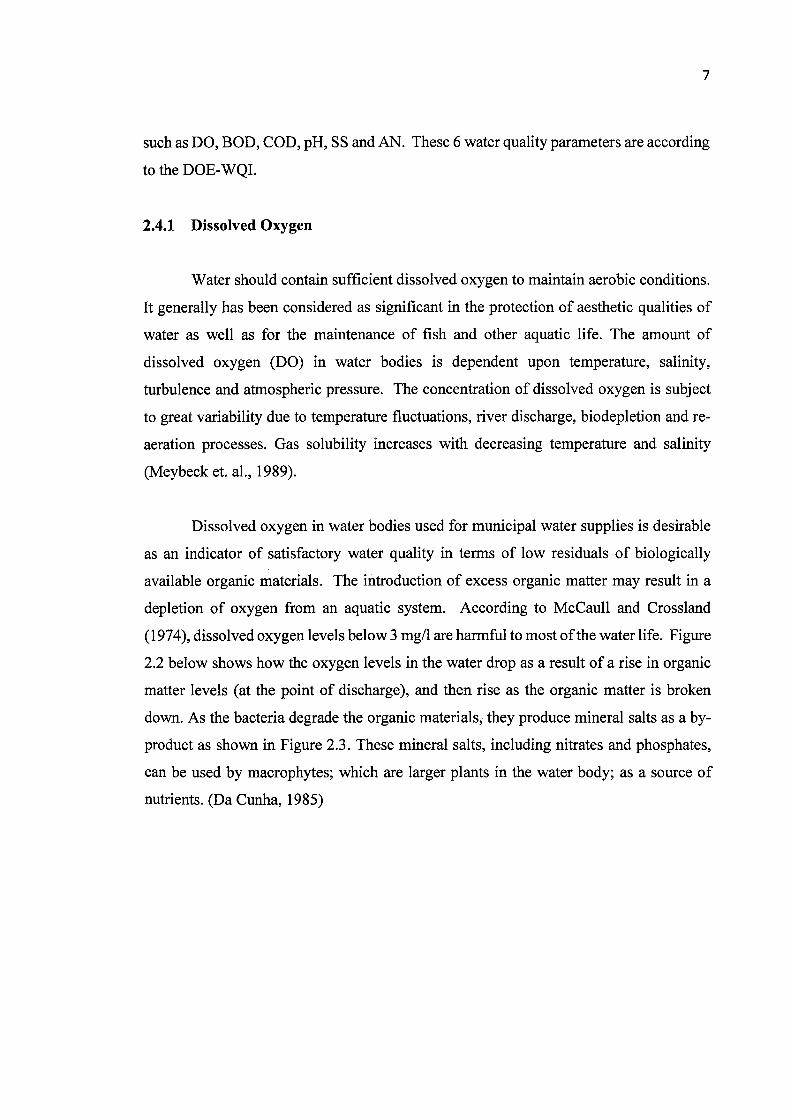
Dissolved oxygen in water bodies used for municipal water supplies is desirable
as an indicator of satisfactory water quality in terms of low residuals of biologically
available organic materials. The introduction of excess organic matter may result in a
depletion of oxygen from an aquatic system. According to McCaull and Crossland
(1974), dissolved oxygen levels below 3 mg/i are harmful to most of the water life. Figure
2.2 below shows how the oxygen levels in the water drop as a result of a rise in organic
matter levels (at the point of discharge), and then rise as the organic matter is broken
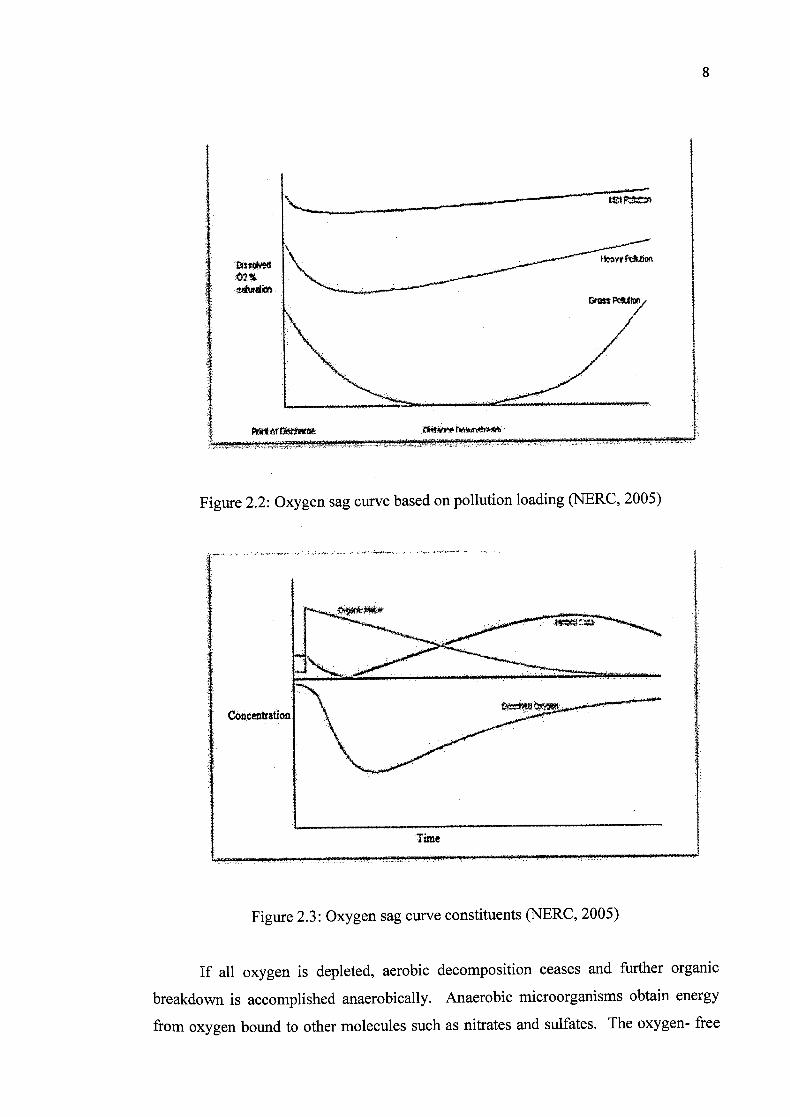
down. As the bacteria degrade the organic materials, they produce mineral salts as a by-
product as shown in Figure 2.3. These mineral salts, including nitrates and phosphates,
can be used by macrophytes; which are larger plants in the water body; as a source of
nutrients. (Da Cunha, 1985)
02%
8
Centratioi
Figure 2.2: Oxygen sag curve based on pollution loading (NERC, 2005)
Time
Figure 2.3: Oxygen sag curve constituents (NERC, 2005)
If all oxygen is depleted, aerobic decomposition ceases and further organic
breakdown is accomplished anaerobically. Anaerobic microorganisms obtain energy
from oxygen bound to other molecules such as nitrates and sulfates. The oxygen- free
9
conditions result in the mobilization of many otherwise insoluble compounds. As sulfate
compounds break down, the water may smell like rotten eggs (Tchobanoglous and
Edward, 1985).
2.4.2 Biochemical Oxygen Demand
Most organic materials such as those from waste water treatment plants, industrial
effluents and agricultural run-off are biodegradable. The amount of oxygen used in the
metabolism of biodegradable organics is termed biochemical oxygen demand. When
organic matter decomposes, microorganisms such as bacteria and fungi feed upon it and
eventually it becomes oxidized. Biochemical oxygen demand (BOD) is a measure of the
quantity of oxygen used by these microorganisms in the aerobic oxidation of organic
matter (Train, 1979).
When aquatic plants die, aerobic bacteria feed upon them and nutrients, such as
nitrates and phosphates, are released into the body of water, stimulating plant growth.
Eventually, more plant growth leads to more plant decay. Nutrients can be a prime
contributor to high biochemical oxygen demand in rivers. In rivers with high biochemical
oxygen demand levels, aerobic bacteria consume much of the available dissolved oxygen,
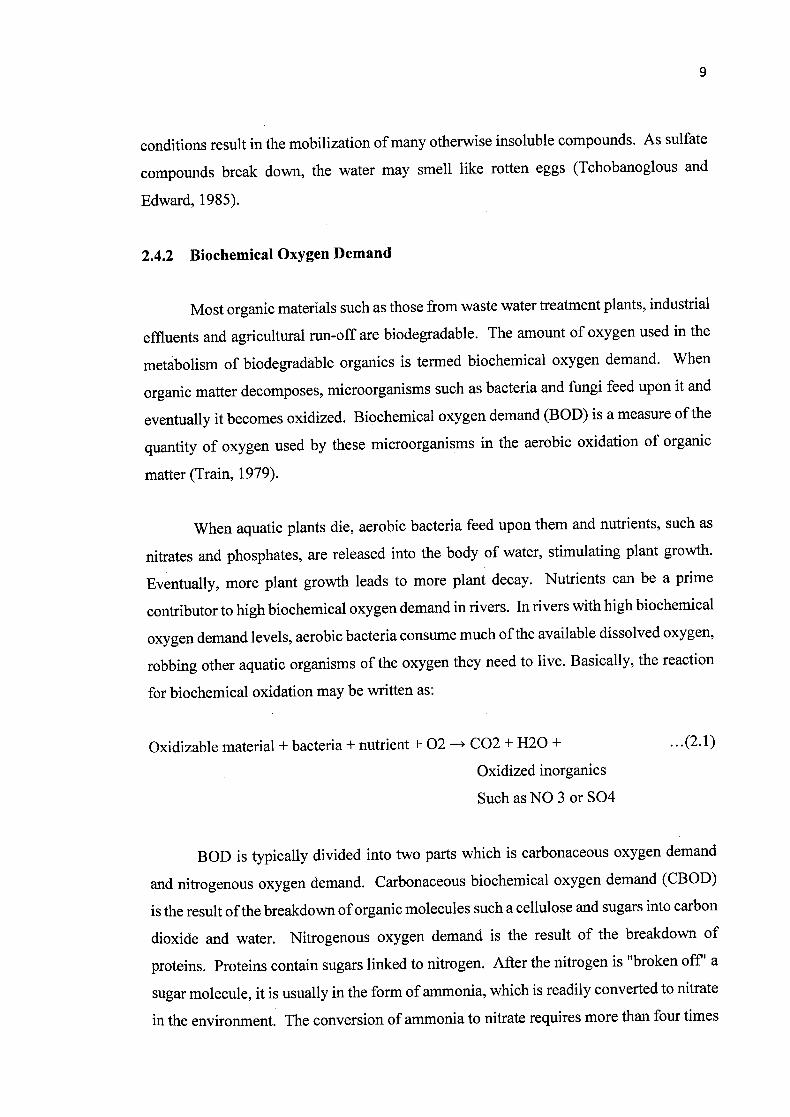
robbing other aquatic organisms of the oxygen they need to live. Basically, the reaction
for biochemical oxidation may be written as:
Oxidizable material + bacteria + nutrient + 02 -* CO2 + H20 + .. .(2.1)
Oxidized inorganics
Such as NO 3 or SO4
BOD is typically divided into two parts which is carbonaceous oxygen demand
and nitrogenous oxygen demand. Carbonaceous biochemical oxygen demand (CBOD)
is the result of the breakdown of organic molecules such a cellulose and sugars into carbon
dioxide and water. Nitrogenous oxygen demand is the result of the breakdown of
proteins. Proteins contain sugars linked to nitrogen. After the nitrogen is "broken off' a
sugar molecule, it is usually in the form of ammonia, which is readily converted to nitrate
in the environment. The conversion of ammonia to nitrate requires more than four times
10
the amount of oxygen as the conversion of an equal amount of sugar to carbon dioxide
and water (Tchobanoglous and Schroeder, 1985).
2.4.3 Chemical Oxygen Demand
Chemical oxygen demand (COD) is a water quality parameter to indicate the level
of pollution in the water based on chemical characteristics and is a measure of the amount
of oxygen required to oxidize the organic matter chemically by a strong oxidant known
as dichromate and sulfuric acid. COD is therefore an estimate of the amount of organic
and reduced matter present in the water or better known as the amount of oxygen needed
to chemically decompose the organic matter in the water (Klein, 1957). Oxidizable
chemicals introduced into natural water will initiate chemical reactions. Those chemical
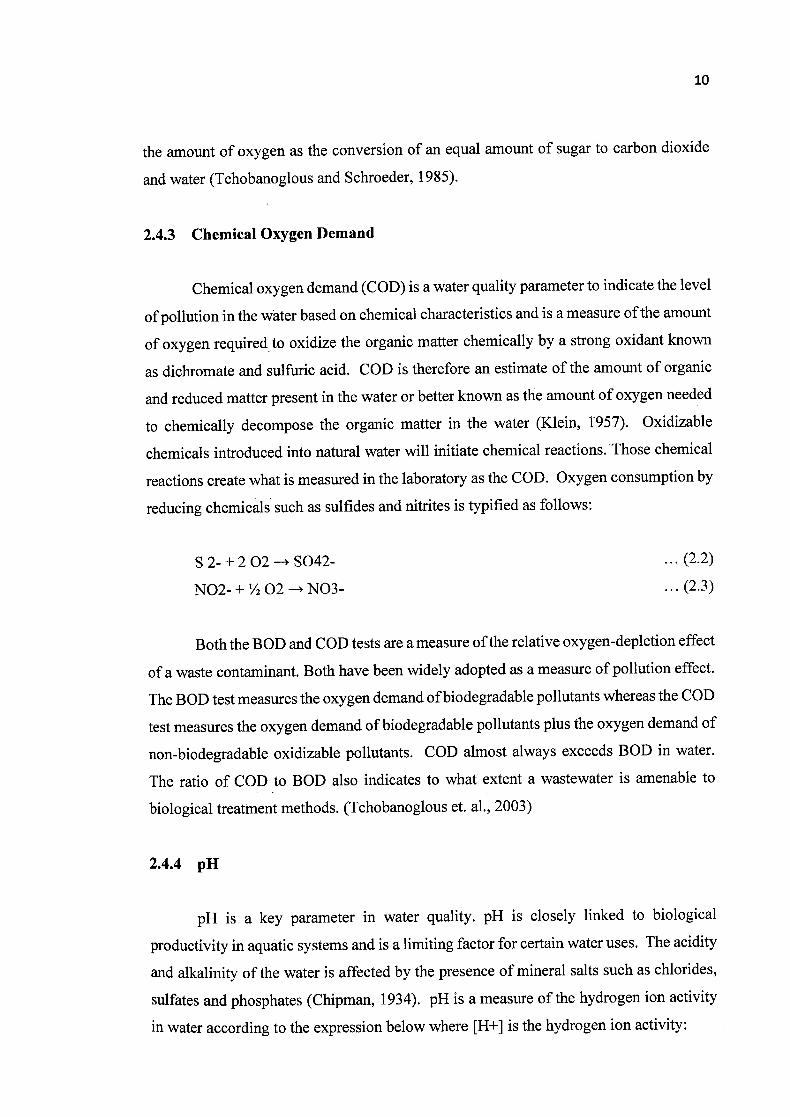
reactions create what is measured in the laboratory as the COD. Oxygen consumption by
reducing chemicals such as sulfides and nitrites is typified as follows:
S 2- +2 02 -+ SO42- (2.2)
NO2- + V2 02 - NO3- (2.3)
Both the BOD and COD tests are a measure of the relative oxygen-depletion effect
of a waste contaminant. Both have been widely adopted as a measure of pollution effect.
The BOD test measures the oxygen demand of biodegradable pollutants whereas the COD
test measures the oxygen demand of biodegradable pollutants plus the oxygen demand of
non-biodegradable oxidizable pollutants. COD almost always exceeds BOD in water.
The ratio of COD to BOD also indicates to what extent a wastewater is amenable to
biological treatment methods. (Tchobanoglous et. al., 2003)
2.4.4 pH
pH is a key parameter in water quality. pH is closely linked to biological
productivity in aquatic systems and is a limiting factor for certain water uses. The acidity
and alkalinity of the water is affected by the presence of mineral salts such as chlorides,
sulfates and phosphates (Chipman, 1934). pH is a measure of the hydrogen ion activity
in water according to the expression below where [H+] is the hydrogen ion activity:
11
pH-loglO[H+] ...(2.4)
pH is important because the toxicity of many compounds is affected by pH value.
In addition, pH also affects the solubility of heavy metal compounds in water (Jones,
1964). pH in raw water used for public water supplies has to be adjusted to a suitable
level because it may be corrosive and adversely affect treatment processes. According to
Train (1979), the normal range of pH values for most rivers should be between 6.4 and
8.3 whereby it is also the suitable range of pH value for the survival of most aquatic
organisms and species.
2.4.5 Ammoniacal Nitrogen
Ammonia is the form of nitrogen present in aquatic systems that is the most
reactive. The principal sources of ammonia nitrogen (NH3-N) come from soil
mineralization, fertilizer, animal wastes, atmospheric deposition, and municipal and
industrial point sources. It can adhere to soils and sediment and can be toxic to aquatic
organisms at high concentrations. Young (1980) reported that the toxicity of ammonia
nitrogen to aquatic organisms depends on the pH and temperature of the water; for most
waters, hundreds of parts per million are needed for toxic effects. At the temperature and
pH range typical of most rivers and lakes, ammonia exists predominantly in the ionized
form (NH4+). As pH and temperature increase, the ionized ammonia changes to un-
ionized ammonia gas (NH3).
Generally, ammonia nitrogen is quickly taken up by phytoplankton or other
aquatic plants or transformed to nitrate-nitrogen. Once in the water, nitrates can stimulate
excessive plant and algae growth. Decomposition of the plant and algal material by
bacteria can deplete DO, adversely impacting fish and other aquatic animals. It has been
known that ammonia nitrogen is toxic to fishes and that the toxicity varies with the pH of
the water (Chipman, 1934). According to Wood (1974), measurements of values of total
ammonia nitrogen in the range of 0.02 mg/L NH3 are well within current analytical
capability and suitable for freshwater aquatic life.
12
2.4.6 Suspended Solids
The amount of particles that suspend in a sample of water is called total suspended
solids (TSS). It is important in drinking water quality and has significant impact on fish
and other aquatic life. SS are also a major carrier of inorganic and organic pollutants and
other nutrients. To remain permanently suspended in the river, particles must have
relatively low density, small in size, and have a surface area that is large in relation to
their weight. The greater the TS S in the water, the higher its turbidity and the lower its
transparency (McCaull and Crossland, 1974)
According to Martin and Meybeck (1979), the major sources of sediment come
from natural erosion due to rainfall, running water and wind which will carry the
sediments to the water body. Activities such as urbanization, construction and mining
operations also greatly contribute to sediment runoff through surface runoff (McCaull and
Crossland, 1974).
CHAPTER 3
METHODOLODY
3.1 Introduction
The accuracy of the results are dependent upon the samples which are taken, thus
very special attention must be given to the organization of the collection and sampling
techniques. This means that samples must be collected and stored in such a way that the
parameters measured in the sample have the same values as those in the river itself.
Furthermore, the sampling place and time must be chosen in such a way that the analytical
results reflect the temporal or local variations during the period of investigation (Rump
and Krist, 1992).
3.2 Data Collection
Data collection focuses on the methods to gather data needed for the study of
water quality in Sungai Pahang.
3.3 Preliminary Investigation
Before starting the sampling of water from Sungai Pahang, a preliminary study
was conducted at selected are. This is to confirm visual observations of the area to support
the analysis and the purpose of the study. Preliminary investigations is to select the station
to take the sample based on human activities. From there, suitable sampling locations and
monitoring media will be selected and water quality parameters identified.
13
14
3.4 Sample Collection
The sampling points are selected randomly. The sampling locations are influenced
by the location of human activities that surrounding the river. The information obtained
at preliminary survey stage is used at this stage to help determine the points. The three 3
stations that been selected is near to restaurant area (Station 1), near to recreational park
(Station 2) and near to the construction site (Station 3).
The sampling taking for two types of weather that during the dry and wet day.
Weather influenced the result value because of sample that been collect during rainy days
are different compared to sample that been taken during sunny day. During rainy days,
runoff water will flow through and transport together sort of material from the upper
surface of the river bank. This situation will give impact to the result values and it will
may probably different during normal day.
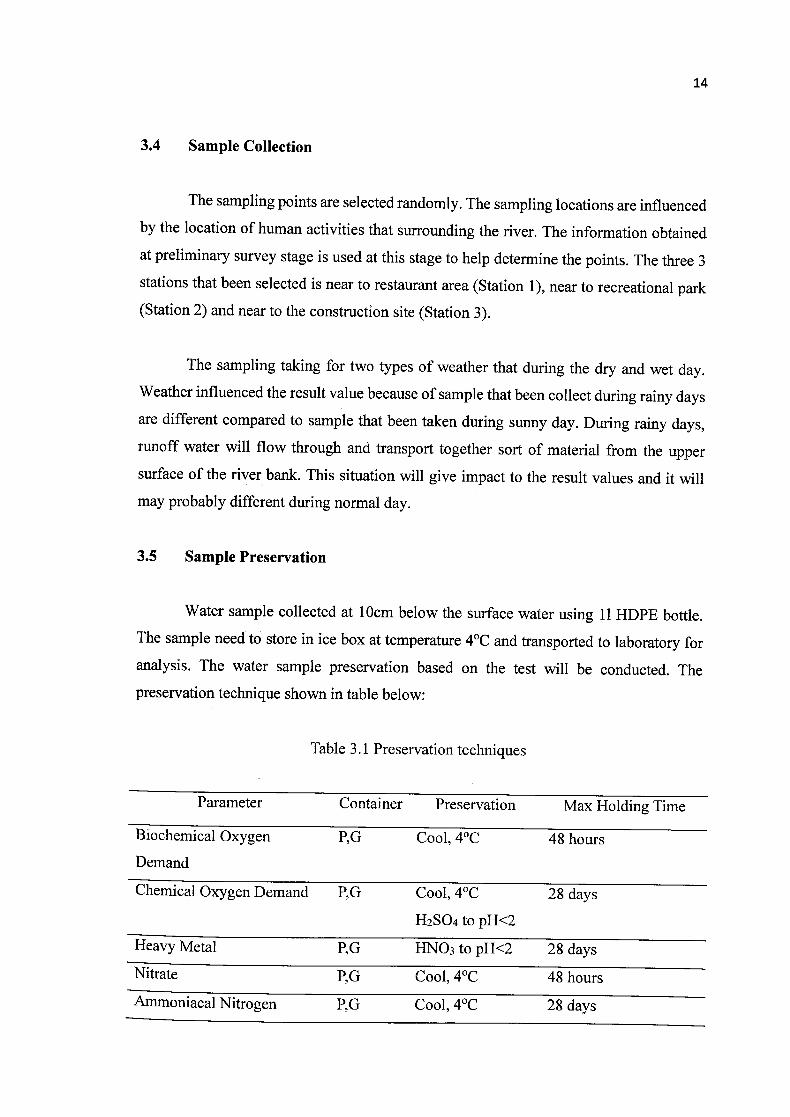
3.5 Sample Preservation
Water sample collected at 10cm below the surface water using 11 HDPE bottle.
The sample need to store in ice box at temperature 4°C and transported to laboratory for
analysis. The water sample preservation based on the test will be conducted. The
preservation technique shown in table below:
Table 3.1 Preservation techniques
Parameter Container Preservation Max Holding Time
Biochemical Oxygen
Demand
PG Cool, 4°C 48 hours
Chemical Oxygen Demand P,G Cool, 4°C
H2SO4 to pH<2
28 days
Heavy Metal PG HNO3 to pH<2 28 days
Nitrate P,G Cool, 4°C 48 hours
Ammoniacal Nitrogen PG Cool, 4°C 28 days