1111 III III I Il 1111 111111111
24
PERPUSTAKAAN UMP 1111 III III I Il 1111 111111111 0000073661 DETERMINATION tjr j i r -"-' '-'- zmjr.4ATIC HYDROCARBON (PAHs) IN ROAD DUST ALONG KUM4TAN-GAMBANG ROAD NUR ARIFAH BINTI JAAFAR Report submitted in partial fulfilment of the requirements for the award of Bachelor of Applied Science (Honor) in Industrial Chemistry Faculty of Industrial Sciences &' Tehiiology UNIVERSITI MALAYSIA PAHANG JANUARY 2012
Transcript of 1111 III III I Il 1111 111111111

PERPUSTAKAAN UMP
1111 III III I Il 1111 111111111 0000073661
DETERMINATION tjr j i r -"-' '-'- zmjr.4ATIC HYDROCARBON
(PAHs) IN ROAD DUST ALONG KUM4TAN-GAMBANG ROAD
NUR ARIFAH BINTI JAAFAR
Report submitted in partial fulfilment of the requirements for the award of Bachelor
of Applied Science (Honor) in Industrial Chemistry
Faculty of Industrial Sciences &' Tehiiology
UNIVERSITI MALAYSIA PAHANG
JANUARY 2012

iv
ABSTRACT
Polycyclic Aromatic Hydrocarbons , (PAHs) is a type of potential environments pollutants which consists of fused aromatic rings. PAHs do not contain heteroatoms or carry any substituents. Anthracene is one of the simplest examples of PAHs. PAHs are formed by incomplete combustion of carbon materials such as wood, coal, and diesel. PAils generated through combustion will emit to the ambient air as gases and particles. When the atmospheric PAils escaped the photo-degradation in the air, they will be accumulated to the land surface. In this study, road dust sample was collected along the Kuantan-Gambang road and the Polycyclic Aromatic Hydrocarbon (PAils) content then determined. Several main road lines in Kuantan-Gambang road were selected as sampling sites covering residential area, mining area, behind the FIST lab in UMP campus and etc. The samples were analyzed for the presence of total Polycyclic Aromatic Hydrocarbon (PAHs). Ultrasonic Agitation was used for the sample extraction. Next, the extracts were analyzed by UV-fluorescence spectrophotometer (Cary 50 Conc UV-Fluorescence Spectrophotometer Model) in order to determine the total PAHs at 254 nm excitation wavelength. The fluorescence intensities were measured at 360 nm, using crude oil solution as quantitative standard.

V
ABSTRAK
Polisiklik aromatic hidrokarbon (PAils) adalah sejenis penemaran persekitaran yang terdiri daripada paduan lingkungan Cincin. PAils tidak mempunyai sebarang heteroatoms atau sebarang gentian. Anthrance adalah salah satu contoh PA-Hs yang ringkas. PAHs teijadi akibat daripada pembakaran karbon yang tidak sempurna, di mana terdapatnya bahan bakar seperti arang, kayu dan juga diesel. PAHs yang terhasil melalui pembakaran akan terbebas di udara dalam bentuk gas dan zarah. Ketika PARs membolosi foto-degradasi di udara, mereka akan di kumpulkan di atas permukaan bumi. Sampel debu jalanan telah di kutip kali mi di sepanjang jalan Gambang-Kuantan dan kemudian kandungan PAils tentukan. Beberapa jalan utama sepanjang jalan Gambang-Kuantan telah di pilih sebagai kawasan sampel termasuk bebrapa kawasan perumahan, kawasan lombong, belakang makmal FIST di dalam kampus UMP serta beberapa kawasan lain lagi. Sampel kemudian di analisis untuk mengetahui kewujudan jumlah polisiklik aromatic hidrokarbon seperti yang telah disenaraikan oleh USEPA. Ultrasonic agitator telah digunakan untuk mengekstrak sample. Seterusnya, sample yang telah di ekstrak telah di analisis olehspektrometri UV-Fluorescence (Model Cary 50 Cone UV-Fluorescence Spectrophotometer) untuk menentukan jumlah PAils dengan 254 urn panjang gelombang pengujaan. Keamatan pendarfluor di ukur pada 360 nm menggunakan minyak mentah sebagai standard kuantitatif.

TABLE OF CONTENTS
SUPERVISOR'S DECLARATION
STUDENT'S DECLARATION
ACKNOWLEDGEMENTS
ABSTRACT
ABSTRAK
TABLE OF CONTENTS
LIST OF TABLES
LIST OF FIGURES xiii
LIST OF SYMBOLS xx
LIST OF ABBREVIATIONS xxiv
CHAPTER 1 INTRODUCTION
1.1 Background 1
1.2 Problem Statement 2
1.3 Research Questions 2
1.4 Research Objectives 3
1.5 Rational and Significance 3
CHAPTER 2 LITERATURE REVIEW
2.1 PAl-Is 4
2.1.1. Physical Characteristics of PAHs 5 2.1.2. Sources of PAHs 7 2.1.3. Health effect of PAHs 9
2.2. Road Dust 10
2.3. Previous Study 11
vi

V
CHAPTER 3 EXPERIMENTAL METHOD
3.1 Sampling Location 22 3.2 Sampling Method 24 3.3 Sample Preparation 24 3.4 Extraction.
25 3.5 Determination of total PAHs 25
CHAPTER 4 RESULTS AND DISCUSSION
4.1 Limit Of Detection & Limit Of Quantification 28 4.2 Result 29 4.3 Discussion 32
CHAPTER 5 CONCLUSION AND RECOMMENDATIONS
5.1 Conclusion and recommendations 35
REFERENCES 37 APPENDICES
A Analysed Samples 41 B Cary 50 Conc Uv-Fluorescence Spectrophotometer 42 C Shave Shaker 43 D Ultrasonic Agitator 44

LIST OF TABLES
Table No. Page
2.1 Physical-chemical characteristics of some PAils 6
2.2 Locations and character sites over Greater Cairo 12
2.3 Total concentration of polycyclic aromatic hydrocarbons (mg/kg) in road dust of different sites over Greater Cairo 14
2.4 Concentration (arithmetic mean ± S.D.) of PAHs and their BaPeq concentrations using Nisbet and LaGoy's (1992) TEFs 15
2.5 Average PAHs concentration in road dust from different areas in Ulsan,Korea 17
2.6 Locations and character of sites over the urban area of Anshan 19
2.7 Concentration of individual PAH (jtglg) in road dust of different sites in Anshan, China 20
2.8 PAils level at different location. 21
3.1 Sample stations and the main activities of the sampling sites 24
4.1 Total concentrations of total PAH at investigated sites 31
4.2 Comparison between total PAils concentration (ppm) with literature 33
4.3 Properties of PAHs 34
viii

LIST OF FIGURES
Figure No. Page
2.1 Cycle of the road dust deposition 10
2.2 Map of the Greater, Cairo 13
2.3 Sampling sites of road dust in Ulsan, City Korea 16
2.4 Location of Anshan, general study area and road dust sampling sites 18
3.1 A map showing the sampling location 23
4.1 Cary 50 Conc UV-Visible Spectrophotometer 27
4.2 Graph concentration (ppm) of PAils versus peak area 29
4.3 Graph sample stations versus concentration 30
lx

LIST OF SYMBOLS
Micro
Less than or equal to
Greater than or equal to

LIST OF ABBREVIATIONS
ANTH Anthrcene
BaA Benz [a] anthracene
BaP Benzo[a]pyrene
BbF Benzo[b]fluoranthene
BeP Benzo [e]pyrene
BgP Benzo[g,h,i]perylene
BkF Benzo [k]fluoranthene
CHR Chrysene
COR Coronene
CONC Concentrations
FLT Fluoranthene
PAHs Polycyclic Aromatic Hydrocarbon
PHEN Phenanthrene
xi

CHAPTER 1
INTRODUCTION
1.1 BACKGROUND STUDY
Street dust on the impervious surface along the road can be the important
sources for the determination of PAHs in road dust pollution. According to the study
by Kavouras et al., (2001), as a persistent organic pollutants (POPs), Polycyclic
Aromatic Hydrocarbon (PAHs) are highly degraded, hydrophobic, lipophilic and
carcinogen. PAHs are formed from the combustion of carbonaceous materials and it
are ubiquitous environmental pollutants. The United States Environmental
Protection Agency (USEPA) has placed 16 of these PAils in the priority list due to
this consideration. Immunotoxicity, genotoxicity, carcinogenicity, and reproductive
toxicity are the examples of the adverse effects due to the induce number of PARs
(John and Line, 2002). The road from Gambang to Kuantan is about 30 km.
Construction of highways and improvement of the road network has been carried out
intensively to improve the infrastructure of this main road which connects to Johor,
Kuala Lumpur and Terengganu. Automobile exhaust is an important source of PAHs
in the atmosphere, which will finally be deposited on soil or as street dust. Therefore,
road dust is chemically similar to the primary portion of the atmospheric aerosol.
Analysis of road dust can reflect the pollution level in the atmosphere. Therefore,

these studies focus on the determination of PAHs in road dust along the Gambang-
Kuantan road.
1.1 PROBLEM STATEMENT
King et al., (2002) stated that PAHs was the number ninth ranked as the most
threatening compound to human health in the year of 2001. Based on their genotoxic
potentials, the higher the molecular weight of PAils, the more dangerous it would be.
This study responds to the call to determine the Polycyclic Aromatic Hydrocarbon
(PAHs) in road dust along the Kuantan-Gambang road. This is due to the Kuantan-
Gambang road is the main road which connects 3 states (Kuala Lumpur,Johor and
Terengganu), and also interchange to Kuantan Airport and East Coast Expressway at
Gambang exit. Heavy traffic flow at this road might produce significant amount of
PAHs to the environment, giving rise to public concern about the possible health
effect due to inhalation of street dust.
1.2 RESEARCH QUESTIONS
This study embraces some research questions, which are;
i. What is Polycyclic Aromatic Hydrocarbon (PAHs)?
ii. What are the possible sources of PAils in road dust?
iii. How human activities affect the distribution of PAHs in road dust?

1.3 RESEARCH OBJECTIVES
In this study, we focused on two main objectives which are;
i.To determine the concentration of Polycyclic Aromatic Hydrocarbon (PAHs)
contains in road dust.
ii. To investigate the distribution of PAHs in different area along the Kuantan-
Gambang road.
1.4 RATIONALE AND SIGNIFICANCE
The rationale of this proposed research project is to determine and compare
the concentration of PAHs in road dust along Kuantan-Gambang road. The results of
this research would provide a background data about the distribution of PAHs in the
studied area.

CHAPTER 2
LITERATURE REVIEW
2.1 POLYCYCLIC AROMATIC HYDROCARBON (PAils)
Polycyclic Aromatic Hydrocarbon (PAHs) are a group of organic compounds
with two or more fused aromatic rings. The incomplete combustion of organic matter
contribute to the originate of PA}Ts. PAHs that are generated through the incomplete
combustion are emitted to ambient air in particulates and gases. By escaping photo
degradation in the air, atmospheric PAils are accumulated to land surface through
dry and wet deposition. The PAHs then either become incorporated into soil or
become street dust. Crude palm oil and petroleum products can be another important
source of PAHs. Kerosene, gasoline, diesel, fuel and asphalt are the examples of the
petroleum products. High exposure to PAHs can contribute to health effect problem.
Armstrong et al., (2004), Chen and Liao, (2006), Boffetta et al., (2004) and Kameda
et al., (2005) stated that human cancer causes of skin, lungs, and bladder have always
been associated with the PAHs exposures.

2.1.1 Physical Characteristics of PAils
Physical and chemical characteristics of PAHs vary with molecular weight.
For instance, PAH resistance to oxidation, reduction, and vaporization increases with
increasing molecular weight, whereas the aqueous solubility of these compounds
decreases. As a result, PAHs differ in their behaviour, distribution in the
environment, and their effects on biological systems. PAils can be divided into two
group which is based on its physical, chemical and biological characteristics. The
lower molecular weight of PAHs, for examples 2 to 3 ring groups has significant
acute toxicity to aquatic organisms. Naphthalene is one of the PAils with the low
molecular weight. The high molecular weight of PAHs,for examples chrysenes, do
not. However, several members of the high molecular weight PAHs have been
known to be carcinogenic. The physical-chemical characteristics of PAHs are shown
in Table 2.1.

Table 2.1: Physical-chemical characteristics of some PAHs
Physical-chemical characteristics of some PAils * (From Neff, 1979; CCREM, 1987; NRCC, 1983; USPHS, 1990)
Mol.Wt. Solubility Yap. Log Carcmo- Benzeii (g) at 25 °C Pressure Kow genicity (and
(pgIL) at 25 °C (Log total) (mm H) Koc) rings
Naphthalene 128.2 12500 to 1.8x 10.1 3.37 NC 2 34000
Acenaphthylefle 152.2 3420 10-3- io 4.07 NC 2 (i.'W)
Acenaphthene 154.2 3.98 NC 2 (3.66)
Fluorene 166.2 800 4.18 NC 2(3) (3.86)
Anthracene 178.2 59 2.4x 10 4.5 NC 3 (4.15)
Phenanthrene 178.2 435 6.8x 10 4.46 NC 3 (4.15)
Acridine 179.2 (4.48) NC 3 2-Methylanthracene 192.3 21.3 4.77 NC 3 9-Methyiphenanthrene 192.3 261 4.77 NC 3 1-Methylphenanthrene 192.3 269 4.77 NC 3 Fluoranthene 202.3 260 4.90 NC 3(4)
(4.58) 9,10- 206.3 56 5.13 NC 3 Dimethylanthracene Benzo la] fluorene 216.3 45 5.34 NC 3(4) Benzo lb] fluorene 216.3 29.6 5.34 NC 3(4) Pyrene 202.1 133 6.9x i0 4.88 NC 4
(4.58) Benz [a] anthracene 228.3 11.0 1.lx 10 5.63 C 4
(5.30) Naphthacene 228.3 1.0 5.65 NC 4 Chrysene 228.3 1.9 5.63 WC 4
(5.30) Triphenylene 228.3 43 5.63 4 Benzo [blfluoranthene 252.3 2.4 6.04 C 4 (5)
(5.74) Benzo[j]fluoranthene 252.3 2.4 6.21 C 4(5) Cholanthrene 254.3 2.0 6.28 C 4 (5)

Table 2.1: Continued
Physical-chemical characteristics of some PAils * (From Neff, 1979; CCREM, 1987; NRCC, 1983; USPHS, 1990)
Mol.Wt. Solubility Vap. Log Carcino- Benzei (g) at 25 °C Pressure Kow genicity (and
• (tg1L) at 25 °C (Log total) (mm Hg) Koc) rings
Dibenzo[a,hjfluorefle 266.3 0.8 6.57 WC 4 (5) Dibenzo[a,g]flUOrefle 266.3 0.8 6.57 C 4 (5) Dibenzola,clfluorefle 266.3 0.8 6.57 WC 4 (5) 3-Methylcholanthrefle 267.3 0.7 6.64 SC 4(5) Benzo[ghi]fluoranthefle 214.2 0.5 6.78 NC 4 (5) Benzo[ajpyrene 252.3 3.8 5.5x 10 6.06 SC 5
(5.74) Benzo[e]pyrene 252.3 2.4 5.5x 10 6.21 NC 5 Perylene 252.3 2.4 6.21 NC 5 Indeno(1,2,3-cd)pyrene 276.3 - 6.58 C 5(6)
(6.20) Dibenz[a,hlanthracene 278.3 0.4 6.86 C 5
(6.52) Benzo[ghi]perylene 276.4 0.3 1 O 10b0 6.78 NC 6
(6.20) Coronene 300.3 0.14 1.5x 10¹¹ 7.36 NC 7
* NC= non-carcinogenic; WC=wealdy carcinogenic; C=carcinogenic; SC=sfrongly
carcinogenic; Kow=Octanol/water partition coefficient; Koc= partitioning coefficient
for organic carbon.
2.1.2 Sources of PARs
PARs either in urban or industrial atmosphere possess a range of chemical,
Physical and toxicological characteristics. They are almost entirely anthropogenic in
origin and are major by products of the incomplete combustion of all types of
organic matter (Park et al., 2002 and Wingfors et al., 2001). Moreover, PAHs are
ubiquitous environmental pollutants which are formed in the combustion of
carbonaceous materials such as diesel, gasoline and other fuel at very high

temperature (Liu et al., 2001 and Kavouras et al., 2001). Motor vehicles can be one
of the most serious sources of PAHs (Shimmo et al., 2002) The sources of PAHs can
be derived from 2 sources which are natural sources and anthropogenic sources.
2.1.2.a. Natural Sources of PAils
Volcanic activities and forest fires can be categorized under the natural
sources of pyrogenic PAH.
2.1.2.b. Anthropogenic Sources of PAils
Anthropogenic sources can be divided into two category which are:
. Combustion of materials for energy supply
. Combustion for waste minimization
Coal, oil, gas and the stationary sources can be the examples of combustion
of materials for energy supply. Industry (coke and carbon production, petroleum
processing), residential heating (gas and oil burners, furnaces) and power and heat
generation (coal, oil, wood) are the examples of stationary sources. Studies also show
that emission from vehicle exhaust such as diesel, leaded and leaded gasoline are the
largest contributors of PAl-Is in the urban area (Rogge et al., 1993a; Khalili et al.,
1995; Miguel et al., 1998; Marchandet al.,2004; Ravindra et al., 2006a and Ravindra
et al., 2006b; Man et al., 2006).Moreover, Paturel et al. (1996) found that the start of
conditions of vehicles, either hot or cold engine have -a little influence on mass
repartition of PAHs in gaseous or in particulate phase.

Combustion for waste minimization covers incineration of municipal and
industrial waste. Agricultural burning, crematoria, cigarette smoking as well as
volatilization from soils, vegetation and other surfaces are the types of other
miscellaneous sources.
2.1.3 Health Effect of PANs
PAHs are easily found throughout the environment either in the air, water and
soil. Xu et al., (2006) reported that consumptions of fossil fuels has emits a large
quantity of PAHs into the environment in China. One of the major sources is from
motor vehicles emission in urban areas. According to Bispo et al., (1999) and
Geffard et al., (2003) PAHs contamination of urban atmosphere has brought much
concern due to their acute to chronic toxic effects on the living organisms. Li et al.,
(2005) reported that 20%of the total exposure in Tianjin was through inhalation. Tao
et al., (2006) had done investigation including urban districts and rural countries in
Tianjin. Due to the result, it shows that inhalation exposure was more severe in the
urban districts where the PAils levels in the ambient air commonly exceeds values
for rural areas.
The health effects that can be caused by exposure to PAils depend on:
• How much PAHs entered the body?
• How long did the body have been exposed?
• How the body responds to PAHs?
MI those effects may be either in short term or long term.

2.2 ROAD DUST
Road dust is a complex mixture of particles from a number of natural and
nthropogenic sources which have been found to contain carcinogenic components
and heavy metals from exhaust and non-exhaust processes, along with mold spores
and pollen fragments (Eric et al., .2011). According to Kupianen.,(2007) by passing
vehicle-induced turbulence and shearing stress of the tires or wind, road dust can
subsequently become resuspended. Figure 2.1 shows the cycle of the road dust
deposition.
Gaseous Particulate
PoI!uthn$s in Pollutantsin Atmosphere Atsphere
SOURCES PoHutanisin Cloud Water 0
VOC NO PtecIpition
Wet
NOx Hg Deposion
\'°C SO2 JI 4444444444 1LIL
Natural RECEPTORS ME
Figure 2.1 : Cycle of road dust deposition

2.3 PREVIOUS STUDY ABOUT PARs
M.A. Hassanien and N.M. Abdel-Latif (2008) done a research on the total
concentration of polycyclic aromatic hydrocarbons in road dust of different sites over
Greater Cairo. They found that PAHs can be classified according to their number of
aromatic ring as follows: 2-ring including NAP; 3-ring includingACE, FLU, PflEand
ANC; 4-ring including FLA, PYR, BaA and CHR; 5-ring including BbF, BkF and
BaP. The most abundant PAHs were 3-and 4-ring compounds with percentages of 61
and 35, respectively. This report was consistent with Trapido (1999) who reported
the dominance of 3-4 ring PAHs in Estonian soil. Li et al., (2006) stated that total 12
PAHs was seven-fold higher than the natural and background level of PAHs at
remote or rural sites (0.1 mg/kg). According to Tremolada et al., (1996) and
Wagrowski and Hites, (1997) PAITs in urban soilswas 2-10 higher than rural ones.
Seventeen sampling sites were selected to represent different sectors in greater Cairo.
Classification of sites, according to the main activity, is shown in Table 2.2.

Table 2.2: Locations and character sites over Greater Cairo
Number Site Character activity
1 Naser city Residential
2 . Salah Salem street Traffic
3 . South l5' May city Traffic
4 Shobra El Kheima Mixed area
5 Ramsis square Traffic
6 Obera square Traffic
7 Dar El Salam Residential
8 El Warak Mixed area
9 Dokki square Traffic
10 Cairo University Traffic
11 Giza square Residential
12 Saft El Laban Residential
13 Hario square El Maadi Residential
14 El Maadi Residential
15 El MaadiAutostrad Traffic
16 El Basateen Residential
17 Maruotya Residential
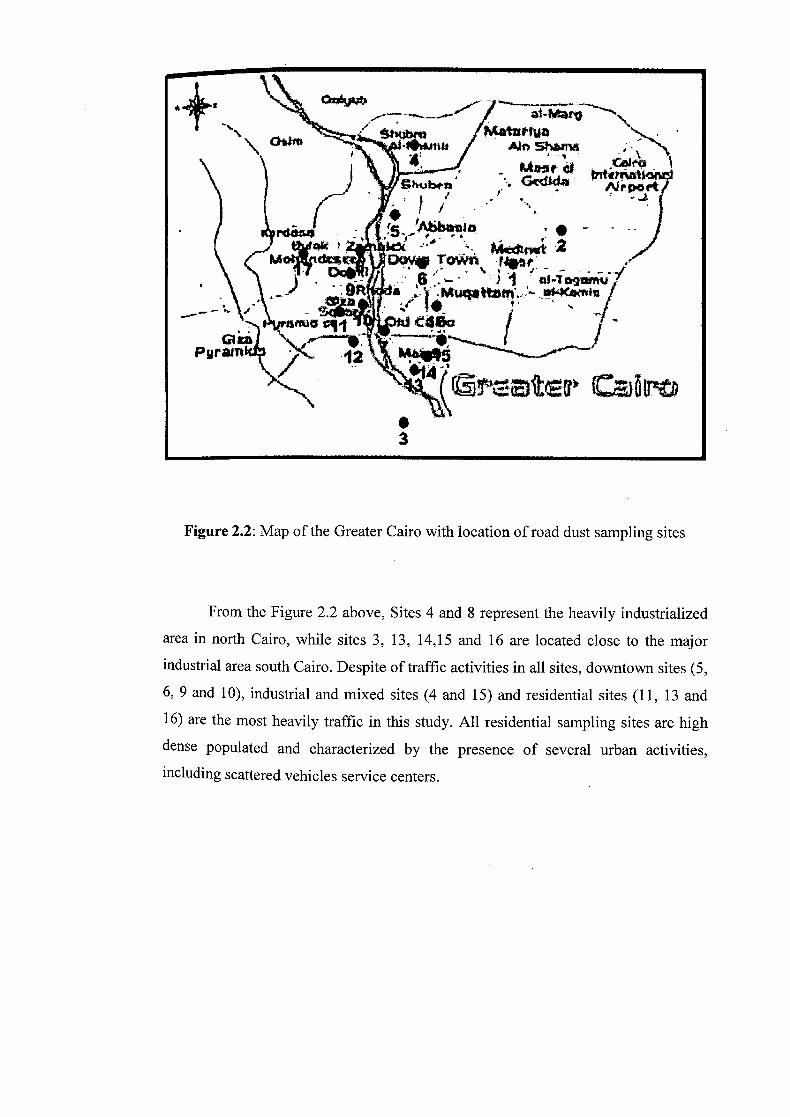
Seventeen sampling sites were selected to represent different sectors in greater Cairo
during 2005. Figure 2.2 below shows the map of the Greater Cairo with location of road dust sampling sites.
Math Aft Szn&
M /shubtu: Gdd IhtirflAhI*J
Wk-
OoVq 45r , 17t2
PW C440i
3
Figure 2.2: Map of the Greater Cairo with location of road dust sampling sites
From the Figure 2.2 above, Sites 4 and 8 represent the heavily industrialized
area in north Cairo, while sites 3, 13, 14,15 and 16 are located close to the major
industrial area south Cairo. Despite of traffic activities in all sites, downtown sites (5,
6, 9 and 10), industrial and mixed sites (4 and 15) and residential sites (11, 13 and
16) are the most heavily traffic in this study. All residential sampling sites are high
dense populated and characterized by the presence of several urban activities,
including scattered vehicles service centers.
*
--
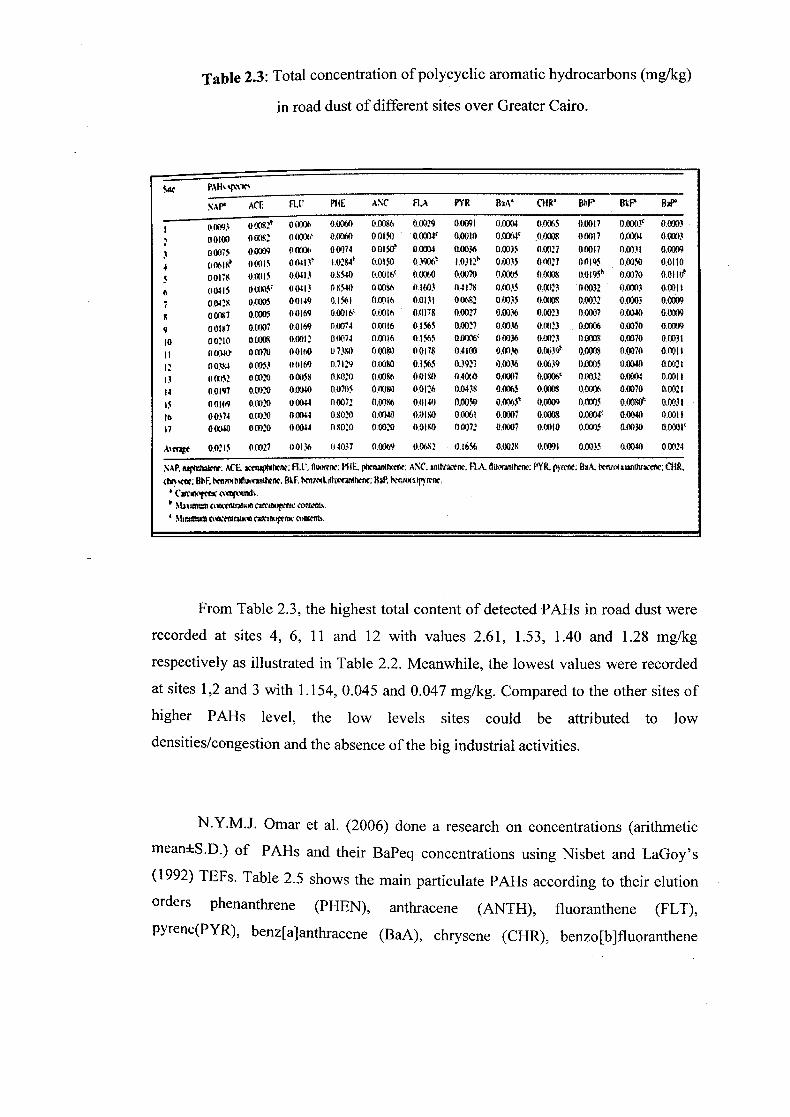
Table 2.3: Total concentration of polycyclic aromatic hydrocarbons (mg/kg)
in road dust of different sites over Greater Cairo.
SO PHt4,1C
SAr ACE FU PIlE ANC ftA PYR IA CURS R1F 13kV Bi
ROM 0XE 0(0)6 O,OC) 0.11396 ().00'9 (10(04 0.0004 0,05 110017 0.00tOc
00100 003*2 000)6' 00(4) 00150 O()$ O0l0 0,0349, 01336$ oorni o,000
0(XITh 00304 O( 00074 0.015 0.0004 0.0036 0.003.5 00027 00017 0.00.14 0.0089
omoe 00315 04)4l3 l.02114 0.0150 ()Y406 ((3121 0.0035 0.0027 00195 00050 0.011O
001711 otlilS 0I4I3 0.115-U) 0.00I6 000 0.0070 0.0005 (100)6 0,0$95' 0.0070 (1.01 itt
(10415 (4(J$' 00413 (111544) 0.03116 4) 4603 1144711 0AJ35 0(K1) 00032 00003 00014
7 0,008 01(105 00449 011 0.0348 0.0131 0.06*2 0.0035 001) 0AW2 0.0001 0.00W
000*7 0(0)5 00469 0.0046' 0.0348 0.04711 0.0027 (10)36 0.CI03 00007 0.0040 (UX*
c 004117 0.0307 00489 0.0074 0.0046 0.4565 0.0017 o.Oilo 0.01023 0.00M 0.000 0.0o
Jo ooIo owas 0.111011 0.0074 o,ixu 0i50 00XW 0.0036 0.0023 0000* 00)70 00034
wij- 00070 00180 0 7A 0.00110 0047$ 0.4400 0.0036 0.003 1100M 0.0070 0.0011
II 003114 00053 00469 0.1429 (1(0110 0.1565 0.3927 00036 0.0634 0.0035 0.00*0 00321
aInSI 00020 0005* 0.11020 00096 001110 0,41380 00007 01(11 00.1112 0.0004 01331
00197 0.0020 0.0040 0.0705 0.00110 0.0416 0,04.511 0.0065 0* 010006 010070 00014
45 00489 0.0024) 000(4 00072 0.0056 0.0440 0.00*0 O.0)65 110004 O.W. 00)*' 0,0634
Jo 00374 0.1010 000 0.11020 0.0040 (4.04*0 0.0061 0A0)7 (103011 13.0004' 0.0041) 0.0041
00040 01020 000U 011010 0.0020 0.04*4) 00072 0.0(107 0.00)0 0.0005 0.0030 0.0001'
Ac1t 0.01)5 0(027 00136 04037 0.0069 00112 0.1656 0.00211 (4(1091 0.0035 010040 0.0024
NAP. ç4th*nc ACE 44111; FU. 0uv4; PIlE I'4411II4I6c69. ANC. 2nthrlzn FI-k iurinlb.'n': PYR. ryrc; RI/S. bcwia u14lhroc: Cu R, bs; uhF. tr anthen; 13SF, RaP, txwos IPrn
Catn b nnt c,ecnLr31i&* c3fCavatc cnt,'ot. 'Mium cm-m(gwo cmarKlm c*cIcnt
From Table 2.3, the highest total content of detected PAHs in road dust were
recorded at sites 4, 6, 11 and 12 with values 2.61, 1.53, 1.40 and 1.28 mg/kg
respectively as illustrated in Table 2.2. Meanwhile, the lowest values were recorded
at sites 1,2 and 3 with 1.154, 0.045 and 0.047 mg/kg. Compared to the other sites of
higher PAHs level, the low levels sites could be attributed to low
densities/congestion and the absence of the big industrial activities.
N.Y.M.J. Omar et al. (2006) done a research on concentrations (arithmetic
rnean±S.D.) of PAHs and their BaPeq concentrations Using Nisbet and LaGoy's
(1992) TEFs. Table 2.5 shows the main particulate PAHs according to their elution
orders phenanthrene (PHEN), anthracene (ANTH), fluoranthene (FLT),
pyrenc(PYR) benz[a]antlijacene (BaA), chrysene (CHR), benzo[b]fluoranthene

(BbF), benzO[k]flU0ranth'e(B''), benzo[e]pyrene (Bel?), benzo[a]pyrene (BaP),
indeno[l ,2,3-cd]pyrene (IP), benzo[g,h,i]perylene (BgP), and coronene (COR).
Table 2.4: Concentration (arithmetic mean±S.D.) of PAils and their BaPeq
concentrations using Nisbet and LaGoy's (1992)TEFs.
PAlis •TEFs STeetKL*(n24)
Conc. BaP (ngfm3) (Pe)
Ambient UM t'(n19)
Cone. (nghn)
BaPeq (pg)
Ham' (n=2)
Conc. (ng/ns)
BaP (pg/rn)
PHEN 0.001 0.17±0.11 17±0.11 n.d. 0 nd. 0
ANTH 0.010 0.091.-0.05 0.87±0.45 n.d. 0 n.d, 0
FLT 0.001 0.12±0.08 0.1210.08 nd. 0 n.d, 0
PYR 0.001 0.33±0.21 0.33±0.21 0.04±0.09 0.04±0.09 n.d. 0
BaA 0.100 0.16±0.12 16.33±11.75 nd. 0 1.23±0.52 123.721-51.74
CHR 0.010 0.19±0.13 1.90711.30 0.07±0.15 0.70±1.50 1.791-032 17.89±3.17
BbF 0.100 0.351017 35301.-27.28 0.25±018 25.26±27.81 &66 0.57 865.83±56.92
BkF 0.100 0.24±0.18 24.11±18.19 038±0.44 37.74±43.64 613±0.63 613.12±62.81
BcP 0.57±0.40 0.37±0.45 - 220±0.08 BaP 1.00 0.47±0.36 46193±356.35 0.16±0.18 156.17±184.09 0.05±0.03 53.50±25.46 IP 0.10 0.69±0.57 69.35±57.17 0.47±036 46.58±55.70 7.78±0,75 777.72±75.17 BgP 0.01 1,35±0.95 13.53±9.46 0.76±0.87 7.57±8.66 14.41±1.39 144.06±13.94 COR - 1,11±0.94 .- 0.61±0.69 5.6410.29 Toed 5.85±4.05 629.94±470.9 3.10±2.92 274.05±313.64 47.89±0.09 2595.82±147.4 Kolxmgorov-Snmov P0.775 P= 0.696 P0307 P0.334
-goodness of fit' tcsf1 (normal) (normal) (normal) (normal) 95016 CI 1 4.14-7.56 431.06-828.82 1.69-4.51 122.88-425.22 Student's t-tcst(PAHs) 1 t-2.491,
P=0.0 169 Student's 1-lest (BaP) 1 ,-2.831,
P=0.0072 Total (geometric mean) 430 434.20 2.07 198.64 95% CI E 2.94-6.30 284.78-66100 132-3.24 112.33-351.26 HcP(BcP+BaP) 0.55 0.71 0.98 '.BaP,'tota1 BSP q 74.28 57.00 . 2.06
nd.: not detected -: no TEF has been suggested.
Street level atmospheric particles (Omar et al.. 2002). h
Ambient level atmospheric particles (present study). Ilaze smoke atmospheric particles (Abas et al.. 2004).
' Test for normal distribution of total PAils and total BaP. Confidence interval for the arithmetic mean at the 95% confidence level. Students i-test for total PAIls and total BaP 5 applied to Street KL and ambient UM at the P-0.05 level assuming normal distribution. Confidence interval for the geometric mean at the 95% confidence level.
According to Polkowska et al., (2000) the fluctuations in the observed PAils
concentrations (Table 2.4) may due to the seasonal variations such as the dry
season's natural fires that increase the input of PAils into the atmosphere. Moreover,
wet deposition is an effective removing LMW and MMW PAHs from the