110506 CSIS Defense Contract Trends-Sm2
38
Defense Contract Trends U.S. Department of Defense Contract Spending and the Supporting Industrial Base An Annotated Brief by the CSIS Defense-Industrial Initiatives Group PROJECT DIRECTORS David Berteau Guy Ben-Ari AUTHORS Jesse Ellman Reed Livergood David Morrow Gregory Sanders CONTRIBUTORS Ryan Crotty Elena Derby Joachim Hoauer Gregory Kiley Roy Levy Nicholas Lombardo Cornelia Moore May 2011
-
Upload
apurvanp1301 -
Category
Documents
-
view
226 -
download
0
Transcript of 110506 CSIS Defense Contract Trends-Sm2

8/3/2019 110506 CSIS Defense Contract Trends-Sm2
http://slidepdf.com/reader/full/110506-csis-defense-contract-trends-sm2 1/38
Defense Contract TrendsU.S. Department of Defense Contract Spending and the Supporting Industrial Base
An Annotated Brief by the CSIS Defense-Industrial Initiatives Group
PROJECT DIRECTORS
David BerteauGuy Ben-Ari
AUTHORS
Jesse EllmanReed LivergoodDavid MorrowGregory Sanders
CONTRIBUTORS
Ryan Crotty Elena Derby Joachim HoauerGregory Kiley Roy Levy Nicholas LombardoCornelia Moore
May 2011

8/3/2019 110506 CSIS Defense Contract Trends-Sm2
http://slidepdf.com/reader/full/110506-csis-defense-contract-trends-sm2 2/38
U.S. Department of Defense
Contract Spending and
the Supporting Industrial Base An Annotated Brief
PROJECT DIRECTORS
David Berteau
Guy Ben-Ari
AUTHORSJesse Ellman
Reed Livergood
David Morrow
Gregory Sanders
CONTRIBUTORS
Ryan Crotty
Elena Derby
Joachim Hofbauer
Gregory KileyRoy Levy
Nicholas Lombardo
Cornelia Moore
May 2011

8/3/2019 110506 CSIS Defense Contract Trends-Sm2
http://slidepdf.com/reader/full/110506-csis-defense-contract-trends-sm2 3/38
2

8/3/2019 110506 CSIS Defense Contract Trends-Sm2
http://slidepdf.com/reader/full/110506-csis-defense-contract-trends-sm2 4/38
3
Table of Contents
1. Introduction ........................................................................................................................... 5 2. Overall DoD Contract Spending ........................................................................................... 6 3. Contract Spending by DoD Component ............................................................................. 11 4. DoD Contract Characteristics ............................................................................................. 24 5. The Industrial Base Supporting DoD .................................................................................. 27 6. Summary ............................................................................................................................. 35
List of Figures
Figure 2-1. Top Line DoD Contract Spending, 1990-2010 ............................................................ 6 Figure 2-2. DoD Contract Spending for Products, 1990-2010 ....................................................... 7 Figure 2-3. DoD Contract Spending for Services, 1990-2010 ........................................................ 8 Figure 2-4. DoD Contract Spending for R&D, 1990-2010 ............................................................. 9 Figure 2-5. DoD Contract Spending by Category in Percentage Terms, 1990-2010 .................... 10 Figure 3-1. DoD Contract Spending by Component, 1990-2010 ................................................. 11 Figure 3-2. DoD Contract Spending on Products by Component, 1990-2010 ............................. 12 Figure 3-3. DoD Contract Spending on Services by Component, 1990-2010 .............................. 13 Figure 3-4. DoD Contract Spending on R&D by Component, 1990-2010 ................................... 14 Figure 3-5. Army Contract Spending, 1990-2010 ........................................................................ 15 Figure 3-6. Navy Contract Spending, 1990-2010 ......................................................................... 16 Figure 3-7. Air Force Contract Spending, 1990-2010 .................................................................. 17 Figure 3-8. Other DoD Components Contract Spending, 1990-2010 ........................................... 18 Figure 3-9. Share of DoD Contract Spending by Component, 1990-2010 ................................... 19 Figure 3-10. Army Contract Spending by Category, 1990-2010 .................................................. 20 Figure 3-11. Navy Contract Spending by Category, 1990-2010 .................................................. 21 Figure 3-12. Air Force Contract Spending by Category, 1990-2010 ............................................ 22 Figure 3-13. Other DoD Contract Spending by Category, 1990-2010 ......................................... 23 Figure 4-1. Defense Contract Spending by Competition, 1999-2010 ........................................... 24 Figure 4-2. Defense Contract Spending by Funding Mechanism, 1999-2010 .............................. 25 Figure 4-3. Defense Contract Spending by Contract Vehicle, 1999-2010.................................... 26 Figure 5-1. DoD Contract Spending by Contractor Size, 1999 and 2009 ..................................... 31 Figure 5-2. DoD Contract Spending for Products by Contractor Size, 1999 and 2009 ................ 32 Figure 5-3. DoD Contract Spending for Services by Contractor Size, 1999 and 2009 ................ 33 Figure 5-4. DoD Contract Spending for R&D by Contractor Size, 1999 and 2009 ..................... 34
List of TablesTable 5-1. Top 20 DoD Contractors, 1999 and 2009 .................................................................... 27 Table 5-2. Top 20 DoD Contractors for Products, 1999 and 2009 ............................................... 28 Table 5-3. Top 20 DoD Contractors for Services, 1999 and 2009 ............................................... 29 Table 5-4. Top 20 DoD Contractors for R&D, 1999 and 2009 ................................................... 30

8/3/2019 110506 CSIS Defense Contract Trends-Sm2
http://slidepdf.com/reader/full/110506-csis-defense-contract-trends-sm2 5/38
4

8/3/2019 110506 CSIS Defense Contract Trends-Sm2
http://slidepdf.com/reader/full/110506-csis-defense-contract-trends-sm2 6/38
5
1. Introduction
This report analyzes contracting for products, services, and research and development (R&D) by the U.S.Department of Defense (DoD) overall and by its key components. It thereby seeks to provide an in-depthlook at the trends currently driving more than 60 percent of all federal contract dollars and more than half of all federal contract actions. The report also presents findings on various elements of the industrial base
supporting DoD in its missions. Amongst other issues, the report discusses implications for competitionin providing defense products and services as well as for near-term spending by the individual militarydepartments.
For this report, the Defense-Industrial Initiatives Group (DIIG) at CSIS uses the FederalProcurement Data System (FPDS) as its primary source of data on government contract spending. Notethat since FPDS data are constantly being updated, including for back years, dollar totals for any givenyear can vary between charts from one report to the next. However, this difference is never greater than$10 billion from year to year. The report also employs the Department of Defense Form 350 (DD350)data for earlier years. The DD350 data have been incorporated into FPDS, but raw data for years prior to2004 are only publicly available from the DD350s. For this report, all dollar figures are expressed inconstant Fiscal Year 2010 dollars.
The timeframe analyzed in this report extends from 1990 to 2010. Additional depth of analysis isprovided for the period 1999-2010 on contract spending by funding mechanism, contract vehicle, and Top20 Contractors (1999 was selected as the starting point for these last three categories of analysis tocapture contract spending on preparations for Y2K).
This report opens by presenting an overview of defense contract spending, then divides the datainto three categories: products, services, and R&D. (Note that these categories were derived from theofficial Product and Service Codes and do not necessarily match DoD appropriations. In addition, FPDSincludes R&D as spending on “services”, but this report provides separate totals and analysis for R&D.)Next, the report presents data on contract spending by the three military departments. In addition, thereport includes a category called “Other DoD”, consisting of defense agencies and other entities withinDoD (such as the Defense Logistics Agency, Missile Defense Agency, Defense Threat ReductionAgency, etc.). The report then analyzes trends by three key contract characteristics: level of competition,type of funding mechanism, and type of contract vehicle. Lastly, the report analyzes the industrial basesupporting DoD. It examines the Top 20 contractors for 1999 and for 2009. Further detail is given via aTop 20 contractors list based solely on contracts for products, services and R&D. To show the larger
picture, for 1999 and 2009 contract awards are broken down into three contractor size categories. Forthese looks at contractors, 2009 data are used for reliability and availability reasons.
Due to the fact that it relies almost exclusively on FPDS data, the analysis presented in this reportincurs five notable restrictions. First, contracts awarded as part of supplemental packages are notseparately classified in FPDS or this report. As a result, we do not distinguish between contracts fundedby the DoD base budget and those funded by supplemental appropriations. Secondly, our analysis onlycovers contracts funded by and contracted through DoD. (In 2010, there were $4.7 billion worth of contract dollars funded by DoD and contracted through other agencies; almost 80 percent of these werecontracted through GSA.) Third, FPDS includes only prime contracts, and there is, as of yet, no publiclyavailable data to distinguish subcontracts as a separate category. Therefore, only prime contract data areincluded in this report. Fourth, reporting regulations only require that unclassified contracts be includedin FPDS. We interpret this to mean that few, if any, classified contracts are in the data base. For DoD,this omits a substantial amount of total contract spending, perhaps as much as 10 per cent. Suchomissions are probably most noticeable in R&D contracts. Finally, it should be noted that classificationsof contracts differs between FPDS and individual companies. For example, some contracts that acompany may consider as “services” are labeled as “products” in FPDS, and vice versa. This may causesome discrepancies between companies’ reports and those of the federal government.

8/3/2019 110506 CSIS Defense Contract Trends-Sm2
http://slidepdf.com/reader/full/110506-csis-defense-contract-trends-sm2 7/38
6
2. Overall DoD Contract Spending
Top Line DoD Contract Spending, 1990-2010
Figure 2-1 presents total DoD spending from 1990 to 2010 as well as total dollars spent on defensecontracts. Contract spending is tracked in FY 2010 dollar amounts by the lower portions of the bars,corresponding with the left-hand y-axis, and as a percentage of total DoD outlays by the line at the top of the graph, corresponding with the right-hand y-axis. The upper portions of the bars represent non-contract DoD spending in FY 2010 dollar amounts, including funding for personnel, organic constructionand maintenance, etc.
Between 2001 and 2010, dollars obligated by the DoD to contract awards more than doubled, andcontract spending far outpaced growth in other DoD outlays.1 This growth was concentrated in productsand services, which experienced a compound annual growth rate (CAGR) of 8.4 percent and 9.4 percent,respectively, compared to the R&D category’s 5.4 percent annual growth. Growth in overall DoDcontract spending roughly kept pace with growth in the overall defense budget from 1995 until 2002, afterwhich it climbed significantly to over 60 percent of DoD outlays. Contract spending relative to DoDoutlays reversed sharply beginning in 2008, but largely as a result of other DoD outlays increasing rapidlyrather than of the comparatively small but sustained decline in contract spending. In terms of average
annual growth, the increase in DoD contract spending over the 21-year period far outpaced that of otherDoD outlays. Throughout the 21-year period analyzed, non-contract outlays grew by only 0.2 percent peryear, while contract spending grew by 4.3 percent. This difference was also striking during the post-9/11period. Over the last 11 years, contract spending grew by 8.4 percent annually, while non-contract outlaysincreased at 5.8 percent per year.
Figure 2-1. Top Line DoD Contract Spending, 1990-2010
Disclaimer: This chart was originally printed with an error resulting in a higher percentage line. This error has been corrected.Note: Dollar figures may not sum to total due to rounding.Source: DD350 and FPDS; CSIS analysis
1 Note that in 1991 (following the Persian Gulf War), the report counts only gross spending, rather than the smaller net spendingnumber that is offset by foreign receipts.
158 163 140 142 132 156 158 155 153 157 166 177205
250 264300 319
354390 383 368
287 295281 254
241 198 180 185 181 178185 179
195
206235
224215
194213
257 296
446 457421
396373 354
338 340 334 334352 356
400456
499524 535 548
604640
664
0%
10%
20%
30%
40%
50%
60%
70%
$0
$100
$200
$300
$400
$500
$600
$700
$800
'90 '91 '92 '93 '94 '95 '96 '97 '98 '99 '00 '01 '02 '03 '04 '05 '06 '07 '08 '09 '10
P e r c e n t a g e o f D o D O
u t l a y s
C o n s t a n t 2 0 1 0 B i l l i o n s
Fiscal Year
DoD Contract Spending (4.3% 21-year CAGR) Non-Contract DoD Outlays (0.2% 21-year CAGR)
Contracts as a percent of DoD Outlays

8/3/2019 110506 CSIS Defense Contract Trends-Sm2
http://slidepdf.com/reader/full/110506-csis-defense-contract-trends-sm2 8/38
7
DoD Contract Spending for Products, 1990-2010
Figure 2-2 presents DoD spending on product-related contracts, which is a subset of the DoD contractspending data from Figure 2-2. The bars linked to the data on the left-hand y-axis track the total FY 2010dollars spent, while the line tracks this spending as a percentage of total DoD contract spending.
Prior to 2001, DoD spending on products as a percentage of other contract obligations had been
declining steadily to a low of 42 percent. Then, after nearly a decade of stagnation following the ColdWar, DoD spending on products began growing from slightly under $100 billion in 2002 to a peak of $200 billion by 2008. Despite this strong growth, however, DoD spending on products managed only tokeep pace with the rate of growth in overall contract spending. Aside from its initial jump in 2001, and aspike in 2008, DoD spending on products has remained between 45 percent and 50 percent of total DoDcontract spending. The past few years saw a drop in spending on products, averaging an 8 percentdecrease per year between 2008 and 2010.
Figure 2-2. DoD Contract Spending for Products, 1990-2010
Source: DD350 and FPDS; CSIS analysis
86 8769 69 60 67 69 65 62 65 76 79 91
110 117 138 149
167 196175 166
0%
10%
20%
30%
40%
50%
60%
$0
$50
$100
$150
$200
$250
$300
$350
$400
'90 '91 '92 '93 '94 '95 '96 '97 '98 '99 '00 '01 '02 '03 '04 '05 '06 '07 '08 '09 '10
o f
o
C o n t r a c t S p e n d i n
C o n s t a n t 2 0 1 0 B i l l i o n s
Fiscal Year
Products (3.3% 21-year CAGR) % Products

8/3/2019 110506 CSIS Defense Contract Trends-Sm2
http://slidepdf.com/reader/full/110506-csis-defense-contract-trends-sm2 9/38
8
DoD Contract Spending for Services, 1990-2010
Figure 2-3 presents the second subset of the total DoD contract spending data: spending on servicescontracts. Again, the bars present the data in FY 2010 dollars linked to the left-hand y-axis, while the linepresents this spending as a percentage of total DoD spending on contracts, linked to the right-hand y-axis.(Note that category does not include R&D spending, other than spending on R&D management andsupport services. R&D contracts are in Figure 2-4.)
Dollars spent on services contracts grew steadily throughout the 1990s and remained at a level of 40 to 42 percent of total DoD contract spending, until dipping slightly in 2008. Since then, this categoryhas been flat in absolute dollar terms, but service contract spending rose in relation to overall DoDexpenditures as spending on products decreased. Out of the three categories of defense spending, servicesgrew the fastest at 6.1 percent per year over the course of 21 years.
Figure 2-3. DoD Contract Spending for Services, 1990-2010
Source: DD350 and FPDS; CSIS analysis
49 54 50 51 5362 64 62 64 67 67 71
82
104 109120
126 140
150161 161
0%
10%
20%
30%
40%
50%
60%
$0
$50
$100
$150
$200
$250
$300
$350
$400
'90 '91 '92 '93 '94 '95 '96 '97 '98 '99 '00 '01 '02 '03 '04 '05 '06 '07 '08 '09 '10
o f
o
C o n t r a c t S p e n d i n
C o n s t a n t 2 0 1 0 B i l l i o n s
Fiscal Year
Services (6.1% 21-year CAGR) % Services

8/3/2019 110506 CSIS Defense Contract Trends-Sm2
http://slidepdf.com/reader/full/110506-csis-defense-contract-trends-sm2 10/38
9
DoD Contract Spending for R&D, 1990-2010
In Figure 2-4, the third subset of total DoD contract spending – spending on R&D-related contracts – ispresented, following the same conventions at the previous two figures. The R&D data presented in thisreport refer to contract dollars classified using an R&D product or service code rather than all funds fromDoD’s RDT&E account. In addition, much of DoD’s R&D activities are classified, and since FPDS doesnot include classified contracts or in-house spending data, these efforts are not included in the data
presented here. As a result, defense R&D spending represented here is much lower than overall spendingon this category (which totaled approximately $80 billion in 2010). In the past decade, the proportion of DoD RDT&E spending on classified programs has risen, which may partially explain the relative drop. 2
Contract spending on defense R&D fell relative to other categories of spending throughout thelate 1990s and the 2000’s. Historically, when the defense budget increased, the amount that was investedin R&D also increased. Consistent with this trend, between 1990 and 2002 the defense dollars obligatedto R&D contracts remained steady-to-declining along with the total level of defense contract spending.However, it is surprising that R&D continued to shrink as a percentage of total defense contract dollarseven as the defense budget increased after 2002.
The trend in defense R&D contract spending has potentially negative implications for productand process improvements in the wake of current contingency operations. Historically, the benefits of R&D are realized during a drawdown of forces, as the majority of R&D investment is made during build-ups. As the ratio of investment in R&D to the rest of defense contract spending has been lower over thepast 20 years than in previous decades, the benefits that will be reaped from a drawdown in the comingyears may be fewer.
Figure 2-4. DoD Contract Spending for R&D, 1990-2010
Source: DD350 and FPDS; CSIS analysis
2 Todd Harrison. “Classified Funding in the FY 2010 Defense Budget Request”. Center for Strategic and
Budgetary Assessments. August 12, 2009. http://www.csbaonline.org/publications/2009/08/classified-funding-in-the-fy-2010-defense-budget-request/.
23 21 22 22 19 27 26 28 26 23 23 25 31 34 36 40 42 44 42 43 41
0%
10%
20%
30%
40%
50%
60%
$0
$50
$100
$150
$200
$250
$300
$350
$400
'90 '91 '92 '93 '94 '95 '96 '97 '98 '99 '00 '01 '02 '03 '04 '05 '06 '07 '08 '09 '10
Fiscal Year
o f
o
C o n t r a c t S p e n d i n g
C o n s t a n t 2 0 1 0 B i l l i o n s
R&D (3.0% 21-year CAGR) % R&D

8/3/2019 110506 CSIS Defense Contract Trends-Sm2
http://slidepdf.com/reader/full/110506-csis-defense-contract-trends-sm2 11/38
10
DoD Contract Spending by Category in Percentage Terms, 1990-2010
Assembled from the previous three figures, the lines in Figure 2-5 track the changes in the composition of DoD contract spending amongst products, services, and R&D contract dollars. Each line tracks thepercentage of total DoD contract dollars awarded in each category in the period 1990-2010.
Comparing the relative levels of defense spending in each of the three categories, one sees a clear
shift in priorities following the end of the Cold War. This is most pronounced in the case of products andservices. Drawing down military and civilian personnel after the Cold War necessitated an increase inoutsourcing to continue providing many services, while spending on products decreased with the numbersof active-duty military. The relative shares of product and services spending converged in 1998 and1999, with the former decreasing and the latter increasing. After this point, products edged up overservices, and the gap widened with the initiation of Operation Iraqi Freedom (OIF) in 2003. The relativeshares of services and products appeared to begin converging again after 2008, as absolute spendinglevels declined sharply for products while spending on services remained relatively stable.
Two questions rise from the above observations in defense contract spending trends. First, had itnot been for the operations in Afghanistan and Iraq beginning in 2001 and 2003, respectively, would thedecrease in product spending have continued and would the spike in services spending have been as high?Second, will the trends since 2008 continue in the next few years given that the defense budget isexpected to flatten or decline?
Figure 2-5. DoD Contract Spending by Category in Percentage Terms, 1990-2010
Source: DD350 and FPDS; CSIS analysis
0%
10%
20%
30%
40%
50%
60%
'90 '91 '92 '93 '94 '95 '96 '97 '98 '99 '00 '01 '02 '03 '04 '05 '06 '07 '08 '09 '10
P e r c e n t a g e o
f D o D C o n t r a c t S p e n d i n g
Fiscal Year
% Products % R&D % Services

8/3/2019 110506 CSIS Defense Contract Trends-Sm2
http://slidepdf.com/reader/full/110506-csis-defense-contract-trends-sm2 12/38
11
3. Contract Spending by DoD Component
DoD Contract Spending by Component, 1990-2010
In Figure 3-1, the total DoD contract spending for each year, presented in the aggregate in Figure 2-1, isbroken down by each military department’s share of the total. While the Army, Navy and Air Force are individually presented, the remainder of DoD components are combined into the category of “Other DoD” and their spending is aggregated accordingly.
Trends in spending by the key DoD components are visibly tied to operations in Iraq andAfghanistan. Until 2002, each of these components’ expenditures on contracts was relatively flat. Thischanged rapidly after 9/11, with the greatest increases occurring in the Army (139 percent total growthfrom 2002 to 2010 at an annual rate of 7 percent). Growth in the “Other DoD” category (111 percenttotal increase from 2002 to 2010) was driven primarily by the Defense Logistics Agency (DLA) and, to aslightly lesser extent, by the Missile Defense Agency (MDA). Spending by the Navy grew somewhatslower, rising 54 percent from 2002 to 2010, followed by the Air Force at 14 percent growth during thisperiod.
Figure 3-1. DoD Contract Spending by Component, 1990-2010
Source: DD350 and FPDS; CSIS analysis
36 37 34 34 31 35 39 41 40 42 46 49 5575 86
105 106129
154 146 14058 52 49 47 4352 49 47 49 50 50 51
57
6669
72 80
88
9895
88
43 4937 40
3849 50 49 43 42 47 49
56
6562
6167
73
6467
65
20 24
20 20 20
19 21 19 20 2223
26
35
4245
5965
62
7172
74
$0
$50
$100
$150
$200
$250
$300
$350
$400
$450
'90 '91 '92 '93 '94 '95 '96 '97 '98 '99 '00 '01 '02 '03 '04 '05 '06 '07 '08 '09 '10
C o n s t a n t 2 0 1 0 b i l l i o n s
Fiscal Year
Army (7.0% 21-year CAGR) Navy (2.1% 21-year CAGR)
Air Force (2.0% 21-year CAGR) Other DOD (6.7% 21-year CAGR)

8/3/2019 110506 CSIS Defense Contract Trends-Sm2
http://slidepdf.com/reader/full/110506-csis-defense-contract-trends-sm2 13/38
12
DoD Contract Spending on Products by Component, 1990-2010
Breaking down the data on product-related spending (Figure 2-2) by individual DoD component yieldsthe picture illustrated in Figure 3-2. Each bar segment represents a DoD component’s spending onproducts.
After a decline between 1990 and 1999, spending on products in the last 11 years by all DoD
entities combined increased by 10 percent annually, driven largely by the Army (13 percent CAGR over12 years) and “other” DoD entities (with a CAGR of 12.5 percent). Spending on products contracts bythe Army over the eight years of combat operations in Iraq and Afghanistan between 2002 and 2010 grewslightly faster at 14 percent per year, while the Navy grew at 7.6 percent annually and “Other DoD” entities increased their contract spending by 10 percent annually. Among the “Other DoD” entities, DLAwas a particularly strong contributor to the rise in spending on products. The annual growth rate of DoD-wide spending on products over the longer 21-year term, by contrast, was much lower at 3.3 percent.
Figure 3-2. DoD Contract Spending on Products by Component, 1990-2010
Source: DD350 and FPDS; CSIS analysis
19 17 15 14 10 12 14 14 13 15 17 19 2029 31
46 4457
7560 57
31 27 26 2418
23 19 20 20 22 24 22 23
28 32
31 36
42
52
4542
21 2616 19
1922 24 20 17 17
22 2328
3029
2428
32
26
2525
14 17
11 12
1211 12
12 11 11
14 15
19
2325
3741
37
43
45 42
$0
$20
$40
$60
$80
$100
$120
$140
$160
$180
$200
'90 '91 '92 '93 '94 '95 '96 '97 '98 '99 '00 '01 '02 '03 '04 '05 '06 '07 '08 '09 '10
C o n s t a n t 2 0 1 0 b i l l i o n s
Fiscal Year
Army Products (5.7% 21-year CAGR) Navy Products (1.5% 21-year CAGR)
Air Force Products (0.7% 21-year CAGR) Other DOD Products (5.5% 21-year CAGR)

8/3/2019 110506 CSIS Defense Contract Trends-Sm2
http://slidepdf.com/reader/full/110506-csis-defense-contract-trends-sm2 14/38
13
DoD Contract Spending on Services by Component, 1990-2010
In Figure 3-3, CSIS breaks down, by component, the data on DoD services-related contract spending thatwas presented for all of DoD in Figure 2-3.
Spending on services across the various DoD components grew faster than spending on productsover the 21-year period analyzed, particularly over the past nine years. The primary areas for this growth
were the same as for the growth in products spending: the Army and “Other DoD”. The Army’s spendingon contracts for services grew at 13 percent per year between 2002 and 2010, compared to its 9.1 percentgrowth over the 21-year period analyzed. Spending on services in the category of “Other DoD” increasedat a slightly slower 10 percent per year over nine years of combat operations in Iraq and Afghanistan,slightly exceeding their 21-year annual growth rate.
It is worth noting that spending on services contracts declined very slightly in 2010 compared to2009, the first decline in services contract spending in DoD in a decade. Given the absence of growth inthe overall DoD budget for FY 2011, this trend may well continue, but such a trend cannot be predictedfrom these data.
Figure 3-3. DoD Contract Spending on Services by Component, 1990-2010
Source: DD350 and FPDS; CSIS analysis
13 15 13 15 15 17 18 20 21 22 23 24 2837
46 50 50 6269 75 74
19 19 17 17 19 22 22 21 2022 21 22
24
2726
26 28
3133
36 34
13 1513 12 13
16 15 15 15 15 16 1618
2523
2628
2926
2927
45
7 6 67 8 6 7 8 6
8
12
1515
1820
1922
21 26
$0
$20
$40
$60
$80
$100
$120
$140
$160
$180
$200
'90 '91 '92 '93 '94 '95 '96 '97 '98 '99 '00 '01 '02 '03 '04 '05 '06 '07 '08 '09 '10
C o n s t a n t 2 0 1 0 b i l l i o n s
Fiscal Year
Army Services (9.1% 21-year CAGR) Navy Services (2.8% 21-year CAGR)
Air Force Services (3.8% 21-year CAGR) Other DOD Services (9.5% 21-year CAGR)
8/3/2019 110506 CSIS Defense Contract Trends-Sm2
http://slidepdf.com/reader/full/110506-csis-defense-contract-trends-sm2 15/38
14
DoD Contract Spending on R&D by Component, 1990-2010
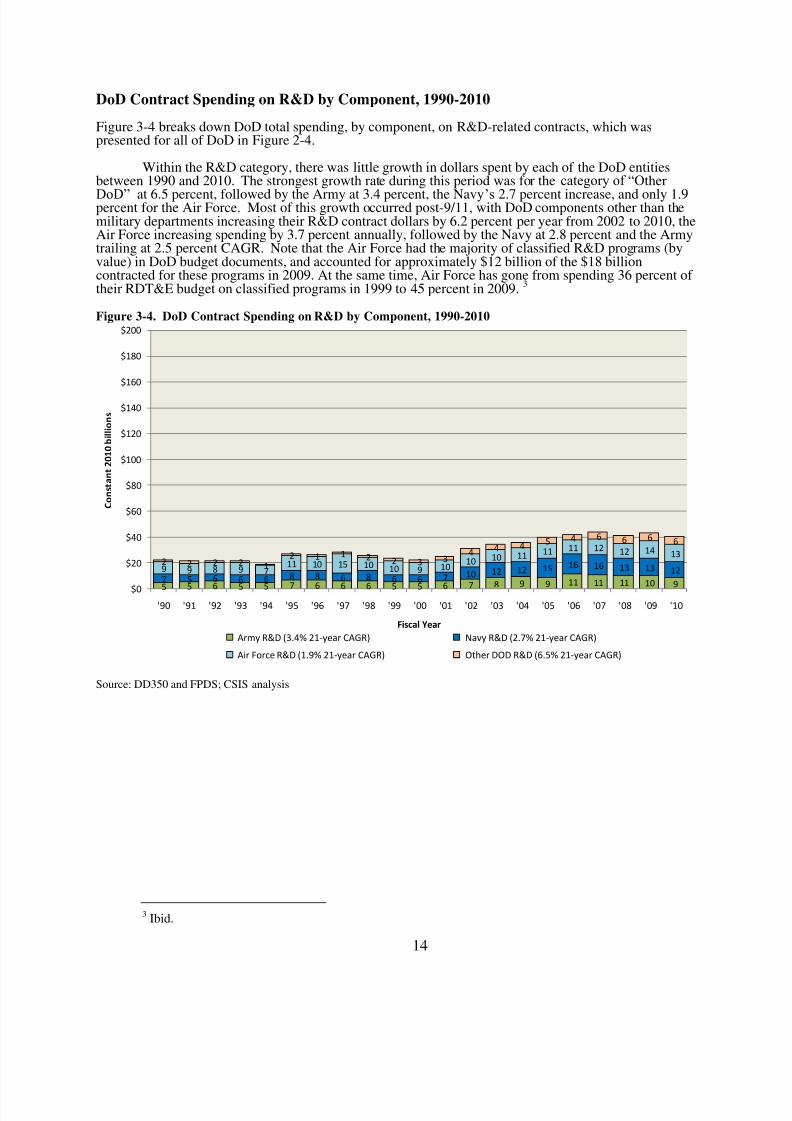
Figure 3-4 breaks down DoD total spending, by component, on R&D-related contracts, which waspresented for all of DoD in Figure 2-4.
Within the R&D category, there was little growth in dollars spent by each of the DoD entitiesbetween 1990 and 2010. The strongest growth rate during this period was for the category of “Other
DoD” at 6.5 percent, followed by the Army at 3.4 percent, the Navy’s 2.7 percent increase, and only 1.9percent for the Air Force. Most of this growth occurred post-9/11, with DoD components other than themilitary departments increasing their R&D contract dollars by 6.2 percent per year from 2002 to 2010, theAir Force increasing spending by 3.7 percent annually, followed by the Navy at 2.8 percent and the Armytrailing at 2.5 percent CAGR. Note that the Air Force had the majority of classified R&D programs (byvalue) in DoD budget documents, and accounted for approximately $12 billion of the $18 billioncontracted for these programs in 2009. At the same time, Air Force has gone from spending 36 percent of their RDT&E budget on classified programs in 1999 to 45 percent in 2009. 3
Figure 3-4. DoD Contract Spending on R&D by Component, 1990-2010
Source: DD350 and FPDS; CSIS analysis
3 Ibid.
5 5 6 5 5 7 6 6 6 5 5 6 78 9 9 11 11 11 10 9
7 5 6 6 6 8 8 6 8 6 6 7 10 12 12 15 16 16 13 13 129 9 8 9 711 10 15 10 10 9 10
10 10 11 11 11 12 12 14 132 2 2 2 1
2 1 1 2 2 3 34 4 4
5 4 6 6 6 6
$0
$20
$40
$60
$80
$100
$120
$140
$160
$180
$200
'90 '91 '92 '93 '94 '95 '96 '97 '98 '99 '00 '01 '02 '03 '04 '05 '06 '07 '08 '09 '10
C o n s t a n t 2 0 1 0 b i l l i o n s
Fiscal Year
Army R&D (3.4% 21-year CAGR) Navy R&D (2.7% 21-year CAGR)
Air Force R&D (1.9% 21-year CAGR) Other DOD R&D (6.5% 21-year CAGR)

8/3/2019 110506 CSIS Defense Contract Trends-Sm2
http://slidepdf.com/reader/full/110506-csis-defense-contract-trends-sm2 16/38
15
Army Contract Spending, 1990-2010
The Army’s total spending on contracts for the period 1990-2010 is displayed in FY 2010 dollar amountsin the bars and on the left-hand y-axis in Figure 3-5 below. The line above the bars tracks Army contractspending as a percentage of total DoD dollars spent on contracts and is linked to the data on the right-hand y-axis.
Army contract spending has skyrocketed over the past decade. During the 1990s, the Armyaccounted for only 23 to 25 percent of total DoD contract spending. Beginning in FY 2002, this sharestarted to grow rapidly, reaching 40 percent of total DoD contract spending by 2008. Growth in Armycontract spending averaged over 11.5 percent per year since 1999. This rapid growth is almost entirelyattributable to Army operations in Afghanistan and Iraq.
Figure 3-5. Army Contract Spending, 1990-2010
Source: DD350 and FPDS; CSIS analysis
36 37 34 34 31 35 39 41 40 42 46 49 5575 86
105 106129
154 146 140
0%
5%
10%
15%
20%
25%
30%
35%
40%
45%
$0
$50
$100
$150
$200
$250
$300
$350
$400
$450
'90 '91 '92 '93 '94 '95 '96 '97 '98 '99 '00 '01 '02 '03 '04 '05 '06 '07 '08 '09 '10
P e r c e n t a g e o f D o D C o n t r a c t
S p e n d i n g
C o n s t a n t 2 0 1 0 B i l l i o n s
Fiscal Year
Army (7.0% 21-year CAGR) % Army of total DoD contract spending
8/3/2019 110506 CSIS Defense Contract Trends-Sm2
http://slidepdf.com/reader/full/110506-csis-defense-contract-trends-sm2 17/38
16
Navy Contract Spending, 1990-2010
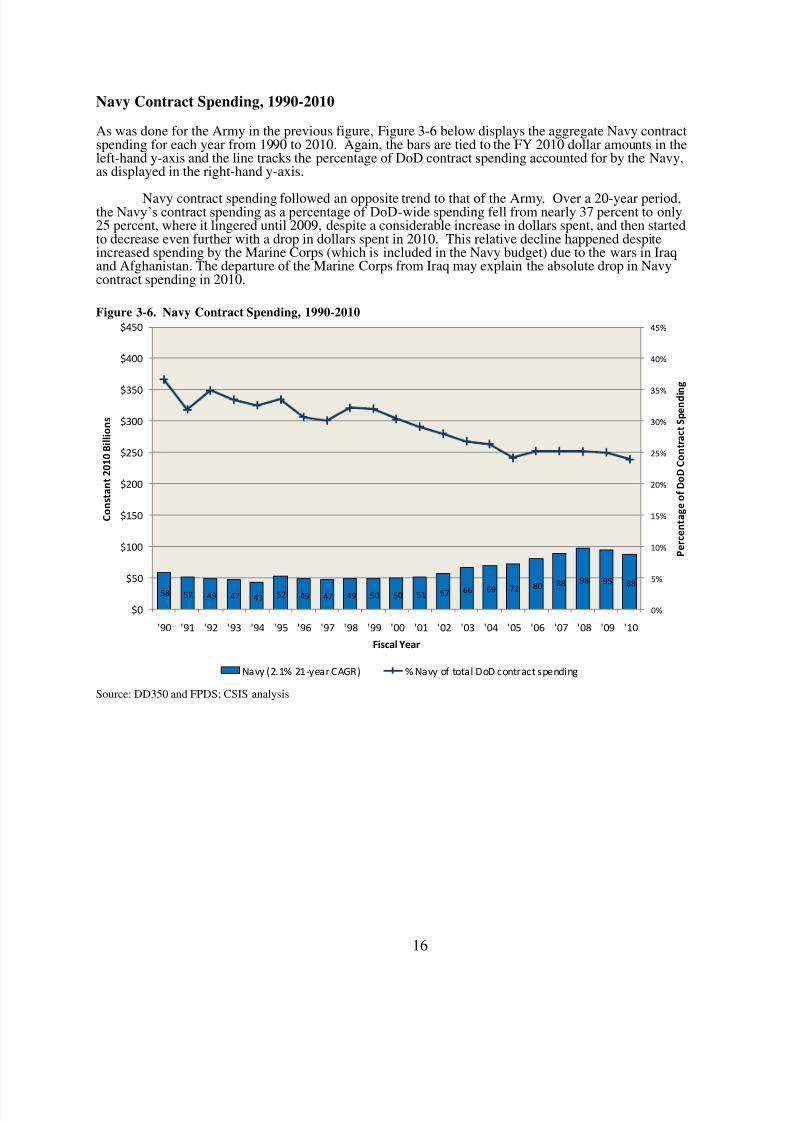
As was done for the Army in the previous figure, Figure 3-6 below displays the aggregate Navy contractspending for each year from 1990 to 2010. Again, the bars are tied to the FY 2010 dollar amounts in theleft-hand y-axis and the line tracks the percentage of DoD contract spending accounted for by the Navy,as displayed in the right-hand y-axis.
Navy contract spending followed an opposite trend to that of the Army. Over a 20-year period,the Navy’s contract spending as a percentage of DoD-wide spending fell from nearly 37 percent to only25 percent, where it lingered until 2009, despite a considerable increase in dollars spent, and then startedto decrease even further with a drop in dollars spent in 2010. This relative decline happened despiteincreased spending by the Marine Corps (which is included in the Navy budget) due to the wars in Iraqand Afghanistan. The departure of the Marine Corps from Iraq may explain the absolute drop in Navycontract spending in 2010.
Figure 3-6. Navy Contract Spending, 1990-2010
Source: DD350 and FPDS; CSIS analysis
58 52 49 47 43 52 49 47 49 50 50 51 57 66 69 72 8088 98 95 88
0%
5%
10%
15%
20%
25%
30%
35%
40%
45%
$0
$50
$100
$150
$200
$250
$300
$350
$400
$450
'90 '91 '92 '93 '94 '95 '96 '97 '98 '99 '00 '01 '02 '03 '04 '05 '06 '07 '08 '09 '10
P e r c e n t a g e o f D o D C o n t r a c t S p e n d i n
g
C o n s t a n t 2 0 1 0 B i l l i o n s
Fiscal Year
Navy (2.1% 21-year CAGR) % Navy of total DoD contract spending

8/3/2019 110506 CSIS Defense Contract Trends-Sm2
http://slidepdf.com/reader/full/110506-csis-defense-contract-trends-sm2 18/38
17
Air Force Contract Spending, 1990-2010
Total contract spending for the Air Force is presented in Figure 3-7 in both FY 2010 dollar amounts(represented by the bars tied to the data in the left-hand y-axis) and as a percentage of total DoD spendingon contracts (represented by the line tied to the data in the right-hand y-axis).
The Air Force’s share of DoD-wide contract spending declined steeply during the past decade,
even as the number of contract dollars it awarded remained flat or increased. In fact, Air Force contractspending as a percentage of DoD obligations recently dropped to an all-time low since its founding in1947, even though its absolute level of spending increased over 32 percent between 2001 and 2010 alone.Unprecedentedly, the Air Force fell behind even “Other DoD” in its relative share of DoD contractspending.
Air Force contract spending has historically included a disproportionate share of overallDoD classified contracts, largely because of the use of Air Force entities for such work.Classified projects explain a substantial portion of the Air Force’s relative decline. In absolute terms, theAir Force was responsible for 95 percent of the $18 billion in DoD classified procurement accountprojects in 2010. As was earlier noted, classified spending has gone from 36 percent of the Air ForceRDT&E budget in 1999 to 45 percent in 2009.4 As a result, the chart below probably understates AirForce contract spending and that understatement may be increasing over time.
Figure 3-7. Air Force Contract Spending, 1990-2010
Source: DD350 and FPDS; CSIS analysis
4 Ibid.
43 49 37 40 38 49 50 49 43 42 47 49 56 65 62 61 67 73 64 67 65
0%
5%
10%
15%
20%
25%
30%
35%
40%
45%
$0
$50
$100
$150
$200
$250
$300
$350
$400
$450
'90 '91 '92 '93 '94 '95 '96 '97 '98 '99 '00 '01 '02 '03 '04 '05 '06 '07 '08 '09 '10
P e r c e n t a g e
o f D o D C o n t r a c t S p e n d i n g
C o n
s t a n t 2 0 1 0 B i l l i o n s
Fiscal Year
Air Force (2.0% 21-year CAGR) % Air Force of total DoD contract spending

8/3/2019 110506 CSIS Defense Contract Trends-Sm2
http://slidepdf.com/reader/full/110506-csis-defense-contract-trends-sm2 19/38
18
Other DoD Components Contract Spending, 1990-2010
Total contract spending by all other DoD entities, aggregated in the “Other DoD” category, is presented inFigure 3-8. As in the previous three figures, the data are expressed in absolute dollar amounts,represented by the bars and the left-hand y-axis, and as a percentage of overall DoD contract spending,represented by the line and the right-hand y-axis.
As previously discussed, spending by these DoD components saw very little growth between1990 and 2000, then increased substantially beginning in 2001. The sharp increase in contract spendingby the Defense Logistics Agency in support of operations in Iraq and Afghanistan was the key factor inthe growth in the “Other DoD” category after 9/11. As a result, total spending on contracts by DoDcomponents other than the military departments more than tripled in value over the past decade.
Figure 3-8. Other DoD Components Contract Spending, 1990-2010
Source: DD350 and FPDS; CSIS analysis
20 24 20 20 20 19 21 19 20 22 23 26 35 42 4559 65 62 71 72 74
0%
5%
10%
15%
20%
25%
30%
35%
40%
45%
$0
$50
$100
$150
$200
$250
$300
$350
$400
$450
'90 '91 '92 '93 '94 '95 '96 '97 '98 '99 '00 '01 '02 '03 '04 '05 '06 '07 '08 '09 '10
P e r c e n t a g e o f D o D C o n t r a c t S p e n d i n g
C o n s t n a t 2 0 1 0 B i l l i o n s
Fiscal Year
Other DOD (6.7% 21-year CAGR) % Other DoD

8/3/2019 110506 CSIS Defense Contract Trends-Sm2
http://slidepdf.com/reader/full/110506-csis-defense-contract-trends-sm2 20/38
19
Share of DoD Contract Spending by Component, 1990-2010
To show the relative shares of total DoD contract spending held by the individual DoD components from1990 to 2010, the percentage lines from the previous four figures are grouped together in Figure 3-9. Allvalues represented in the graph are expressed in percentage of total DoD contract spending for each year.
Driven by operations in Iraq and Afghanistan, the Army’s contract spending grew rapidly post-2001 to claim the largest share of defense contract dollars (40 percent at its peak in 2008 compared to 27percent in 2001). The Navy’s share of defense contract dollars overall held mostly steady after 2004 at 25percent, following a long decline from 1990 levels, but its share saw a decline in the last year analyzed.In an unprecedented occurrence, the Air Force dropped to the lowest share of defense contract spendingin 2008 at nearly 17 percent. However, this low share does not reflect the Air Force’s leading role inspending on classified projects. The category of “Other DoD” also includes substantial classified contractspending. Furthermore, the decline in Air Force and Navy shares of DoD spending was in parallel toabsolute gains observed in both of these accounts over the past decade. Meanwhile, the collective shareof all “Other DoD” entities is rising back to the peak levels observed in 2005 and 2006.
Figure 3-9. Share of DoD Contract Spending by Component, 1990-2010
Source: DD350 and FPDS; CSIS analysis
0%
5%
10%
15%
20%
25%
30%
35%
40%
45%
'90 '91 '92 '93 '94 '95 '96 '97 '98 '99 '00 '01 '02 '03 '04 '05 '06 '07 '08 '09 '10
P e r c e n t a g e o f D o D C o n t r a c t S p e n d i n g
Fiscal Year
% Army of total DoD contract spending % Navy of total DoD contract spending
% Air Force of total DoD contract spending % Other DoD

8/3/2019 110506 CSIS Defense Contract Trends-Sm2
http://slidepdf.com/reader/full/110506-csis-defense-contract-trends-sm2 21/38
20
Army Contract Spending by Category, 1990-2010
Figure 3-10 breaks down Army contract spending data, originally presented in aggregate form in Figure3-5, into the three categories of products, services and R&D spending.
Between 1990 and 2010, Army spending on contracts for services increased far more rapidlyyear-on-year than its spending on products contracts. Since 1993, Army expenditures on services actually
exceeded spending on products in every year except 2008, while accounting for between 45 and 53percent of all Army contract spending every year in the post-9/11 timeframe. Nevertheless, over the past12 years, the rate of increase in Army spending on products slightly exceeded that of services, withproducts spending increasing 13 percent per year and services spending growing by 12.6 percent annuallyduring this period. This is possibly due to an increase in the need for spare parts and materiel to replaceand replenish equipment lost or damaged during operations.
Figure 3-10. Army Contract Spending by Category, 1990-2010
Note: The “unlabelled” category, which totals less than 1 billion a year, was excluded from the figure.
Source: DD350 and FPDS; CSIS analysis
19 17 15 14 10 12 14 14 13 15 17 19 2029 31
46 4457
7560 57
13 1513 15
15 1718 20 21 22 23 24
28
3746
50 50
62
69
7574
5 56 5
57
6 6 65
56
7
8
9
9 11
11
11
109
$0
$20
$40
$60
$80
$100
$120
$140
$160
$180
'90 '91 '92 '93 '94 '95 '96 '97 '98 '99 '00 '01 '02 '03 '04 '05 '06 '07 '08 '09 '10
C o n s t a n t 2 0 1 0 B i l l i o n s
Fiscal Year
Army Products (5.7% 21-year CAGR) Army Services (9.1% 21-year CAGR) Army R&D (3.4% 21-year CAGR)

8/3/2019 110506 CSIS Defense Contract Trends-Sm2
http://slidepdf.com/reader/full/110506-csis-defense-contract-trends-sm2 22/38
21
Navy Contract Spending by Category, 1990-2010
In Figure 3-11, the data for total Navy contract spending, presented earlier in Figure 3-6, is broken downinto products, services and R&D.
Trends in Navy contract spending from 1990 to 2010 moved in an opposite direction to those of the Army. For nearly every year in this time period, Navy spending on products contracts exceeded or
matched its spending on services contracts. This gap is especially noticeable after the commencement of U.S. military operations in Iraq and Afghanistan, when Navy contract spending on services consistentlyremained below 40 percent of overall Navy contract spending. Navy spending on R&D acceleratedsignificantly between 1999 and 2010 relative to the other military services, growing at an annual rate of 6.9 percent compared to the Army’s 4.8 percent and the Air Force’s 2.6 percent growth rates. One factorcontributing to this growth was the use of R&D contracts for the F-35 and the DDG-1000 programs.
Figure 3-11. Navy Contract Spending by Category, 1990-2010
Note: The “unlabelled” category, which totals less than 1 billio n a year, was excluded from the figure.
Source: DD350 and FPDS; CSIS analysis
31 27 26 24 18 23 19 20 20 22 24 22 23 28 32 31 36 4252
45 42
1919 17 17
1922
22 21 20 22 21 22 2427
26 2628
31
3336
347
56 6
6
88 6 8 6 6 7
10
1212 15
16
16
1313
12
$0
$20
$40
$60
$80
$100
$120
$140
$160
$180
'90 '91 '92 '93 '94 '95 '96 '97 '98 '99 '00 '01 '02 '03 '04 '05 '06 '07 '08 '09 '10
C o n s t a n t 2 0 1 0 B i l l i o n s
Fiscal Year
Navy Products (1.5% 21-year CAGR) Navy Services (2.8% 21-year CAGR) Navy R&D (2.7% 21-year CAGR)
8/3/2019 110506 CSIS Defense Contract Trends-Sm2
http://slidepdf.com/reader/full/110506-csis-defense-contract-trends-sm2 23/38
22
Air Force Contract Spending by Category, 1990-2010
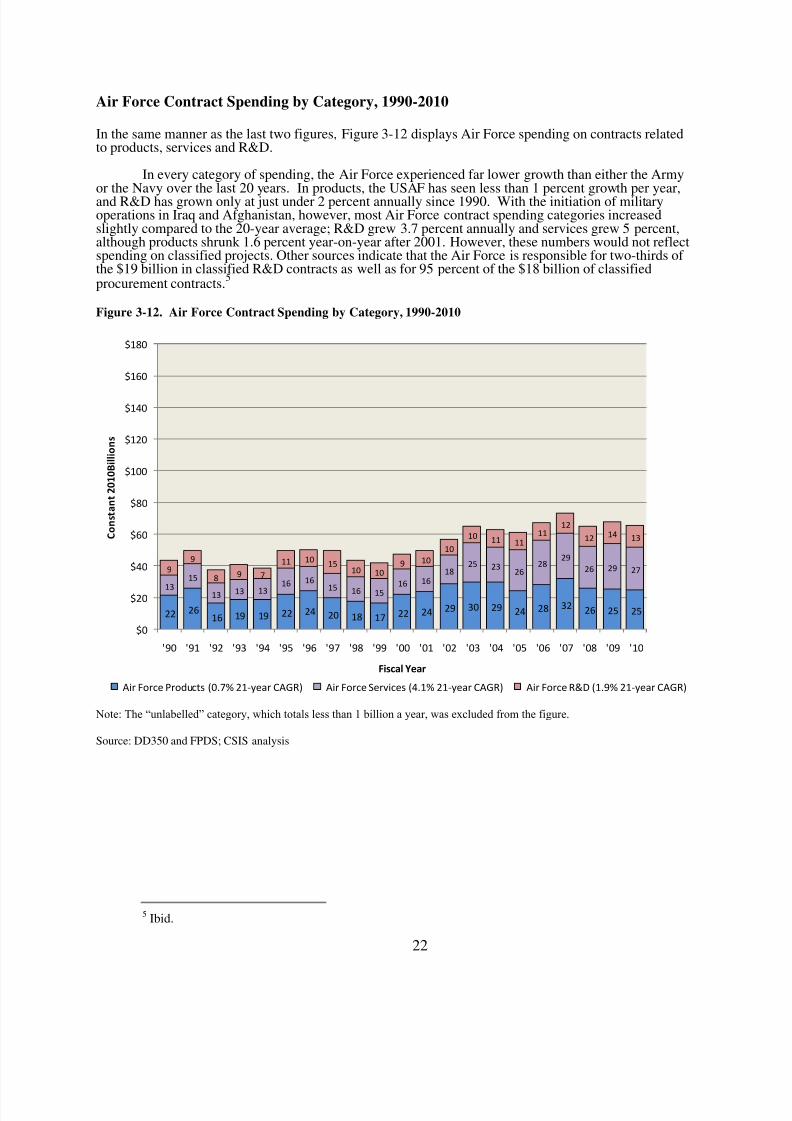
In the same manner as the last two figures, Figure 3-12 displays Air Force spending on contracts relatedto products, services and R&D.
In every category of spending, the Air Force experienced far lower growth than either the Armyor the Navy over the last 20 years. In products, the USAF has seen less than 1 percent growth per year,and R&D has grown only at just under 2 percent annually since 1990. With the initiation of militaryoperations in Iraq and Afghanistan, however, most Air Force contract spending categories increasedslightly compared to the 20-year average; R&D grew 3.7 percent annually and services grew 5 percent,although products shrunk 1.6 percent year-on-year after 2001. However, these numbers would not reflectspending on classified projects. Other sources indicate that the Air Force is responsible for two-thirds of the $19 billion in classified R&D contracts as well as for 95 percent of the $18 billion of classifiedprocurement contracts.
5
Figure 3-12. Air Force Contract Spending by Category, 1990-2010
Note: The “unlabelled” category, which totals less than 1 billion a year, was excluded from the figure.
Source: DD350 and FPDS; CSIS analysis
5 Ibid.
22 2616 19 19 22 24 20 18 17 22 24 29 30 29 24 28 32
26 25 25
13
15
13 13 1316 16
15 16 1516 16
1825 23
2628
29
26 29 279
9
8 9 7
11 1015
10 109 10
10
10 11 1111
12
12 14 13
$0
$20
$40
$60
$80
$100
$120
$140
$160
$180
'90 '91 '92 '93 '94 '95 '96 '97 '98 '99 '00 '01 '02 '03 '04 '05 '06 '07 '08 '09 '10
C o n s t a n t 2 0 1 0 B i l l i o n s
Fiscal Year
Air Force Products (0.7% 21-year CAGR) Air Force Services (4.1% 21-year CAGR) Air Force R&D (1.9% 21-year CAGR)
8/3/2019 110506 CSIS Defense Contract Trends-Sm2
http://slidepdf.com/reader/full/110506-csis-defense-contract-trends-sm2 24/38
23
“Other DoD” Contract Spending by Category, 1990-2010
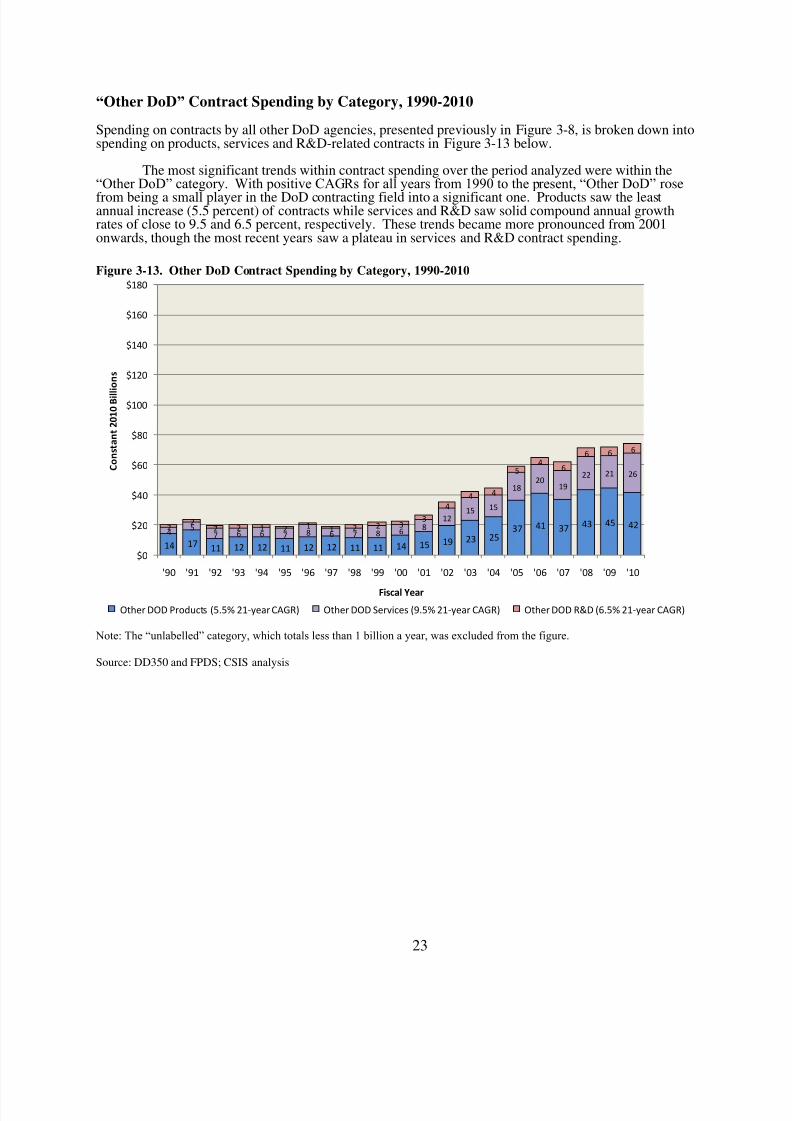
Spending on contracts by all other DoD agencies, presented previously in Figure 3-8, is broken down intospending on products, services and R&D-related contracts in Figure 3-13 below.
The most significant trends within contract spending over the period analyzed were within the“Other DoD” category. With positive CAGRs for all years from 1990 to the present, “Other DoD” rose
from being a small player in the DoD contracting field into a significant one. Products saw the leastannual increase (5.5 percent) of contracts while services and R&D saw solid compound annual growthrates of close to 9.5 and 6.5 percent, respectively. These trends became more pronounced from 2001onwards, though the most recent years saw a plateau in services and R&D contract spending.
Figure 3-13. Other DoD Contract Spending by Category, 1990-2010
Note: The “unlabelled” category, which totals less than 1 billion a year, was excluded from the figure.
Source: DD350 and FPDS; CSIS analysis
14 17 11 12 12 11 12 12 11 11 14 15 19 23 2537 41 37 43 45 42
45
7 6 6 7 8 6 7 8 68
1215 15
1820
19
22 21 26
22
2 2 1 2 1 1 2 2 33
4
4 4
54
6
6 6 6
$0
$20
$40
$60
$80
$100
$120
$140
$160
$180
'90 '91 '92 '93 '94 '95 '96 '97 '98 '99 '00 '01 '02 '03 '04 '05 '06 '07 '08 '09 '10
C o n s t a n t 2 0 1 0 B i l l
i o n s
Fiscal Year
Other DOD Products (5.5% 21-year CAGR) Other DOD Services (9.5% 21-year CAGR) Other DOD R&D (6.5% 21-year CAGR)

8/3/2019 110506 CSIS Defense Contract Trends-Sm2
http://slidepdf.com/reader/full/110506-csis-defense-contract-trends-sm2 25/38
24
4. DoD Contract Characteristics
Defense Contract Spending by Competition, 1999-2010
To determine levels of competitiveness in contract awards, CSIS looked at the number of offers receivedfrom distinct entities before the award. Contracts awarded after receiving multiple offers are the mostcompetitive, followed by those awarded after a single offer and contracts awarded under no competition.Note that in Figure 4-1 below, unlabeled contracts are those that are either unlabeled in FPDS or thosewhich were determined by CSIS analysis to be erroneously labeled (for example, if the contract isdesignated as competed and there are zero bidders, or if it is designated as non-competed and there arefive bidders).
In Figure 4-1 below, total DoD contract spending (presented earlier in Figure 1-1) is broken intothe four categories of competition: no competition, competition with a single bidder, competition withmultiple bidders, and unlabelled contracts. Unlike the previous figures, FPDS data for this figure existonly for contracts awarded between 1999 and 2010.
The data show that between 1999 and 2010, there was an increase in competition across DoDcontract awards, with the share of defense contract dollars competitively awarded rising from 48 percent
to 63 percent. This is a result of slowed growth in non-competed contract dollars (8 percent annualgrowth from 1999 to 2010) and a surge in competitively awarded contract dollars (20 percent annualgrowth in contract dollars awarded competitive with a single offer and 11 percent growth in contractdollars awarded competitively with multiple offers). Interestingly, the rise in competed contract actionspredated the 2009 Presidential Memo and subsequent OMB guidance to government departments toincrease competition in contract awards.6
Figure 4-1. Defense Contract Spending by Competition, 1999-2010
Source: DD350 and FPDS; CSIS analysis
6 Barack Obama, Memorandum for the Heads of Executive Departments and Agencies. Subject:
Government Contracting, White House, Washington DC, 2009.
6783 83 98 115
126152 160 168
184 188 180
8
10 15
15
1922
3438
4655 54
53
61
6671
81
103103
110
120
131
146 134130
20
89
11
13
13
4
3
2
57
4
$0
$50
$100
$150
$200
$250
$300
$350
$400
$450
'99 '00 '01 '02 '03 '04 '05 '06 '07 '08 '09 '10
C o n s t a n t 2 0 1 0 B i l l i o n s
Fiscal Year
Unlabelled
(-15.1%)
No Competition
(7.9%)
Competition with
single offer
(20.4%)
Competition with
multiple offers
(10.4%)
Competition Category
(11-year CAGR)

8/3/2019 110506 CSIS Defense Contract Trends-Sm2
http://slidepdf.com/reader/full/110506-csis-defense-contract-trends-sm2 26/38
25
Defense Contract Spending by Funding Mechanism, 1999-2010
Figure 4-2 presents trends in the choice of funding mechanism for DoD contract dollars. Fundingmechanisms, or the conditions under which the government pays its obligations, are divided here into costreimbursement, fixed price, time and materials (a form of cost-based contract distinguishable from cost-reimbursement by the responsibilities assumed by the customer and the contractor), and “combination”, (a
mix of cost and fixed-price) categories. Contracts labeled as “Other” are accounted for as either CostReimbursement or Fixed Price contracts and are not treated as separate categories despite having theirown bar segments in the graph. Only the years 1999-2010 are covered in this figure.
The data for 1999-2010 reveal two important trends. The first is a decrease (since 2008) in thenumber of unlabeled contracts, which indicates that more care is taken in entering data oncompetitiveness. The second is an increase in fixed-price contracting that is faster than cost-basedcontracting, including time and materials, which is in line with the 2009 Presidential Memo calling formore use of fixed-price contracting across government.7
It is noteworthy that combination contracts, those which include elements of both cost-based andfixed-price, emerged and grew substantially in both products and services contracting within a very shorttime. In fact, this category had a combined annual growth rate of 140 percent over a 5-year period endingin 2009. With this type of contracts, it is impossible to determine how many dollars are awarded on afixed-price or cost basis. For example, in the $45 billion awarded in 2009, it is possible that $40 billion
was awarded on a cost basis and $5 billion was awarded on fixed-price, thus undermining the observationthat fixed-price contracting was significantly increasing. This degree of uncertainty made it difficult forgovernment programs to evaluate the relationship between contractor performance and the mechanism of funding. Furthermore, data on combined contract awards complicated government compliance withPresident Obama’s March 2009 guidance calling for greater competition and an increase in the use of fixed-price contracts. However, in 2010, FPDS reports far fewer dollars in combinedcontracts. Thiscategory bears watching in FY 2011.
Figure 4-2. Defense Contract Spending by Funding Mechanism, 1999-2010
Note: The “other” category, which totals less than 20 million a year, was excluded from the figure.
Source: DD350 and FPDS; CSIS analysis
7 Ibid.
92 100 111130
158 158
190 199214
241227
2415251
53
58
71 83
8798
93
9391
104
67
6
7
1011
13
1516
17 16
15
00
0
0
01
1
423
3345
6
78
8
10
1111
8
5
1
6 50
$0
$50
$100
$150
$200
$250
$300
$350
$400
$450
'99 '00 '01 '02 '03 '04 '05 '06 '07 '08 '09 '10
C o n s t a n t 2 0 1 0
B i l l i o n s
Fiscal Year
Unlabelled
(-29.0%)
Combination
(n/a)
Time And Materials
(9.3%)
Cost Reimbursement
(7.3%)
Fixed Price
(10.1%)
Funding Mechanism
Category
(11-year CAGR)

8/3/2019 110506 CSIS Defense Contract Trends-Sm2
http://slidepdf.com/reader/full/110506-csis-defense-contract-trends-sm2 27/38
26
Defense Contract Spending by Contract Vehicle, 1999-2010
In Figure 4-3 below, total DoD contract spending is broken out by contract vehicles. The IndefiniteDelivery Vehicles (IDV) category is further broken out into Federal Supply Schedule (FSS), MultipleAward Independent Delivery Contracts (IDCs) and Single Award IDCs. Purchase Orders and DefinitiveContracts form separate categories.
The data reveal that DoD has awarded contracts using primarily the definitive contract and singleaward IDC vehicles. However, the growth of all indefinite delivery vehicles combined outpaced that inthe definitive contract categories, driven by single award contracts.
Figure 4-3. Defense Contract Spending by Contract Vehicle, 1999-2010
Note: The “unlabelled IDV” category, which totals less than 3 billion a year, was excluded from the figure.
Source: DD350 and FPDS; CSIS analysis
98 99 102 116131 128 136 144 155
171 172154
3 34
56 7
99
1011 11
10
40 45 50
58
79 90
119120
132
152 146
135
10 1314
17
2226
3334
37
45 51
56
56
7
10
1213
1414
12
11 11
11
$0
$50
$100
$150
$200
$250
$300
$350
$400
$450
'99 '00 '01 '02 '03 '04 '05 '06 '07 '08 '09 '10
C o n s t a n t 2 0 1 0 B i l l i o n s
Fiscal Year
FSS or other
(6.9%)
Multiple Award IDC
(18.3%)
Single Award IDC
(12.8%)
Purchase Order
(13.7%)
Definitive Contract
(4.6%)
Indefinite
DeliveryVehicle
Contract Vehicle
Category
(11-year CAGR)

8/3/2019 110506 CSIS Defense Contract Trends-Sm2
http://slidepdf.com/reader/full/110506-csis-defense-contract-trends-sm2 28/38
27
5. The Industrial Base Supporting DoD
Top 20 DoD Contractors, 1999 and 2009
Table 5-1 presents snapshots taken for 1999 and 2009 of the top 20 DoD contractors, i.e. those taking thelargest shares of total DoD contract dollars. Out of this group, the top 5 contractors are identified in aseparate cadre. Values are expressed in millions of FY 2010 dollars.
Though the top 5 DoD contractors between 1999 and 2009 did not change, there were somesubstantial shifts in the composition and market shares of contractors ranked 6 to 20. The share of defense contracts awarded to the top 5 declined from 29 percent of total defense contracts in 1999 to 27percent in 2009.
The top 20 defense contractors overall, however, increased their share of the market from 41percent in 1999 to 43 percent in 2009. The biggest change in the top 20 occurred in the number andmarket share of health care contractors, which increased their number from two in 1999 to three in 2009and their market share from half a percent of total DoD contract awards to over 2 percent. If the top threehealth care firms in 2009 were combined, their dollar awards would total just under $9 billion and theywould place sixth on the list. This highlights the sharp growth in DoD health care expenses from anindustrial base perspective.
Interestingly, the data seem to refute that the same defense firms are gaining an ever-larger shareof the market. The top 5 contractors actually lost market share, and of the firms in places 6 to 20, defensecontract dollars went to different contractors over time. Therefore, the consolidation and verticalintegration of the industry are not visible in the contract dollars awarded to top contractors.
Table 5-1. Top 20 DoD Contractors, 1999 and 2009
*Joint VentureSource: DD350 and FPDS; CSIS analysis
Rank Top 20 Contractors in 1999
Contract
Value in 2010
Millions Top 20 Contractors in 2009
Contract
Value in 2010
Millions
1 Lockheed Martin 15,980 Lockheed Martin 31,900
2 Boeing 12,180 Boeing 21,020
3 Raytheon 7,900 Northrop Grumman 19,180
4 General Dynamics 5,560 General Dynamics 16,000
5 Northrop Grumman 3,740 Raytheon 14,930
Subtotal for Top 5 45,360 103,040
6 United Technologies 2,910 BAE Systems 7,230
7 General Electric 1,930 L3 Communications 7,050
8 Textron 1,810 United Technologies 6,790
9 TRW 1,760 Oshkosh 6,210
10 SAIC 1,730 KBR 4,660
11 Litton 1,530 SAIC 4,540
12 United Defense Industries 1,190 ITT 3,800
13 Computer Sciences Corp. 1,140 Humana 3,460
14 ITT 860 General Electric 3,030
15 Halliburton 830 Computer Sciences Corp. 2,980
16 Humana 790 Health Net 2,860
17 Dyncorp 700 TriWest Healthcare 2,700
18 Bechtel 690 Bell-Boeing Joint Project Office* 2,570
19 Honeywell 680 MacAndrews & Forbes Holdings 2,460
20 Anthem 650 Bechtel 2,440
Total for Top 20 64,570 165,830
Total for DoD 156,520 383,420

8/3/2019 110506 CSIS Defense Contract Trends-Sm2
http://slidepdf.com/reader/full/110506-csis-defense-contract-trends-sm2 29/38
28
Top 20 DoD Contractors for Products, 1999 and 2009
Table 5-2 presents the top 20 contractors taking the largest shares of DoD dollars spent on product-relatedcontracts in 1999 and 2009.
In the products category, there were few noticeable changes at the top level, as companies buoyed
on mergers and acquisitions into higher positions. Between 1999 and 2009, Northrop Grumman acquiredshipyards Litton (8th place in 1999), Avondale (13th place in 1999), and Newport News Shipbuilding (19th place, in 2001) helping to raise their rank from sixth in 1999 to fifth 10 years later. Having divested itself of its Avondale shipyard, it is possible that the company will drop down the list in the coming years.BAE Systems climbed into the top 20 in 2009, having acquired United Defense and Stewart & Stevenson(ranked 11 and 16 in 1999), amongst others. In terms of market share, the top 5 contractors togetherdropped 6 percent while the top 20 overall dropped only 1 percent. There appears to have been a trend inlarger companies retaining their positions or rising in position primarily through their acquisitions of smaller companies. Without doing so, it is possible that the large mid-tier contractors would have risencloser to the top of the list while the top 5 may have dropped lower.
The possible effects of the conflicts in Iraq and Afghanistan are visible in the makeup of the topdefense products contractors in 2009. Three oil companies are represented – Shell Oil, BP and BahrainPetroleum – as well as new companies providing ground vehicles (BAE Systems and MacAndrews and
Forbes Holdings that own AM General). These companies were helped into their 2009 position bycontracts associated with the ground-based operations in Iraq and Afghanistan.
Table 5-2. Top 20 DoD Contractors for Products, 1999 and 2009
*Joint VentureSource: DD350 and FPDS; CSIS analysis
Rank Top 20 Contractors in 1999
Contract
Value in 2010
Millions Top 20 Contractors in 2009
Contract
Value in 2010
Millions
1 Boeing 7,080 Lockheed Martin 16,480
2 Lockheed Martin 6,930 Boeing 11,720
3 General Dynamics 4,330 General Dynamics 11,220
4 Raytheon 4,010 Raytheon 8,540
5 United Technologies 2,050 Northrop Grumman 8,360
Subtotal for Top 5 24,390 56,320
6 Northrop Grumman 1,990 Oshkosh 6,210
7 General Electric 1,750 United Technologies 5,000
8 Litton 1,440 BAE Systems 4,570
9 Textron 1,430 L3 Communications 2,580
10 Honeywell 680 General Electric 2,570
11 United Defense Industries 670 Bell-Boeing Joint Project Office* 2,570
12 Longbow LLC 540 MacAndrews & Forbes Holdings 2,460
13 Avondale Industries 530 Agility 1,980
14 Javelin Joint Venture* 500 Shell Oil 1,910
15 ATK 450 BP 1,900
16 Stewart & Stevenson 410 ITT 1,790
17 Westinghouse 380 Bahrain Petroleum Company 1,770
18 Motorola 340 ATK 1,620
19 Newport News Shipbuilding 340 Textron 1,470
20 Dell 330 Navistar 1,330
Total for Top 20 36,150 96,030
Total for Products 65,350 177,070

8/3/2019 110506 CSIS Defense Contract Trends-Sm2
http://slidepdf.com/reader/full/110506-csis-defense-contract-trends-sm2 30/38
29
Top 20 DoD Contractors for Services, 1999 and 2009
The top 20 contractors providing services to DoD in 1999 and 2009 are listed, in descending order of totalservice contract value expressed in millions of FY 2010 dollars, in Table 5-3
There have been significant changes in the structure and market share of the top defense servicecontractors. Health care service providers made huge gains between 1999 and 2009, as Humana made it
into the top 5 and two other health care contractors rose into the eighth and eleventh highest positions inthe top 20. The change in composition of the top 20 services contractors is fairly dramatic, as fewcontractors on the 1999 list carried over after 10 years (though one, TRW, was acquired by NorthropGrumman), and those that did generally increased their shares of the market. Furthermore, while the top5 contractors’ share of the market remained flat at 15 percent, the top 20’s grew from 29 to 36 percent.
One critical caveat is that the FPDS does not necessarily classify services spending in the samemanner that corporations do. For example, a close analysis by the study team found 2.7 billion in sixmaintenance, upgrade, and logistics support contracts awarded to one company that were classified inFPDS as products. This raises an important question: when acquisition policymakers discuss contractsusing FPDS data, do they mean to include all operations and maintenance contracts as service contracts?If they do, then they are underestimating the total value of service contracts due to categorization issues.
Table 5-3. Top 20 DoD Contractors for Services, 1999 and 2009
*Joint Venture
Source: DD350 and FPDS; CSIS analysis
Rank Top 20 Contractors in 1999
ContractValue in 2010
Millions Top 20 Contractors in 2009
ContractValue in 2010
Millions
1 Lockheed Martin 3,220 Lockheed Martin 7,040
2 Raytheon 2,930 Northrop Grumman 6,050
3 Boeing 2,090 KBR 4,660
4 SAIC 1,280 L3 Communications 3,710
5 Computer Sciences Corp. 1,000 Humana 3,460
Subtotal for Top 5 10,510 24,920
6 TRW 840 General Dynamics 3,370
7 Halliburton 830 Raytheon 3,130
8 Humana 790 Health Net 2,860
9 General Dynamics 750 SAIC 2,840
10 Dyncorp 700 Computer Sciences Corp. 2,800
11 Bechtel 690 TriWest Healthcare 2,700 12 Anthem 650 Boeing 2,650
13 Northrop Grumman 580 BAE Systems 2,120
14 TriWest Healthcare 530 URS 1,810
15 Foundation Health Federal Servic 500 ITT 1,670
16 Jacobs Engineering Group 470 Booz Allen Hamilton 1,540
17 ITT 450 Hensel Phelps 1,420
18 Fedex 440 Hewlett-Packard 1,410
19 Booz Allen Hamilton 420 CACI 1,390
20 Ocean Shipholdings 410 Bechtel 1,270
Total for Top 20 19,580 57,890
Total for Services 67,660 162,460

8/3/2019 110506 CSIS Defense Contract Trends-Sm2
http://slidepdf.com/reader/full/110506-csis-defense-contract-trends-sm2 31/38
30
Top 20 DoD Contractors for R&D, 1999 and 2009
The top 20 defense contractors for R&D are listed in Table 5-4. All conventions used in the previousthree tables apply to this table, as well.
Just as defense R&D contract spending remained nearly static over the past 10 years, so did thecomposition of the contractor base. Not only were the top four contractors the same from 1999 to 2009,
but they were in the same order. Interestingly, the fifth company in 1999 was acquired by the company inthird position in 2009, thus changing very little in the market composition. On the other hand, shares of the top 5 and top 20 overall increased, with the former’s share up from 50 to 56 percent and the latter growing from 71 to 76 percent. In other words, roughly the same 20 contractors have been doing researchand development for DoD from 1999 to 2009 and are claiming three-quarters of the work (by value). It isworth noting, however, that 5 of the top 20 here are either nonprofit contractors, University-AffiliatedResearch Centers, or Federally-Funded R&D Centers (MIT, Aerospace Corp., Johns Hopkins AppliedPhysics Lab, MITRE and Battelle), and thus are not a part of the same corporate industrial complexreflected in other charts. It is also worth noting that classified contracts are particularly common for R&Dwork and are not included in FPDS. As a result, the contract value and relative ranking for organizationsthat do significant amounts of classified work are likely understated.
Table 5-4. Top 20 DoD Contractors for R&D, 1999 and 2009
*Joint VentureSource: 1999 data generated using the DD350 contracts database; 2009 data are from https://www.FPDS.gov.
Rank Top 20 Contractors in 1999
Contract
Value in 2010Millions Top 20 Contractors in 2009
Contract
Value in 2010Millions
1 Lockheed Martin 5,830 Lockheed Martin 8,380
2 Boeing 3,020 Boeing 6,650
3 Northrop Grumman 1,160 Northrop Grumman 4,710
4 Raytheon 960 Raytheon 3,270
5 TRW 750 MIT 1,760
Subtotal for Top 5 11,720 24,780
6 United Technologies 720 General Dynamics 1,410
7 MITRE 530 United Technologies 1,080
8 United Defense Industries 510 Aerospace Corp. 800
9 General Dynamics 480 SAIC 790
10 Aerospace Corp. 470 L3 Communications 760
11 SAIC 460 Booz Allen Hamilton 720
12 MIT 450 BAE Systems 530 13 Johns Hopkins APL 360 Johns Hopkins APL 420
14 ITT 180 GE Rolls-Royce Fighter Engine Team* 410
15 General Electric 180 MITRE 330
16 Computer Sciences Corp. 150 ITT 320
17 Nichols Research 140 JVYS* 290
18 Textron 120 Battelle 260
19 GenCorp 120 CACI 250
20 Orbital Sciences 120 Computer Sciences Corp. 180
Total for Top 20 16,700 33,340
Total for R&D 23,500 43,880
8/3/2019 110506 CSIS Defense Contract Trends-Sm2
http://slidepdf.com/reader/full/110506-csis-defense-contract-trends-sm2 32/38
31
DoD Contract Spending by Contractor Size, 1999 and 2009
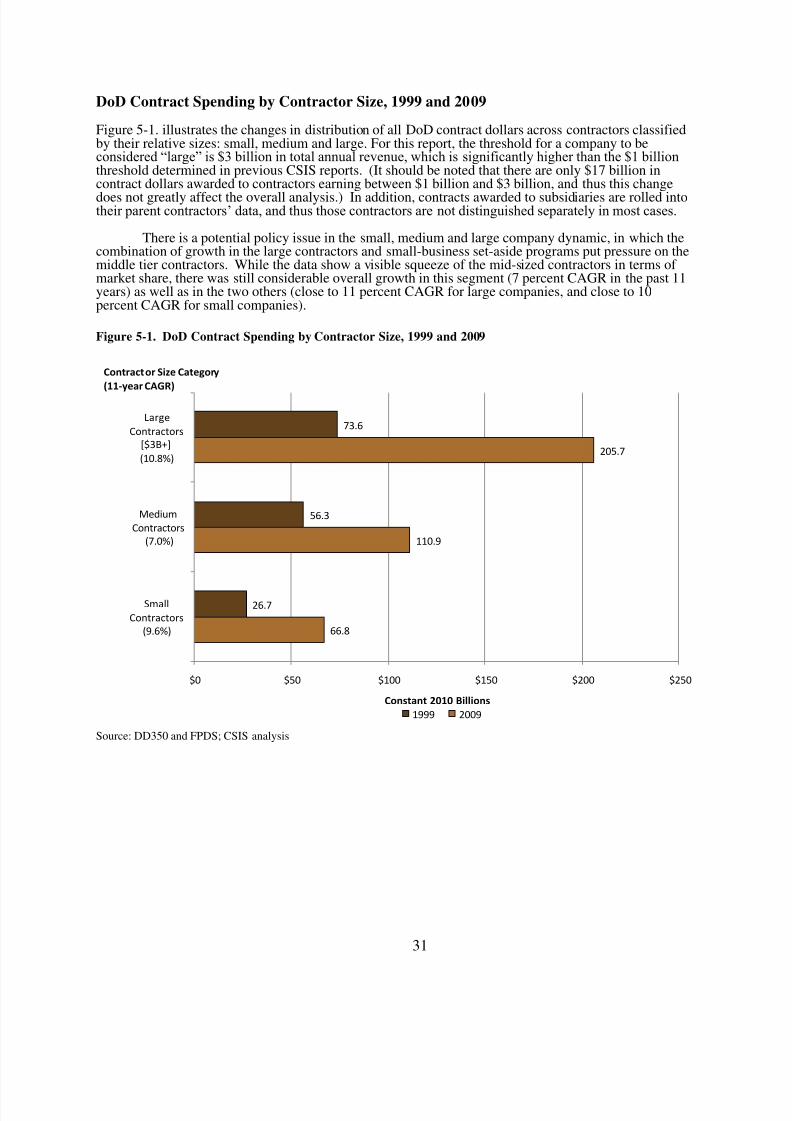
Figure 5-1. illustrates the changes in distribution of all DoD contract dollars across contractors classifiedby their relative sizes: small, medium and large. For this report, the threshold for a company to beconsidered “large” is $3 billion in total annual revenue, which is significantly higher than the $1 billionthreshold determined in previous CSIS reports. (It should be noted that there are only $17 billion incontract dollars awarded to contractors earning between $1 billion and $3 billion, and thus this change
does not greatly affect the overall analysis.) In addition, contracts awarded to subsidiaries are rolled intotheir parent contractors’ data, and thus those contractors are not distinguished separately in most cases.
There is a potential policy issue in the small, medium and large company dynamic, in which thecombination of growth in the large contractors and small-business set-aside programs put pressure on themiddle tier contractors. While the data show a visible squeeze of the mid-sized contractors in terms of market share, there was still considerable overall growth in this segment (7 percent CAGR in the past 11years) as well as in the two others (close to 11 percent CAGR for large companies, and close to 10percent CAGR for small companies).
Figure 5-1. DoD Contract Spending by Contractor Size, 1999 and 2009
Source: DD350 and FPDS; CSIS analysis
66.8
110.9
205.7
26.7
56.3
73.6
$0 $50 $100 $150 $200 $250
Small
Contractors
(9.6%)
Medium
Contractors
(7.0%)
Large
Contractors
[$3B+]
(10.8%)
Constant 2010 Billions
1999 2009
Contractor Size Category
(11-year CAGR)

8/3/2019 110506 CSIS Defense Contract Trends-Sm2
http://slidepdf.com/reader/full/110506-csis-defense-contract-trends-sm2 33/38
32
DoD Contract Spending for Products by Contractor Size, 1999 and 2009
The distribution of DoD contract dollars across defense product providers in 1999 and 2009 is illustratedin Figure 5-2 This is a subset of the data presented in the previous Figure 5-1. Contractors are classifiedby the same conventions as the previous figure.
The squeeze in mid-sized contractors is seen particularly clearly in contract awards for products.Compared to large and small contractors, which averaged a respective 11 and 12 percent annual growthover 11 years, medium-sized contractors grew by a smaller, but still healthy, 8 percent CAGR.
Figure 5-2. DoD Contract Spending for Products by Contractor Size, 1999 and 2009
Source: DD350 and FPDS; CSIS analysis
24.3
43.7
109.1
8.1
20.0
37.2
$0 $20 $40 $60 $80 $100 $120
Small
Contractors
(11.6%)
Medium
Contractors
(8.1%)
Large
Contractors
[$3B+]
(11.4%)
Constant 2010 Billions
1999 Products 2009 Products
Contractor Size Category
(11-year CAGR)

8/3/2019 110506 CSIS Defense Contract Trends-Sm2
http://slidepdf.com/reader/full/110506-csis-defense-contract-trends-sm2 34/38
33
DoD Contract Spending for Services by Contractor Size, 1999 and 2009
Figure 5-3. presents the change in distribution of service-providing defense contractors by size between1999 and 2009, using the same conventions as the previous two figures.
In services, the squeeze on mid-sized contractors is less apparent, though these firms lost their
lead in the market to large-sized firms. In 2009, mid-sized contractors held almost as large a share of themarket as did large contractors ($60 billion versus $65 billion, respectively). However, they still held asmaller share of the overall market share than they did in 1999 when compared to small and largecontractors.
Figure 5-3. DoD Contract Spending for Services by Contractor Size, 1999 and 2009
Source: DD350 and FPDS; CSIS analysis
37.6
60.0
64.8
15.5
30.7
21.5
$0 $20 $40 $60 $80 $100 $120
Small
Contractors
(9.3%)
Medium
Contractors
(7.0%)
Large
Contractors
[$3B+](11.7%)
Constant 2010 Billions
1999 Services 2009 Services
Contractor Size Category
(11-year CAGR)

8/3/2019 110506 CSIS Defense Contract Trends-Sm2
http://slidepdf.com/reader/full/110506-csis-defense-contract-trends-sm2 35/38
34
DoD Contract Spending for R&D by Contractor Size, 1999 and 2009
The changes that took place between 1999 and 2009 in the spread of R&D-providing contractors for DoDare illustrated in Figure 5-4. Again, contractors are classified in the same manner as in the contractors inthe aggregated contract categories in Figure 5-1.
While experiencing 7-8 percent annual growth in contract awards for products and services, mid-tier contractors grew by a mere 2 percent annually in R&D. In this they have been outpaced both by largecontractors (nearly 8 percent in R&D) and small contractors (nearly 5 percent in R&D). In the R&Dmarket, it is apparent that large contractors continued to dominate, with the same five contractorscontrolling three-fourths of DoD R&D contracting, as previously discussed. As in the earlier figures withR&D contract spending, classified contracts are not included in this analysis.
Figure 5-4. DoD Contract Spending for R&D by Contractor Size, 1999 and 2009
Source: DD350 and FPDS; CSIS analysis
4.9
6.4
32.6
3.1
5.1
15.3
$0 $20 $40 $60 $80 $100 $120
Small
Contractors
(4.8%)
Medium
Contractors
(2.3%)
Large
Contractors
[$3B+]
(7.8%)
Constant 2010 Billions
1999 R&D 2009 R&D
Contractor Size Category
(11-year CAGR)

8/3/2019 110506 CSIS Defense Contract Trends-Sm2
http://slidepdf.com/reader/full/110506-csis-defense-contract-trends-sm2 36/38
35
6. Summary
In DoD contracting overall, services grew at a much faster pace in the past 20 years than did products and
R&D, and were it not for combat operations in Iraq and Afghanistan would possibly have continued toreceive the lion’s share of DoD contract awards. Also as a result of these operations, Army and “other DoD” (primarily DLA) shares of total contracting grew while the Navy and Air Force shares declined.With U.S. forces set to withdraw from Iraq, the Army’s contract spending started to decrease in 2008while the Navy’s spending also shrunk and continued its long decline after a short period of stagnation.In an unprecedented occurrence, the share of Air Force contract spending in the last few years declined tothe lowest of all DoD components.
Trends in competition and funding mechanisms were mostly encouraging. Overall, the majorityof DoD contract dollars were awarded on an increasingly competitive basis towards the end of the periodanalyzed, and dollars awarded competitively rose faster than those awarded without competition. Theshare of contract dollars awarded using fixed price contracts also grew, at a faster rate than cost-based
contract awards. Up through 2009, there was a disturbing and sudden rise in “combination” contracts,which obfuscated the total distribution of cost and price-based contracts, but contract spending allocatedto this category seems to have all but disappeared in 2010. Finally, in another trend viewed with concernin light of recent efficiency-promoting directives within DoD, the spending on indefinite delivery vehiclesrose sharply in the past several years while definitive contracts and purchase orders stagnated and evendeclined in 2010.
Regarding the industrial base supporting DoD, there is little evidence in the data that the defenseindustry is consolidating into an oligopoly dominated by a small number of incumbent firms. While thetop 5 defense contractors overall and in products and R&D retained their position from 1999 to 2009,there were dynamic changes in the composition of the top 20 contractors in the industry during this time.Health care contractors rose closer to the top within the services category, while energy companies and
ground vehicle producers did the same in products. Furthermore, in the fastest growing sector – theservices sector – the top 20 list from 1999 is very different than the top 20 list from 2009. This indicatesthat there is a healthy circulation of contractors in and out of the top positions by value of contractsawarded.
In terms of distribution of contract dollars according to the company size, it is clear that there wasa “squeezing” of mid-sized contractors from both large and small contractors. This is particularlynoticeable in spending on products, where medium-sized contractors lost their share in the market to bothlarge and small contractors. These data indicate a positive development, however, as it appears that thegovernment’s small business set-aside program is succeeding. Finally, taking into account the numbersfor R&D spending and the relatively static positions of top contractors within that industry, it appears thatthe same 4 large contractors dominated the R&D market for the last 10 years.

8/3/2019 110506 CSIS Defense Contract Trends-Sm2
http://slidepdf.com/reader/full/110506-csis-defense-contract-trends-sm2 37/38
36
About CSIS
At a time of new global opportunities and challenges, the Center for Strategic and International Studies(CSIS) provides strategic insights and policy solutions to decisionmakers in government, internationalinstitutions, the private sector, and civil society. A bipartisan, nonprofit organization headquartered inWashington, DC, CSIS conducts research and analysis and develops policy initiatives that look into the
future and anticipate change.
Founded by David M. Abshire and Admiral Arleigh Burke at the height of the Cold War, CSISwas dedicated to finding ways for America to sustain its prominence and prosperity as a force for good inthe world.
Since 1962, CSIS has grown to become one of the world’s preeminent international policyinstitutions, with more than 220 full-time staff and a large network of affiliated scholars focused ondefense and security, regional stability, and transnational challenges ranging from energy and climate toglobal development and economic integration.
Former U.S. senator Sam Nunn became chairman of the CSIS Board of Trustees in 1999, and
John J. Hamre has led CSIS as its president and chief executive officer since April 2000.
CSIS does not take specific policy positions; accordingly, all views expressed in this presentation should
be understood to be solely those of the author(s).

8/3/2019 110506 CSIS Defense Contract Trends-Sm2
http://slidepdf.com/reader/full/110506-csis-defense-contract-trends-sm2 38/38
1800 K Street NW | Washington, DC 20006
Tel: (202) 887-0200 | Fax: (202) 775-3199
E-mail: [email protected] | Web: www.csis.org