1102 …pwp.gatech.edu/jianjun-shi/wp-content/uploads/sites/216/2017/09/p... · 1102...
10
1102 IEEE TRANSACTIONS ON AUTOMATION SCIENCE AND ENGINEERING, VOL. 13, NO. 2, APRIL 2016 An Automatic Process Monitoring Method Using Recurrence Plot in Progressive Stamping Processes Cheng Zhou, Kaibo Liu, Member, IEEE, Xi Zhang, Member, IEEE, Weidong Zhang, and Jianjun Shi Abstract—In progressive stamping processes, condition moni- toring based on tonnage signals is of great practical significance. One typical fault in progressive stamping processes is a missing part in one of the die stations due to malfunction of part transfer in the press. One challenging question is how to detect the fault due to the missing part in certain die stations as such a fault often re- sults in die or press damage, but only provides a small change in the tonnage signals. To address this issue, this article proposes a novel automatic process monitoring method using the recurrence plot (RP) method. Along with the developed method, we also provide a detailed interpretation of the representative patterns in the recur- rence plot. Then, the corresponding relationship between the RPs and the tonnage signals under different process conditions is fully investigated. To differentiate the tonnage signals under normal and faulty conditions, we adopt the recurrence quantification analysis (RQA) to characterize the critical patterns in the RPs. A param- eter learning algorithm is developed to set up the appropriate pa- rameter of the RP method for progressive stamping processes. A real case study is provided to validate our approach, and the re- sults are compared with the existing literature to demonstrate the outperformance of this proposed monitoring method. Note to Practitioners—This paper is motivated by the challenge of monitoring tonnage signals in progressive stamping processes. By using the proposed monitoring approach, the missing part problem, which is one of the critical faults in progressive stamping processes, could be successfully addressed. To fully make use of this approach, it is necessary: 1) to automatically adjust and determine the appropriate parameters of the RP method for particular applications; 2) to understand the relationship between the tonnage signals and the recurrence plots under both normal and faulty conditions; and 3) to choose appropriate features to characterize the patterns in the recurrence plots for detection of condition change. A real case study shows that the proposed process monitoring scheme delivers a better performance than other methods in literature when detecting the process fault due to Manuscript received November 17, 2014; revised May 06, 2015; accepted July 30, 2015. Date of publication September 03, 2015; date of current version April 05, 2016. This paper was recommended for publication by Associate Ed- itor H. Hu and Editor J. Wen upon evaluation of the reviewers’ comments. This work was supported in part by the National Natural Science Foundation of China under Grant 61273205, Grant 71201002, and Grant 71471005, the National Sci- ence Foundationunder Grant CMMI-1362529 and Grant CMMI-1362876, and the State key Lab Open Grant under Grant DMET201210. (Corresponding au- thor: Xi Zhang.) C. Zhou and W. Zhang are with the National Center for Materials Service Safety, University of Science and Technology Beijing, Beijing 100083, China (e-mail: [email protected]; [email protected]). K. Liu is with the Department of Industrial and Systems Engineering, Uni- versity of Wisconsin-Madison, Madison, WI 53706 USA (e-mail: kliu8@wisc. edu). X. Zhang is with the Department of Industrial Engineering and Management, Peking University, Beijing 100871, China (e-mail: [email protected]). J. Shi is with the H. Milton Stewart School of Industrial and Systems En- gineering, Georgia Institute of Technology, Atlanta, GA 30332 USA (e-mail: [email protected]). Digital Object Identifier 10.1109/TASE.2015.2468058 missing part. It is worth mentioning that this proposed approach is not limited to progressive stamping processes, but also has a great potential for other fault detection problem by using repetitive and cyclic signals, especially when the fault only exhibits small-signal changes. Index Terms—Process monitoring, progressive stamping pro- cesses, recurrence plot (RP), tonnage signals. I. INTRODUCTION P ROGRESSIVE stamping processes have been widely used to produce parts and components in forming indus- tries due to their high productivity and high precision. In this process, a work piece is transferred from one die station to the next die station sequentially with an automatic feeding system. Multiple forming operations are simultaneously performed in the corresponding die stations by one stamping stroke [1]. Fig. 1 shows a progressive stamping process with five die sta- tions including preforming, blanking, initial forming, forming, and trimming. When a work piece passes through these five stations, each die station should have an intermediate work piece during each stroke. However, a missing part problem, which means that the work piece is not settled in the right die station but is conveyed to the downstream stations, may occur in this process [2]. Such a fault often leads to unfinished or nonconforming products and/or severe die damage. In general, this process can produce over 800 parts per minute, and it is nearly impossible and unrealistic to directly observe the ma- chine for process monitoring. Hence, seeking an efficient fault detection method is of great significance for production control and quality assurance in progressive stamping processes. A few sensors have been used for process monitoring and di- agnosis in literature. For example, research work has been re- ported to use the acceleration transducer for online monitoring of the stamping process [3]. However, the acceleration signals are usually affected by the noise disturbances and are very sen- sitive to many other factors, such as sensor mounting location, die geometric, work-piece material, and punch speed [4]. In ad- dition to the acceleration transducer, the press tonnage sensors, which are the strain gages mounted on the press uprights or link- ages, have also been widely installed in many stamping ma- chines. The setup and maintenance costs for the tonnage sen- sors are generally affordable, which promotes its wide adop- tion in practice. Moreover, the tonnage signal measured by the press tonnage sensor is the summation of the stamping forces, which contains rich process information of stamping operations. As a result, tonnage signals have been one of the most com- monly used measures for monitoring and diagnosis of stamping 1545-5955 © 2015 IEEE. Personal use is permitted, but republication/redistribution requires IEEE permission. See http://www.ieee.org/publications_standards/publications/rights/index.html for more information.
Transcript of 1102 …pwp.gatech.edu/jianjun-shi/wp-content/uploads/sites/216/2017/09/p... · 1102...

1102 IEEE TRANSACTIONS ON AUTOMATION SCIENCE AND ENGINEERING, VOL. 13, NO. 2, APRIL 2016
An Automatic Process Monitoring Method UsingRecurrence Plot in Progressive Stamping Processes
Cheng Zhou, Kaibo Liu, Member, IEEE, Xi Zhang, Member, IEEE, Weidong Zhang, and Jianjun Shi
Abstract—In progressive stamping processes, condition moni-toring based on tonnage signals is of great practical significance.One typical fault in progressive stamping processes is a missingpart in one of the die stations due to malfunction of part transferin the press. One challenging question is how to detect the fault dueto the missing part in certain die stations as such a fault often re-sults in die or press damage, but only provides a small change in thetonnage signals. To address this issue, this article proposes a novelautomatic process monitoring method using the recurrence plot(RP) method. Along with the developed method, we also provide adetailed interpretation of the representative patterns in the recur-rence plot. Then, the corresponding relationship between the RPsand the tonnage signals under different process conditions is fullyinvestigated. To differentiate the tonnage signals under normal andfaulty conditions, we adopt the recurrence quantification analysis(RQA) to characterize the critical patterns in the RPs. A param-eter learning algorithm is developed to set up the appropriate pa-rameter of the RP method for progressive stamping processes. Areal case study is provided to validate our approach, and the re-sults are compared with the existing literature to demonstrate theoutperformance of this proposed monitoring method.
Note to Practitioners—This paper is motivated by the challengeof monitoring tonnage signals in progressive stamping processes.By using the proposed monitoring approach, the missing partproblem, which is one of the critical faults in progressive stampingprocesses, could be successfully addressed. To fully make useof this approach, it is necessary: 1) to automatically adjust anddetermine the appropriate parameters of the RP method forparticular applications; 2) to understand the relationship betweenthe tonnage signals and the recurrence plots under both normaland faulty conditions; and 3) to choose appropriate features tocharacterize the patterns in the recurrence plots for detectionof condition change. A real case study shows that the proposedprocess monitoring scheme delivers a better performance thanother methods in literature when detecting the process fault due to
Manuscript received November 17, 2014; revised May 06, 2015; acceptedJuly 30, 2015. Date of publication September 03, 2015; date of current versionApril 05, 2016. This paper was recommended for publication by Associate Ed-itor H. Hu and Editor J. Wen upon evaluation of the reviewers’ comments. Thiswork was supported in part by the National Natural Science Foundation of Chinaunder Grant 61273205, Grant 71201002, and Grant 71471005, the National Sci-ence Foundationunder Grant CMMI-1362529 and Grant CMMI-1362876, andthe State key Lab Open Grant under Grant DMET201210. (Corresponding au-thor: Xi Zhang.)C. Zhou and W. Zhang are with the National Center for Materials Service
Safety, University of Science and Technology Beijing, Beijing 100083, China(e-mail: [email protected]; [email protected]).K. Liu is with the Department of Industrial and Systems Engineering, Uni-
versity of Wisconsin-Madison, Madison, WI 53706 USA (e-mail: [email protected]).X. Zhang is with the Department of Industrial Engineering and Management,
Peking University, Beijing 100871, China (e-mail: [email protected]).J. Shi is with the H. Milton Stewart School of Industrial and Systems En-
gineering, Georgia Institute of Technology, Atlanta, GA 30332 USA (e-mail:[email protected]).Digital Object Identifier 10.1109/TASE.2015.2468058
missing part. It is worth mentioning that this proposed approach isnot limited to progressive stamping processes, but also has a greatpotential for other fault detection problem by using repetitive andcyclic signals, especially when the fault only exhibits small-signalchanges.Index Terms—Process monitoring, progressive stamping pro-
cesses, recurrence plot (RP), tonnage signals.
I. INTRODUCTION
P ROGRESSIVE stamping processes have been widelyused to produce parts and components in forming indus-
tries due to their high productivity and high precision. In thisprocess, a work piece is transferred from one die station to thenext die station sequentially with an automatic feeding system.Multiple forming operations are simultaneously performedin the corresponding die stations by one stamping stroke [1].Fig. 1 shows a progressive stamping process with five die sta-tions including preforming, blanking, initial forming, forming,and trimming. When a work piece passes through these fivestations, each die station should have an intermediate workpiece during each stroke. However, a missing part problem,which means that the work piece is not settled in the right diestation but is conveyed to the downstream stations, may occurin this process [2]. Such a fault often leads to unfinished ornonconforming products and/or severe die damage. In general,this process can produce over 800 parts per minute, and it isnearly impossible and unrealistic to directly observe the ma-chine for process monitoring. Hence, seeking an efficient faultdetection method is of great significance for production controland quality assurance in progressive stamping processes.A few sensors have been used for process monitoring and di-
agnosis in literature. For example, research work has been re-ported to use the acceleration transducer for online monitoringof the stamping process [3]. However, the acceleration signalsare usually affected by the noise disturbances and are very sen-sitive to many other factors, such as sensor mounting location,die geometric, work-piece material, and punch speed [4]. In ad-dition to the acceleration transducer, the press tonnage sensors,which are the strain gages mounted on the press uprights or link-ages, have also been widely installed in many stamping ma-chines. The setup and maintenance costs for the tonnage sen-sors are generally affordable, which promotes its wide adop-tion in practice. Moreover, the tonnage signal measured by thepress tonnage sensor is the summation of the stamping forces,which contains rich process information of stamping operations.As a result, tonnage signals have been one of the most com-monly used measures for monitoring and diagnosis of stamping
1545-5955 © 2015 IEEE. Personal use is permitted, but republication/redistribution requires IEEE permission.See http://www.ieee.org/publications_standards/publications/rights/index.html for more information.

ZHOU et al.: AUTOMATIC PROCESS MONITORING METHOD USING RECURRENCE PLOT IN PROGRESSIVE STAMPING PROCESSES 1103
Fig. 1. Schematic procedure of a progressive stamping process.
processes [5]–[7]. For example, the local magnitude and fre-quency of the tonnage signal correspond to different formingoperations in each die station. When this process is in control,the tonnage signal should be repeatable between strokes, thoughsome inherent and random variation may exist due to materialheterogeneities, machine tolerances, and system dynamics. Ifsome fault occurs in certain die stations, the tonnage signal willchange, and some segments of the tonnage signal will deviatefrom their repeated patterns that are collected under the normalcondition. Thus, studying the tonnage signal provides an oppor-tunity for effective monitoring of stamping processes.Various efforts have been made in process monitoring and di-
agnosis for stamping processes. Examples include detecting ab-normal conditions caused by shut height change [8], in-die mis-match [9], thermal energy of the work piece [10], and dimensionchanges of feeding sheet metal [11]. Although these problemshave been well studied, all of these researches only focused onthe stamping process with a single die station. However, for pro-gressive stamping processes, the missing part problem poses amuch more challenging issue for fault detection due to the fol-lowing two reasons.1) In progressive stamping processes, the tonnage signal is
generally characterized by the stamping force in one strokeoperated simultaneously at all die stations. Thus, unlike theconventional stamping process with a single die station, itis almost impossible for us to clearly partition the tonnagesignal into separated segments by studying the physics ofthe processes, which only correspond to the specific oper-ation condition at each die station.
2) The fault due to missing part may occur in any die station.In some station, the fault due to missing part may onlycause a small change in the tonnage signal, while othersmay not. For example, Fig. 2(a) shows two groups of ton-nage signals collected under the normal condition and thefaulty condition in which the fault due to missing part oc-curs in the forming station. Fig. 2(b) shows one normal ton-nage signal present with a quite similar pattern that couldnot be easily distinguished from each other.
To detect the fault due to missing part in progressive stampingprocesses, much research work has been reported in the litera-
Fig. 2. Tonnage signals under the normal and abnormal (missing part fault oc-curs in the forming operation) conditions: (a) a group of tonnage signals underthese conditions and (b) one normal and one faulty tonnage signals under theseconditions.
ture. For example, Jin and Shi [1] combined experiment designtechniques and engineering domain knowledge to decomposethe original total tonnage signals to obtain tonnage signals cor-responding to individual stations without using in-die sensors.However, this study requires carefully designed experiments toacquire large amounts of data, and it is not convenient to beimplemented in practice. Lei et al. [2] proposed a feature selec-tion method through principle component analysis (PCA) andintegrated selected features into a hierarchical method for clas-sification of missing part problems at different operational diestations. This method successfully classified the faults due tomissing part occurring in four out of five individual die stations.However, one limitation of this method is that it fails to identifythe tonnage signals if the fault occurs in the forming station (seeFig. 2).In order to address this issue, this paper proposes a profile
monitoring approach via the recurrence plot (RP) method to de-tect the changes in tonnage signals caused by the fault due tothe missing part in the progressive stamping processes. The RPmethod has been recognized as one of the pervasive tools foranalysis of dynamic systems [12] and applied in many fields in-cluding physics and physiology [13], [14]. However, to the bestof our knowledge, few studies have been reported for processmonitoring in advanced manufacturing systems.It should be noticed that, though the stamping process is non-
stationary at one stroke operation and no clear recurrence existswithin a single piece of tonnage signal, signals collected from anumber of repeated cycles of operations under the same processcondition would have similar patterns. In this way, the stampingprocess can be considered as a stationary system with repeatedcycles of stroke operations and thus the RPmethod can be effec-tively employed here to characterize the unique signal patternscollected under a certain operation condition.

1104 IEEE TRANSACTIONS ON AUTOMATION SCIENCE AND ENGINEERING, VOL. 13, NO. 2, APRIL 2016
Fig. 3. Example of the transformation from an original tonnage signal into a RP plot. (a) Sample of tonnage signal. (b) RP plot of the tonnage signal.
The motivation for studying the RP method for monitoringof progressive stamping processes in this paper is summarizedhere.1) The RP method does not require assumptions of data dis-
tribution, signal length and signal stationarity [12]. As theprofiles of the tonnage signals do not satisfy the stationaryassumption, as shown in Fig. 2, this unique property of theRP method provides an advantage for analysis and moni-toring of progressive stamping processes.
2) The original signal can be transferred into a two-dimen-sional recurrence plot which provides a clear visualizationfor physical interpretation.
3) The RP method provides a one-to-one relationship be-tween recurrence plots and profile patterns of originaltonnage signals. Any details of changes in original signalswill be reflected at particular regions in recurrence plots.Such unique feature provides distinct interpretations andtime positioning of process faults.
The contribution of this paper can be summarized into threeaspects: 1) this is the first paper that leverages the RP methodto monitor progressive stamping processes, which provides abetter understanding of the relationship between the changes inoriginal signals and in recurrence plots; 2) this paper advancesthe state-of-the-art in detecting the small changes in progressivestamping processes, especially for themissing part problem; and3) in order to maximize the detection capability governed by theunderlying faulty condition, a self-learning parameter selectionalgorithm (SLPS) is developed to determine the appropriate pa-rameter values involved in the RP method.This paper is organized as follows. An introduction of the RP
method and interpretations of basic recurrence plot patterns aregiven in Section II. In Section III, a systematic monitoring pro-cedure using the RP method for change detection is proposed.The relationship between recurrence plots and original tonnagesignals is investigated and the SLPS algorithm is developed.Section IV provides a real case study of progressive stampingprocesses to demonstrate the efficacy of the RP method and theefficiency of our proposed method, and further compares the re-sults with existing literature. Finally, Section V provides a con-clusion and a discussion of future research directions.
II. REVIEW OF THE RP METHOD
A. A Brief Introduction of Recurrence PlotGenerally, the RP method, first proposed by Eckmann et al.
[15], is an approach for characterization of the nonlinear profilescollected from dynamic systems by transforming these profilesinto two-dimensional (2-D) matrices. To define the RP method,
let be a one-dimensional (1-D) signal ob-served in a dynamic system with a time index . A series of-dimensional vectors can be constructed from this signalas
(1)
where and are called the embedding dimension and the timedelay, respectively, and . The vector
represents the signal trajectories in a -dimensionalspace. A 2-D matrix can be formed by differencing all vectors
with each other as represented in the following equation:
(2)
where is a threshold parameter and is an indicator func-tion that when and when .is defined as the element on the th row and the th column of thematrix . Here, the matrix is called the RP matrix. If the dis-tance between and is equal or shorter than the threshold, then ; otherwise . Hence, the RP matrixcan be visualized as a binary image only coded in 0 and 1. Inorder to avoid ambiguity between the RP method and the imageformed by the RP matrix, we call this image the “RP plot” inthis paper. Fig. 3 shows an example using the RP method. Thetonnage signal in Fig. 3(a) can be considered as in (1), andthe RP matrix can be derived from the tonnage signal with pa-rameters and . The RP plot in Fig. 3(b) is abinary image of the RP matrix.
B. Interpretations of RP Plot PatternsIn this subsection, we focus on interpreting the patterns in the
RP plot and then introducing some critical features to quantifythese patterns. Generally, the texture of the RP plot could beclassified into single points, diagonal lines, vertical lines andhorizontal lines [12]. In a recurrence plot matrix, since
, the patterns in the RP plot aresymmetric across the main diagonal line. Thus, the horizontallines carry the same message as the vertical lines. The textureof the RP plot could be interpreted as follows.1) A single point in a RP plot can be expressed as
and all neighboring points are. This indicates that the
distance between vectors and is less than whereasthe distance between vectors and , or and
, or and is larger than . In other words, theoriginal signal at time index or starts with a suddenjump which causes a single dot in the RP. In practice, a RP

ZHOU et al.: AUTOMATIC PROCESS MONITORING METHOD USING RECURRENCE PLOT IN PROGRESSIVE STAMPING PROCESSES 1105
Fig. 4. Diagram interpreting the relationship between the original signal and the RP plot.
TABLE IFEATURES EXTRACTED FROM THE RP PLOT BY THE RQA
plot will contain many individual points if there is a largeamount of process noise existing in the original signal.
2) The diagonal lines are the ones in a RP plot which areparallel to the main diagonal line. We denote an originalsignal as and two signal segments within this signal as
and . Then, the diagonal line can be expressed as, where and
are -dimensional vectors constructed from andrepresents the length of the diagonal line. There-
fore, a diagonal line exists if the distance between vec-tors and is always shorter than , i.e., thevectors and are nearly parallel in the -di-mensional space. In such case, we can conclude that theoriginal signal segments and exhibit similar dy-namical evolution and thus considered as recurrent pat-terns. Fig. 4 shows a segment of a tonnage signal to explainthe relationship between the tonnage signal and the corre-sponding RP plot with and . Thesub-segment highlighted by a dashed circle in the originalsignal [Fig. 4(a)]exhibits a recurrent pattern, which reflectsas diagonal lines highlighted by a dashed circle in the RPplot [Fig. 4(c)].
3) The horizontal lines (or the vertical lines as they are sym-metric) in a RP plot can be expressed as
, where ,and represents the length of the horizontal line. There-fore, a horizontal line exists if the distance between vectors
and is always shorter than , i.e., the vectorsstays close to the vector in the -dimensional space.This means that the signal within the segment
displays a small change from the signal value at time . Asshown in Fig. 4, the subsegments highlighted in a dashedrectangle in the original signal [Fig. 4(a)] change slowly.Consequently, we can observe that the RP plot in the corre-sponding areas contain a lot of horizontal lines or verticallines [Fig. 4(c)].
According to the above discussions, the RP plot can be con-sidered as a combination of four different features: the singlepoint, the diagonal line, the vertical line, and the horizontalline. In the light of the explanation of the RP plot's texture, re-currence quantification analysis (RQA) has been developed toquantify RP plot patterns. Webber and Zbilut [16] proposed aset of quantitative features such as recurrence rate (RR), deter-minism (DET), and entropy (ENT) based on the single pointsand the diagonal lines. Marwan et al. [17] further proposed ana-lytic features such as laminarity (LAM) and trapping time (TT)based on the vertical lines. Table I summarizes the definitionsof these features.It can be seen that the feature RR refers to the density of the
black dots in the RP plot. The feature DET measures the fre-quency distributions of diagonal lines with different lengths inthe RP plot. Processes with stochastic behavior cause none orvery short diagonal lines, while deterministic processes causelonger diagonal lines in the RP plot [12]. ENT is referred to theShannon entropy of the diagonal lines with the probability ,and it reflects the complexity of the RP plot in respect of the di-agonal lines. The feature LAM measures the amount of verticalstructures and the occurrence of vertical lines in the RP plot.The vertical lines have the same interpretation as the horizontallines which are caused by the slow changes from a certain signal

1106 IEEE TRANSACTIONS ON AUTOMATION SCIENCE AND ENGINEERING, VOL. 13, NO. 2, APRIL 2016
Fig. 5. Framework of the monitoring scheme for progressive stamping processes.
value in the original signal. The feature TT calculates the av-erage length of the vertical lines which are longer than , andit represents the average length of the vertical lines in RP plots[12]. The progressive stamping process can be considered as adynamic system and the tonnage signals contain non-stationarybehaviors of the physical processes. Fig. 4(b) shows a trajec-tory of the tonnage signal segment of Fig. 4(a) in a three-di-mensional (3-D) space. According to the interpretations of dy-namic system characteristics in [18], the trajectories should beinvariant under normal condition and will vary if the physicalprocess has been changed. Therefore, these above-mentionedRP features of normal tonnage signals are consistent and wouldbe changed under faulty conditions.
III. MONITORING SCHEME OF PROGRESSIVESTAMPING PROCESSES
Here, we develop an automatic process monitoring schemevia the RP method in progressive stamping processes.Fig. 5 shows the framework of the process monitoring scheme.First, we determine the appropriate parameter settings in theRP method. An SLPS algorithm is proposed to derive the keyparameter based on the observed tonnage signals. Second,informative features that differentiate RP plots of normal andabnormal tonnage signals are selected. Interpretations of theone-to-one relationship between the original tonnage signaland the corresponding RP plot will be provided. Finally, weimplement the support vector machine (SVM) classificationtechnique based on the extracted features to identify criticalfaulty conditions due to missing part. Since SVM techniqueshave been reported in much literature, we will specifically focuson the discussions of parameter settings and the interpretationsbetween RP plots and original tonnage signals in this section.
A. Strategy for Determining RP ParametersTo implement the RPmethod, three parameters need to be de-
termined which are embedding dimension , time delay andthreshold . Existing research studies have well explored how toset the parameters and . Specifically, one common approachis to use the false nearest neighbor (FNN) algorithm [19] and
mutual information method [20] to obtain these two parameters,respectively. Many studies have shown that such approachesachieved good results [12]–[14]. Hence, for these two param-eters, we generally followed the existing well-known methodsto estimate their values. The parameter threshold is a crucialtuning parameter here, whose value determines the texture ofthe RP plot. Generally speaking, if the threshold is set to bea large value, there will be a mass of black dots shown in theRP plot which may mask critical information in original sig-nals and thus deteriorate the process monitoring performance.On the contrary, if the threshold is chosen to be a small value,less useful information will be preserved in the RP plot and thusthe effectiveness of fault detection can be potentially degraded.Several attempts have been reported in the literature to deter-mine the threshold . For example, Zbilut andWebber suggestedthat this threshold should be less than 10% of the maximumphase space trajectories diameter [21]. Later, Zbilut et al. [22]advised to calculate the threshold to keep the RR value approx-imately to be 1%. Thiel et al. [23] proposed that the thresholdshould be larger than the standard variation of the observationalnoise by five times. However, those problem specific methodsare based on the ad hoc rules, and fail for analysis of the signalswith very low signal-to-noise ratio (SNR). Eroglu et al. [24]developed a novel method to choose a critical point as thevalue for the threshold to ensure that the components of recur-rence network are connected. However, this approach only findsthe smallest possible threshold in a conservative way and thusit may not be effectively used here to satisfy the detection re-quirement in progressive stamping applications. Schinkel et al.[25] explored the relationship between the threshold and eachRQA measure, and compared the area under the curve (AUC)in receiver operating characteristic (ROC) curve of each RQAmeasure. However, this method focuses on separating the noisesfrom a deterministic signal. Thus, it is not suitable to be usedhere for process monitoring and fault detection.In this paper, the SLPS is proposed to appropriately determine
the threshold based on the observed data collected in progres-sive stamping processes. The main idea of the SLPS algorithmis to choose the threshold to maximize the differences between

ZHOU et al.: AUTOMATIC PROCESS MONITORING METHOD USING RECURRENCE PLOT IN PROGRESSIVE STAMPING PROCESSES 1107
normal and faulty tonnage signals. The detailed procedures ofthe SLPS algorithm are as follows.1) Determine the appropriate range of the threshold . First,
we obtain a group of in-control signals and denotethe th in-control signal as .According to the definition in (1), the -dimen-sional vectors for the th sample are
. Likewise, from (2),the element on the th row and the th column of therecurrence matrix for the th sample is
, where . Thus,if for any and any ,then all elements in will be equal to “1”. Sim-ilarly, if , then all ele-ments in will be “0”. Thus, we can set the range
of the parameter to be ,in which and
.2) Discretize the range by introducing an incremental pa-
rameter . Two issueshere need to be solved: determination of the values of:1) the increment and 2) the upper boundary of .Specifically, we choose the increment as the nonzerosmallest distance between and , i.e.,
. For the upper boundaryof , we can set its value as and
. Here,is defined to be the largest integer that is strictly
smaller than3) Obtain a group of historical sample data that include both
normal and faulty signals. Assume these data have beencorrectly labeled off-line (i.e., normal or faulty sample).Let equal the th element of the set . We will im-plement the -fold cross-validation method, in whichthe original dataset is randomly partitioned into equalsize subgroups, to determine the appropriate setting of theparameter . Specifically, in the th fold, we first extractfeatures from the RP plots based on the subgroupdata. Then, an SVM classifier is trained and the detectionrate is calculated based on the remaining subgroup (alsoreferred as the validation data) in the current fold:
. The final detection performance corre-sponding to the current value of is expressed as
.4) Determine the minimum detection rate based on the
detection requirement in the real application. Then, searchthe appropriate value of parameter , starting from
. If , then the parameter is set to be equal to, i.e., . Otherwise, we try the next element in the
set and calculate the new detection rate . The processwill not be terminated until . If for all ,we simply choose as the value of theparameter .
Fig. 6 shows the flow chart of the SLPS algorithm. Thismethod can be used to determine the threshold in otherapplications as well.
Fig. 6. Flowchart of the SLPS algorithm.
B. Relationship Between RP Plots and Faulty Tonnage SignalsA progressive stamping process that consists of five die
stations is studied in this paper. These five stations correspondto five individual operations: pre-forming, blanking, initialforming, forming, and trimming. The fault due to missing partmay occur in any die station. As a demonstration, we willfocus on the faults that occur in the die stations pre-formingand forming in this section. According to the literature, thefaults that occur in the die stations preforming, blanking, initialforming and trimming can be well detected [2]; however, thefault that occurs in the forming station poses critical challengesfor detection. Thus, in this subsection, we consider one ofthe faulty conditions (e.g., pre-forming) that have been wellstudied in the literature and also the faulty condition that occursin the forming station which has not been well solved. In theprogressive stamping process as shown in Fig. 1, the operationtime periods of the die station corresponding to pre-formingand forming are segments and .According to the signal segmentation method in Jin and Shi [1],the relationship between the tonnage signal and the operationsin each die station was well studied and the signal segmentationmethod has been validated by using a real industry example.Thus, the errors from the signal segmentation are negligibleand can be ignored here. We will provide our interpretationsbased on these two segments, respectively.1) Die Station “Pre-forming” With the Missing Part
Problem: Fig. 7(a) and (b) shows examples of the normal ton-nage signal and the faulty tonnage signal on segment whenthe fault due to missing part occurs in the pre-forming station.The corresponding RP plots are presented in Fig. 7(c) and (d),respectively. For better illustration of the relationships be-tween original signals and RP plots, we define the subregion[ ] in RP plots, where anddenote the ranges of this sub-region on the horizontal and thevertical axes, respectively. Recall that the RP plot is symmetricto its main diagonal line, and thus the patterns of the subregions
and are exactly same. As

1108 IEEE TRANSACTIONS ON AUTOMATION SCIENCE AND ENGINEERING, VOL. 13, NO. 2, APRIL 2016
Fig. 7. Tonnage signals and corresponding RP plots under the normal and faulty conditions in the pre-forming station. (a) Normal signal. (b) Faulty signal. (c)RP of normal signal. (d) RP of faulty signal.
Fig. 8. Tonnage signals and corresponding RP plots under the normal and faulty conditions in the forming station. (a) Normal signal, (b) Faulty signal, (c) RP ofnormal signal, (d) RP of faulty signal.
a result, we only focus on the former one in the followingdiscussion.It is apparent to see that the largest differences between RP
plots in Fig. 7(c) and (d) appear in the subregion [70, 200; 70,200] (the area highlighted by the dashed rectangle). The RP plotunder the normal condition [Fig. 7(c)]in this subregion [70, 200;70, 200] contains a large number of diagonal lines. According tothe interpretation of the diagonal line in Section II-B, it indicatesthat the normal tonnage signal contains several cyclic patterns.This is confirmed in Fig. 7(a) that the normal tonnage signalin the segment [70, 200] does exhibit several cyclic sinusoidalpatterns with a similar oscillation amplitude and frequency. Onthe contrary, in Fig. 7(d), the RP plot of the faulty condition inthe sub-region [70, 200; 70, 200] is mainly composed of hor-izontal lines and vertical lines. This means that the faulty ton-nage signal contains a slowly increasing or decreasing trend inthe corresponding time period according to the interpretationsin Section II-B. As shown in Fig. 7(b), the faulty tonnage signalhas a slow decreasing trend in the segment [50,120] and has norepeated patterns in the segment [70, 200].There are some other differences in Fig. 7(c) and (d), such
as the patterns in the subregion [240, 260; 70, 200] (the areahighlighted by the solid line rectangle). The RP plot in the faultycondition in this subregion does not contain any dot as shown inFig. 7(d). The reason here is that the amplitudes and frequenciesof the faulty tonnage signal in the segments [240, 260] and [70,200] are quite different in Fig. 7(b). On the contrary, the RP plot
in normal condition contains many horizontal lines and diagonallines in this sub-region as shown in Fig. 7(c). This is becausethat the tonnage signal in the segment [240, 260] does show asimilar pattern (i.e., slowly oscillating pattern) as the tonnagesignal in the segment [70, 200] in Fig. 7(a).In general, the RP plot under the normal condition contains
more diagonal lines than the faulty condition, while the lattercontains much more vertical lines and horizontal lines than theformer one. Based on the above illustrations and interpretations,we can see that critical features including diagonal lines and hor-izontal lines can be used to differentiate the normal and faultytonnage signals. Thus, RQA method is adopted here to extractthese useful features. Particularly, the recurrence rate (RR) mea-sures the density of the points. The determinism (DET) and theentropy (ENT) measure the discrepancies of the diagonal linesbetween different RP plots while DET specifically measures theoccurrence of the diagonal lines and the ENTmeasures the vari-ability in the lengths of the diagonal lines. Similarly to DET,the laminarity (LAM) and the trapping time (TT) measure thediscrepancies of the vertical lines and the horizontal lines be-tween different RP plots while LAM specifically measures theoccurrence of the vertical lines and TT measures the differenceof the length of vertical lines. (see the detailed interpretation inSection II-B).2) Die Station “Forming” With the Missing Part Problem:
Fig. 8(a) and (b) showsexamples of normal tonnage signal versusfaulty tonnage signal on the segment when the fault due to

ZHOU et al.: AUTOMATIC PROCESS MONITORING METHOD USING RECURRENCE PLOT IN PROGRESSIVE STAMPING PROCESSES 1109
missing part occurs in the forming station.The correspondingRPplots are presented in Fig. 8(c) and (d), respectively. Though thenormal tonnage signal and the faulty tonnage signal are almostsame, the RP plot in the normal condition [see Fig. 8(c)]in thesubregion [245, 260; 210, 220] (highlighted by the dashed rec-tangle) only contains fewdotswhile theRP plot in the faulty con-dition [see Fig. 8(d)] in this subregion contains a lot of diagonallines. This is because the normal tonnage signal in Fig. 8(a) hasno recurrent pattern [see the area highlighted by the rectangle inFig. 8(a)] while the faulty tonnage signal contains an oscillationpattern in the segment [245, 260], which has an approximate fre-quency and amplitude as the segment [210, 220] [see the areahighlighted by the rectangle in Fig. 8(b)]. Similarly, we can usethe RQA method to extract these useful features to differentiatethe normal and faulty tonnage signals.
IV. CASE STUDYAs introduced in Section I, the progressive stamping process
in our real industrial case study contains five individual die sta-tions, which are preforming, blanking, initial forming, formingand trimming, respectively. It should be noted that the fault dueto missing part may occur in any die station. In this case, wecompare the performance of our proposed method with Lei'smethod [2] when detecting the faults due to missing part oc-curring in all five die stations, and discuss more on the formingstation which could not be well solved by Lei's method.
A. Description of the DatasetSix groups of tonnage signals are collected under the normal
condition and the faulty condition and used in this case study.Five groups under faulty condition are referred as Type 1, Type2, Type 3, Type 4, and Type 5, respectively. Each group contains69 samples which are collected under the faults due to missingpart occurring in these five operations respectively. The groupunder normal condition is referred to as “Good” and contains157 samples. The tonnage signals are collected with a high-pre-cision encoder and each tonnage signal recorded at each cyclehas the same starting state.
B. RP Analysis and Feature ExtractionAccording to the analysis in Jin and Shi [1], segments
and for Type 1, Type 2, Type 3, Type 4, andType 5 are acquired, respectively. Hence, the RQA featuresof all groups are derived from each signal segment and the fea-ture sets can then be obtained. In eachfeature set , it involves the RQA measurescalculated from all types of faulty and normal tonnage signals.Here, we adopt the FNN algorithm and the mutual informa-
tion method to determine the embedding dimension andthe time delay based on the normal signals. The thresholdis trained by using our proposed SLPS algorithm based on both
the normal signals and the faulty signals that belong to each spe-cific faulty type. As a result, the RP plot effectively characterizesthe various signal patterns with different parameter settings.In this case study, the threshold parameter are
and for Type 1, Type 2, Type 3, Type 4, andType 5 faulty groups, respectively.
Fig. 9. Boxplot of the RQA features of tonnage signals in ‘Type 4’ and ‘Good’groups.
Fig. 10. PC features of tonnage signals in Type 4 and Good groups extractedby Lei's method [2].
According to the studies in Lei et al. [2], the fault due tomissing part occurring in forming station is difficult to detectbecause it generates the similar tonnage profile as that in thenormal condition shown in Fig. 2. This is one of the most chal-lenging tasks for process monitoring and fault detection, whichcould not be well solved in the existing literature. Hence, weprovide more details on detecting this fault of classifying theType 4 and Good group to highlight the outperformance of ourproposed method.Fig. 9 shows the boxplots of the RQA features extracted from
the Type 4 and Good groups, and Fig. 10 shows principal com-ponent (PC) features of the tonnage signals extracted from thesame signal sets with the minimum probability of misclassifica-tion in Lei's method [2]. We can see that several features such asRR, ENT and TT, are more informative to distinguish the ton-nage signals of the Type 4 group from the tonnage signals of theGood group, whereas the features in Fig. 10 fail to characterizethe tonnage signals in Type 4 and Good groups.
1110 IEEE TRANSACTIONS ON AUTOMATION SCIENCE AND ENGINEERING, VOL. 13, NO. 2, APRIL 2016
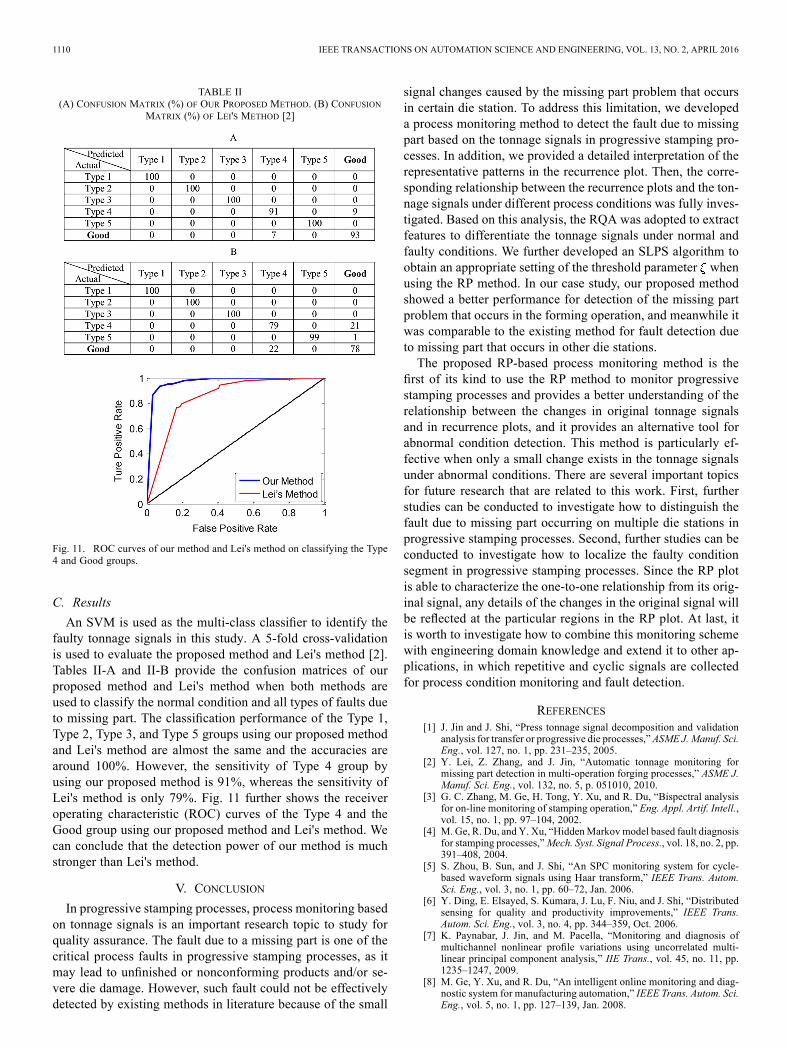
TABLE II(A) CONFUSION MATRIX (%) OF OUR PROPOSED METHOD. (B) CONFUSION
MATRIX (%) OF LEI'S METHOD [2]
Fig. 11. ROC curves of our method and Lei's method on classifying the Type4 and Good groups.
C. ResultsAn SVM is used as the multi-class classifier to identify the
faulty tonnage signals in this study. A 5-fold cross-validationis used to evaluate the proposed method and Lei's method [2].Tables II-A and II-B provide the confusion matrices of ourproposed method and Lei's method when both methods areused to classify the normal condition and all types of faults dueto missing part. The classification performance of the Type 1,Type 2, Type 3, and Type 5 groups using our proposed methodand Lei's method are almost the same and the accuracies arearound 100%. However, the sensitivity of Type 4 group byusing our proposed method is 91%, whereas the sensitivity ofLei's method is only 79%. Fig. 11 further shows the receiveroperating characteristic (ROC) curves of the Type 4 and theGood group using our proposed method and Lei's method. Wecan conclude that the detection power of our method is muchstronger than Lei's method.
V. CONCLUSIONIn progressive stamping processes, process monitoring based
on tonnage signals is an important research topic to study forquality assurance. The fault due to a missing part is one of thecritical process faults in progressive stamping processes, as itmay lead to unfinished or nonconforming products and/or se-vere die damage. However, such fault could not be effectivelydetected by existing methods in literature because of the small
signal changes caused by the missing part problem that occursin certain die station. To address this limitation, we developeda process monitoring method to detect the fault due to missingpart based on the tonnage signals in progressive stamping pro-cesses. In addition, we provided a detailed interpretation of therepresentative patterns in the recurrence plot. Then, the corre-sponding relationship between the recurrence plots and the ton-nage signals under different process conditions was fully inves-tigated. Based on this analysis, the RQA was adopted to extractfeatures to differentiate the tonnage signals under normal andfaulty conditions. We further developed an SLPS algorithm toobtain an appropriate setting of the threshold parameter whenusing the RP method. In our case study, our proposed methodshowed a better performance for detection of the missing partproblem that occurs in the forming operation, and meanwhile itwas comparable to the existing method for fault detection dueto missing part that occurs in other die stations.The proposed RP-based process monitoring method is the
first of its kind to use the RP method to monitor progressivestamping processes and provides a better understanding of therelationship between the changes in original tonnage signalsand in recurrence plots, and it provides an alternative tool forabnormal condition detection. This method is particularly ef-fective when only a small change exists in the tonnage signalsunder abnormal conditions. There are several important topicsfor future research that are related to this work. First, furtherstudies can be conducted to investigate how to distinguish thefault due to missing part occurring on multiple die stations inprogressive stamping processes. Second, further studies can beconducted to investigate how to localize the faulty conditionsegment in progressive stamping processes. Since the RP plotis able to characterize the one-to-one relationship from its orig-inal signal, any details of the changes in the original signal willbe reflected at the particular regions in the RP plot. At last, itis worth to investigate how to combine this monitoring schemewith engineering domain knowledge and extend it to other ap-plications, in which repetitive and cyclic signals are collectedfor process condition monitoring and fault detection.
REFERENCES[1] J. Jin and J. Shi, “Press tonnage signal decomposition and validation
analysis for transfer or progressive die processes,”ASME J. Manuf. Sci.Eng., vol. 127, no. 1, pp. 231–235, 2005.
[2] Y. Lei, Z. Zhang, and J. Jin, “Automatic tonnage monitoring formissing part detection in multi-operation forging processes,” ASME J.Manuf. Sci. Eng., vol. 132, no. 5, p. 051010, 2010.
[3] G. C. Zhang, M. Ge, H. Tong, Y. Xu, and R. Du, “Bispectral analysisfor on-line monitoring of stamping operation,” Eng. Appl. Artif. Intell.,vol. 15, no. 1, pp. 97–104, 2002.
[4] M. Ge, R. Du, and Y. Xu, “HiddenMarkov model based fault diagnosisfor stamping processes,”Mech. Syst. Signal Process., vol. 18, no. 2, pp.391–408, 2004.
[5] S. Zhou, B. Sun, and J. Shi, “An SPC monitoring system for cycle-based waveform signals using Haar transform,” IEEE Trans. Autom.Sci. Eng., vol. 3, no. 1, pp. 60–72, Jan. 2006.
[6] Y. Ding, E. Elsayed, S. Kumara, J. Lu, F. Niu, and J. Shi, “Distributedsensing for quality and productivity improvements,” IEEE Trans.Autom. Sci. Eng., vol. 3, no. 4, pp. 344–359, Oct. 2006.
[7] K. Paynabar, J. Jin, and M. Pacella, “Monitoring and diagnosis ofmultichannel nonlinear profile variations using uncorrelated multi-linear principal component analysis,” IIE Trans., vol. 45, no. 11, pp.1235–1247, 2009.
[8] M. Ge, Y. Xu, and R. Du, “An intelligent online monitoring and diag-nostic system for manufacturing automation,” IEEE Trans. Autom. Sci.Eng., vol. 5, no. 1, pp. 127–139, Jan. 2008.

ZHOU et al.: AUTOMATIC PROCESS MONITORING METHOD USING RECURRENCE PLOT IN PROGRESSIVE STAMPING PROCESSES 1111
[9] C. K. H. Koh, J. Shi, W. Williams, and J. Ni, “Multiple fault detectionand isolationusing theHaar transform—Part II:Application to stampingprocess,”ASME J.Manuf. Sci. Eng., vol. 121, no. 2, pp. 295–299, 1999.
[10] Y. Harry, M. Yu, Y. Huang, and R. Du, “Diagnosis of sheet metalstamping processes based on 3-D thermal energy distribution,” IEEETrans. Autom. Sci. Eng., vol. 4, no. 1, pp. 22–30, Jan. 2007.
[11] J. Jin and J. Shi, “Diagnostic feature extraction from stamping tonnagesignals based on design of experiments,” ASME J. Manuf. Sci. Eng.,vol. 122, no. 2, pp. 360–369, 2000.
[12] N. Marwan, M. C. Romano, M. Thiel, and J. Kurths, “Recurrence plotsfor the analysis of complex systems,” Phys. Rep., vol. 438, no. 5, pp.237–329, 2007.
[13] V. Mitra, A. Sarma, M. S. Janaki, A. N. Iyenger, B. Sarma, N. Marwan,J. Kurths, P. K. Shaw, D. Saha, and S. Ghosh, “Order to chaos transitionstudies in a DC glow discharge plasma by using recurrence quantifica-tion analysis,” Chaos, Soliton. Fract., vol. 69, pp. 285–293, 2014.
[14] H. Yang and Y. Chen, “Heterogeneous recurrence monitoring and con-trol of nonlinear stochastic processes,” Chaos, vol. 24, no. 1, Art. ID013138.
[15] J. P. Eckmann, S. O. Kamphorst, and D. Ruelle, “Recurrence plots ofdynamical systems,” Europhys. Lett., vol. 4, no. 9, pp. 973–977, 1987.
[16] C. L. Webber and J. P. Zbilut, “Dynamical assessment of physiologicalsystems and states using recurrence plot strategies,” J. Appl. Physiol.,vol. 76, no. 2, pp. 965–973, 1994.
[17] N. Marwan, N. Wessel, U. Meyerfeldt, A. Schirdewan, and J. Kurths,“Recurrence-plot-based measures of complexity and their applicationto heart-rate-variability data,” Phys. Rev. E, vol. 66, no. 2, 2002, Art.ID 026702.
[18] C. Cheng, A. Sa-Ngasoongsong, O. Beyca, T. Le, H. Yang, Z. Kong,and S. Bukkapatnam, “Time series forecasting for nonlinear and non-stationary processes: A review and comparative study,” IIE Trans., vol.47, no. 10, pp. 1053–1071, 2015.
[19] H. Kantz and T. Schreiber, Nonlinear Time Series Analysis. Cam-bridge, U.K.: Cambridge Univ., 2004.
[20] A. M. Fraser and H. L. Swinney, “Independent coordinates for strangeattractors from mutual information,” Phys. Rev. A, vol. 33, no. 2, pp.1134–1140, 1986.
[21] J. P. Zbilut and C. L. Webber, “Embeddings and delays as derived fromquantification of recurrence plots,” Phys. Lett. A, vol. 171, no. 3, pp.199–203, 1992.
[22] J. P. Zbilut, J. Zaldivar-Comenges, and F. Strozzi, “Recurrence quan-tification based Liapunov exponents for monitoring divergence in ex-perimental data,” Phys. Lett. A, vol. 297, no. 3, pp. 173–181, 2002.
[23] M. Thiel, M. C. Romano, J. Kurths, R. Meucci, E. Allaria, and F. T.Arecchi, “Influence of observational noise on the recurrence quantifi-cation analysis,” Phys. D, vol. 171, no. 3, pp. 138–152, 2002.
[24] D. Eroglu, N. Marwan, S. Prasad, and J. Kurths, “Finding recurrencenetworks' threshold adaptively for a specific time series,” Nonlin. Pro-cesses Geophys., vol. 21, pp. 1085–1092, 2014.
[25] S. Schinkel, O. Dimigen, and N. Marwan, “Selection of recurrencethreshold for signal detection,” Eur. Phys. J. Special Topics, vol. 164,no. 1, pp. 45–53, 2008.
Cheng Zhou received the B.S. degree in automaticcontrol from the University of Science and Tech-nology Beijing, Beijing, China, in 2009, where heis currently working toward the Ph.D. degree at theNational Center for Materials Service Safety.His research interests are focused on process mon-
itoring, diagnosis and nonlinear profile analysis.
Kaibo Liu (M’14) received the B.S. degree in in-dustrial engineering from the Hong Kong Universityof Science and Technology, Hong Kong, in 2009,and the M.S. degree in statistics and Ph.D. degree inindustrial engineering from the Georgia Institute ofTechnology, Atlanta, GA, USA, in 2011 and 2013,respectively.Currently, he is an Assistant Professor with the
Department of Industrial and Systems Engineering,University of Wisconsin-Madison, Madison, WI,USA. His research interests are data fusion for
process modeling, monitoring, diagnosis and prognostics.Dr. Liu is a member of INFORMS, IIE, and ASQ.
Xi Zhang (M’15) received the B.S. degree in me-chanical engineering and automation from ShanghaiJiaotong University, Shanghai, China, in 2006, andthe Ph.D. degree in industrial engineering from theUniversity of South Florida, Tampa, FL, USA, 2010.Currently, he is an Assistant Professor with the De-
partment of Industrial Engineering andManagement,Peking University, Beijing, China. His research inter-ests are focused on physical-statistical modeling andanalysis for monitoring and diagnosis in complex dy-namic systems.
Dr. Zhang is a member of INFORMS, IIE, and ASQ.
Weidong Zhang received the B.S. degree in indus-trial electric automation specialty and Ph.D. degree incontrol science and engineering from the Universityof Science and Technology Beijing, Beijing, China,in 1996 and 2002, respectively.Currently, he is a Professor with the National
Center for Materials Service Safety, University ofScience and Technology Beijing, Beijing, China.His research interests are focused on complex man-ufacturing system modeling and analysis, design ofelectric vehicle, data fusion and system evaluation.
Dr. Zhang is a member of INFORMS and TMS.
Jianjun Shi received the B.S. and M.S. degrees inelectrical engineering from the Beijing Institute ofTechnology, Beijing, China, in 1984 and 1987, re-spectively, and the Ph.D. degree in mechanical engi-neering from the University of Michigan, Ann Arbor,MI, USA, in 1992.Currently, he is the Carolyn J. Stewart Chair Pro-
fessor with the H.Milton Stewart School of Industrialand Systems Engineering, Georgia Institute of Tech-nology, Atlanta, GA, USA. His research interests in-clude the fusion of advanced statistical and domain
knowledge to develop methodologies for modeling, monitoring, diagnosis, andcontrol for complex manufacturing systems.Dr. Shi is a Fellow of the IIE , ASME, and INFORMS, an academician of
the International Academy for Quality, an elected member of the ISI, and a LifeMember of ASA.