11 Years of Evapotranspiration Cover Performance at the … · 11 Years of Evapotranspiration Cover...
11
TECHNICAL ARTICLE 11 Years of Evapotranspiration Cover Performance at the AA Leach Pad at Barrick Goldstrike Mines Guosheng Zhan • Jason Keller • Mike Milczarek • Joe Giraudo Received: 13 July 2013 / Accepted: 5 March 2014 / Published online: 11 April 2014 Ó Springer-Verlag Berlin Heidelberg 2014 Abstract The AA Leach Pad at Barrick Goldstrike Mine was reclaimed using an evapotranspiration (ET) cover designed to limit the infiltration of precipitation into the facility. Water content and matric potential sensor stations were installed in the cover and underlying leach material after cover system placement. Monitoring of the sensor nests continued for 11 years. Data indicates that the cover is performing well, limiting net percolation to less than 1 % of annual precipitation. The AA Leach Pad is the first large-scale closed mine waste facility that has been robustly monitored for a relatively long time in Nevada, USA. The results provide an understanding of ET cover system performance for closure of mine waste facilities and offer guidance for ET cover system requirements in other arid regions. Keywords Store-and-release cover Á Leach pad Á Mine closure Introduction The Barrick Goldstrike Mines Inc. (BGMI), located 60 km northwest of Elko in north-central Nevada, is a large open pit and underground gold mining operation. The AA Leach Pad (AA Pad) at BGMI operated from 1987 through 1999, at which time it comprised 55 million metric tons (t) of run-of-mine leached ore. The facility covers approximately 100 ha and has a maximum height of approximately 90 m. The AA Pad was reclaimed in 2000/2001 using a monolayer evapotranspiration (ET) cover to reduce net percolation, limit erosion, and support a robust plant community. The AA Pad ET cover design relies on a 1.2 m thick fine-textured cover material layer overlying coarse leached ore material. The cover layer stores water during the wetter winter and spring months until the plant growing period (summer and fall), depletes the soil moisture via ET by the following fall. Cover systems evolve over time as the cover material develops in response to processes such as freeze/thaw cycles and plant root propagation and decay, which result in a decrease in soil bulk density and possibly the devel- opment of soil macro-pores (Benson et al. 2011). Addi- tionally, the plant community changes over time (species succession), and transpiration increases as the plant com- munity becomes better developed and root depth and density increases. BGMI monitored water balance and vegetation performance from the AA Pad cover system for 11 years. This paper presents long-term cover system performance data from the AA Pad including results from water balance instrument monitoring, rooting surveys, and in-situ hydraulic testing. Materials and Methods Site Characteristics The climate at the site is semi-arid with hot summers and cold winters. Weather data has been collected since 1990 at G. Zhan (&) Á J. Giraudo Barrick Gold of North America, Inc, 460 West 50 North, Suite 500, Salt Lake City, UT, USA e-mail: [email protected] J. Keller GeoSystems Analysis, Inc, Hood River, OR, USA M. Milczarek GeoSystems Analysis, Inc, Tucson, AZ, USA 123 Mine Water Environ (2014) 33:195–205 DOI 10.1007/s10230-014-0268-6
Transcript of 11 Years of Evapotranspiration Cover Performance at the … · 11 Years of Evapotranspiration Cover...

TECHNICAL ARTICLE
11 Years of Evapotranspiration Cover Performance at the AALeach Pad at Barrick Goldstrike Mines
Guosheng Zhan • Jason Keller •
Mike Milczarek • Joe Giraudo
Received: 13 July 2013 / Accepted: 5 March 2014 / Published online: 11 April 2014
� Springer-Verlag Berlin Heidelberg 2014
Abstract The AA Leach Pad at Barrick Goldstrike Mine
was reclaimed using an evapotranspiration (ET) cover
designed to limit the infiltration of precipitation into the
facility. Water content and matric potential sensor stations
were installed in the cover and underlying leach material
after cover system placement. Monitoring of the sensor
nests continued for 11 years. Data indicates that the cover
is performing well, limiting net percolation to less than
1 % of annual precipitation. The AA Leach Pad is the first
large-scale closed mine waste facility that has been
robustly monitored for a relatively long time in Nevada,
USA. The results provide an understanding of ET cover
system performance for closure of mine waste facilities and
offer guidance for ET cover system requirements in other
arid regions.
Keywords Store-and-release cover � Leach pad �Mine closure
Introduction
The Barrick Goldstrike Mines Inc. (BGMI), located 60 km
northwest of Elko in north-central Nevada, is a large open
pit and underground gold mining operation. The AA Leach
Pad (AA Pad) at BGMI operated from 1987 through 1999,
at which time it comprised 55 million metric tons (t) of
run-of-mine leached ore. The facility covers approximately
100 ha and has a maximum height of approximately 90 m.
The AA Pad was reclaimed in 2000/2001 using a
monolayer evapotranspiration (ET) cover to reduce net
percolation, limit erosion, and support a robust plant
community. The AA Pad ET cover design relies on a 1.2 m
thick fine-textured cover material layer overlying coarse
leached ore material. The cover layer stores water during
the wetter winter and spring months until the plant growing
period (summer and fall), depletes the soil moisture via ET
by the following fall.
Cover systems evolve over time as the cover material
develops in response to processes such as freeze/thaw
cycles and plant root propagation and decay, which result
in a decrease in soil bulk density and possibly the devel-
opment of soil macro-pores (Benson et al. 2011). Addi-
tionally, the plant community changes over time (species
succession), and transpiration increases as the plant com-
munity becomes better developed and root depth and
density increases. BGMI monitored water balance and
vegetation performance from the AA Pad cover system for
11 years. This paper presents long-term cover system
performance data from the AA Pad including results from
water balance instrument monitoring, rooting surveys, and
in-situ hydraulic testing.
Materials and Methods
Site Characteristics
The climate at the site is semi-arid with hot summers and
cold winters. Weather data has been collected since 1990 at
G. Zhan (&) � J. Giraudo
Barrick Gold of North America, Inc, 460 West 50 North,
Suite 500, Salt Lake City, UT, USA
e-mail: [email protected]
J. Keller
GeoSystems Analysis, Inc, Hood River, OR, USA
M. Milczarek
GeoSystems Analysis, Inc, Tucson, AZ, USA
123
Mine Water Environ (2014) 33:195–205
DOI 10.1007/s10230-014-0268-6
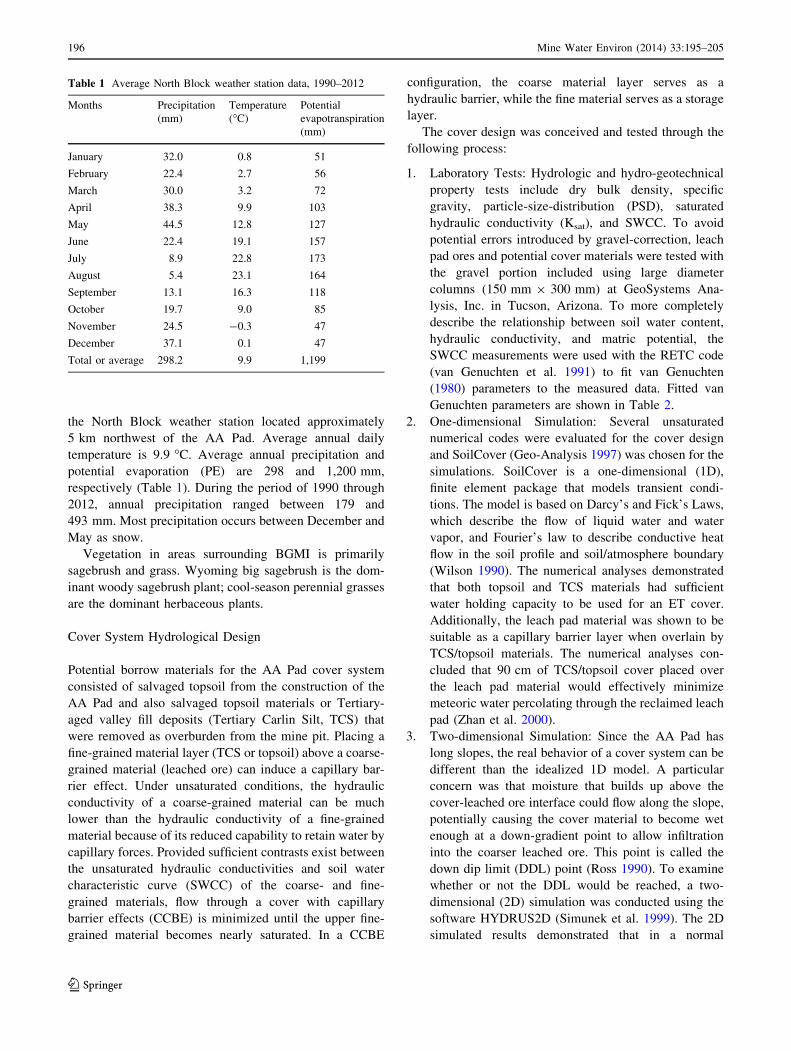
the North Block weather station located approximately
5 km northwest of the AA Pad. Average annual daily
temperature is 9.9 �C. Average annual precipitation and
potential evaporation (PE) are 298 and 1,200 mm,
respectively (Table 1). During the period of 1990 through
2012, annual precipitation ranged between 179 and
493 mm. Most precipitation occurs between December and
May as snow.
Vegetation in areas surrounding BGMI is primarily
sagebrush and grass. Wyoming big sagebrush is the dom-
inant woody sagebrush plant; cool-season perennial grasses
are the dominant herbaceous plants.
Cover System Hydrological Design
Potential borrow materials for the AA Pad cover system
consisted of salvaged topsoil from the construction of the
AA Pad and also salvaged topsoil materials or Tertiary-
aged valley fill deposits (Tertiary Carlin Silt, TCS) that
were removed as overburden from the mine pit. Placing a
fine-grained material layer (TCS or topsoil) above a coarse-
grained material (leached ore) can induce a capillary bar-
rier effect. Under unsaturated conditions, the hydraulic
conductivity of a coarse-grained material can be much
lower than the hydraulic conductivity of a fine-grained
material because of its reduced capability to retain water by
capillary forces. Provided sufficient contrasts exist between
the unsaturated hydraulic conductivities and soil water
characteristic curve (SWCC) of the coarse- and fine-
grained materials, flow through a cover with capillary
barrier effects (CCBE) is minimized until the upper fine-
grained material becomes nearly saturated. In a CCBE
configuration, the coarse material layer serves as a
hydraulic barrier, while the fine material serves as a storage
layer.
The cover design was conceived and tested through the
following process:
1. Laboratory Tests: Hydrologic and hydro-geotechnical
property tests include dry bulk density, specific
gravity, particle-size-distribution (PSD), saturated
hydraulic conductivity (Ksat), and SWCC. To avoid
potential errors introduced by gravel-correction, leach
pad ores and potential cover materials were tested with
the gravel portion included using large diameter
columns (150 mm 9 300 mm) at GeoSystems Ana-
lysis, Inc. in Tucson, Arizona. To more completely
describe the relationship between soil water content,
hydraulic conductivity, and matric potential, the
SWCC measurements were used with the RETC code
(van Genuchten et al. 1991) to fit van Genuchten
(1980) parameters to the measured data. Fitted van
Genuchten parameters are shown in Table 2.
2. One-dimensional Simulation: Several unsaturated
numerical codes were evaluated for the cover design
and SoilCover (Geo-Analysis 1997) was chosen for the
simulations. SoilCover is a one-dimensional (1D),
finite element package that models transient condi-
tions. The model is based on Darcy’s and Fick’s Laws,
which describe the flow of liquid water and water
vapor, and Fourier’s law to describe conductive heat
flow in the soil profile and soil/atmosphere boundary
(Wilson 1990). The numerical analyses demonstrated
that both topsoil and TCS materials had sufficient
water holding capacity to be used for an ET cover.
Additionally, the leach pad material was shown to be
suitable as a capillary barrier layer when overlain by
TCS/topsoil materials. The numerical analyses con-
cluded that 90 cm of TCS/topsoil cover placed over
the leach pad material would effectively minimize
meteoric water percolating through the reclaimed leach
pad (Zhan et al. 2000).
3. Two-dimensional Simulation: Since the AA Pad has
long slopes, the real behavior of a cover system can be
different than the idealized 1D model. A particular
concern was that moisture that builds up above the
cover-leached ore interface could flow along the slope,
potentially causing the cover material to become wet
enough at a down-gradient point to allow infiltration
into the coarser leached ore. This point is called the
down dip limit (DDL) point (Ross 1990). To examine
whether or not the DDL would be reached, a two-
dimensional (2D) simulation was conducted using the
software HYDRUS2D (Simunek et al. 1999). The 2D
simulated results demonstrated that in a normal
Table 1 Average North Block weather station data, 1990–2012
Months Precipitation
(mm)
Temperature
(�C)
Potential
evapotranspiration
(mm)
January 32.0 0.8 51
February 22.4 2.7 56
March 30.0 3.2 72
April 38.3 9.9 103
May 44.5 12.8 127
June 22.4 19.1 157
July 8.9 22.8 173
August 5.4 23.1 164
September 13.1 16.3 118
October 19.7 9.0 85
November 24.5 -0.3 47
December 37.1 0.1 47
Total or average 298.2 9.9 1,199
196 Mine Water Environ (2014) 33:195–205
123

precipitation year, net percolation (infiltration minus
ET) into the cover was close to zero and suctions at the
cover-leached ore interface were higher than the water
entry value of the spent ore material. Therefore, it was
concluded that the DDL will not occur along the slope
under these conditions. To evaluate ET cover behavior
during extreme precipitation events, a separate risk
assessment simulation was performed in which
10 days with no ET was assumed, and three 24-h,
100-year return frequency storm events (7.84 cm/day)
occurred Day 1, 2, and 3 respectively. The risk
assessment simulation predicted that at all locations
along the slope, the water content and pressure profiles
at the bottom of the cover would not increase
sufficiently to exceed the water pressure entry value
of the leached ore. In other words, the capillary barrier
would not be broken and water would not seep into the
leached ore under extreme precipitation conditions
(Zhan et al. 2001a).
4. Pilot Field Test: Prior to full-scale cover installation, a
pilot-scale study was conducted on a small test cover
plot placed on the AA Pad to examine the cover
performance under simulated rainfall conditions. For
this test, a 7 m 9 7.5 m cover test plot with a
thickness of 60 cm of TCS was constructed on the
3:1 (horizontal:vertical) east-facing slope of the AA
Pad (Fig. 1). After the cover was put in place, drip
irrigation tubes were installed on the surface of the
cover. Water content sensors (time-domain reflectom-
etry, TDR) and matric potential sensors (heat dissipa-
tion sensors, HDS) were installed on the lower part of
the test slope, since surface water run on makes these
areas more susceptible to net percolation. Performance
testing simulated intermittent irrigation of approxi-
mately 227 cm of water (equal to about 7.5 years of
precipitation) during the period of July to September
2000. The 1D numerical model was then calibrated to
the observed data (Zhan et al. 2001b).
The water content of the cover reached as high as
0.30 cm3/cm3 during irrigation periods. Simulated volu-
metric water content corresponding to a wilting point of
4,000 kPa, which is representative of desert plant com-
munities in the Great Basin (Zhan et al. 2006), was
0.17 cm3/cm3 and indicated a storage capacity of the
cover equal to 0.13 cm3/cm3 (0.30–0.17 cm3/cm3). Con-
sequently, a TCS cover thickness of 90–120 cm was
predicted to be able to store 12–16 cm of water, inde-
pendent of evaporation and lateral drainage. Based on
this analysis, the holding capacity of the cover would be
sufficient to retain three continuous one-hundred year
storm events (&24 cm of water), assuming half the
precipitation runs off the cover. Therefore, the cover
would operate as designed, even under extreme precipi-
tation conditions.
Cover Engineering Design
The engineering aspects associated with the closure of the
AA Pad facility consisted of the following:
• Design of a permanent toe drain facility that would
collect and isolate any water flux from the reclaimed
heap leach pad.
Table 2 van Genuchten (1980) parameters for cover and leached ore material
Material Ksat (cm/s) Residual water
content (cm3/cm3)
Saturated water
content (cm3/cm3)
Alpha (cm-1) n (–) m (–) l (–)
Tertiary Carlin Silt 1.30 9 10-4 0.09 0.27 0.02 1.35 0.26 0.5
Topsoil 1.52 9 10-4 0.04 0.38 0.04 1.25 0.20 0.5
Leached ore 4.00 9 10-2 0.091 0.23 0.162 1.88 0.47 0.5
Fig. 1 AA Leach Pad 2000
pilot field test: irrigated area
(left) and data acquisition
system (right)
Mine Water Environ (2014) 33:195–205 197
123

• Preparation of a grading plan that would provide for
adequate support and function of the soil cover,
optimize revegetation and reclamation potential, min-
imize erosion risk and sediment yield, and provide a
topography compatible with natural landforms.
• Design of a drainage network on the cover surface that
would safely and efficiently collect and remove surface
runoff from the new landform, incorporating a natural-
looking configuration of drainages for the control of
erosion and sediment yield.
• Balancing earthwork quantities and construction path-
ways to minimize construction costs and provide
adequate space for the ET cover layer construction.
• Design of a perimeter storm drainage network capable
of safely collecting and removing storm water runoff
from the re-contoured heap surface.
Details about the engineering design can be found in
Myers et al. (2001). The geotechnical integrity of the cover
system remains unchanged after having been in place for
more than 10 years and experiencing numerous storms of
varying intensity levels. The largest storm event occurred
June 1, 2002 and dumped more than 40 mm of water on the
AA Pad within 20 min. This storm intensity far exceeded
the predicted 500 year return period event.
Vegetation Design
The AA Pad was seeded with a mix of grasses, forbs, and
shrubs (Table 3). The seed mix was based on 5 years of
site-specific research of vegetation data. In March of 2001,
the seedbed was prepared and then broadcast seeded at
18 kg/ha of the selected seed mix, and then harrowed a
second time to lightly cover the seed. An organic mulch
and tackifier were hydraulically applied over the entire unit
at a rate of 9 t/ha and 168 kg/ha, respectively. Vegetation
surveys to assess the resultant plant cover and species
distribution on the AA Pad were performed annually from
2001 to 2011.
Cover Monitoring Instrumentation
The cover is composed of different materials of different
thicknesses, with variable slope positions, solar aspects,
and proximity to drainage channels. Cover system moni-
toring stations were installed between 2001 and 2005 on
the AA Pad. Fourteen monitoring stations were located
along east-, west-, and south-facing transects (Fig. 2), with
six, five, and three stations, respectively. At each transect,
sensor stations were located near the crest, mid-slope, and
foot-slope of the AA Pad, and in addition, adjacent to
stormwater runoff channels at the East transect.
Table 3 Species in the seed mix
Great Basin wildrye Bluebunch
wheatgrass
Crested
wheatgrass
Thickspike wheatgrass Lewis flax Indian ricegrass
Palmer Penstemon Fourwing saltbrush Big bluegrass
Sandberg bluegrass Small Burnet Forage Kochia
Winterfat Wyoming big sagebrush Regreen
Fig. 2 AA Leach Pad monitoring site and test trench locations
Fig. 3 Installation schematic for cover performance monitoring
stations
198 Mine Water Environ (2014) 33:195–205
123

Instruments included heat dissipation sensors (HDS,
Campbell Scientific Inc., Logan, UT) to measure matric
potential and temperature, time domain reflectometry
(TDR, Campbell Scientific Inc., Logan, UT), and capaci-
tance (ECH2O, Decagon Inc., Pullman, WA) sensors to
measure water content. Schematic diagrams showing gen-
eric sensor installation are shown on Fig. 3.
Rooting Survey and In-Situ Hydraulic Characterization
The cover system performance monitoring stations were
decommissioned in mid-October 2012. In conjunction
with the decommissioning of the cover monitoring sta-
tions, in-situ testing of cover material Ksat and plant
rooting surveys in the cover and leached ore materials
were completed near the three monitoring transects. Two
trenches, one upslope (A) and one downslope (B), were
excavated at each of the three transects, and two addi-
tional trenches were excavated adjacent to the East
transect stormwater runoff channel sensor locations (D-A
and D-B) as shown on Fig. 2. At each trench, Ksat tests
were conducted at two depths using a Woodings infil-
trometer (Soil Measurement Systems, Tucson, AZ) and
soil Ksat calculated using the methods described in
Wooding (1968).
Root surveys were completed in triplicate at each of
the eight trenches. Root size and density were deter-
mined according to Schoeneberger et al. (2002), with
density and size rankings modified slightly to account for
the arid terrain and sparse vegetation. Across the wall of
each trench, 10 cm by 10 cm areas were examined at six
depths, three in cover and three in the leached ore to the
maximum trench depth, in triplicate, for a total of 18
measurements per trench. Rankings assigned for root
density and root size are provided in Table 4.
Calculation of Net Percolation Flux
Net percolation flux of meteoric water near the cover-lea-
ched ore contact was estimated at each monitoring station
by calculating the 1D vertical flux from Darcy’s Law for
steady-state equilibrium as modified by Buckingham
(1907) for unsaturated flow and van Genuchten’s (1980)
analytical solution to Mualem’s (1976) theoretical model
of the relationship between unsaturated hydraulic conduc-
tivity and matric potential. Flux rates were calculated from
matric potential data and the measured hydraulic gradient
between the two deepest HDS located at each station,
together with van Genuchten parameters determined from
SWWC and Ksat values measured in the laboratory
(Table 2). Net percolation flux rates calculated in this
manner are referred to as matric-potential-based (MPB)-
calculated flux.
Net percolation flux rates were also estimated from AA
Pad draindown flow data. Since closure, the AA Pad has
been draining the residual solution remaining from the
heap leach operations. Draindown flow rate data have been
collected on a bimonthly or monthly basis from 2002
through 2009 and approximately quarterly since January
2010. Draindown is characterized by slowly decreasing
flow rates with annual spikes in the flow rate resulting from
net percolation into the AA Pad during spring melt.
Assuming that the draindown flow rates observed in (the
driest month of) October approximate drainage rates solely
from the residual heap leach solution (baseflow), drain-
down flow rates that exceed baseflow should approximate
the area-averaged net percolation rate through the AA Pad
cover system.
Table 4 Root density and root size rankings
Root density Root size
Ranking Descriptor Ranking Descriptor
0 None (0 roots) Very fine (vf) less than 1 mmdiameter
1 Very few (1–3 roots) Fine (f) 1–2 mmdiameter
2 Few (4–6 roots) Medium (m) 2–5 mmdiameter
3 Few/common(7–9 roots)
Coarse (c) 5–10 mmdiameter
4 Common(10–12 roots)
Very coarse (vc) Greater than10 mm diameter
5 Common/many(13–18 roots)
6 Many (morethan 18 roots)
0
100
200
300
400
500
600
2002 2003 2004 2005 2006 2007 2008 2009 2010 2011 2012
Pre
cip
itat
ion
(m
m)
Water Year
Total Water Year Precipitation
Long-term Mean Precipitation
Long-term Mean +/- Standard Deviation
Fig. 4 Water year, long-term mean, and long-term mean ±1 SD
precipitation
Mine Water Environ (2014) 33:195–205 199
123

Results
Precipitation
Precipitation totals over the monitoring period from
water year (WY, October 1 through September 30) 2002
to WY 2012 ranged from 201 to 493 mm, averaging
332, 34 mm higher than the 298 mm long-term average
(Fig. 4). WYs were classified into average, wet, or dry
years by defining a wet year as one with a WY pre-
cipitation total [1 SD (86 mm) above the long-term
average, and a dry year as one with a total \1 SD below
the average. WYs 2005, 2006, and 2011 were wet years,
WY 2008 was a dry year, and all other WYs were
average years.
Vegetation
AA Pad vegetation survey data indicates that the AA
Pad vegetation appears to be stable and self-sustaining,
as well as resistant to erosion. Total plant cover in 2011
was 52.1 % with 44.4 % being derived from perennial
species (Fig. 5). By comparison, the reference area only
displayed 19.1 % perennial cover out of 58.4 % total
plant cover. There were 22 plant species observed on the
AA Pad with 16 being perennial species, compared to 33
total species on the reference area with 19 perennial
species. Overall, the AA Pad perennial forbs contributed
16.8 %, perennial grasses 15.3 %, and shrubs 12.3 %
plant cover which demonstrates good diversity and bal-
ance within the established plant community. An exam-
ple of the exemplary status of this reclamation effort is
the 5.6 % composition contributed by bitterbrush (Purs-
hia tridentata), an extremely important plant for desert
wildlife, but one that is difficult to establish in the
northern Nevada rangeland.
Water Content and Matric Potential Data
An example of typical water content sensor response at the
West and South transect stations, and the East transect
stations are presented on Figs. 6 and 7, respectively. Typ-
ical matric potential sensor response at the West and South
transect stations, and the East transect stations are pre-
sented on Figs. 8 and 9, respectively. Matric potentials are
expected to increase (become less negative, indicating
wetting) in response to precipitation in fall and early winter
and to snowmelt in late winter or spring; and then to
decrease (become more negative, indicating drying) as the
summer-growing season progresses. The 107 cm matric
potential sensor at the east transect station stopped func-
tioning after July, 2006. Wetter conditions were observed
at most monitoring stations during and following signifi-
cant rainfall and snowmelt events in late fall, winter, and
early spring; drier conditions were observed during periods
of decreased precipitation and high ET demand in late
spring, summer, and early fall. The West and South tran-
sect stations showed relatively dry conditions throughout
average precipitation WYs 2003, 2007 through 2010, and
2012, indicating that the cover material in these areas is
able to store and release most, if not all, infiltrating pre-
cipitation during WYs with average precipitation. During
wet WYs (e.g. 2005, 2006, and 2011) the measured water
content and matric potential in the underlying leached ore
showed relatively wet conditions, indicating that the stor-
age capacity of the cover material had been exceeded and
water percolated into the leached ore. The East transect
stations generally showed increased water content at all
depths each year between late February and early April,
indicating that water is percolating to the depth of the
leached ore sensor during all WYs. Nonetheless, the lea-
ched ore water content and matric potentials in the East
transect stations also dried out more during the late summer
and fall dry season indicating the ET depth was deep in the
East transect area. These data support a conceptual model
wherein, during WYs with average precipitation, the cover
material stores and releases most if not all of the infiltrating
water back into the atmosphere via ET, while during wet
WYs water years, some water percolates into the leached
ore material. In general, the maximum observed water
content decreased over time at all transect stations, which
indicates greater cover system efficacy, most likely in
response to vegetation establishment.
Draindown Data
AA Pad draindown data generally showed seasonal
increases in drainage rates in response to spring snowmelt
(March–May) followed by declining rates over the summer
and fall months. Baseflow interpolated from the October
Per
cent
Per
enni
al C
over
Fig. 5 AA Leach Pad perennial plant cover (2001–2011, no survey in
2009 and 2010)
200 Mine Water Environ (2014) 33:195–205
123

draindown measurements is shown on Fig. 10. The average
difference between the interpolated baseflow rate and the
measured increased drainage rates in response to spring
melt (i.e. net percolation flux) was 3.2 mm/year (0.94 % of
precipitation) from October 2002 to October 2012.
Draindown rates above estimated base-flow rates were
most significant during wet WYs 2005 and 2006; ele-
vated rates persisted through WY 2007 before returning
to estimated base-flow rates midway through dry WY
2008. By comparison, increased draindown rates during
wet WY 2011 were not as elevated as WY 2005 or 2006
flow rates, and flow rates returned to estimated base-flow
conditions during WY 2012. The reduced draindown
response to wet WY 2011 relative to wet WYs 2005 and
2006 indicates that two successive wet WYs magnified
the net infiltration passing through the cover system, or
that the cover system performance improved over time,
which could have occurred due to maturation of the
vegetation on the cover material or changes in hydraulic
properties.
Decommissioning Rooting Survey
For all trenches, root density generally decreased with
depth, though a trend of increasing root density with depth
was observed in the leached ore at the East transect tren-
ches and may be a result of wetter conditions within the
leached ore at the East transect (Fig. 11). Roots were
typically seen at the maximum depth in each trench, indi-
cating that at AA Pad water within the top meter or more of
0
1
2
3
4
5
6
7
8
9
10
0.00
0.05
0.10
0.15
0.20
0.25
0.30
0.35
Jan-01 Jan-02 Jan-03 Jan-04 Jan-05 Jan-06 Jan-07 Jan-08 Jan-09 Jan-10 Jan-11 Jan-12 Jan-13
Daily P
recipitatio
n (cm
)Wat
er C
on
ten
t (c
m3 /
cm3 )
Date
30 cm 94 cm 124 cm 144 cm (leached ore) Precipitation
Cover Thickness: 134 cmFig. 6 Volumetric water
content: West 2 (topsoil cover,
mid-slope)
0
1
2
3
4
5
6
7
8
9
10
0.00
0.05
0.10
0.15
0.20
0.25
0.30
0.35
Jan-01 Jan-02 Jan-03 Jan-04 Jan-05 Jan-06 Jan-07 Jan-08 Jan-09 Jan-10 Jan-11 Jan-12 Jan-13
Daily P
recipitatio
n (cm
)
Wat
er C
on
ten
t (c
m3 /
cm3 )
Date
30 cm 77 cm 107 cm 127 cm (leached ore) Precipitation
Cover Thickness 117 cm
Fig. 7 Volumetric water
content: East 3 (Carlin cover,
mid-slope)
Mine Water Environ (2014) 33:195–205 201
123

the leached ore is accessible by vegetation, as supported by
leached ore drying in the summer.
The greatest leached ore root density was observed in
the East transect trenches, which also agrees with the
observed higher density of deeper rooting shrubs at the
East transect compared to other transects (Fig. 11). The
thicker cover material but shallower root density at the
West transect trenches also agrees with the observed
greater vegetation ground cover of predominately forbs and
grasses at the West Transect.
In Situ Hydraulic Characterization
Mean surface Ksat was similar across transects, while at the
90 cm depth, the mean Ksat values ranged over an order of
magnitude (Table 5). Mean Ksat values at the West and
East transects were approximately 5 times greater than the
previous laboratory-measured Ksat values in Table 2
assigned for estimates of net flux (as described in the next
section); Ksat values for the South transect were 10 times
greater. The larger in-situ measured Ksat values is most
likely from soil development processes, such as freeze/
thaw cycles and root propagation and decay that result in a
decrease in soil bulk density in addition to the possible
development of soil macro-pores (Benson et al. 2011).
Estimates of Net Flux
The MPB-calculated net percolation flux estimates indicate
that the majority of net percolation occurred in wet WYs
0
1
2
3
4
5
6
7
8
9
10
10
100
1,000
10,000
100,000
Jan-01 Jan-02 Jan-03 Jan-04 Jan-05 Jan-06 Jan-07 Jan-08 Jan-09 Jan-10 Jan-11 Jan-12 Jan-13
Daily P
recipitatio
n (cm
)
Mat
ric
Po
ten
tial
(-c
m)
Date
30 cm 94 cm 124 cm 144 cm (leached ore) Precipitation
Cover Thickness 134 cm
Fig. 8 Matric potential: West 2
(topsoil cover, mid-slope)
0
1
2
3
4
5
6
7
8
9
10
10
100
1,000
10,000
100,000
Jan-01 Jan-02 Jan-03 Jan-04 Jan-05 Jan-06 Jan-07 Jan-08 Jan-09 Jan-10 Jan-11 Jan-12 Jan-13
Daily P
recipitatio
n (cm
)
Mat
ric
Po
ten
tial
(-c
m)
Date
30 cm 77 cm 107 cm 127 cm (leached ore) Precipitation
Cover Thickness 117 cm
Fig. 9 Matric potential: East 3
(Carlin cover, mid-slope)
202 Mine Water Environ (2014) 33:195–205
123

2005, 2006, and 2011, whereas during average WYs, near-
zero MPB-calculated net percolation values were calcu-
lated at most stations. Stations near stormwater runoff
channels recorded the highest MPB-calculated flux rates.
Weighting the MPB-calculated net percolation flux with
respect to the amount of surface area on the AA Pad
occupied by each monitoring station slope position (crest,
mid-slope, foot-slope, and channels) results in an annual
net percolation estimate of approximately 2.2 mm/year
(0.63 % of precipitation) (Table 6).
The weighted average MPB-calculated net percolation
flux is less than the net percolation estimated from the
draindown data. Two possible reasons for this difference
may be that actual net flux beneath the channels is
higher than calculated since the monitoring sensors were
not directly located below the drainage channel(s) or
because the sensor upper measurement (wet-end) limit
was exceeded during winter/spring precipitation and
snowmelt conditions. Channel conditions may, in fact, be
wetter than measured and greater rates of net percolation
may occur. Additional reasons for the difference between
MPB-calculated net flux and draindown data estimated
net percolation may be: the occurrence of macro-pore
flow during large wetting events (e.g. snowmelt, high
intensity precipitation) that is not detected with point
measurements made by the matric potential sensors;
errors associated with the MPB flux model assumption of
uniform flow, and; the precision of the matric potential
sensors. Nonetheless, the average channel station MPB-
calculated flux was 5.5 times the average MPB-calcu-
lated flux for the crest, mid-slope and foot-slope stations,
well within the range of drainage flux to inter-drainage
flux values that others have reported (Flint and Flint
2007; Scanlon et al. 1999).
0
2
4
6
8
10
12
14
0
20
40
60
80
100
120
Jan-01 Jan-02 Jan-03 Jan-04 Jan-05 Jan-06 Jan-07 Jan-08 Jan-09 Jan-10 Jan-11 Jan-12 Jan-13
Mo
nth
ly Precip
itation
(cm)
Flo
w R
ate
(L/m
in)
Date
Wet WY Dry WY MeasuredEstimated Baseflow Monthly Precipitation
y=2x1059x-12.54
Fig. 10 Predicted and
measured draindown from AA
Leach Pad (x is days since
January 1, 1900)
0
25
50
75
100
125
150
175
200
225
250
275
Dep
th B
elo
w G
rou
nd
Su
rfac
e (c
m)
West South East West Contact South Contact East Contact
None Very Few 1-3/dm2
Few 4-6/dm2
Few/Common 4-6/dm2
Common 10-13/dm2
Common/Many14-18/dm2
Many>18/dm2
Fig. 11 Root density survey
results
Mine Water Environ (2014) 33:195–205 203
123

MPB-calculated net flux at the East and West transects
was also estimated using the mean in-situ measured cover
material Ksat determined from the decommissioning study
(Table 5). The mean in-situ Ksat value for the East transect
was 3.5 times greater (4.6 9 10-4 cm/s) and for the West
transect was 4.5 times greater (6.8 9 10-4 cm/s) than the
original laboratory derived Ksat value used in the above net
percolation calculations (Table 2). The South transect was
excluded from this analysis because MPB-calculated net
flux at the South transect only used sensors located in the
leached ore material.
Increasing the cover material Ksat to the measured in-
situ Ksat values reduced the average annual MPB-calcu-
lated net flux at the East transect from 5.6 to 3.0 mm
(1.66–0.88 % of precipitation) and at the West transect
from 2.1 to 1.8 mm (0.62–0.54 % of precipitation). Thus,
increasing the cover material Ksat reduced the area-
weighted average MPB-calculated net flux estimate to
1.5 mm/year (Table 6). At both transects, the decrease in
MPB-calculated net flux is due to a predicted increase in
upward flux during periods of cover material drying in late
summer and fall. While an increased cover material Ksat
would be expected to increase the rate of downward water
movement within the cover during precipitation and
snowmelt events, the increased downward flux in the cover
is negated by less resistance to upward flux when hydraulic
gradients are upward. Average annual estimated flux at the
East transect is comparable to the West transect even
though greater percolation into the leached ore is observed
at the East transect during average water years (Figs. 6, 7,
8, 9). These values indicate that deep rooting vegetation
(i.e. shrubs) remove water that has percolated beyond the
cover system during the dry season.
Changes in cover material Ksat would occur gradually
over time and not as a single point in time as applied here.
As a result, the estimated decrease in MPB-calculated net
flux with increased cover Ksat would likely be less. This is
possibly corroborated by the decrease in draindown flow
response to wet WY 2011 in comparison to wet WYs 2005
and 2006. It is worth noting that variability between in-situ
Ksat measurements within transects was over an order of
magnitude. Consequently, spatial variability in hydraulic
properties between monitoring stations also likely affected
matric potential sensor response and estimated net perco-
lation flux estimates.
Conclusions
Eleven years of cover monitoring data at AA Pad indicate
that the cover is limiting average annual net percolation
flux through the cover to 2.2 mm/year (0.63 % of precip-
itation), based on the area-weighted average MPB-calcu-
lated flux. Estimated average annual flux from seasonal
increases in AA Pad draindown rates in response to spring
melt are slightly higher than the MPB-calculated flux,
being 3.2 mm/year (0.94 % of precipitation). Considering
the small difference, it is reasonable to conclude that net
percolation through the cover is less than 1 % of the pre-
cipitation. Eleven years of vegetation surveys indicate that
plants at AA Pad are self-sustaining and that the reclaimed
site appears at least as stable and resistant to erosion as
nearby, undisturbed areas.
Acknowledgments This paper was generated from the AA Leach
Pad reclamation program of BGMI. The inputs from all team mem-
bers are gratefully acknowledged. The authors thank Dr. Mark Ank-
eny from the Idaho National Laboratory, Mr. Steven Viert from Cedar
Creek Associates, Dr. Dale Hammermeister from GeoSystem Ana-
lysis, Inc., Mr. Greg Newman from Newmans Geotechnique Inc., Ms.
Mayana Kissiova from Golder, and Professor Michel Aubertin from
Ecole Polytechnique de Montreal for their valuable contributions to
this project. Finally, special thanks to Barrick Gold Corporation for
providing permission to publish this technical summary.
Table 5 In-situ measured cover material saturated hydraulic
conductivity
Sampling location Saturated hydraulic conductivity (cm/s)
Surface 90 cm depth Mean
West-A 3.6E-03 1.4E-04 7.1E-04
West-B 1.5E-04 2.7E-03 6.4E-04
West mean 7.4E-04 6.2E-04 6.8E-04
South-A 7.7E-04 1.0E-02 2.8E-03
South-B 1.4E-04 1.1E-03 4.0E-04
South mean 3.3E-04 3.4E-03 1.1E-03
East-A 1.3E-03 6.5E-04 9.1E-04
East-B 2.5E-04 1.9E-04 2.2E-04
East mean 5.6E-04 3.5E-04 4.4E-04
East-D-A 4.7E-05 6.6E-04 1.8E-04
East-D-B 1.5E-03 1.0E-03 1.2E-03
East-D mean 2.6E-04 8.2E-04 4.6E-04
Table 6 Area-weighted MPB-calculated flush using laboratory and
in-situ measured cover material Ksat
Slope
position
Area
(ha)
Laboratory Ksat In-situ Ksat
Area-weighted
average flux
(mm/year)
Area-weighted
average flux
(mm/year)
Crest 16.4 0.5 0.4
Mid-slope 66.3 1.0 0.8
Foot-slope 8.1 0.2 -0.1
Channels 4.8 0.5 0.4
Total 95.6 2.2 1.5
204 Mine Water Environ (2014) 33:195–205
123

References
Benson CH, Albright WH, Fratta DO, Tinjum JM, Kucukkira E, Lee
SH, Scalia J, Schilicht PD, Wang X (2011) Engineered cover for
waste containment: changes in engineering properties and
implications for long-term performance assessment. Nuclear
Regulatory Commission Report NUREG/CR-7028
Buckingham E (1907) Studies on the movement of soil moisture.
Bureau of Soils Bull 38. US Dept of Agriculture, Washington
DC, USA
Flint AL, Flint LE (2007) Application of the basin characterization
model to estimate in-place recharge and runoff potential in the
basin and range carbonate-rock aquifer system, White Pine
County, Nevada, and adjacent areas in Nevada and Utah. USGS
Scientific Investigation Report 2007–5099, Washington DC,
USA
Geo-Analysis 2000 Ltd (1997) SoilCover user’s manual version 4.01.
Department of Civil Engineering, University of Saskatchewan,
Saskatoon, Canada
Mualem Y (1976) A new model for predicting the hydraulic
conductivity of unsaturated porous pedia. Water Resour Res
12:513–522
Myers KL, Espell R, Burke K (2001) Reclamation and closure of the
AA heap leach pad at Barrick’s Goldstrike mine. Trans Soc Min
Metall Explor Inc 310:104–110
Ross B (1990) The diversion capacity of capillary barriers. Water
Resour Res 26:2625–2629
Scanlon BR, Langford RP, Goldsmith RS (1999) Relationship
between geomorphic settings and unsaturated flow in an arid
setting. Water Resour Res 35:983–999
Schoeneberger PJ, Wysocki DA, Benham EC, Broderson WD (eds)
(2002) Field book for describing and sampling soils, version 2.0.
Natural Resources Conservation Service, National Soil Survey
Center, Lincoln
Simunek J, Sejna M, van Genuchten M (1999) Simulating water flow
and solute transport in two-dimensional variable saturated
media, version 2.0. HYDRUS2D/MESHGEN2D. US Salinity
Laboratory, Riverside
van Genuchten M (1980) A closed form equation for predicting the
hydraulic conductivity of unsaturated soils. Soil Sci Soc Am J
44:892–898
van Genuchten M, Leij FJ, Yates SR (1991) The RETC code for
quantifying the hydraulic functions of unsaturated soils. US
Environmental Protection Agency Report 600/2-91/065, Washington
Wilson, GW (1990) Soil evaporative fluxes for geotechnical engi-
neering problems. PhD Thesis, Univ of Saskatchewan, Saska-
toon, SK, Canada
Wooding RA (1968) Steady infiltration from a shallow circular pond.
Water Resour Res 4:1259–1273
Zhan G, Mayer A, McMullen J, Aubertin M (2000) Capillary cover
design for a spent leach pad. In: Proceedings of the international
symposium on hydrology and the environment, Wuhan, Hubei,
China, pp 144–150
Zhan G, Mayer A, McMullen J, Aubertin M (2001a) Slope effect
study on the capillary cover design for a spent leach pad. In:
Proceedings of tails and mine waste’01, Colorado State Univer-
sity, Front Collins, CO, USA, pp 179–187
Zhan G, Aubertin M, Mayer A, Burke K, McMullen J (2001b)
Capillary cover design for leach pad closure. Trans Soc Min
Metall Explor Inc 310:104–110
Zhan G, Schafer W, Milczarek M, Myers K, Giraudo J, Espell R
(2006) The evolution of evapotranspiration cover system at
Barrick Goldstrike Mines. In: Proceedings of the 7th interna-
tional conference on acid rock drainage (ICARD), St. Louis,
MO, USA, pp 2585–2603
Mine Water Environ (2014) 33:195–205 205
123