11-WindroseExercise
13
11-Windrose Diagram Exercise: WRPLOT View, Lakes Environmental Prior to initiating WRPLOT View, you must ensure that all Excel meteorology files are formatted appropriately. The model requires that all data be organized into seven labeled columns: Year, Month, Day, Hour (00-23 OR 01-24), Wind Direction (degrees [integers]), Wind Speed (meters/second, knots, mph, OR km/h), Precipitation Inches (include decimals to 100ths of an inch [ex: 1.02]). For an example/template, please see the Excel document titled “Sample_Excel_Data_For_WRPLOT.xls”. Important! Excel file must be saved as an .xls file (Excel 97-2003 file type). For the purposes of this module, we have created a refined Excel file from the raw data that was generously provided by the Pechanga tribe (file name “Pechanga_WRPLOT data”). You will note that there are two sheets, one titled “Data” and the other titled “WRPLOT ready”. The “Data” page contains data directly copied over from the original raw data file. The temporal data on this sheet is displayed as “Date Time” (ex: 10/22/08 0:00). As was previously mentioned, the model requires that data be formatted into seven labeled categories: year, month, day, hour, wind direction, wind speed, precipitation (in). To convert the Date Time column into the correct format, one would complete the following steps. NOTE – we have already converted the column and created a model-ready spreadsheet so you DO NOT have to reformat the Date Time column. This next section is purely informational. Page 1 of 13
-
Upload
shailendra21271 -
Category
Documents
-
view
64 -
download
9
description
wind
Transcript of 11-WindroseExercise

11-Windrose Diagram Exercise: WRPLOT View, Lakes Environmental
Prior to initiating WRPLOT View, you must ensure that all Excel meteorology files are formatted appropriately. The model requires that all data be organized into seven labeled columns: Year, Month, Day, Hour (00-23 OR 01-24), Wind Direction (degrees [integers]), Wind Speed (meters/second, knots, mph, OR km/h), Precipitation Inches (include decimals to 100ths of an inch [ex: 1.02]).
For an example/template, please see the Excel document titled “Sample_Excel_Data_For_WRPLOT.xls”. Important! Excel file must be saved as an .xls file (Excel 97-2003 file type).
For the purposes of this module, we have created a refined Excel file from the raw data that was generously provided by the Pechanga tribe (file name “Pechanga_WRPLOT data”). You will note that there are two sheets, one titled “Data” and the other titled “WRPLOT ready”.
The “Data” page contains data directly copied over from the original raw data file. The temporal data on this sheet is displayed as “Date Time” (ex: 10/22/08 0:00). As was previously mentioned, the model requires that data be formatted into seven labeled categories: year, month, day, hour, wind direction, wind speed, precipitation (in). To convert the Date Time column into the correct format, one would complete the following steps.
NOTE – we have already converted the column and created a model-ready spreadsheet so you DO NOT have to reformat the Date Time column. This next section is purely informational.
Page 1 of 11

11-Windrose Diagram Exercise: WRPLOT View, Lakes Environmental
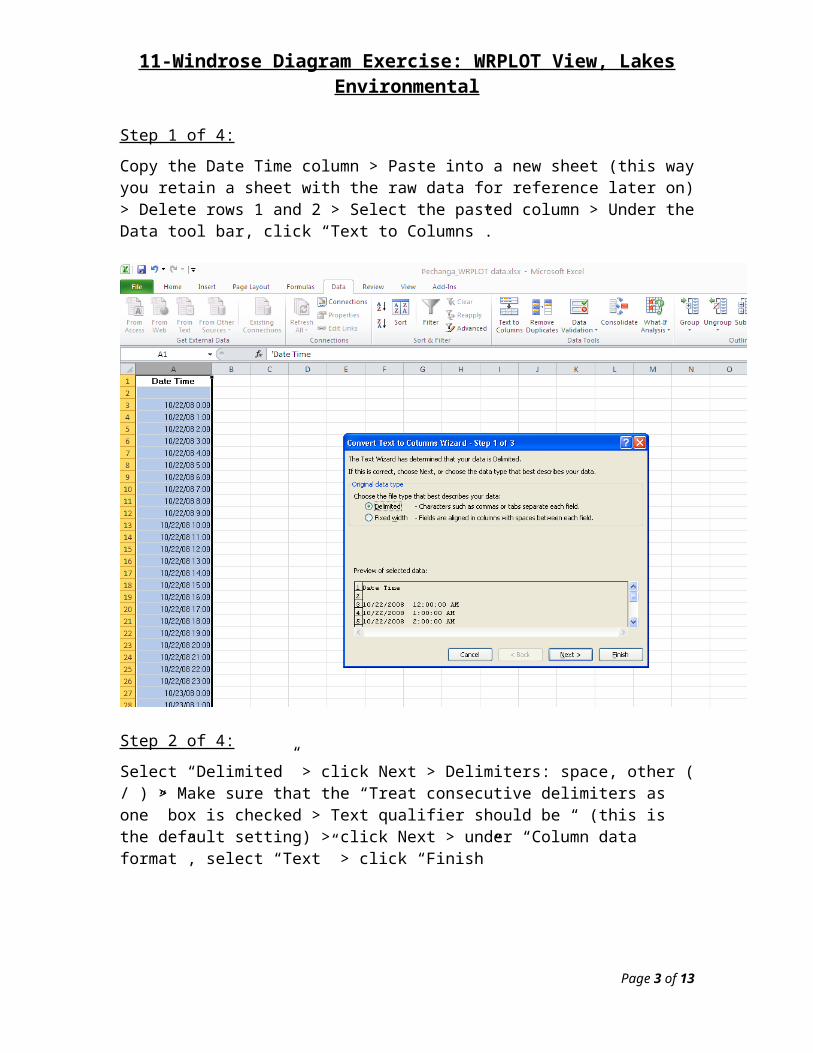
Step 1 of 4:
Copy the Date Time column > Paste into a new sheet (this way you retain a sheet with the raw data for reference later on) > Delete rows 1 and 2 > Select the pasted column > Under the Data tool bar, click “Text to Columns”.
Step 2 of 4:
Select “Delimited” > click Next > Delimiters: space, other ( / ) > Make sure that the “Treat consecutive delimiters as one” box is checked > Text qualifier should be “ (this is the default setting) > click Next > under “Column data format”, select “Text” > click “Finish”
Page 2 of 11
11-Windrose Diagram Exercise: WRPLOT View, Lakes Environmental
You’ll note a formula error message in Column A which states “Number Stored as Text”
To correct this error Highlight Column A, click on the formula error icon, and select “Convert to Number”
Step 3 of 4:
Name columns: A = Month, B = Day, C = Year, D = Hour_ORIGINAL
Step 4 of 4:
Change the hour format – WRPLOT View accepts hours in either 01-24 OR 00-23 format but currently, we have hours reported as hour:minutes:seconds (ex: 12:00:00).
o Insert a column adjacent to the Hour_ORIGINAL column (column D); title this new column “Hour”
o Manually type the following numbers into cells D2, D3, and D4, respectively: 0, 1, 2o Use the Auto Fill option to complete the 0-23 range. These values should correspond
to the original hour column such that 12:00:00 AM is 0, and 11:00:00 PM is 23.
Page 3 of 11

11-Windrose Diagram Exercise: WRPLOT View, Lakes Environmental
o Copy and paste the 0-23 value set down the remainder of column D. Visually inspect your data sheet to ensure that the new and original hour columns correspond, and then delete columns E and F.
Finish your WRPLOT View-ready sheet:Arrange your newly formatted meteorological data (Year, Month, Day, Hour) and copy over the wind direction (deg), wind speed (m/s), and rain (in) data from the Raw Data sheet.
Your finished “WRPLOT ready” spreadsheet should be arranged in the following order:
Year Month Day HourWD_v (deg)
WS_v (m/s)
Rain (in)
Once the Excel spreadsheet has been formatted correctly…1. Open WRPLOT View
Page 4 of 11

11-Windrose Diagram Exercise: WRPLOT View, Lakes Environmental
Under Toolsselect “Import from Excel”
NOTES: This model accepts .xls files. The model will import the first sheet in the spreadsheet file. Make sure that your
formatted spreadsheet (WRPLOT ready) is the first sheet.
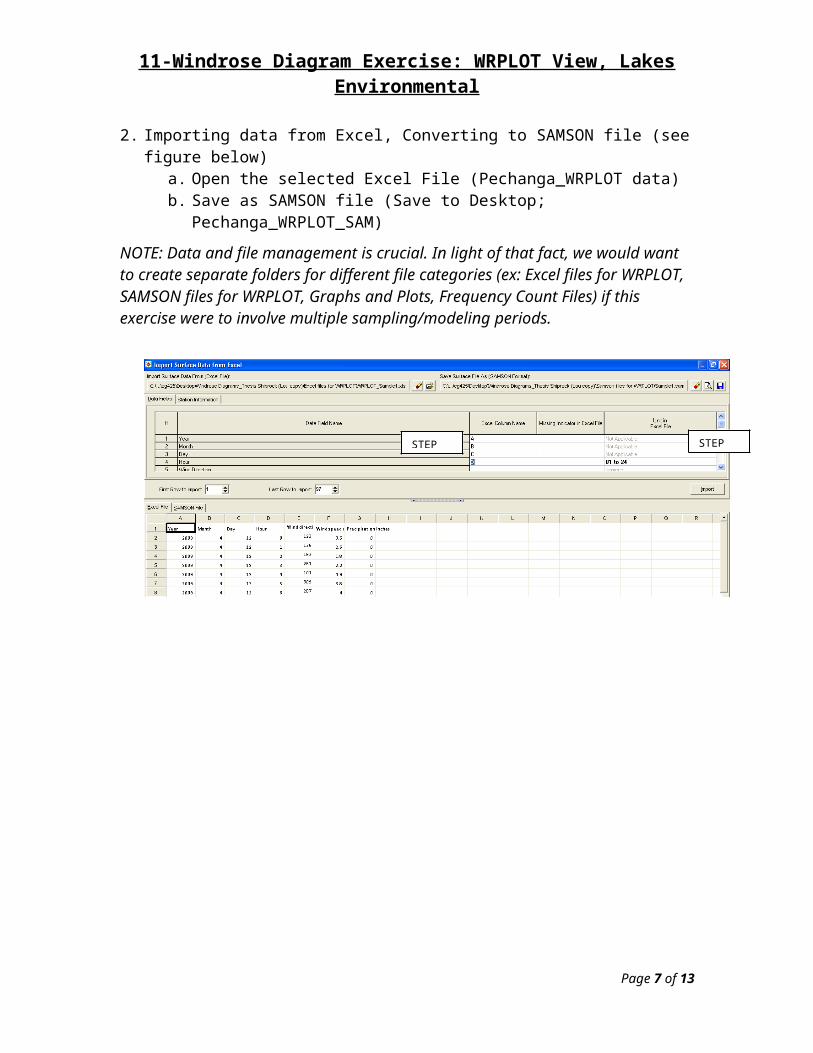
2. Importing data from Excel, Converting to SAMSON file (see figure below)a. Open the selected Excel File (Pechanga_WRPLOT data)b. Save as SAMSON file (Save to Desktop; Pechanga_WRPLOT_SAM)
NOTE: Data and file management is crucial. In light of that fact, we would want to create separate folders for different file categories (ex: Excel files for WRPLOT, SAMSON files for WRPLOT, Graphs and Plots, Frequency Count Files) if this exercise were to involve multiple sampling/modeling periods.
Page 5 of 11

11-Windrose Diagram Exercise: WRPLOT View, Lakes Environmental
Page 6 of 11
STEP 2a STEP 2b
11-Windrose Diagram Exercise: WRPLOT View, Lakes Environmental
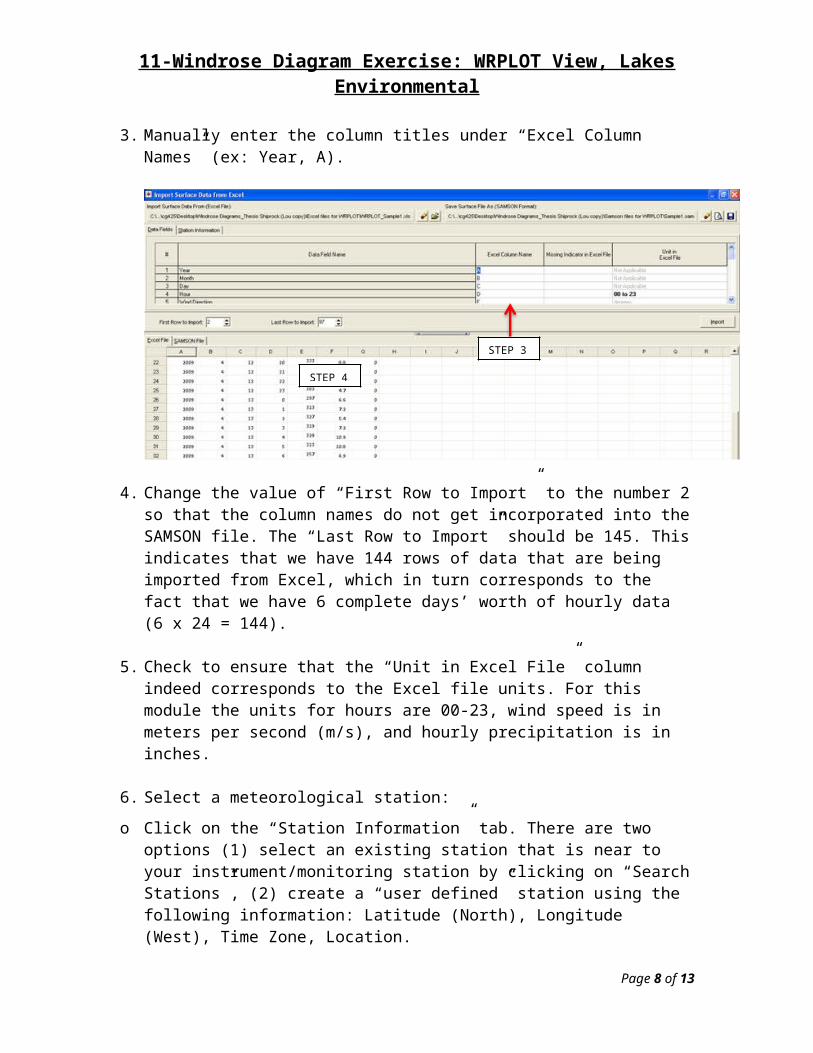
3. Manually enter the column titles under “Excel Column Names” (ex: Year, A).
4. Change the value of “First Row to Import” to the number 2 so that the column names do not get incorporated into the SAMSON file. The “Last Row to Import” should be 145. This indicates that we have 144 rows of data that are being imported from Excel, which in turn corresponds to the fact that we have 6 complete days’ worth of hourly data (6 x 24 = 144).
5. Check to ensure that the “Unit in Excel File” column indeed corresponds to the Excel file units. For this module the units for hours are 00-23, wind speed is in meters per second (m/s), and hourly precipitation is in inches.
6. Select a meteorological station:
o Click on the “Station Information” tab. There are two options (1) select an existing station that is near to your instrument/monitoring station by clicking on “Search Stations”, (2) create a “user defined” station using the following information: Latitude (North), Longitude (West), Time Zone, Location.
Page 7 of 11
STEP 4
STEP 3
11-Windrose Diagram Exercise: WRPLOT View, Lakes Environmental
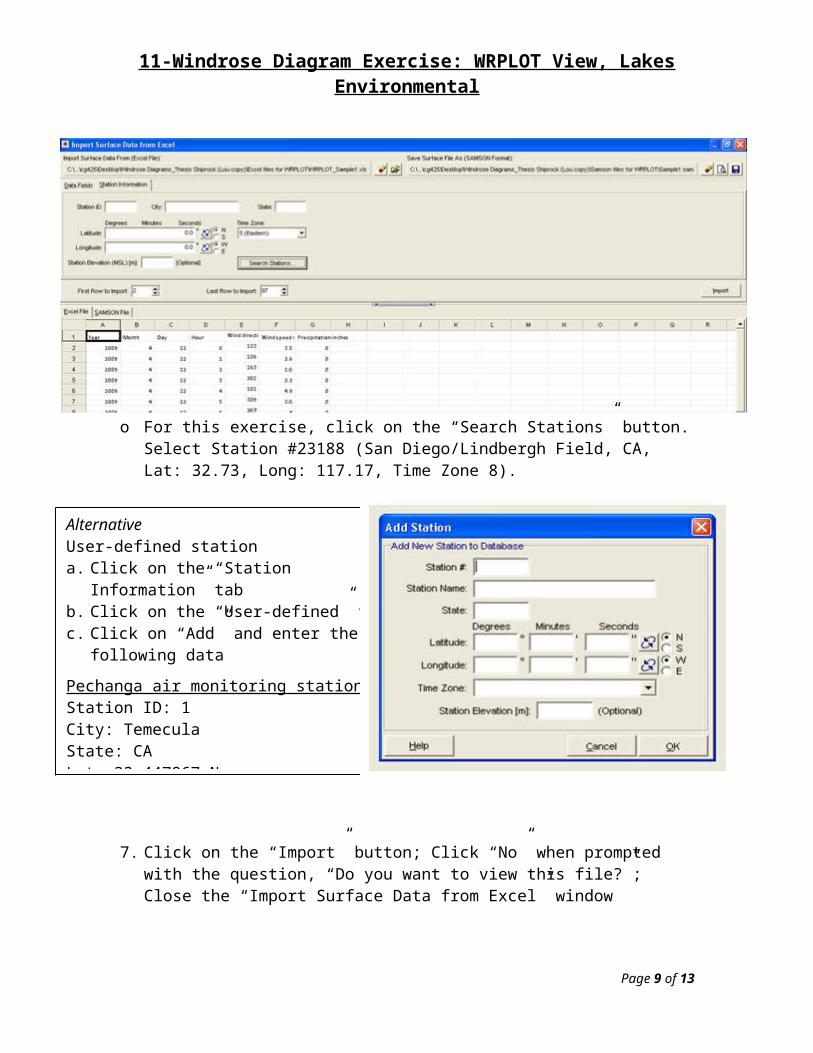
o For this exercise, click on the “Search Stations” button. Select Station #23188 (San Diego/Lindbergh Field, CA, Lat: 32.73, Long: 117.17, Time Zone 8).
7. Click on the “Import” button; Click “No” when prompted with the question, “Do you want to view this file?”; Close the “Import Surface Data from Excel” window
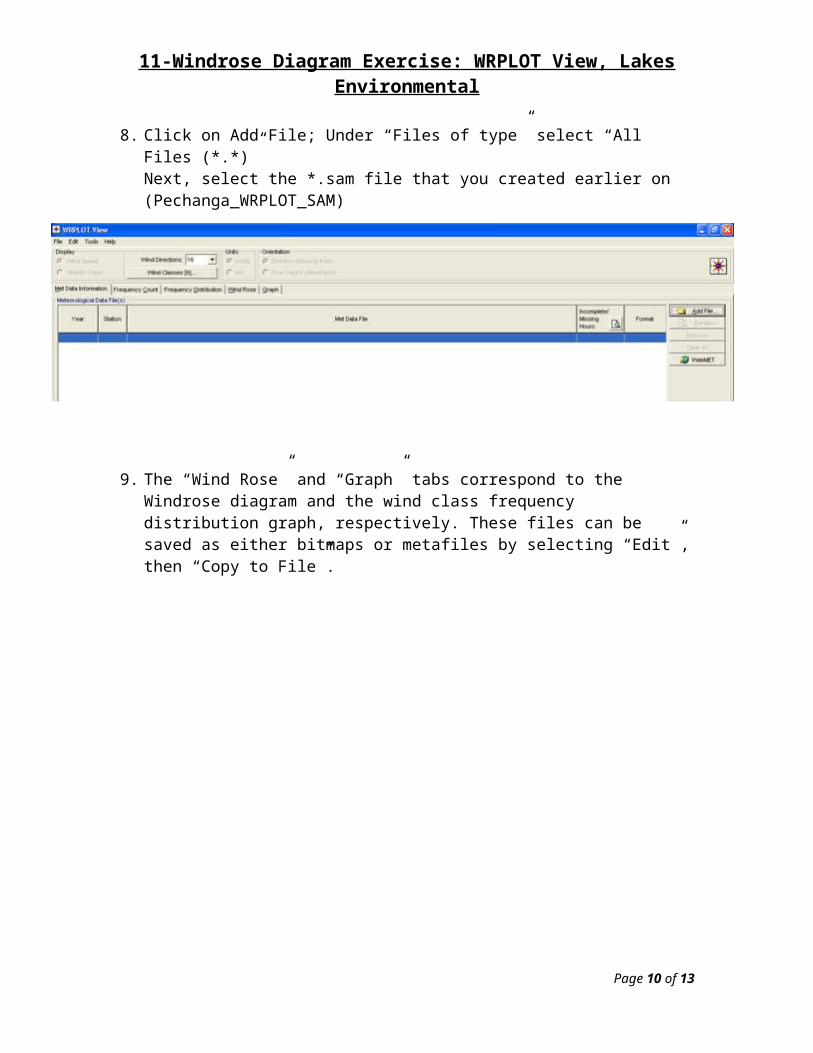
8. Click on Add File; Under “Files of type” select “All Files (*.*)”Next, select the *.sam file that you created earlier on (Pechanga_WRPLOT_SAM)
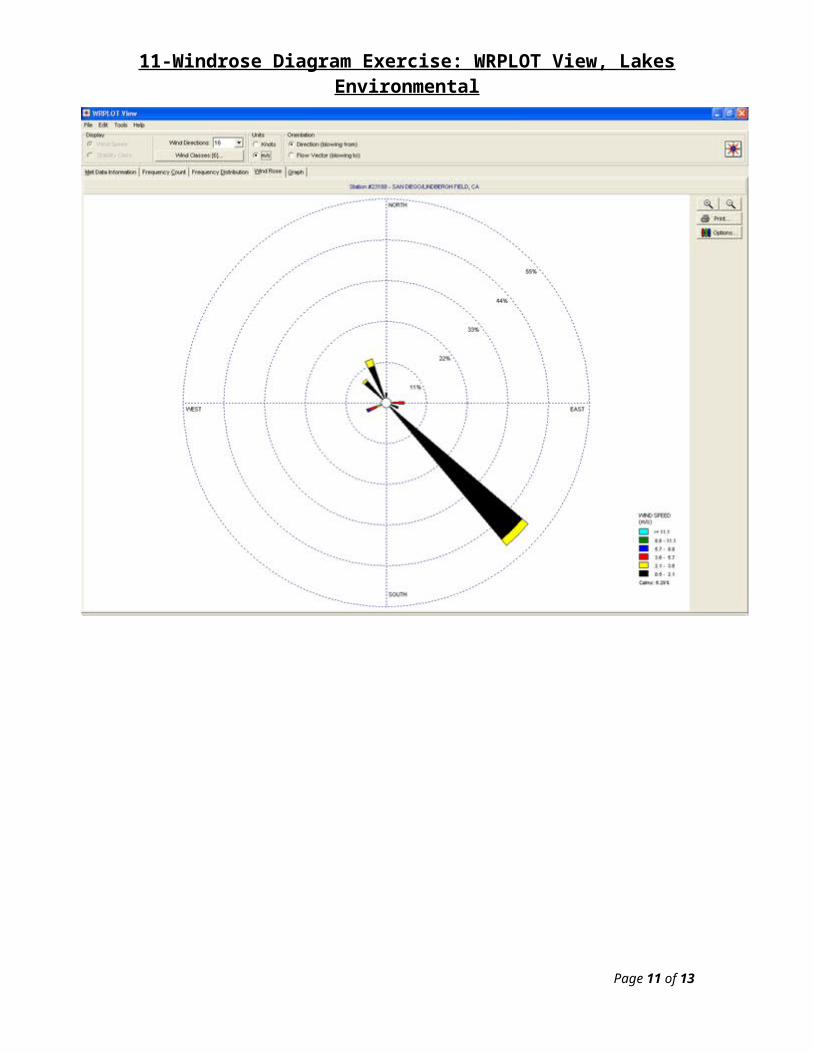
9. The “Wind Rose” and “Graph” tabs correspond to the Windrose diagram and the wind class frequency distribution graph, respectively. These files can be saved as either bitmaps or metafiles by selecting “Edit”, then “Copy to File”.
Page 8 of 11
Alternative User-defined stationa. Click on the “Station Information” tabb. Click on the “User-defined” tabc. Click on “Add” and enter the following data
Pechanga air monitoring stationStation ID: 1City: TemeculaState: CALat: 33.447867 NLong: 117.088649 W Time Zone: (8) PacificElevation: 358 m
11-Windrose Diagram Exercise: WRPLOT View, Lakes Environmental
Page 9 of 11
11-Windrose Diagram Exercise: WRPLOT View, Lakes Environmental
Similarly, the data displayed on the “Frequency Count” and “Frequency Distribution” tabs can be downloaded as .csv files by clicking on the download icon (see screenshot below).
Page 10 of 11
11-Windrose Diagram Exercise: WRPLOT View, Lakes Environmental
Interpretation:
Wind directionThe reported values which range from 0-360 relate to Azimuth degrees. These values can be translated into Cardinal directions as depicted in compass rose diagrams.
Wind classesWind classes can be reported in knots or in meters per second (m/s). WRPLOT View reports seven categories for wind speed:
Calms0.5-2.12.1-3.63.6-5.75.7-8.88.8-11.1≥11.1
Frequency distribution
The frequency distribution is reported in decimal form (ex: 0.12).
Page 11 of 11
Azimuth degrees Cardinal direction0۫ North90۫ East180۫ South270۫ West