11 - Welcome to VTrans | Agency of Transportation … · · 2013-05-19Agency using this report...
25
An Evaluation of the Constant Dry Weight Compaction Method Report 81-3 Apri 1, 1981 STATE OF VERMONT AGENCY OF TRANSPORTATION t1ATERIALS & RESEARCH DIVISION P.J. GARAHAN,P.E. ,SECRETARY OF TRANSPORTATION S.J. GAGE, P.E. ,DIRECTOR OF ENGINEERING & CONSTRUCTION R.F. NICHOLSON, P.E. ,WHERIALS & RESEARCH ENGINEER Prepared By C. H. Cookson Transportation Techn i cian
Transcript of 11 - Welcome to VTrans | Agency of Transportation … · · 2013-05-19Agency using this report...
An Evaluation of the Constant Dry Weight Compaction Method
Report 81-3 Apri 1 , 1981
STATE OF VERMONT AGENCY OF TRANSPORTATION
t1ATERIALS & RESEARCH DIVISION
P.J. GARAHAN,P.E. ,SECRETARY OF TRANSPORTATION S.J. GAGE, P.E. ,DIRECTOR OF ENGINEERING & CONSTRUCTION
R.F. NICHOLSON, P.E. ,WHERIALS & RESEARCH ENGINEER
Prepared By C. H. Cookson
Transportation Technician

TABLE OF CONTENTS
ABSTRACT . . .
INTRODUCTION.
THE PROC10~ METHOD.
THE CONSTANT DRY WEIGHT METHOD.
PHASE
Page 1
2
3
5
I Frequency of Construr.tion Compaction Test. Resu l ts . 6
II Side-by-Side Laboratory Compaction Tests. . 8
III Wet Density Comparison . 12
IV Pairs of Proctor Tests. . 14
V Optimum Moisture Estimation . 14
DISCUSSION . . . . . . .
CONCLUSIONS
APPENDI X ...
REFERENCES.
15
16
17
21

"The contents of this report reflect the views of the
authors \'Jho are res pons i b 1 e for the facts and the accuracy of
the data presented herein. This report does not constitute a
standard, specification, or regulation. Anyone, other than the
Agency using this report does so with awareness that the Agency
does not guarantee the opinions, findings, or conclusions
contained herei n. 11

ABSTRACT
There has been a need in the highway construction industry for a
rapid and economical method of compaction testing. 1\ method devel
oped by the Ontario Department of High1-1ays in the late 1960 1 s is
called the Constant Dry \4eight (CDH) compaction test. It is a
comparison of two volumes.
Thi s study has examined the merits from a precision standpoint
as well as a time saving method. A series of actual tests on a typical
construction project were tabulated and analyzed as \vell as laboratory
controlled comparisons. The Proctor method of test was used as a
standard comparison. Side-by- side tests, mol ding comparisons and
moisture estimations were considered.
The CDH method produces test results \·lhich are comparable to the
Proctor Method. It has the additional benefit of not needing a complete
evaluation (i.e. M-D curves, gradation, etc.) resulting in a cost savings.
1

INTRODUCTION
The success of a hi ghway building program depends on a good qual ity
contro l program of which embankment compaction testi ng is an integral part.
The const ruction industry has, in recent years, developed ne\'1 sophisticated
equipment which cuts building time cons iderabl y. In view of this, new
and faster methods of compact ion testing have been developed, and still
are being so ught . The best known of these i s the Proctor dry density
method of measuring field density of the embankment materia l. Nuc l ea r
non-destruct ive methods have recently been developed to a hi gh degree
of accuracy . Any nuclear system i s quite expensive initially to purchase,
but it can save time and labor because of t he number of tests which can
be pe rformed in a day's time.
A new method of promise ha s been developed in Canada by the Ontario
Mini stry of Transportation and Commun icat ion. It i s ca lled the Constant . Dry Weight (COW) rrethod and i s a var i at ion of the Standard Proctor Test,
AASHTO T-99, Method C. In the COW test, the percent of compaction i s
determined by comparing the in place volume of a soil sampl e with the
vo l ume of the same sampl e in the Proctor mo l d after sta ndard compaction
at abol:lt its optim1:1m mo is t~:~re, Sinc e no moist 11re calc!!latians are involved,
a cons iderable savi ngs of time i s r ealized in performing the test.
A project 1·1as undertaken to evaluate the constant dry \·Ie ight method
and to prove its 1·10rth as a rap id means of embankment test ing. The sand
cone Proctor test was used as a basis for comparison. The invest iga t ion was
divided into five phases. The f irst phase was to tabulate and ana lyze the
compact ion values of a construction project, in the form of a frequency
distribution, on which bot h t he Proctor test and the COW test were used.
2
The second phase involved pairs of the two compaction methods taken side
by-side in the lcboratory. The third phase \'las to determine the accuracy
of the dip stick wet density compared to the Proctor wet density. The
forth phase v1as to analyze paired compaction tests of the Proctor method.
The fifth phase was also done in the Centra l Lab and concerned the esti
mating of optimum moisture of various types of materials.
The comparison of the two methods requires an understanding of each
in order to make an intelligent eval uat ion. A brief description of each
method is included here I'Jith a step- by-step procedure.
THE PROCTOR METHOD
The standard of the industry is known as the Proctor dry dens ity
method l·lhic h was developed by R. R. Proctor in 1934. It is based on dry
unit weight of the mater ial. A series of moisture-density control curves
are constructed from representative mater i al s which will be encountered
on the project. They are used to determine the maximum density and opti
mum moisture of the test sample under cons iderati on. In order to construct
a moisture-density curve to comply with AASHTO designation T-99, it takes
parts of three consecutive days, or longer, if a clay type soil is involved.
Since no two sampl es of the same type of material are exact duplicates, the
curves are only good gu ides. They truly onl y represent the sample of
material from v1hich they v1ere developed. This test is, hovtever, the most
well known and has been successfully used throughout the industry.
A test hole is dug at the embankment s i te using standard equipment
and t he materi al returned to the mobile l aboratory and the in place density
calcula ted. After the moisture determination has been made, the material
is compacted into a Proctor mold using a standard compactive effort. The
3

molded unit dry density is determined as is its moisture content. These
values are pl otted on an appropriate moisture-density curve and the maxi
mum dry density and optimum moisture are determined. These maximum and
optimum values are related to the embankment values to calculate the
percent compaction and the moisture condition. This complete process will
take about forty-five minutes, depending on the distance from the site to
the mobile 1 a b.
The following is a general step by step descri ption of the Proctor
method. It is assJmed that all equipment and sand has been cali brated and
is ready for operation and al l necessary moisture-density curves have been
provided by the Central Laboratory.
1. Heigh sand j ug, f ul l.
2. Proceed to site and perform on s i te operations and return to lab.
3. Re-weigh sa nd jug to determi ne 1 oss of sand.
4. Determi ne hole vo lume us i ng the weight of lost sand and its density.
5. \leigh materia l taken from hole .
6. Determine its wet dens i ty.
7. Remove a rroisture sampl e and weigh.
8. Dry moisture sampl e.
9. Re-weigh mo i sture sample to determine loss of 1·1ater .
10. Calculate the percent moisture.
11 . Determine the dry density of the in place materia l .
12 . Compact the material into the Proctor mo l d usi ng standard effort.
13. We i gh mo l d and soil and determi ne the weight of the soi l .
14. Remove moisture sampl e from mol ded mater ia l and we i gh.
15. Dry mo i sture sample.
16. Re-weigh moisture sample to determi ne loss of water.
17. Calc ulate t he percent of moisture.
4

18. Determine the dry density of the molded material.
19. Choose an appropriate moisture-density curve and apply the molded
dry density and its moisture percent to determine the maximum
dry density and its optimum moisture.
20. Oetermire the percent compaction by dividing the field dry density
by the maximum dry density.
21. Determine the moisture condition by comparing the optimum moisture
to the field moisture.
THE CD\~ I~ETHOO
The COl~ 1·1ethod of testing was developed as a rap i d test for percent
compaction of highway embankments . It could be ca l led a volumetric test
since it compares volumes, not dry densities or moistures. The equipment
required for the test is the same as that for the Proctor method. The only
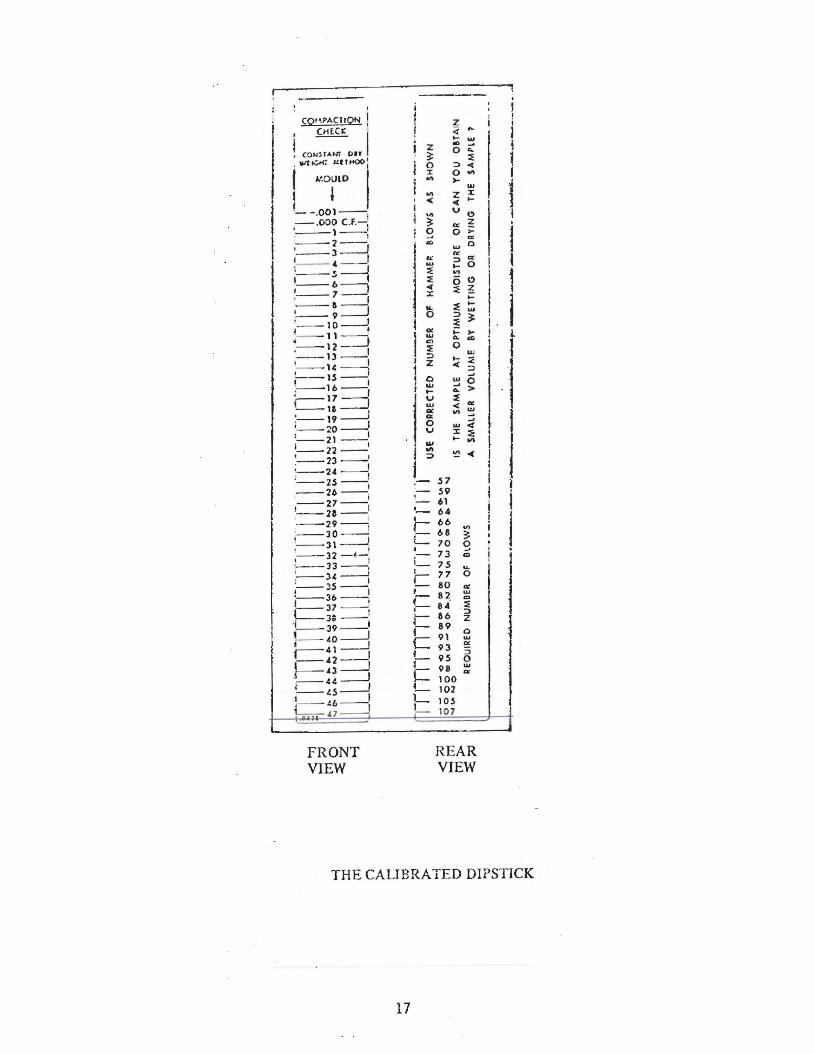
addition is the rreasuring device ca l led a ca l ibrated dipst i ck. The dipstick
is a six inch piece of pl astic whi ch has been divided on one side into units
of one one-thousandth of a cubic foot when used with a Proctor mo ld. The
other side of the dipstick is cal ibrated with the number of blows required
to achieve max i mum density based on hole volume. The divis i ons can be
estimated to one ten-thousandth of a cubic foot without any difficulty. This
d1pst1c1< 1s usea to determine the volume of 111ater ial con~pacted ifl tfle fflold.
A diagram of the di pst i ck can be found on page 21 of the Appendix.
The on site procedure is the same for this test as it is for the Proctor
test except that slightl y less material is taken for a sample from the
embankment. This is necessary because all of the material must be compacted
i nto the mold 1·1hereas for the Proctor method any excess materia l can be
di scarded. The completion of the test may be done at the mobi le soils lab,
5

or at the site. The material, after having been removed from the embankment,
is adjusted to contain about the optimum amount of moisture and compacted
into the Proctor mold. The compactive effort is determined from the volume
of the hole. After the molding is completed, the volume of the compacted
material is determined by use of the dipstick using four points around the
mold and one in the center. The resulting average of these values is divided
by the volume of the hole in the embankment; this is the embankment percent
compaction.
The whole procedure can be done in about ten minutes or less if done
at the site; if done at the soils l ab, it of course, depends on the travel
time.
The foll01·1ing is a general step-by-step description of the COW method.
1. Heigh sand jug, full.
2. Perform on-site operations.
3. Re-1·1e i gh sand jug to determine 1 oss of sand.
4. Determine hole volume us i ng the weight of lost sand and
its density.
5. Evaluate moisture condition and adjustto near optimum.
6. Com~act mater ial into Proctor mold.
7. Using the dipstick, determine the volume of material in the
8. Determine the percent compaction by dividing the volume of
the materi al in the mold by the volume of the hole.
PHASE I
ANALYSIS OF CONSTRUCTION COMPACTION TEST RESULTS
A typical interstate highway construction project was chosen where both
Proctor and Constant Dry Weight compaction testing methods were used at random
6

throughout the season. The test values were tabulated into a frequency
distribution with a one percent i nterval value as shown in Table II, page
9. The purpose of this distribution was to see if there was any simi l arity
in the occurrence of passing and failing test values bet\oJeen the Proctor
density method and the COW method of compaction testing. The materials
tested were most ly of a granul ar nature, although a fair number fel l into
the silt range. All t he tests \'tere performed by the same person l'lhich l'toul d
remove any personal bias that coul d influence the resulti ng values. The
embankments were all constructed in the standard manner using conventional
compacting equi pment. Moisture wa s not a problem since most of the embankments
were made from dry, well drained materials.
All of the t ests were performed at the mobile t est ing laborato ry in
order to minimize any incons i stencies in weighing and molding. The same
field equi pment was used in taking the tests as well as the same l ab equ ip
ment. Standard Ottawa sand meet ing'ASTM designati on C-190 was used and was
calibrated regularly.
Test sites were not chosen in ·order to provide directly comparable.
test results. The choi ce of test sites wa s of a random nature and equa l
ca re 1;1as taken in the processing of each test. The t1·10 methods may or may
not have been done at the same time or the same pl ace; only as chance \'IOu ld
have it.
There were a total of 791 Proctor tests and 595 consta nt dry weight
tests performed. Table I on page 8 provides a breakdown of test result s
obtained fro~ eaGh of the methods in a co~paratfve form.
7

TABLE I
Proctor cow
Total Number of Tests in Frequency 791 595
Number of tests passing 757 574
Number of tests fa i 1 i ng 34 21
Percent of tests failing 4.3 3.6
t1ean 94.3 94.2
Standard Deviatior. 3,7 3.4
The soil types on this project were fairly uniform so it would be logical to
assume that there is no variation due to soil types. Mathematical analysis shows
that the mean of the frequency of pass I fail results does not differ significantly
with test type. The standard deviations of 3.4 and 3.7 percent are in close agreement.
These results compare favorably with the results of a study done by the Ontario
Ministry of Transportation and Communications. The Ontario study shows that the COW
test produced a range of standard deviation of 2.3 to 2.5 percent while the 1 standard P.roctor results produced a range of 2.0 to 2.7 percent. The ranges
encompass standard deviations for three different soil types.
PHASE II
SIDE-BY-SIDE l ABORATORY COMPACTION TESTS
As with any comparison testing the ideal is to have identi cal test conditions.
In practical application this is difficult. To provide conditions ~s nearly ident
ical as possible a container large enough accommodate two sand cones and plates,
side by side, with an adequate quantity of soi l was necessary.
1R. SHONFELD, 11 The Constant Dry ~teight Method - A No-Weighing Fi eld Compaction
Test, 11 DHO Report No. RR 141, Ontario Department of Highways, (September, 1968)
Table4,P17. 8

TABLE II
PERCENT OF TOTAL TESTS BY COMPACTION t~ETIIOD
Percent Com~a ct ion Proctor CD\ol
90% 11.9 15.9
91 11.4 7.6
92 8.7 9.5
93 10.6 1 0. 5
94 10.4 10.8
95 9.6 10.0
96 7.7 9.0
97 6.6 8.1
98 7.8 7. 1
99 5.2 5.9
100 4. 7 2.2
1 01 1.0 0
1 02 0
1 03
9

A rectangular box was constructed of three-quarter inch marine ply
wood and coated with several l ayers of epoxy pai nt inside and out. The
dimensions of the box were twelve by tl-tenty i nches and eight inches deep.
Sturdy two by four inch handles were at t ached to the outside for li fting.
The handles also reinforced the sides to prevent bulging when compacting
the so il . f\ removable col l ar s i mi l ar to that of a Proctor mold 1-1as made
to fit ever the top of the box.
f\ fa lling hammer arrangement on a vertica l steel shaft was built to
provide the compactivc effor t. A flat four by four inch by half inch
steel pad was attached to the bottom of the steel s haft. A s i x inch pad
1·1as first used, but it did not transmit enough energy to the so il and
proved to be cumbersome to operate. no attempt 1-1as made to 1·1ei gh the
hammer or calculate the amo unt of energy created .
The r ema i ning equipment used 1·1as Standard Proctor test in g equipment
1·1ith the exception of a Fairbanks pl atform scale for 1·1eighing the full box
of so il and a COW dipstick.
The objective in using the box mold i s to provide a container for the
soil. The soil 1·1as compacted as uniformly as poss i bl e so t hat all areas
were as close to the same density as poss i ble. The soil was pl aced in the
box iR five ~o~niform layers and tamped 1vitb thirty-nine blows of the hammer.
The so il extended up into the collar and was leveled with a stra ight
edge in a manner s imilar to the Proctor mold procedure.
In the beginning t he blows were distributed evenly over the sur face of
the so i l . It 1-1as subsequently discovered that the so il density wa s higher
in the center of the box than on the edges , apparentl y due to the resistance
of the s ides of the box. The pattern of the blows was cha nged so that more
effort was placed on the edges of each layer. This seemed to correct the
problem. The thirty-nine blo\-tS 1.,ras chosen because it put the percent
10
compact ion i n t he ninety percent range.
A quantity of so i l of different types was col l ected sufficient to
fi ll t he box with some left over. It was thoroughl y mi xed at low moisture
content i n order t hat it be uniform throughout. Sampl es \·Jere taken for a
Proctor moisture- dens i ty cur ve and for cl ass i ficat ion. Just prior to mo l di ng ,
t he moisture content was raised to near opt i mum as determi ned by the mo i sture
density curve. Once the des i red mo i sture content v1as obtai ned, it vJas
entered on the wor k sheet dur i ng the t est p~ocedure. A moisture determinat i on
1·:as made for eac h test i n the set. It v1as found that the mate r ia l did dry
out some1·1hat dur i ng t he day' s t est ing .
After eac h set of tests 1·tas compl eted, the box v:as emptied, the soi l
thoroughly r e-mixed and the process repeated .
S~vera l so il types were used in t he study . These were chosen at random
and wer e t ypical of the so il s in the sta t e whi ch wo uld be encountered dur ing
a construct ion project.
All data obtained from the test in g was tabulated on wo r k sheets . This
inc luded t he box v1et dens ity, v1et and dr y density from bot h the COH and
Proctor me thods , t he mo l ded wet density of both methods , t he dry dens i ty
of eac h m~thod and of pri me i nterest , the percent compaction.
There \tlere two main concerns of thi s phase of testing. The first was a
comparison of the percent compact ion determinations obtained from each of the
test methods and the second was t he reliability of the "dipstick" method of
measuring mold volume .
Pairs of tests were run and t he difference in percent compaction determin
ation were analyzed. The evalua t ion, broken down by soil t ype, of these
differences is s hown in TABLE III following.
11

TABLE I I I
Soi 1 Type t·:ean Difference Std . Oev i at ion JJ of Sampl es r.
A-4 Si lt 0.45 l. 67 23
/\-1-b Sa nd -0.32 1. 4t1 28
A- 2- t1 tlix 0. 40 1.35 25
A-2- 4 Sand 0.85 1. 71 36 A-2- 4 Sil ty Sand - 0.06 1.19 15
Total Combined Sar:1ples 0.1\5 1. 67 127
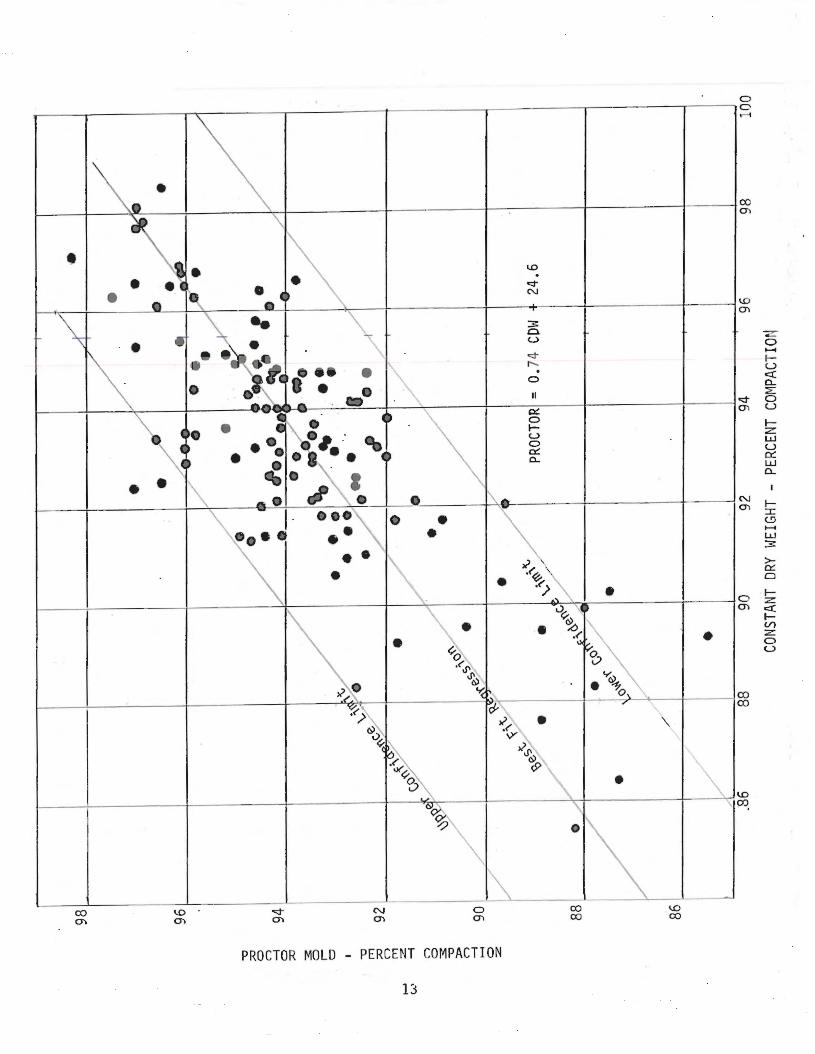
Figure l i s a graph of the percent compaction results obtai ned by the Proctor
method versus the results obtained by the Constant Dry lrleight t1ethod.
The best-fit regression has been plotted along with the confidence limi ts.
PHASE II I
WE T DENSITY COMPARISON
rhe results of the differences obtained from the wet density moldings
of the Proctor method versus that of the COW method are li sted in the
fo ll owi ng table:
Soil Type Mean Difference Std. Devia t ion If of Sampl es
fl-4 Silt - 0.56 1. 09 21 fl-1-b Sand - 1 • 92 1. 92 28 A-2-4 MiX -0.03 1.24 25 fl-2-4 Sa nd - 1.22 1. 62 36 A-?-4 <:;iltv Snnrf -0.43 1. 06 14 Total -0 .95 1. 62 124
Mathemati cal Analysis of the results revealed the following . The diff
erence between so i l types i s stati sticall y s i gn i fica nt . Although the mean
differs signi ficant l y from zero and t here i s a statistica l difference be-
tween soil types, t he differences in the means are experimentally insi gn i fica nt .
According to ASTM 0698, the s ingle operator precis ion for molded wet
density i s 1.9% of the value obtained. Thi s is a greater figure than the
amount by which confidence in t he table above or t he difference between soil
types. 12
\ . . • :;
• • \ \ . •
co 0'1
~ • •
• ~
• • • • • I'-
'\ ,,
~·\ • 4 • .. "\_
• • .. ,. •••• • • • \ • ·-· - -l . 4 • \ • ~~ ..... ••• • • .: • I .... ., . • I • • •••• .. ~\ •• •
•• I\ • \. .
\ • c::-0 ..... J'
J'~ "(
~' ·,>~
~...., ~
~. ·~~
- - ----N 0'1
c::-0. v J .
"()I~
%
0 0'1
1.0 . q-N
:::;: 0. u q-r--. . 0
II
QC 0 1-u 0 0:: 0..
.. ... ·~
-.?
• ..... ~ . .... /A, \ •
.._," ~
• ~ ·~ ;;,0 • v
.... e'%:
~. o, '0-~ .... • ..,y '
-.?J'
~
\ • \
\__ _ ._ ~---co co
PROCTOR MOLD - PERCENT COMPACTION
0 0 .....
co 0'1
1.0 0'1
q-0'1
N 0'1
0 0'1
co co
-z-0 ..... 1-u ex:: 0.. :a: 0 u 1-z: UJ u 0:: UJ 0..
1-:X: (.!) ..... UJ :::;:
>-0:: Cl
1-z: ex:: 1-tn :z 0 u

PHASE IV
PAIRS OF PROCTOR TESTS
The differences between standard Proctor job and progress compaction tests
1·1ere analyzed for 206 samples. These tests are done side-by-side, simultan
eously as part of an assurance testing program. A standard deviation of 1 .8
was obtained which is 4 t i mes the average difference between the
Proctor and the COW percent compact ion, as shown on page 12.
PHASE V
OPTJt.1UI~ 1·10ISTURE ESTIMI\TION
A sma l l project was set up i n the Central Laboratory to determine how
near optimum t he mo i stur e of a soil sampl e coul d be estimated by an exper
i enced compaction i nspector. The onl y cri teri a a l lowed were t he abili ty
to observe by handli ng , squeez ing, and s haking. Four samples of di fferent
mate r ials we re air dri ed and each person adjusted the water content unti l
they felt that the mater i al had reached i ts optimum. The soi l s ranged f rom
an A-~ si l t to an A-l-b coarse sand.
A total of ei ghteen sepa rate tests were performed by a group of
five experienced compact i on personnel. Arrangements were made to see to i t
that the results 1·1ere nnt knmm until all the testing had hero performed
This removed any i nfluence of one person ' s opinion on another. A standard
mo i sture-dens i ty cur ve was co nstr ucted for each materia l and was used to
establish t he optimum moisture of each.
lt 1·1as demo nstrated that ei ghty-three percent of the est imates of these
persons were within two percent of optimum. The results also showed that
slightly over ha l f of the test results 1-1ere on the dry side of optimun. Of
the estim.Jtes v1hich 1·1ere less than opt i mum, the average diff<?rc:nce 1·1as 1 .8
percent; those above optimum averaged 0. 6 percent.
14

The overall average difference from optimum moisture for all samples
was -0.9 percent.
DISCUSSION
The frequency and occurrence of pass I fail results on an actual
construction job was compiled from test reports. There was no si gnificant
difference in the frequency of pass I fail results attributable to test method.
In general it appeared that an experi enced compaction testor is able
to estimate optimum moisture levels for various soil types within a reasonable
degree of accuracy.
The wet density comparison established that the use of the dipstick for
volume determination is feasible and accurate. This point is essential
to the use of this test.(CDW)
The lesser number of procedural steps in the COW vs Proctor tests allows
fewer opportunities for error.
The 21 steps in the Proctor method do not include the steps necessary
to construct the moisture-density curve at the laboratory. It must also be
noted that the sample submi tted for a moisture-density curve may not exactly
duplicate the embankment being tested. It is not possibl e to have a curve
for each and every different soil on a project and it is often necessary to
11 find a curve that fits 11 a particular sample. A materia l i s fitted to a curve
by using its molded moisture-density relationship and apparent so il type. Time
does not permit a compl ete analysis of a material from an embankment. The
analysis is done vi sually and its accuracy depends upon the judgement and
experience of the inspector.
The COW method involves the comparison of one volume from an embankment
with a standard volume for comparison. It i s dependent upon the ski ll and
experience of the operator to correctly estimate 11 optimum moisture 11•
There i s a substantil sav ing of time possible with COW due part i ally
to the fewer steps and partially because all operations can be done at or near
15
the test site thus affording the operator greater opportunity to supervise
the filling operation and reducing travel time.
CONCLUSION
From this study it is apparent that the COW test is a viable alternative
to the Standard Proctor Method when employed by an experienced inspector.
16

A P P E N D I X
!
t
(01\PACTIQN I 1
CHECI: •
! CONHANI P lY I 'IWZ~ IL.!Ttt01> 1
I ~OULP
' 1 I --.001~
1-.000 C.F. I .---1--1 ---'2--·---l ___j , __ , ___j
:--.5--{ ,--6=::] ,--1 I --a I ~-- 9 ·-- I O__J I I 4--1 1 I .--12 I --13 --:--u ----{ --1.5 --1--16--1 ' I {--17 l --I& :--19 ___j ·--20 ___j 1--2 1--1
1--22--1
·--23 --1
;--'24 --1 ;--2.5 --' --26 --
1 • I ,--27 --, --23 - -• I --29 ----"1 ·--30--·--JI--' ' I ,--32 -4-, :--- 33 --, --J~ -----1 '--:1.5 --' !--36-- 1
'--37 --! L--Ja--1
·L-39-- 1 1-- tO ___j r-41 ___~ --42 ----' }--43--1 - -H ___j 1- - ts ----' ~t6 I L-- 47
FRONT VIEW
z 3: 0 :I:
"' "' -<
"' 3: l 0 ~ .. "' w ~ ~ -< ::z: ... 0
I a: w
I 0
~
l :::.
1 z
I 0 j w I ...
j v w at a: 0 v w
l "' :::.
j -
·-I r L_
' -I
I I ~-,-·-l ,-t= I l ,-I 1 ,
z < ... ._ ... -0 ...
~ :::. -< 0 "' ...
w z ::z: -< v ~
"" ~ 0 >-a:
w 0
"" :::. "' ... 0
6 ~ ~ z
;::: ::!:
._ .... :::. 3: ~ ... ,_ ... ... 0
w ... :c -< :I w 0 .... ... > ~
"' < "' "' -.... .... < ::z: ::!: ...
"' ~ -<
.5 7 .5 9 61 6 4 6 6 6 8 ~ 70 g 73 "' 7.5 u. 77 0 110 "' 82.
w ... 8 -4 ~
8 6 :I z 8 9
0 9 1 w
9 3 cr: ::I
9 .5 0 98 w
Cit
100 102 105 107
REAR VIEW
I ! I
l ! l I j 1 I . t
I l I 1 I I I I l.
I
l
THE CALIBRATE D DIPSTICK
17

C. D.W. RESEARCH
"i::S 'i' o '{
.,_
I
I I
I I I l l ......
co '
Percent % x weight
Pan
Pan & Soil
No . blows per layer
Dipstick readings: 1
2
3
4
5
Total of readings
Average
Mold Correction
Corr. r eading
Wet Density
lOS lC O 97
-·-'
26+2 5 24+1
It- ·
STATE OF VEi\!10:-.."t DEPARTI::S~rr OF HIGlillAYS
SOILS L:\DCRATORY
COi·~!.CTION TEST \·:CRl~ SHEET Cm!STA!U DRY- \·,'E lGlrr NETHOD
DATE
95 9~ 90
23+1 22+2 22+1
87 85 .
22 .. 21+1
Soil Type: % Stone:
Sand: Silt:
Wet Density: Wt. of Soil:
83
20+1.
•
- -
80
19+2
77 I . I . I
19
I
I I
I I
I . I . :
I I I I : I J

-1.0
! I I I
OJ ~GT:
DY:
1. Test No.
2. Station
"\ (')ff!':Pt
4. Depth Bclm-r Sub2rade
5. Soil Type ·
6. Wst . Sand Jug (uefore)
7. Wgt, Sand 'Jug (aft e r )
8. W~t. Sand Used (6- 7)
9. Cone Corr ection . lQ, Net Sand in....fu>.JP f~_q,
11. Sand Dcnsitv . 12. Net Hole Volume (lQ.;.ll'
13. Dipstick Readin2s 1.
2.
3.
4.-
s. 14. Total of Readings
f---l...S.....__AY.C r . YoJ..ur~cl inc 16. ! Cocpaction {15~12)
17. t~iGture Condition ~ --
~
-
VER.HONT AGENCY OF TRAK3?0RJ.'A7ION MATERIALS & RESEARCH DIVISION
CON'fRACl'OR· . . .
'
'
.
---- ------ - - --- ---- -
'
I
I i
I
I
l
I
' I I I I . I '
i I I
I
I
I
I I
I
Slate of Vermont
AGENCY OF TRANSPORTATION
MATERIALS DIVISION- SOILS SUBDIVISION
COMPACTION TEST WORK SH EET
PROJECT -------------------------r--------------~ CONTRACTOR. _____________ _
TEST BY
In-Place Density
l 1. Test No. 1
2. Wgc. Sand Jug (Defore) T I I I
I I - i
I I i
-3. Wgc. Sand Jug (After ) I 1
<i. _Wgr. Sand Used (2- 3) I 5. Cone Correction I . I
G. Ncr Sand in Hole ( 4 - 5) I 7. Sand Density l I I -
I I I I I I 9. Wgr. Soil -1- Sample Can J I 8. Net Hole Volume (6-:- 7) I
I I I I I I 1 -1~-· -~_prt. S~mplc Can 1_ ____ +-+'-----
11. Wgr. Sou (9 - 10) I · I I I I I I r----~---~---·-- - .
i I . I
12. W cr Density (11 -:-- 8) I , ' --- - ---~---+-;.------+--
-__ --- ~ --·-·
- .. I
13. Wgr. Plus X" -+- s;,.v,. ~ · iT"'wg;-s-iev,.
I 1s. Wgt. Plus W' (13 - 14 )
16. %Plus X" (15 -:- 11 ) (100) I I 17. Corr. Wet Density I I I
I I I .I _j__ 18. 100 + % Moisture• 19. Dry Density• •
In-Place Moisture
1. Test No. I I I I 1 2. Can No. I I' ---- -~- I 3. Wgt. Can & Soil & Water I I I I 1\. Wgt. Can & Soil (Dry) I -5~0 gr. Can I -()_-w-g'Z"War~(3- 4) I
7. Wgr. Soil (4 - 5) I I I I I I R. % Moisture (6-:- 7 ) (100) I 1_1 __ ~-----_,_] __ __,_ __
HD 181 SM 3-74
Report Data
1. Test No. ---------- I I
I I 2. Station -··
I I 3. Offset 4. Depth Below Sub-Grade I I 5. Curve No. - - -·- -··-· I I 6. I Soil Type
_?~aximum Density I I 8. Optimum Moisture I I 9. Field Moisntce Condition I I ------
10. % Compaction I I
Moisture-Density Check Point
1. Test No. I 2. Wgc. Mold & Soil il 3. Wgt. Mold I
· :r-wgt. Soit <2 - 3> 5. Can No. 6. Wgc. Can & Soil & Water I 7. - Wgc. Can & Soil (Dry ) I 8. Wgt. Can 9. Wgc. Water (6 - 7) I
10. Wgt. Soil (7 - 8) I 11. % Moisru.re (9 -:-- 10) (100) i 12. Dry Density• • • I .
• "!o Dry Moisture from No. 8 of In-Place Moisture Test •• Dry Delllllty = <Corr. Wet Density + No. 18! <100) ••• Dry Delllllty = (No. 4 X 3000) + (100 + No. 11)
I I I
I I I I I I I I
I
I I
I I l I I I
I I I I I I I I I I I I
I I I
I
I I I
. I I I
I I
I
I I I I I
I I . I I

REFERENCES
AMERICAN SOCIETY FOR TESTING AND MATERIALS (1980), "Soil and Rock; Building Stones," Annual Book of ASTM Standards, Part 19, Philadelphia, pp. 201-207.
ANDERSON, T.W., AND SCLOVE, S.L. (1974), "Introductory Statistical Analysis, " Houghton Mifflin Company, Boston, 499 pp.
HOUGH, B.K. (1957), "Basic Soils Engineering,'' Ronald Press, New York, 513 pp.
SCHONFELD, R. (1968) , "The Constant Dry ~Ieig ht Method- A No-Heighing Field Compaction ~1ethod, " Department of Highways, Ontario, Report RR 141, 21 pp.
TAYLOR, D.~~ . (1960) , "Fundamenta 1 s of Soi l s t;lechani cs," John Wil ey & Sons, New York, 11 th Edi ti on, 700 pp.
WALPOLE, R.E., and MYERS, R. H. (1972), "Proba bi l ity and Stati stics For Engi neers and Sc i enti sts, " Macmill ia n Publicat ions, New Yor k, 506 pp.