

11, This category includes E'l'fs that primarily invest in U.S. government agency pass-through MBS...
27
Transcript of 11, This category includes E'l'fs that primarily invest in U.S. government agency pass-through MBS...
Mr. Brent]. Fields
August 17,2015
Page4of21
The study also finds that price discovery increases with assets under management ("AUM") in
all of the asset classes examined. Specifically, the study indicates that price discovery explains more of
the movements in premiums and discounts oflarger ETFs than for smaller ETFs for domestic equity,
international equity, domestic fixed income, and international fixed income ETFs.
Some academic studies suggest that ETFs transmit non-fundamental return volatility to their
underlying securities. For example, a 2015 Ben-David, Franzoni, and Moussawi paper reports evidence
suggesting that the higher the percentage of a stock held by ETFs, the higher that stock's return
volatility.8 We believe such results should be treated with caution and require further study. For
instance, ETFs' proportion of stock market capitalization has been trending up for many years without
creating an obvious upward trend in market volatility. Domestic equity ETFs' share of the total market
value of the NYSE and NASDAQ rose from about 'it percent in January 2001 to 4.72 percent by J nne
2015. In contrast, stock market volatility, as measured by the VIX, though varying widely over the
period-rising sharply during the financial crisis and subsequently falling-was essentially trendless. It is, therefore, not surprising that the authors report summary statistics showing essentially no
correlation between ETF ownership and daily stock price volatility.9 This result is difficult to reconcile
with their other, more complex regression analysis, which indicates that ETF ownership has a
statistically significant impact on a stock's return volatility.
As noted above, the models necessary to study the ETF arbitrage function, price discovery, and
transmission to underlying securities are complicated and the results can be difficult to assess. Often,
initial insight to these thorny issues may be gleaned from simpler approaches, which we attempt to do
in the following discussion.
2. The impact ofmarket participants' arbitrage on trading of portfolio securities held in
ETFs.
In this section, we address questions regarding the role that primary market activity-the sum
of gross creations and gross redemptions-may play in the markets for ETF portfolio securities. We
also seek to respond to the SEC's request for information about the trading ofETFs that invest in less
liquid assets. The SEC focuses on fixed income instruments and, accordingly, our analysis is ofbond
ETFs.
ETF primary activity captures both arbitrage activity (that is, the financial incentive for the AP
(or its customer) to engage in creations or redemptions with the ETF to capture differences in value
between the ETF's secondary market shares and the assets comprising its creation or redemption
basket) and sudden changes in demand for an ETF's shares that can arise from exogenous changes in
market conditions. We examine four categories of domestic bond ETFs-ETFs investing in U.S.
8 See I. Ben-David, F. Franzoni, and R. i\ioussawi, "Do ETFs Increase Volatility?" (March 20 15), available at
http-//www.sec.g.ov/commenrs/s7-ll-15/s71115-l pdf.
9 See id. at 45, Table 3, Pand 13.
Mr. Brent]. Fields
August 17,2015
Page 7 of21
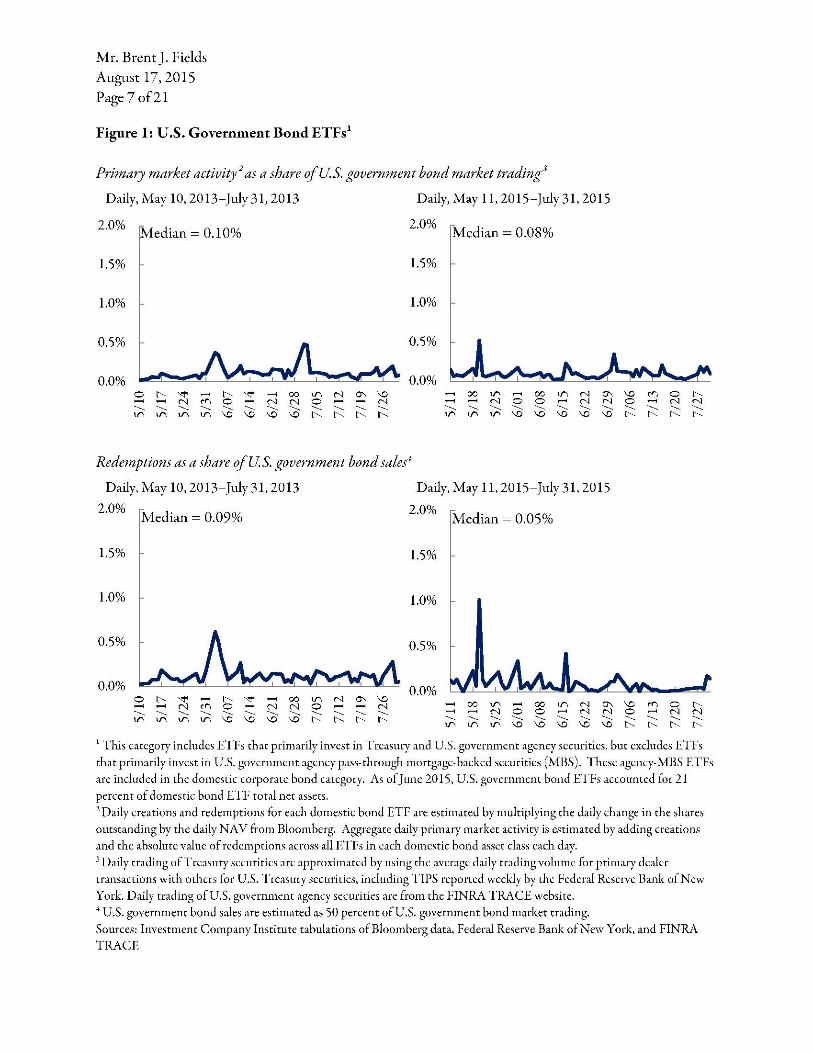
Figure 1: U.S. Government BondETFs1
Prima't')' market activity 2 as a share of U.S. government bond market trading3
Daily, May 10, 2013-July31, 2013 Daily, May 11, 2015-July 31,2015
2.0% Median= 0.10%
2.0% Median = 0.08%
1.5% 1.5%
1.0% 1.0%
0.5% 0.5%
0.0% 0.0%
Redemptions as a share ofU S. government bond sales1
Daily, May 10, 2013-July 31,2013 Daily, May 11, 2015-July 31,2015
2.0% Median= 0.09%
2.0% Median = 0.05%
1.5% 1.5%
1.0% 1.0%
0.5% 0.5%
0.0% 0.0%
1 This category includes ETFs chat primarily invest in Treasury and U.S. government agency securities, buc excludes ETFs chat primarily invest in U.S. government agency pass-through mortgage-backed securities (MBS). These agency-MBS fTFs
are included in the domestic corporate bond category. As of)une 2015, U.S. government bond ETfs accounted for 21 percent of domestic bond ETf total net assets. 2 Daily creations and redemptions for each domestic bond ETF are estimated by multiplying the daily change in the shares
outstanding by the daily NAY from Bloomberg. Aggregate daily primary market activity is estimated by adding creations and the ~tbsolute value of redemptions across ~Jl ETFs in each domestic bond asset class c;tch day. 3 Daily trading ofT reasury securities arc approxinutcd by using the average LLtily trading volume for primary dealer transactions with others for U.S. Treasury securities, including TIPS reported weekly by the federal Reserve Bank of New
York. Daily trading of U.S. government agency securities are from the HNRA TRACE website. 4 U.S. government bond sales are estimated as 50 percent of U.S. government bond market trading.
Sources: Investment Company Institute tabulations of Bloomberg data, Federal Reserve Bank of New York, and FINRA
TRACE
Mr. Brent]. Fields August 17,2015 Page 9 of21
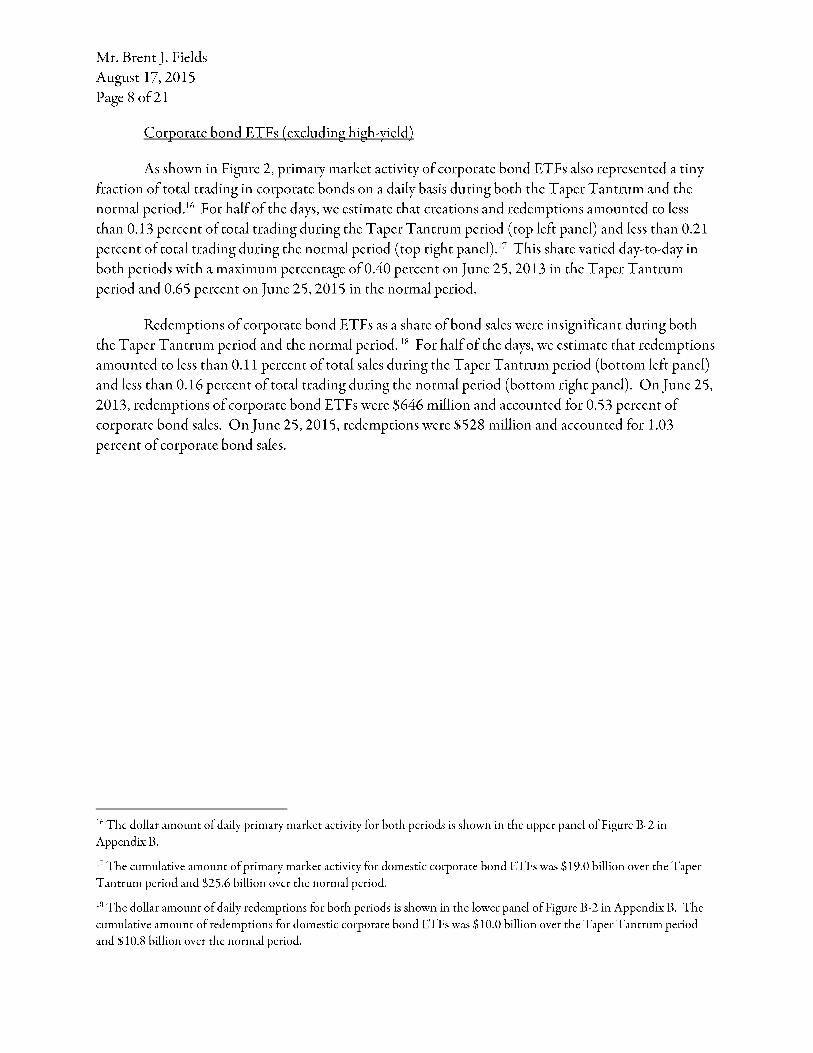
Figure 2: Corporate Bond ETFs1 (excluding high~yield)
Prima't')' market activity 2 as a share of dornestic corporate bond market trading3
Daily, May 10, 2013-July 31,2013 Daily, May 11, 2015-July 31,2015
2.0% Median= 0.13% 2.0% Median= 0.21%
1.5% 1.5%
1.0% 1.0%
0.5% 0.5%
0.0% 0.0% 0 1:'--. '<!' ....... 1:'--. "~' 00 if\ N G'\ \.0 ....... ,...... N rr, 0 ....... N N 0 ....... ,...... N -...._ -...._ -...._ -...._ -...._ -...._ -...._ -...._ -...._ -...._ -...._ -...._ if\ if\ if\ If\ \.0 \.0 \0 \.0 1:'--. 1:'--. 1:'--. 1:'--.
....... 00 lr\ ....... 00 if\ N G'\ ....... ,..... N 0 0 ....... N N -...._ -...._ -...._ -...._ -...._ -...._ -...._ -...._ if\ if\ If\ \.0 \.0 \.0 \0 \.0
Redemptions as a share o_( domestic corporate bond sales1
Daily, May 10, 2013-July 31,2013 Daily, May 11, 2015-July 31,2015
2.0% Median= 0.11%
2.0% Median= 0.16%
1.5% 1.5%
1.0% 1.0%
0.5% 0.5%
0.0% 0.0%
\0 rr, 0 1:'--. 0 ,..... N N -...._ -...._ -...._ -...._ 1:'--. 1:'--. 1:'--. 1:'--.
1 This category includes E'l'fs that primarily invest in U.S. government agency pass-through MBS and excludes ET.Fs that primarily invest in bank loans and ETFs that primarily invest in high-yield bonds. ETFs that primarily invest in high-yield
bonds are analyzed separately. As of]une 2015, domestic corporate bond ETFs accounted for 59 percent of domestic bond
ETF total net assets. 2 D~tily creations and redemptions fi>r each domestic bond ETF arc estimated by multiplying the daily clungc in the shares
outstanding by the daily NA V from Bloomberg. Aggregate daily primary market activity is computed by adding creations and the absolute value of redemptions across all E' 1 '.Fs in each domestic bond asset class each day. 3 Daily trading of domestic corporate bonds is the sum of daily trading of agency and non-agency MBS, other asset-backed
bonds, and corporate bonds, excluding high-yield bonds from FINRA TRACE. 4 Domestic corporate bond sales arc estimated as SO percent of domestic corporate bond market trading.
Sources: Investment Comp~my Institute tabulations ofl3loombcrg ~md FINRA TRACE data ~md FINRA TRACE.
Mr. Brent]. Fields August 17,2015 Page 11 of21
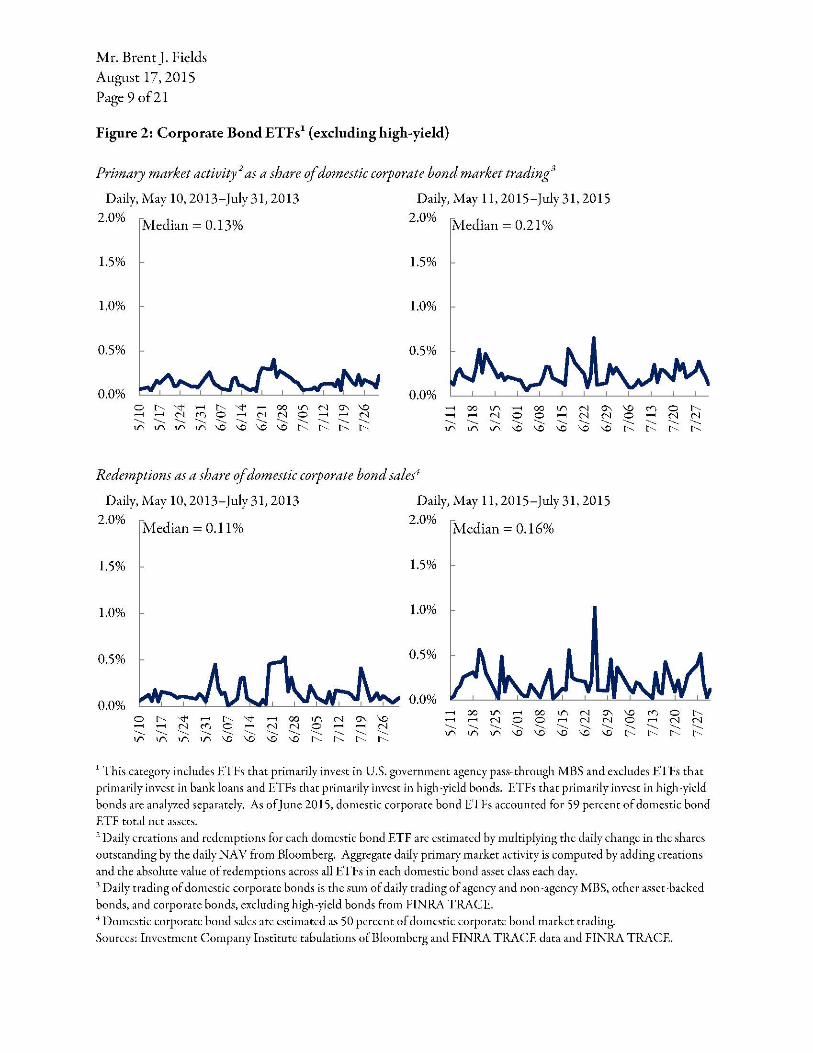
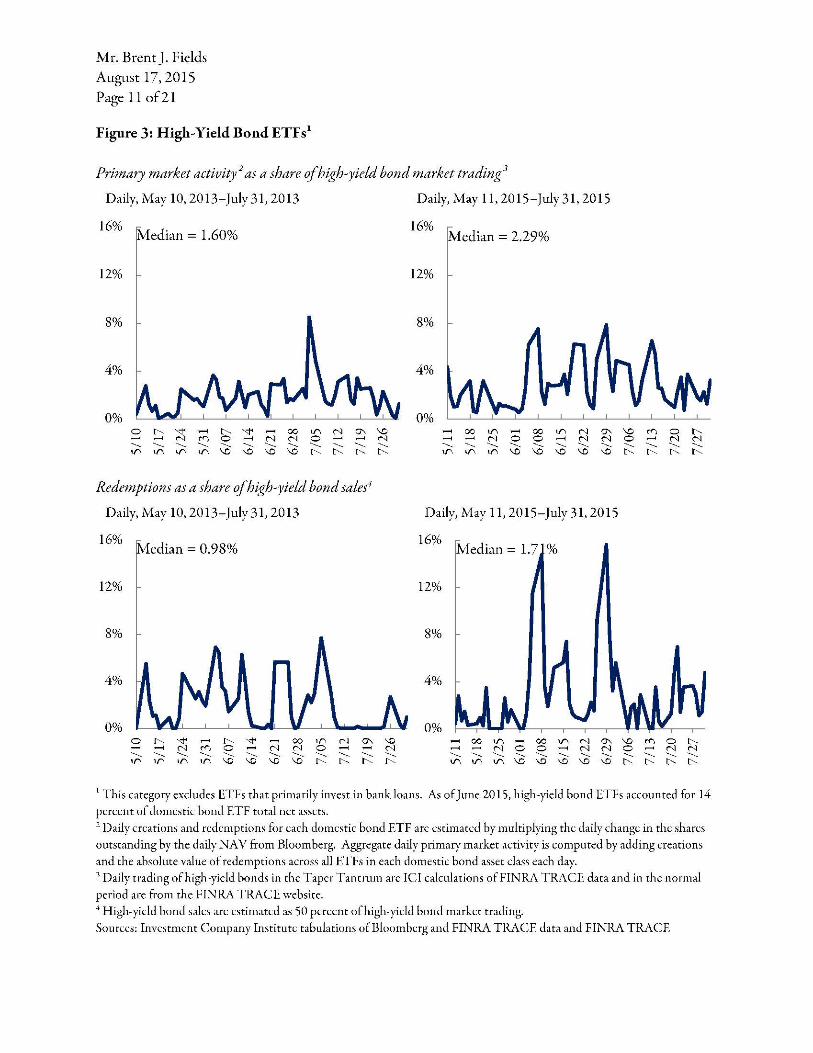
Figure 3: High~ Yield Bond ETFs1
Prima't')' market activity 2 as a share ofhigh~yield bond market trading3
Daily, May 10, 2013-July 31, 2013 Daily, May 11, 2015-July 31, 2015
16% edian = 1.60%
12%
8%
4%
0%
Redemptions as a share ofhigh~yield bond sales4
Daily, May 10, 2013-July 31,2013
16%
12%
8%
4%
0%
edian = 0.98%
0 ~ ~ ~ ~ ~ - 00 ~ N ~ ~ ~ - N ~ 0 - N N 0 - ~ N
.............._ ............_ ...._ ............_ ...._ ...._ ....._ ............_ ....._ ...._ --.. ...._ ~ ~ ~ ~ ~ ~ ~ ~ ~ ~ ~ ~
16% edian = 2.29%
12%
8%
4%
0%
Daily, May 11, 2015-July 31,2015
16% Median= 1.7 %
12%
8%
4%
0%
1 This category excludes ETFs that primarily invest in bank loans. As ofJune 2015, high-yield bond ETFs accounted for 14 percent of domestic bond ETF total nee ~tsscts. 2 D~tily creations and redemptions fi>r each domestic bond ETF arc csrimarcd by multiplying the daily cl1<1ngc in the shares outstanding by the daily NA V from Bloomberg. Aggregate daily primary market activity is computed by adding creations
and the absolute value of redemptions across all E l '.Fs in each domestic bond asset class each day. 3 Daily trading of high-yield bonds in the Taper Tantrum are ICI calculations ofFINRA TRACE data and in the normal
period are from the FINRA TRACE website. 4 High-yield bond sales arc estimated as 50 percent ofhigh-yidd bond marker trading. Sources: Investment Company Institute tabulations ofl3loombcrg md FINRA TRACE data and FINRA TRACE
Mr. Brent]. Fields August 17,2015 Page 13 of21
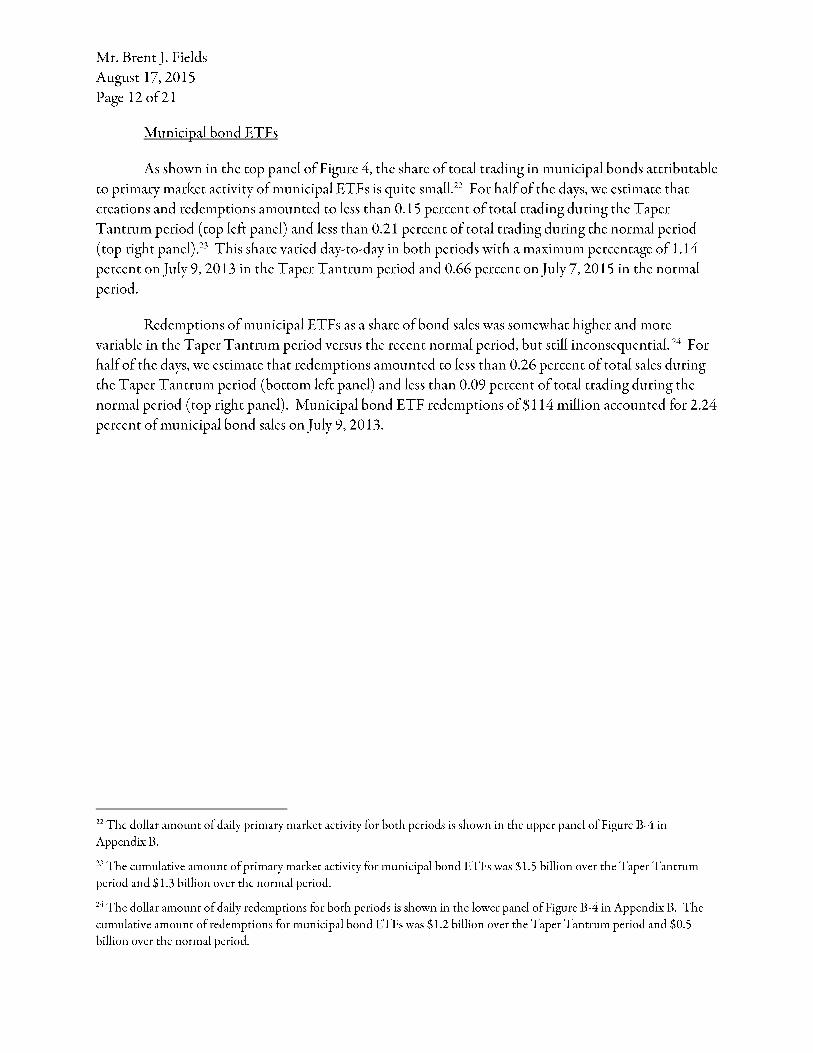
Figure 4: Municipal Bond ETFs1
Prima't')' market activity 2 as a share of municipal bond rnarket tradinl
Daily, May 10, 2013-July 31,2013 Daily, May 11, 2015-July 31, 2015
2.5% Median= 0.15%
2.5% Median = 0.21%
2.0% 2.0%
1.5% 1.5%
1.0% 1.0%
0.5% 0.5%
0.0% 0.0% 0 t'--- '<!' t'--- '<!' ...... 00 "' N (]', \.0 ...... 00 "" ...... 00 "" N 0'--...... ...... N t<l 0 ...... N N 0 ...... ...... N ...... ,..... N 0 0 ...... N N -...._ -...._ -...._ -...._ -...._ -...._ -...._ -...._ -...._ -...._ -...._ -...._ -...._ -...._ -...._ -...._ -...._ -...._ -...._ -...._
"' "' "' "' \.0 \.0 \.0 \.0 t'--- t'--- 1:'--. t'--- If'\ "' "" \.0 \.0 \.0 \.0 \.0
Redemptions as a share ofmunicipal bond sales4
Daily, May 10, 2013-July 31,2013 Daily, May 11, 2015-July 31,2015
2.5% Median = 0.26%
2.5% Median = 0.09%
2.0% 2.0%
1.5% 1.5%
1.0% 1.0%
0.5% 0.5%
0.0% 0.0% 0 ['.. '<!' ...... ['.. '<!' ...... 00 "' N (]', \.0 ...... 00 "' ...... 00 "' N (]', ...... ...... N ('<') 0 ...... N N 0 ...... - N - ...... N 0 0 ...... N N -...._ -...._ -...._ -...._ -...._ -...._ -...._ -...._ -...._ -...._ -...._ -...._ -...._ -...._ -...._ -...._ -...._ -...._ -...._ -...._
"' If'\ "' "' \.0 \.0 \.0 \.0 1:'--. ['.. t'--- t'--- "' "' "' \.0 \.0 \.0 \.0 \.0
1 As of]une 2015, municipal bond E'l'fs accounted for 6 percent of domestic bond E'l'.F total net assets.
\.0 t<l 0 t'---0 ,..... N N -...._ -...._ -...._ -...._ t'--- t'--- t'--- t'---
\.0 t<l 0 ['.. 0 ...... N N -...._ -...._ -...._ -...._ t'--- ['.. ['.. ['..
2 Daily creations and redemptions for each domestic bond E' 1 '.F are estimated by multiplying the daily change in the shares
outstanding by the daily NA V from Bloomberg. Aggregate daily primary market activity is computed by adding creations
and the absolute value of redemptions across all ETFs in each domestic bond asset class each day. 3 D~tily tr~tding of municipal bonds is from MSR13' s Electronic Municipal Market Access (EMMA). 4 Municipal bond sales arc estimated as 50 percent of municipal bond market tr~tding. Sources: Investment Company Institute tabulations of Bloomberg data and EMMA
Mr. Brent]. Fields
August 17,2015
Page 15 of21
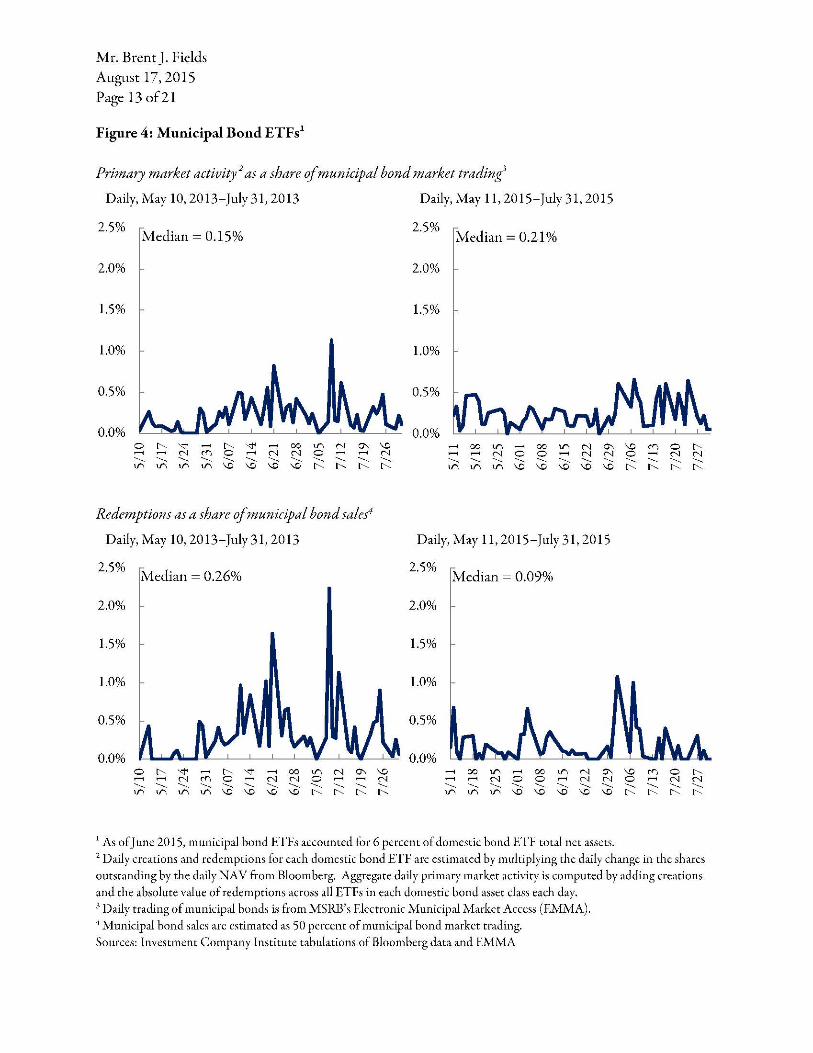
Figure 5: GREK ETF Allowed Investors Access to Liquidity and Price Discovery
Daily,]anuary2, 2015-August4, 2015
- Closing price (left axis)
- FTSE/ A THEX Custom Capped Index (right axis)
U.S. Dollars
16
14
12
10
8
6
4
2
0
August3,2015: Greek stock market '
June 29, 2015: Greek stock market :
J
shuts down: J J
I I
re-opens : I
Index Value I
I 1200
1000
800
600
400
200
0
Jan2015 Feb2015 Mar2015 Apr2015 May2015 Jun2015 -200
Jul2015 Aug2015
Source: Bloomberg
Authorized Participants
The SEC requests comment on the impact to an ETF if one or more of its APs suspends
creations or redemptions. This request might be informed by concern expressed by some that the
primary market in ETF shares depends heavily on a limited number of active APs, and that this
dependence could add stress to the financial markets if an active AP were to step away from creating
and redeeming ETF shares.
Generally speaking, an AP (or its customer if the AP is acting as agent) trades with the ETF if
there is an opportunity for arbitrage. This arbitrage opportunity helps keep the market price ofETF
shares near the per share NAV.28 In contrast, closed-end funds do not have a similar arbitrage feature
and can trade at significant premiums or discounts to their NAYs.
2~ for further discussion of the role of APs and other traders in the arbitrage mechanism, see Letter from Barbara Novick,
Vice Chairman, and Ira Shapiro, Managing Director, Blackrock, to Brent J. hdds, Secretary, Securities and Exchange Commission (August 11, 2015 ), available at http-//www.sec.g.ov/commenrs/s?-ll-15/s71115-10.pdf.
Mr. Brent]. Fields
August 17,2015
Page 20 of21
leverage and most use little to no leverage. Without leverage, it is virtually impossible for a fund to
become insolvent-i.e., for its liabilities to exceed its assets.
Similar to any other investment product, market demand determines the success of an ETF.
New ETFs generally start small and grow in AUM as new shares are created. Some ETFs attract or
maintain sufficient demand to increase their AUM substantially; while others take more time because
of market conditions. Still other ETFs never attract or maintain sufficient assets and, as a result,
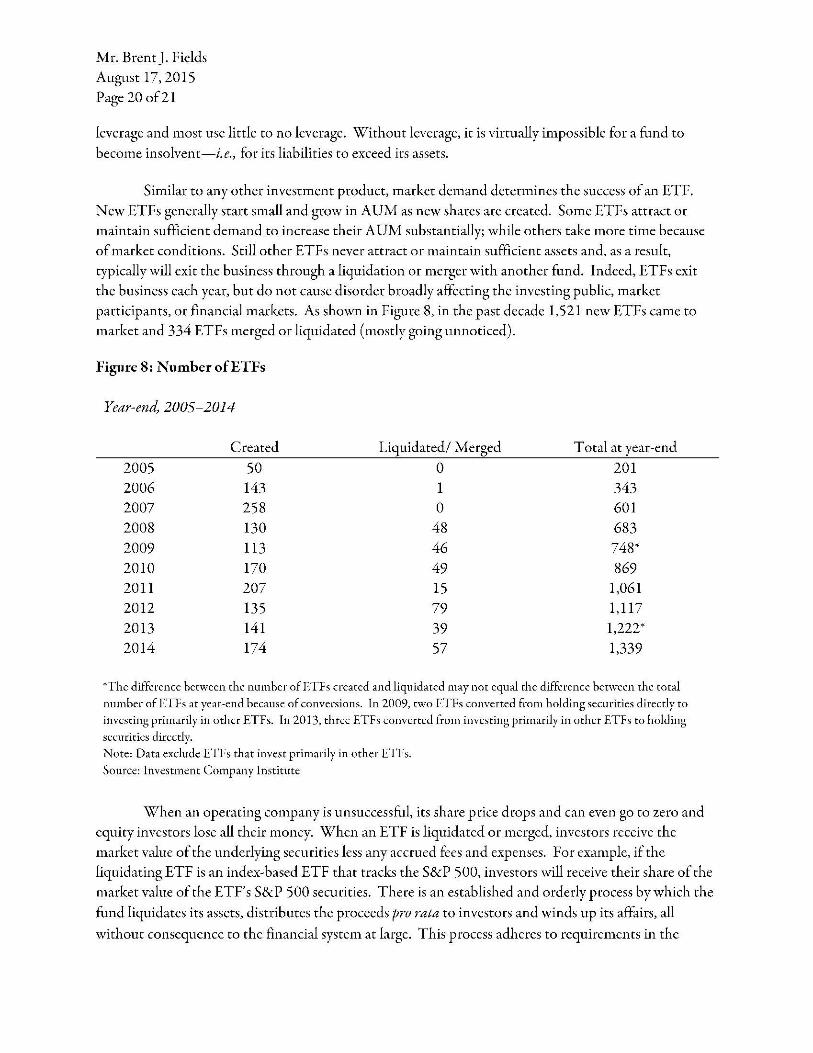
typically will exit the business through a liquidation or merger with another fund. Indeed, ETFs exit the business each year, but do not cause disorder broadly affecting the investing public, market
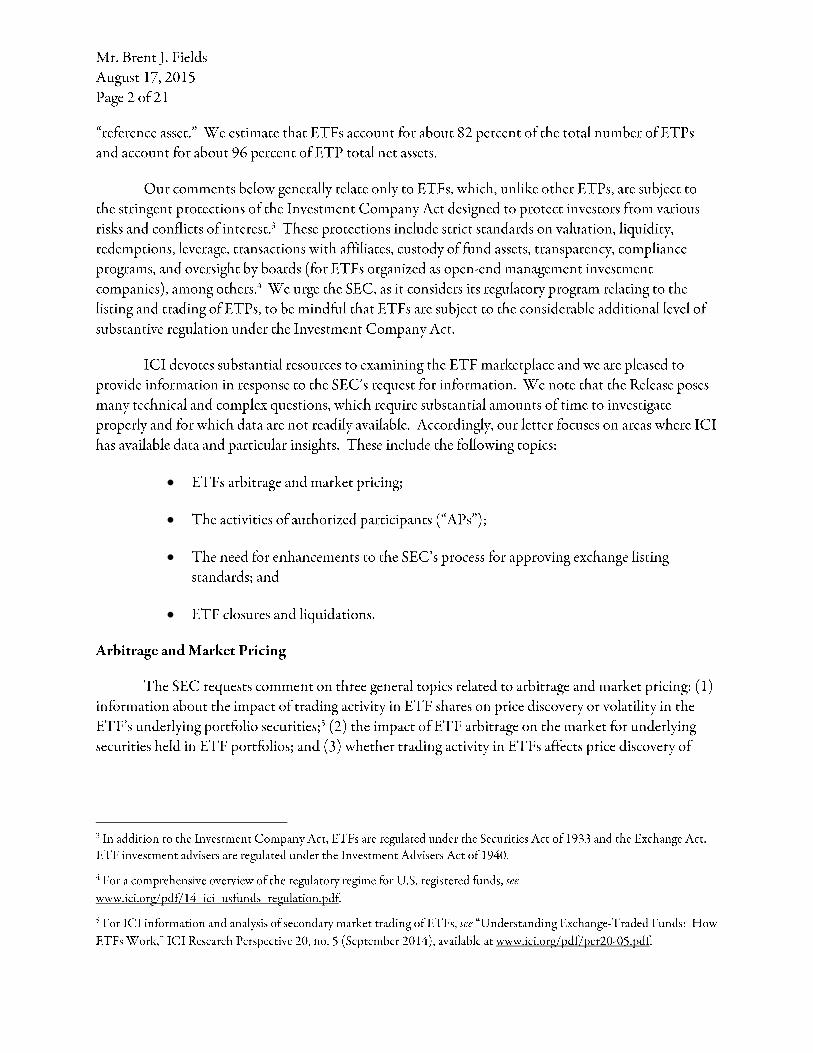
participants, or financial markets. As shown in Figure 8, in the past decade 1,521 new ETFs came to market and 334 ETFs merged or liquidated (mostly going unnoticed).
Figure 8: Number ofETFs
Year-end, 2005-2014
Created Liquidated/ Merged Total at year-end
2005 50 0 201
2006 143 1 343 2007 258 0 601
2008 130 48 683 2009 113 46 748*
2010 170 49 869 2011 207 15 1,061
2012 135 79 1,117
2013 141 39 1,222*
2014 174 57 1,339
*The difference between the number ofFTFs created and liquidated may not equal the difference between the total
number ofETFs at year-end because of conversions. In 2009, two FTFs converted from holding securities directly to
investing primarily in other ETFs. In 2013, three ETFs converted from investing primarily in other ETFs to holding
securities directly.
Note: Data exclude E' l'h that invest primarily in other E' l'h.
Source: Investment Company Institute
When an operating company is unsuccessful, its share price drops and can even go to zero and
equity investors lose all their money. When an ETF is liquidated or merged, investors receive the
market value of the underlying securities less any accrued fees and expenses. For example, if the
liquidating ETF is an index-based ETF that tracks the S&P 500, investors will receive their share of the market value of the ETF's S&P 500 securities. There is an established and orderly process by which the
fund liquidates its assets, distributes the proceeds pro rata to investors and winds up its affairs, all
without consequence to the financial system at large. This process adheres to requirements in the
Mr. Brent]. Fields
August 17,2015
Page 21 of21
Investment Company Act and state or other relevant laws based on the domicile of the fund, including
consideration and approval by the fund's board of directors.
ETF liquidations are relatively straightforward because like other types of regulated funds they
have simple capital structures. A fund contracts with a limited number of service providers and it pays
these service providers through routine asset-based or annual service fees that are accrued in advance on
the fund's books.36 The Investment Company Act strictly regulates and limits the ability of a fund to
borrow or lend money or other assets, and to engage in transactions involving leverage. Accordingly, a
primary focus of the liquidation process is the conversion of the fund's portfolio investments to cash or
cash equivalents. How long this process takes will depend upon such factors as portfolio liquidity, the
degree of ease in converting portfolio securities to cash or cash equivalents and the fund's investment
strategy and objectives. Typically, the process will take place over a time period that the fund's
investment adviser and board of directors-consistent with their fiduciary obligations to the fund
deem appropriate. If a particular situation demands an expedited timetable, the investment adviser and
fund board have the ability to act swiftly. Nothing would require, however, an immediate sell-off of a
fund's entire portfolio or the distribution ofliquidation proceeds to investors within a specific
timeframe (e.g., seven days).
We look forward to working with the SEC as it continues to examine these critical issues. In
the meantime, if you have any questions, please feel free to contact me directly at ,
Shelly Antoniewicz, senior economist, at , or Jane Heinrichs, associate general counsel,
at .
cc: The Honorable Mary Jo White, Chair
Sincerely,
David W. Blass
General Counsel
The Honorable Luis A. Aguilar, Commissioner
The Honorable Daniel M. Gallagher, Commissioner
The Honorable KaraM. Stein, Commissioner
The Honorable MichaelS. Piwowar, Commissioner
Mr. Steve Luparello,
Director, Division ofTrading and Markets
Mr. David Grim
Director, Division oflnvestment Management
36 In addition to the investment adviser, .ET.F service providers typically include the custodian, administrator, auditor,
transfer agent, and distributor.
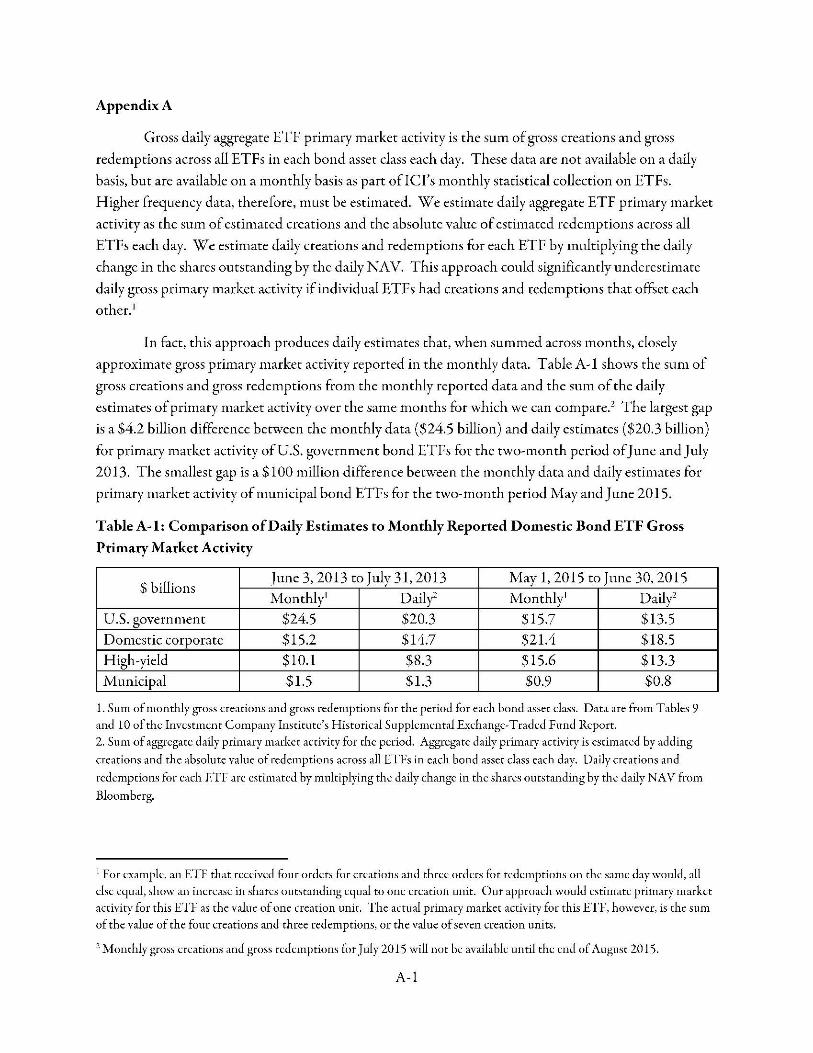
Appendix A
Gross daily aggregate ETF primary market activity is the sum of gross creations and gross
redemptions across all ETFs in each bond asset class each day. These data are not available on a daily
basis, but are available on a monthly basis as part ofiCI's monthly statistical collection on ETFs.
Higher frequency data, therefore, must be estimated. We estimate daily aggregate ETF primary market
activity as the sum of estimated creations and the absolute value of estimated redemptions across all
ETFs each day. We estimate daily creations and redemptions for each ETF by multiplying the daily
change in the shares outstanding by the daily NA V. This approach could significantly underestimate
daily gross primary market activity if individual ETFs had creations and redemptions that offset each
other.1
In fact, this approach produces daily estimates that, when summed across months, closely
approximate gross primary market activity reported in the monthly data. Table A-1 shows the sum of
gross creations and gross redemptions from the monthly reported data and the sum of the daily
estimates of primary market activity over the same months for which we can compare.2 The largest gap
is a $4.2 billion difference between the monthly data ($24.5 billion) and daily estimates ($20.3 billion)
for primary market activity ofU.S. government bond ETFs for the two-month period ofJune and July
2013. The smallest gap is a $100 million difference between the monthly data and daily estimates for
primary market activity of municipal bond ETFs for the two-month period May and June 2015.
Table A-1: Comparison of Daily Estimates to Monthly Reported Domestic Bond ETF Gross
Primary Market Activity
$billions June 3, 2013 to July 31,2013 May 1, 2015 to June 30,2015
Monthly' Dailf Monthly' Dailf U.S. government $24.5 $20.3 $15.7 $13.5
Domestic corporate $15.2 $14.7 $21.4 $18.5
High-yield $10.1 $8.3 $15.6 $13.3
Municipal $1.5 $1.3 $0.9 $0.8
1. Sum of monthly gross creations and gross redemptions for the period for each bond asset class. Data are from Tables 9 and 10 of the Investment Company Institute's Historical S upplcmcntal Exchange-T radcd Fund Report.
2. Sum of aggregate daily primary market activity for the period. Aggregate daily primary activity is estimated by adding
creations and the absolute value of redemptions across all ETFs in each bond asset class each day. Daily creations and
redemptions fi>r each ETF arc estimated by multiplying the daily change in the slurcs outstanding by the daily NAV from
Bloomberg.
1 For example, an ETF t!ut received fimr orders for crc;ttions and three orders for redemptions on the same day would, all
else equal, show <ll1 increase in shares oms tanding equal to one creation unit. Our approach would estimate primary market activity for chis E' f} as the value of one creation unit. The actual primary market activity for chis ETr, however, is the sum
of the value of the four creations and three redemptions, or the value of seven creation units.
2 Monthly gross creations and gross redemptions for July 2015 will not be anilablc until the end ofAup1st 2015.
A-1
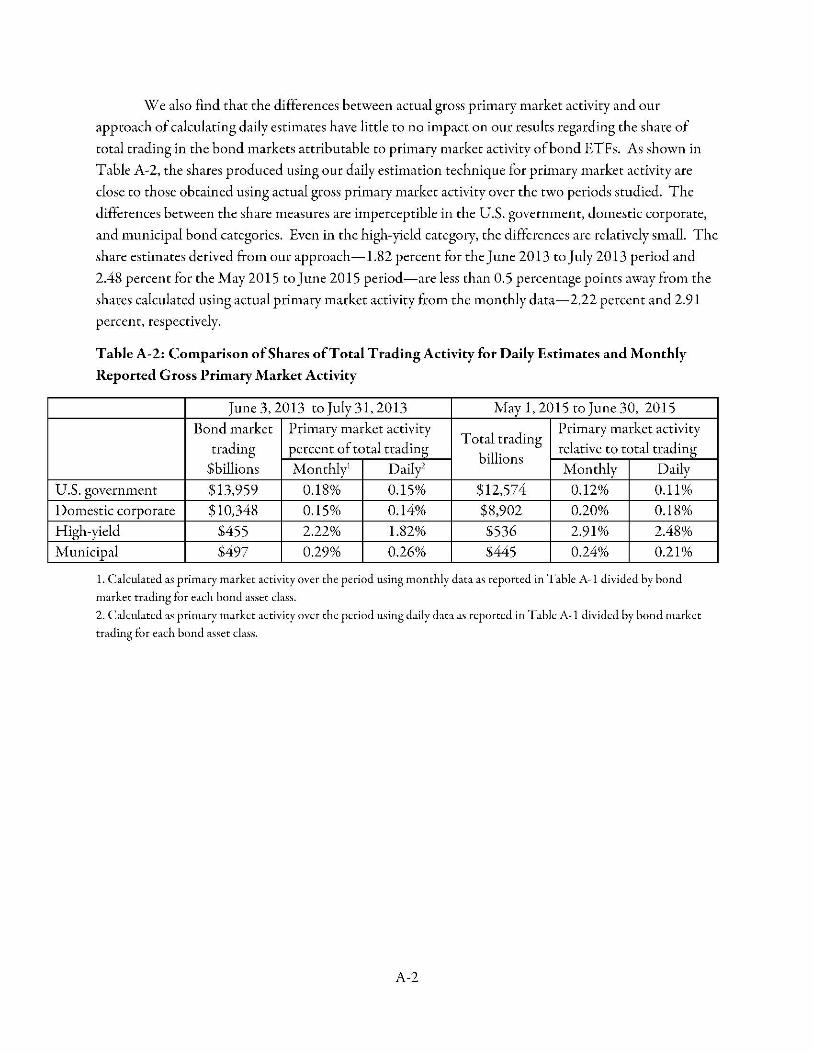
We also find that the differences between actual gross primary market activity and our
approach of calculating daily estimates have little to no impact on our results regarding the share of
total trading in the bond markets attributable to primary market activity of bond ETFs. As shown in
Table A-2, the shares produced using our daily estimation technique for primary market activity are
dose to those obtained using actual gross primary market activity over the two periods studied. The
differences between the share measures are imperceptible in the U.S. government, domestic corporate,
and municipal bond categories. Even in the high-yield category, the differences are relatively small. The
share estimates derived from our approach-1.82 percent for the June 2013 to July 2013 period and
2.48 percent for the May 2015 to June 2015 period-are less than 0. 5 percentage points away from the
shares calculated using actual primary market activity from the monthly data-2.22 percent and 2.91
percent, respectively.
Table A-2: Comparison ofShares ofTotal Trading Activity for Daily Estimates and Monthly
Reported Gross Primary Market Activity
June 3, 2013 to July 31,2013 May 1, 2015 to June 30, 2015
Bond market Primary market activity Total trading
Primary market activity
trading percent of total trading relative to total trading
$billions Monthli Dailf billions
Monthly Daily
U.S. government $13,959 0.18% 0.15% $12,574 0.12% 0.11%
Domestic corporate $10,348 0.15% 0.14% $8,902 0.20% 0.18%
High-yield $455 2.22% 1.82% $536 2.91% 2.48%
Municipal $497 0.29% 0.26% $445 0.24% 0.21%
1. Calculated as primary market activity over the period using monthly data as reported in Table A-1 divided by bond
market trading for each bond asset class.
2. Calculated as primary market activity over the period using daily data as reponed in Table A-1 divided by bond market
trading for each bond asset class.
A-2
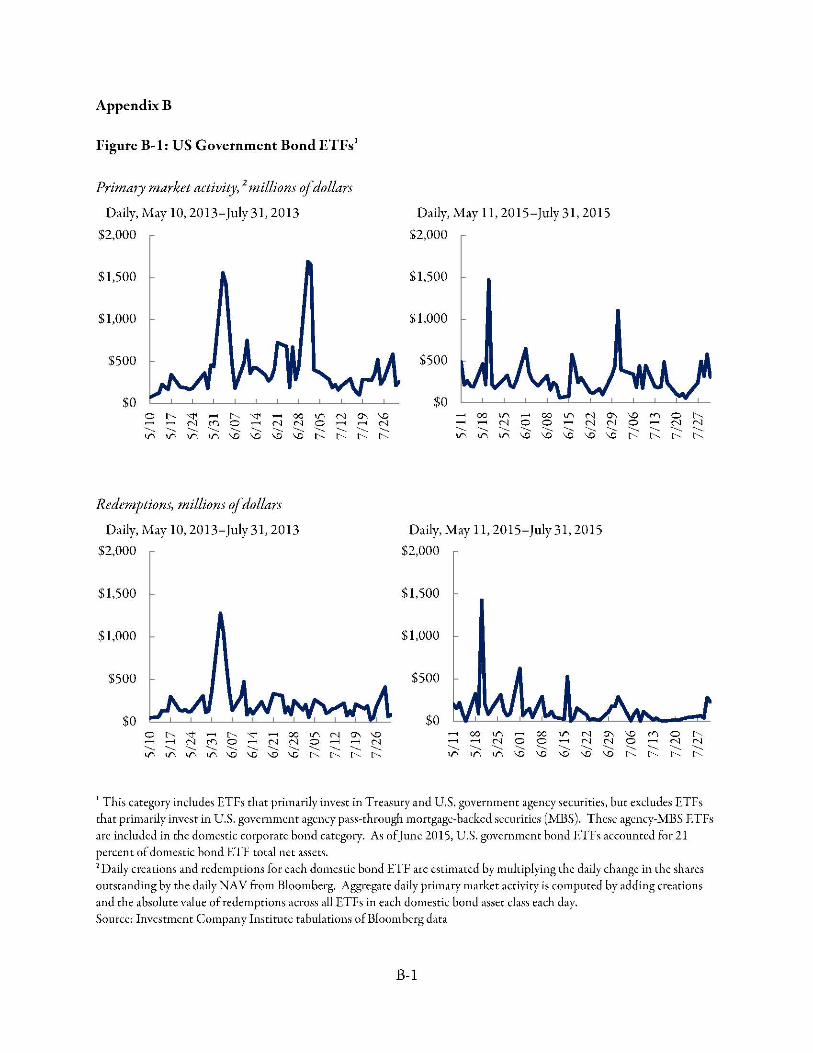
AppendixB
Figure B~1: US Government Bond ETFs1
Primar)' market activit)', 2 millions ofdollars
Daily, May 10, 2013-July31, 2013 Daily, May 11, 2015-July 31,2015
$2,000 $2,000
$1,500 $1,500
$1,000 $1,000
$500 $500
$0 $0 0 1:'--. 'i' 1:'--. 'i' ...... 00 ll'\ N (]"\ \D ...... 00 ll"\ ...... 00 ll"\ N \D ~ 0 1:'--. ...... ...... N ~ 0 ...... N N 0 ....... ...... N ...... ...... N 0 0 ...... N N 0 ...... N N "" --...... --...... -...... --...... --...... --...... -...... --...... --...... -...... --...... -...... -...... -...... -...... -...... -...... -...... -...... -...... -...... -...... -...... -...... If"\ ll'\ ll'\ ll'\ \D \D \D \D 1:'--. 1:'--. 1:'--. 1:'--. ll'\ lf"\ ll"\ \D \D \D \D \D 1:'--. 1:'--. 1:'--. 1:'--.
Redemptions, millions ofdollars
Daily, May 10, 2013-July31, 2013 Daily, May 11, 2015-July 31, 2015
$2,000 $2,000
$1,500 $1 ,500
$1,000$1,000
$500$500
$0$0 ...... ll'\0 1:'--. 'i' ...... 1:'--. 'i' 00 N \D ...... ...... N ~ 0 ...... N N 0 ...... ...... N "" -...... -...... -...... -...... -...... -...... -...... -...... -...... -...... -...... -......
ll'\ ll'\ ll'\ ll'\ \D \D \D \D 1:'--. 1:'--. 1:'--. 1:'--.
1 This category includes ETFs char primarily invest in Treasury and U.S. government agency securities, bur excludes ETFs char primarily invest in U.S. government agency pass-through mortgage-backed securities (MBS). These agcncy-MBS F.TFs
arc included in che domestic corporate bond category. As ofJune 2015, U.S. government bond ETFs accounted for 21 percent ofdomestic bond E'n: total net assets. 2 Daily creations and redemptions for each domestic bond E'l} ' are estimated by multiplying the daily change in the shares outstanding by the daily NAV from Bloomberg. Aggregate daily primary market activity is computed by adding creations
and the absolute value ofredemptions across all ETFs in each domestic bond asset class each day.
Source: Investment Company Institmc t<tbulations ofBloomberg data
B-1
- - -
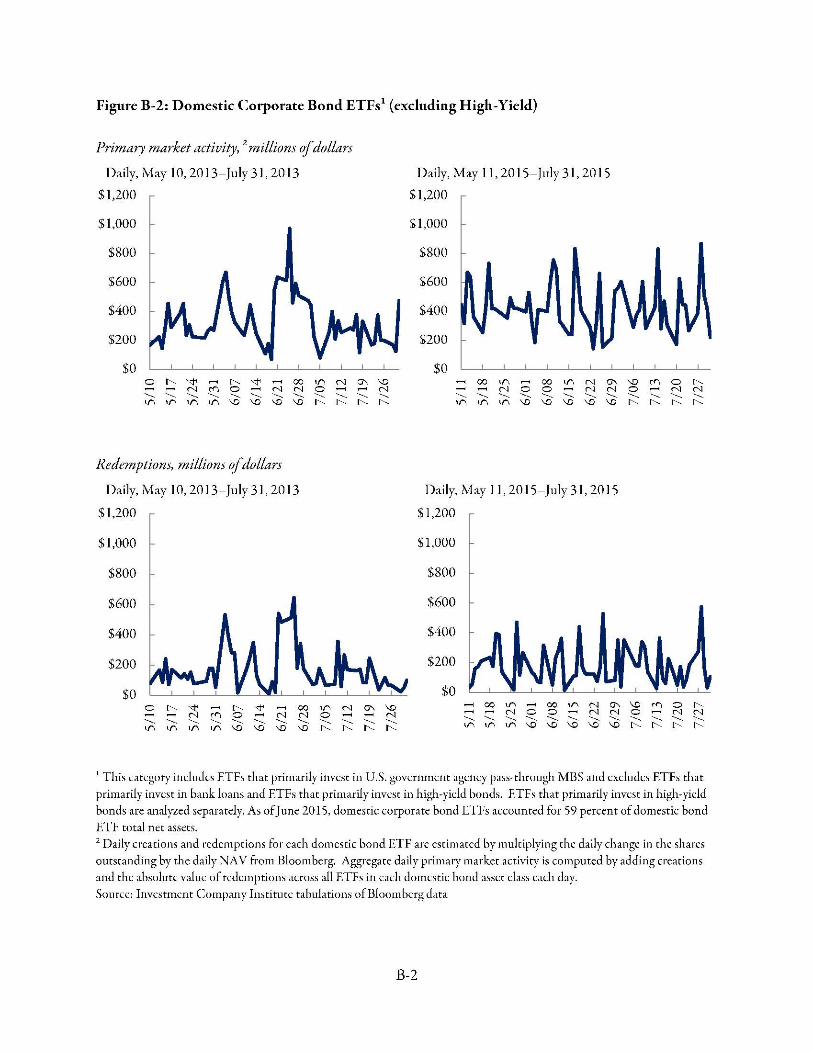
Figure B-2: Domestic Corporate Bond ETFs1 (excluding High-Yield)
Primary market activity, 2 millions ofdollars
Daily, May 10, 2013-July 31,2013 Daily, May 11, 2015-July 31,2015
$1,200 $1,200
$1,000 $1,000
$800 $800
$600 $600
$400 $400
$200 $200
$0 $0 -0-.....__ "'...... .....__
'1' N.....__
...... ~ .....__
['.. 0.....__ ~-.....__
...... N.....__
00 N.....__
ll"\ V'\ V\ V'\ \D \D \D \D
Redemptions, millions ofdollars
Daily, May 10, 2013-July 31,2013
$1,200
$1,000
$800
$600
$400
$200
$0 0 ['.. ['.. ~ 00 ......~ 0 N N .....__ .....__ .....__ .....__ .....__ .....__ .....__ .....__ -- '"" ll"\ ll"\ 1f', 1f', \!) \!) \D \D
V'\ N 0.....__ .....__ -['.. ['..
- - 1f', N 0'\ \!) 0 - N .....__ .....__ .....__ .....__ -['.. ['.. "'- "'
0'\ \D ...... 00 ll"\ 00 ll"\ N 0'\ \D 0 ['.. ...... ......N N 0 0 N N 0 N N.....__ .....__ .....__ .....__ .....__ .....__ .....__ .....__ .....__ .....__ .....__ .....__ .....__ .....__ '"" ['.. ['.. V'\ ll"\ ll"\ \D \D \D \D \D ['.. ['.. ['.. ['..
Daily, May 11, 2015-July 31,2015
$1,200
$1,000
$800
$600
$400
$200
$0
1 This category includes ETFs that prinurily invest in U.S. government agency pass-through MI3S and excludes ETFs that primarily invest in bmk loans and ETFs that primarily invest in high-yield bonds. ETFs that primarily invest in high-yield
bonds are analyzed separately. As of]une 2015 , domestic corporate bond El.Fs accounted for 59 percent of domestic bond
E'f} total net assets. 2 Daily creations and redemptions for each domestic bond ETF are estimated by multiplying the daily change in the shares
outstanding by the daily NAV from Bloomberg. Aggregate daily primary market activity is computed by adding creations and the ~tbsolutc value of redemptions ~teross all ETFs in each domestic bond asset class c;teh day.
Source: Investment Company Institute t~tbulations ofl3loomberg data
B-2
- - - -
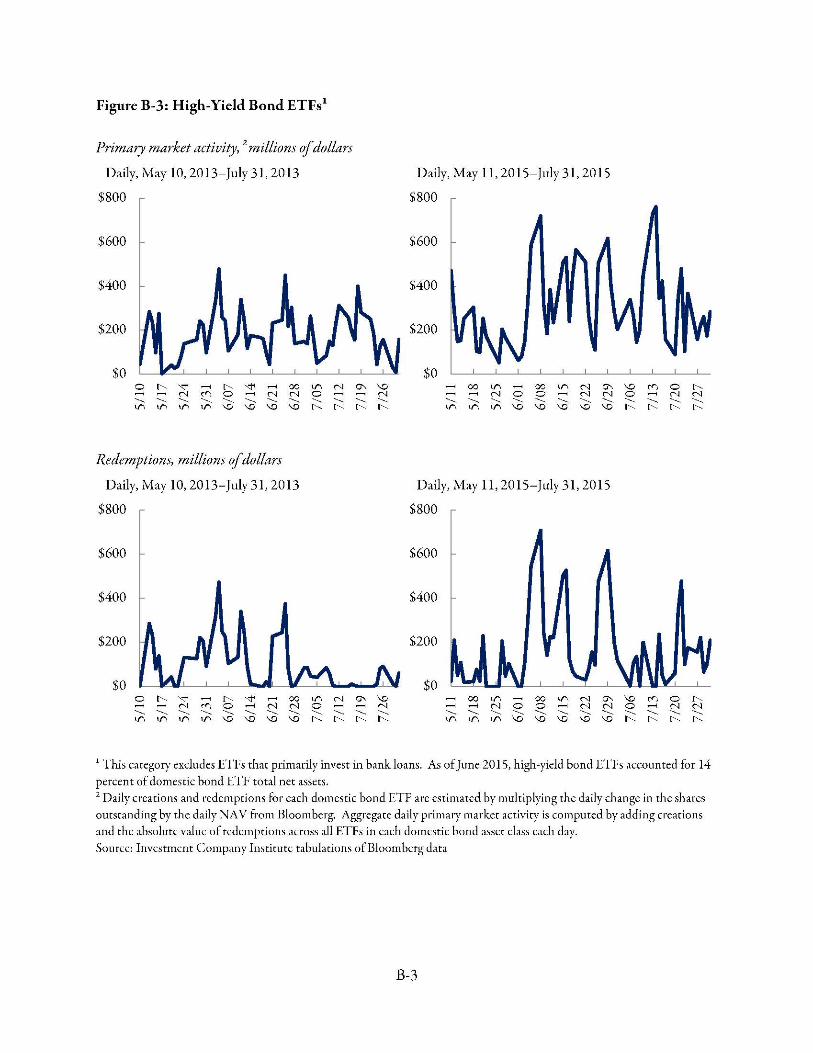
Figure B-3: High-Yield Bond ETFs1
Primary market activity, 2 millions ofdollars
Daily, May 10, 2013-July 31,2013
$800
$600
$400
$200
$0 ,......0 I'- 'i' ....... I'- 'i' oc If', N
rr, - - N 0 - N N 0 ......._ ......._ ......._ ......._ ......._ ......._ ......._ ......._ ......._ ......._ lr'\ If', If', If', '-D '-D 'D 'D I'- I'
Redemptions, millions ofdollars
Daily, May 10, 2013-July 31,2013
$800
$600
$400
$200
$0
"" 'D- N......._ ......._ I' I'
0 I' 'i' ..-.. I' 'i' - OC If'> N C3'\ 'D -....._ -..........._ N.............._ r0....._ 0....._ -....._ N....._ N........... 0....._ -....._ -....._ N....._ ~ If', If', If', '-D '-D 'D 'D I' I' I' I'
Daily, May 11, 2015-July 31,2015
$800
$600
$400
$200
$0 ,...... ,......oc If', oc lr'\ N 'D rr, 0 I' "" N 0 0 N N 0 N N......._ ......._ ......._ ......._ ......._ ......._ ......._ ......._ ......._ ......._ ......._ ......._ lr'\ lr'\ If', 'D 'D '-D '-D 'D I'- I'- I'- I'
Daily, May 11, 2015-July 31,2015
$800
$600
$400
$200
$0
1 'l'his category excludes El '.Fs that primarily invest in bank loans. As of]une 2015, high-yield bond Ens accounted for 14
percent ofdomestic bond ET.F total net assets. 2 Daily creations and redemptions for each domestic bond ETF are estimated by multiplying the daily change in the shares
outstanding by the daily NAV from Bloomberg. Aggregate daily primary market activity is computed by adding creations and the ~tbsolute value of redemptions across ~Jl ETFs in each domestic bond asset class c;tch day.
Source: Investment Company Institute tabulations ofl3loomberg data
B-3
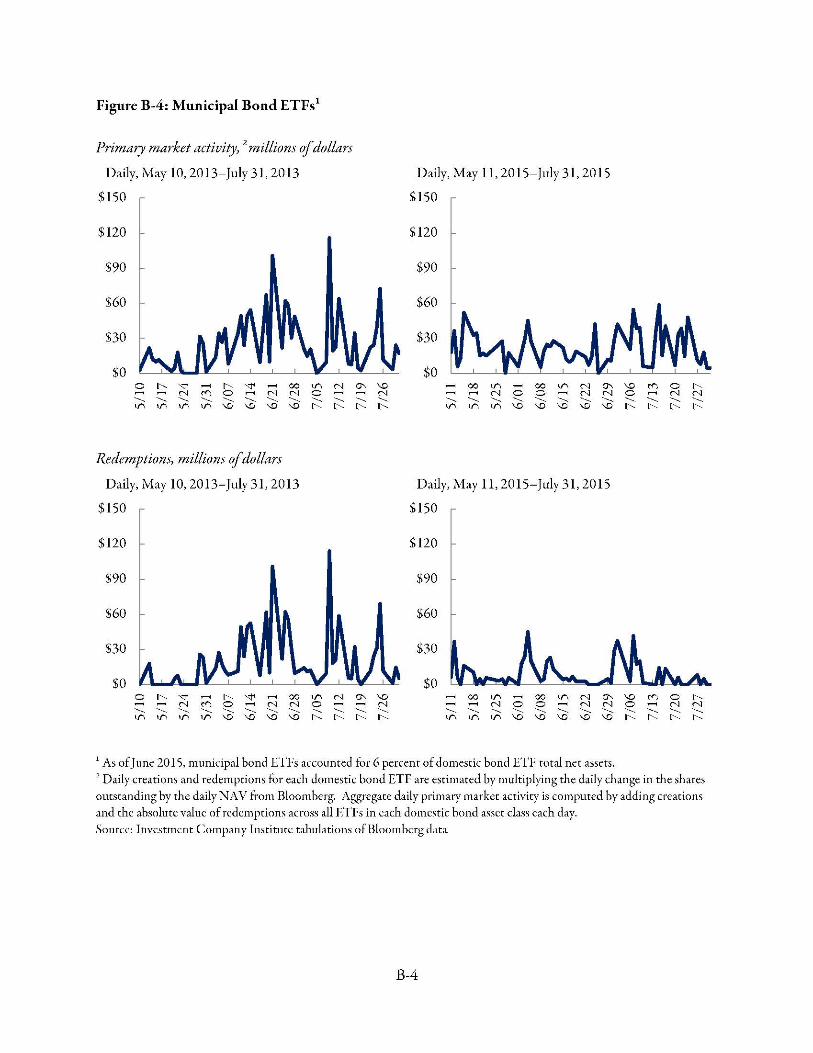
Figure B-4: Municipal Bond ETFs1
Primary market activity) 2 millions of dollars
Daily, May 10, 2013-July 31,2013
$150
$120
$90
$60
$30
$0 0 l'--- '<:!' ...... l'--- '<:!' - 00 - - N (<! 0 ...... N N -....... -....... -....... -....... -....... -....... -....... -....... I/"'' If"\ If"\ If"\ \D \D \D \D
Redemptions, millions of dollars
Daily, May 10, 2013-July 31,2013
$150
$120
$90
$60
$30
$0 0 l'--- '<:!' ...... l'--- '<!' - oc - - N (<! 0 - N N -....... -....... -....... -....... -....... -....... -....... -....... 1/"'\ If"\ If"\ If"\ \D \D \D \D
If"\ N 0 ...... -....... -....... l'--- l'---
If"\ N 0 --....... -....... ('-_ ('-_
Daily, May 11, 2015-July 31,2015
$150
$120
$90
$60
$30
$0 (]'\ \D - oc If"\ - 00 I/"'' N (]'\ ...... N ...... ...... N 0 0 ...... N N -....... -....... -....... -....... -....... -....... -....... -....... -....... -....... l'--- l'--- I/"'' I/"'' If"\ \D \D \D \D \D
Daily, May 11, 2015-July 31,2015
$150
$120
$90
$60
$30
$0 (]'\ \D ...... oc If"\ ...... oc 1/"'\ N (]'\ - N - - N 0 0 - N N -....... -....... -....... -....... -....... -....... -....... -....... -....... -....... ('-_ ('-_ 1/"'\ I/"'' If"\ \D \D \D \D \D
1 As o[June 2015, municipal bond E'l'h accounted for 6 percent of domestic bond ETF total net assets.
\D (<! 0 l'---0 ...... N N -....... -....... -....... -....... l'--- l'--- l'--- l'---
\D (<! 0 ('-_ 0 - N N -....... -....... -....... -....... ('-_ ('-_ ('-_ ('-_
2 Daily creations and redemptions for each domestic bond ETF are estimated by multiplying the daily change in the shares
outstanding by the daily NA V from Bloomberg. Aggregate daily primary market activity is computed by adding creations
and the absolute value of redemptions across all ETFs in each domestic bond <tsset class each day. Source: Investment Company Institmc t<tbulations of Bloomberg data
B-4


![Introduction - QUANTITATIVE RESEARCH AND TRADINGjonathankinlay.com › wp-content › uploads › Canonical...ETFs = TemporalData[ETFs] DateListPlot[ETFs] TemporalData 2008 2010 2012](https://static.fdocuments.in/doc/165x107/60be3b7b4d2c2d25820ec04a/introduction-quantitative-research-and-t-a-wp-content-a-uploads-a-canonical.jpg)