11 - SAGE Publications Inc€¦ · 11 STRATEGIC LEADERSHIP NATALIE SLAWINSKI The University of...
38
11 STRATEGIC LEADERSHIP NATALIE SLAWINSKI The University of Western Ontario 297 There are three categories of people—the person who goes into his office, puts his feet up on his desk, and dreams for twelve hours; the person who arrives at 5:00 am and works for sixteen hours, never once stopping to dream; and the one who puts his feet up, dreams for one hour, then does something about those dreams. —Steven J. Ross 1 I n the past 20 years, researchers have begun to pay more attention to the study of strate- gic leadership, which has come to be viewed by many as a critical aspect of firm success (Daft, 2005). Broadly speaking, strategic leadership refers to the study of executives who have overall responsibility for the firm and how their decisions affect organi- zational outcomes (Finkelstein & Hambrick, 1996). The focus is on top managers because they usually have decision-making responsibilities that affect the whole organization— including the other organizational members—and its overall performance (Daft, 2005). Strategic leaders create a sense of purpose and direction, which guides strategy formula- tion and implementation within the firm (Daft, 2005; Hosmer, 1982; Shrivastava & Nachman, 1989). They also interact with key stakeholders, such as customers, government agencies, and unions, especially when these relationships are critical to firm performance (House & Aditya, 1997). Organizations and the environments in which they operate are increasingly complex and ambiguous. Therefore, strategic leaders must navigate through these complexities and develop strategies that will allow their organizations to be successful, whether they are for- profit or nonprofit. Another perspective of strategic leadership focuses on the specific activities and behav- iors of strategic leaders that can improve the success of the firm (Ireland & Hitt, 1999; Rowe, 2001). This perspective argues that in an ever-changing complex business environment, 11-Rowe-45233.qxd 3/26/2007 12:52 PM Page 297
Transcript of 11 - SAGE Publications Inc€¦ · 11 STRATEGIC LEADERSHIP NATALIE SLAWINSKI The University of...
11STRATEGIC LEADERSHIP
NATALIE SLAWINSKI
The University of Western Ontario
297
There are three categories of people—the person who goes into his office,puts his feet up on his desk, and dreams for twelve hours; the person whoarrives at 5:00 am and works for sixteen hours, never once stopping todream; and the one who puts his feet up, dreams for one hour, then doessomething about those dreams.
—Steven J. Ross1
I n the past 20 years, researchers have begun to pay more attention to the study of strate-gic leadership, which has come to be viewed by many as a critical aspect of firmsuccess (Daft, 2005). Broadly speaking, strategic leadership refers to the study of
executives who have overall responsibility for the firm and how their decisions affect organi-zational outcomes (Finkelstein & Hambrick, 1996). The focus is on top managers becausethey usually have decision-making responsibilities that affect the whole organization—including the other organizational members—and its overall performance (Daft, 2005).
Strategic leaders create a sense of purpose and direction, which guides strategy formula-tion and implementation within the firm (Daft, 2005; Hosmer, 1982; Shrivastava & Nachman,1989). They also interact with key stakeholders, such as customers, government agencies, andunions, especially when these relationships are critical to firm performance (House & Aditya,1997). Organizations and the environments in which they operate are increasingly complexand ambiguous. Therefore, strategic leaders must navigate through these complexities anddevelop strategies that will allow their organizations to be successful, whether they are for-profit or nonprofit.
Another perspective of strategic leadership focuses on the specific activities and behav-iors of strategic leaders that can improve the success of the firm (Ireland & Hitt, 1999; Rowe,2001). This perspective argues that in an ever-changing complex business environment,
11-Rowe-45233.qxd 3/26/2007 12:52 PM Page 297

strategic leaders may be a source of competitive advantage. Ireland and Hitt (1999) definestrategic leadership as the “ability to anticipate, envision, maintain flexibility, think strategi-cally, and work with others to initiate changes that will create a viable future for the orga-nization” (p. 43). Given the challenges that firms face in an often turbulent and unpredictableglobal environment, Ireland and Hitt have identified six components of strategic leadershipthat will lead to enhanced organizational performance: determining the firm’s purpose orvision, exploiting and maintaining core competencies, developing human capital, sustain-ing an effective organizational culture, emphasizing ethical practices, and establishing bal-anced organizational controls.
DETERMINING THE FIRM’S PURPOSE OR VISION
The first component of strategic leadership consists of determining the firm’s purpose orvision. This means that strategic leaders must articulate a clear and realistic statementabout why the firm exists and what is distinctive about it. This statement will thenempower members of the organization to develop and execute strategies that are in linewith the vision of the firm.
EXPLOITING AND MAINTAINING CORE COMPETENCIES
Strategic leaders exploit and maintain core competencies. Core competencies are resourcesand capabilities that give firms an edge over their rivals. Strategic leaders need to under-stand which combinations of resources and capabilities are valuable, rare, costly to imitate,and difficult to substitute for, as these will allow the firm to gain a competitive advantage.
DEVELOPING HUMAN CAPITAL
Strategic leaders are effective at developing human capital. Human capital refers to the knowl-edge, skills, and abilities of the firm’s employees. Because these employees are critical to thesuccess of the organization, strategic leaders invest in them through training and mentoring.
SUSTAINING AN EFFECTIVE ORGANIZATIONAL CULTURE
Strategic leaders sustain an effective organizational culture. An organization’s culture is acomplex combination of ideologies, symbols, and values that are shared by employees ofthe firm. Strategic leaders learn how to shape a firm’s shared values and symbols in waysthat allow the firm to be more competitive.
EMPHASIZING ETHICAL PRACTICES
Strategic leadership involves the emphasis of ethical practices. Top managers who usehonesty, trust, and integrity in their decision making are able to inspire their employeesand create an organizational culture that encourages the use of ethical practices in day-to-day organizational activities.
298 • CASES IN LEADERSHIP
11-Rowe-45233.qxd 3/26/2007 12:52 PM Page 298
ESTABLISHING BALANCED ORGANIZATIONAL CONTROLS
Organizational controls refer to the formal procedures that are used in organizations toinfluence and guide work. These controls act as limits on what employees can and can-not do. There are two types of internal controls: strategic and financial. Strategic con-trols are accomplished through information exchanges that help to develop strategies,whereas financial controls are accomplished through setting objective criteria such asperformance targets. Strategic controls emphasize actions, whereas financial controlsemphasize outcomes. Financial controls can be especially constraining and can stiflecreativity in organizations. Strategic leaders must establish balanced organizationalcontrols by incorporating the two types in order to allow employees to remain flexibleand innovative.
In addition to accomplishing the above activities, strategic leaders must balance theshort-term needs of their organizations while ensuring a future competitive position.Rowe (2001) defines strategic leadership as “the ability to influence others to voluntarilymake day-to-day decisions that enhance the long-term viability of the organization, whileat the same time maintaining its short-term financial stability” (pp. 82–83). This type ofleadership is a synergistic combination of visionary leadership, which emphasizes invest-ing in the future, and managerial leadership, which emphasizes preserving the existingorder. Strategic leaders focus on both the day-to-day operations and the long-term strategic orientation of the firm, recognizing that neither can be ignored if a firm is to besuccessful.
Importantly, strategic leaders have strong positive expectations of the performance theyexpect from their superiors, peers, subordinates, and themselves (Rowe, 2001). Theseexpectations encourage organizational members to voluntarily make decisions that con-tribute to short-term stability and long-term viability of the organization. As such, strate-gic leaders do not have to expend as much effort on monitoring and controlling employees.It is also important that those leaders who already exhibit strategic leadership abilitiesencourage their development in other organizational members. In this way, strategic lead-ership can exist at all levels of the organization. Strategic leaders also select the next gen-eration of leaders to ensure that the organization will continue to have strategic leadershipin the long term (Boal & Hooijberg, 2000).
STRATEGIC LEADERSHIP VERSUS LEADERSHIP
In Chapter 1 of this casebook, leadership was defined as the process of influencing othersin order to accomplish a goal. The focus was on the relationship between the leader andfollower in a group context and on the process of leading in order to achieve a goal. Sohow is strategic leadership different from leadership? The main difference is that leader-ship can be accomplished at any level of the organization and can have an impact on dif-ferent types of organizational goals, such as increasing the sales of a particular product lineor reducing the turnover of employees.
Strategic leadership, on the other hand, is mainly concerned with, but not necessarilyrestricted to, the higher levels of the organization, given that executives are in a uniqueposition to influence the direction and vision of the organization (Finkelstein & Hambrick,1996). Strategic leadership has an impact on organization-wide outcomes, such as thefinancial performance of a small manufacturing company or the strategic change of a large
Strategic Leadership • 299
11-Rowe-45233.qxd 3/26/2007 12:52 PM Page 299
multinational company. The difference can also be thought of as leadership “in” organiza-tions versus leadership “of” organizations (Boal & Hooijberg, 2001). The leadershipapproaches discussed throughout this book are mainly concerned with how leaders affectfollowers “in” the organization, whereas strategic leadership is primarily concerned with the leadership “of” organization by top managers. But as we saw earlier, leaders atall levels of the organization can have an impact on organizational performance. The focusof strategic leadership is often on top-level executives such as CEOs because they tend tohave more power and are given responsibility for the overall performance of the firm. Theyare also held accountable by shareholders for the success of the firm, and poor perfor-mance can lead to their dismissal.
POSITIONAL VERSUS BEHAVIORAL
In contrast to some of the other theories within the realm of leadership, such as the traitapproach and the skills approach, the strategic leadership perspective is not as well devel-oped. Furthermore, there is a lack of agreement regarding what strategic leadership is. Aswe have seen, strategic leadership has come to have several different, but often comple-mentary, meanings. Some (e.g., Finkerstein & Hambrick, 1996) view it as having to dowith one’s position in a company, while others (e.g., Ireland & Hitt, 1999) view it as a setof behaviors that lead to superior performance.
The positional view argues that anyone holding the position of CEO or another topexecutive position is a strategic leader because of his or her decision-making power andlevel of responsibility. This perspective looks at the differences in psychological charac-teristics of strategic leaders to examine how these differences affect their organizations(Finkelstein & Hambrick, 1996). Others view strategic leadership as a set of activities thatleaders must perform if they are to enhance organizational performance. For example,strategic leaders are those who sustain an effective corporate culture (Ireland & Hitt,1999). A related perspective (Rowe, 2001) on strategic leadership views it as a leadershipstyle that individuals may possess at any level of the organization. Rowe (2001) arguesthat organizations that have CEOs who are strategic leaders will create more value thanthose who have visionary or managerial leaders.
As we saw in the definitions above, there is no consensus on exactly what strategic leader-ship is, but certain themes do emerge. For instance, most of the definitions or conceptualiza-tions of strategic leadership mention the importance of studying CEOs and other top managersto better understand why some firms outperform others. Whether it is viewed as a style of lead-ership, a set of activities, or a broad area of study, strategic leadership is viewed by many ascritical to firm success, especially given our complex, global business environment.
Several themes emerge in the literature concerning what strategic leaders do to increasefirm performance. They look after both the short-term operational side of their organi-zation and the long-term directional aspects, such as defining the firm’s purpose (Phillips& Hunt, 1992; Rowe, 2001). Strategic leaders select and develop other organizationalmembers to ensure that these successful strategic leader abilities will exist throughout theorganization, not just at the top. They influence others by behaving ethically and transpar-ently. Strategic leaders who have overall responsibility for the firm (such as a CEO) artic-ulate a vision that will provide the organization’s members with meaning and guidance.They are also in a position to influence external constituents, such as suppliers, unions,
300 • CASES IN LEADERSHIP
11-Rowe-45233.qxd 3/26/2007 12:52 PM Page 300
and government agencies. Strategic leaders who incorporate these important activities canhelp ensure the future competitiveness of the firm.
NOTE
1. Steven J. Ross is the former chairman and co-CEO of Time Warner.
REFERENCES
Boal, K. B., & Hooijberg, R. (2001). Strategic leadership research: Moving on. The LeadershipQuarterly, 11, 515–549.
Daft, R. L. (2005). The leadership experience (3rd ed.). Mason, OH: Thomson, South-Western.Finkelstein, S., & Hambrick, D. C. (1996). Strategic leadership: Top executives and their effects on
organizations. St. Paul, MN: West.Hosmer, L. T. (1982). The importance of strategic leadership. Journal of Business Strategy, 3, 47–57.House, R. J., & Aditya, R. N. (1997). The social scientific study of leadership: Quo vadis? Journal
of Management, 2(23), 409–473.Ireland, R. D., & Hitt, M. A. (1999). Achieving and maintaining strategic competitiveness in the 21st
century: The role of strategic leadership. Academy of Management Executive, 13, 43–57.Loeb, M. (1993, January 24). Steven J. Ross, 1927–1992. Fortune, p. 4.Phillips, R. L., & Hunt, J. G. (1992). Strategic leadership: A multi-organizational-level perspective.
London: Quorum Books.Rowe, W. G. (2001). Creating wealth in organizations: The role of strategic leadership. Academy of
Management Executive, 15, 81–94.Shrivastava, P., & Nachman, S. A. (1989). Strategic leadership patterns. Strategic Management
Journal, 10, 51–66.
THE CASES
Vic Young and Fishery Products International (A)
Fishery Products International Ltd. is one of the largest seafood companies in NorthAmerica. In January 2000, Vic Young marked his 15th anniversary as the only chief exec-utive officer of the company. Under his leadership, the company overcame the collapse ofthe North Atlantic fishery to become an international seafood company and an importantcontributor to the Newfoundland and Labrador economy. However, its share price has lan-guished, and the company was recently the target of a hostile takeover bid. The bid wasunsuccessful, due partly to government regulation on the company’s stock ownership, butYoung realizes another attempt is possible and wonders how to maintain shareholder con-fidence in Fishery Products’ current board and management team.
Compassion Canada
Compassion Canada is a nonprofit ministry focusing on the holistic development ofpoor children in developing countries. Over the past 10 years, the organization has onlydoubled its sponsorships. The chief executive officer must analyze the organization’s
Strategic Leadership • 301
11-Rowe-45233.qxd 3/26/2007 12:52 PM Page 301

performance and develop a strategic plan that will enable Compassion Canada to reach itsgoal of fivefold growth over the next 10 years.
THE READING
You’re an Entrepreneur: But Do You Exercise Strategic Leadership?
This brief article describes the differences among the concepts of strategic leadership,visionary leadership, and managerial leadership. In addition, it defines strategic leader-ship. It describes two entrepreneurs who developed large organizations that created wealthfor their owners.
302 • CASES IN LEADERSHIP
VIC YOUNG AND FISHERYPRODUCTS INTERNATIONAL (A)1
Prepared by John Melnyk, Tami L. Hynes and W. Glenn RoweCopyright © 2003, Ivey Management Services Version: (A) 2004–02–03
In January 2000, Vic Young marked his 15thanniversary as the chief executive officer (CEO)of Fishery Products International Ltd. (FPI).
As the only CEO of FPI since its inceptionin December 1984, Young had led the companythrough a host of challenges—labor unrest, theloss of a crucial source of supply, internationalexpansion, economic recession and a recent hos-tile takeover bid by competitors.
In the process, FPI had grown to become one ofthe largest seafood companies in North America,producing and selling a wide range of seafoodproducts around the world. Its important role in itshome province’s economy was recognized with aNewfoundland and Labrador Export Award in1998. Young was named Financial Times CEO ofthe Year in 1994, and made an Officer of the Orderof Canada in 1996 as “a model of corporate respon-sibility for industry leaders.”2
FPI’s earnings per share (EPS) from opera-tions for 1999 were $0.72,3 up from $0.55 in1998, a fourth consecutive annual increase.Despite this, the company’s stock had languishedin thin trading on the Toronto Stock Exchange
(TSE), and the company had been the target ofan unsolicited takeover bid in November 1999.Although that bid had been unsuccessful, Youngrealized that another attempt was very possibleand wondered how he could convince sharehold-ers to remain confident in FPI’s current board ofdirectors and management team.
HISTORY
The North Atlantic fishery had a long history.Early explorers returned from voyages to theNew World with stories of fish so numerous “theyimpeded the progress of the ships” and “could bescooped up from the side of the boat in a basket.”
This seemingly inexhaustible resource drewEuropean settlers to the region as early as the1500s. They built a fishery based on hard workand simple technology—small wooden boats,nets handled by hand and family operations—that continued almost unchanged for hundreds ofyears, becoming the basis for a regional eco-nomy and way of life. However fish stocks
11-Rowe-45233.qxd 3/26/2007 12:52 PM Page 302
migrated away from the coastline during winter,so it was a seasonal industry, and thus supportedonly a meager living for most.
The advent of large steam-powered fishingvessels in the mid-1900s held promise to breakthe cycle of seasonal employment and govern-ment support that had become prevalent in the region that by then had become “AtlanticCanada.”4 These large trawlers could follow thefish out to sea in winter and use huge mecha-nized nets to harvest year-round, storing catchesat sea for up to 10 days at a time. This mass-production fishery carried on by company-owned trawlers far out at sea became known asthe “offshore” fishery, and the smaller closer-to-shore operations of independent fisherman as the“inshore” fishery.
The prospect of large catches on a year-roundbasis led to significant investment in new pro-cessing capacity throughout the region, oftengenerously encouraged by government in thehope of generating permanent employment; thenumber of fish processing plants jumped from 89in 1971 to 249 in 1982. These developments ledto widespread economic optimism that drownedout concerns of some fishermen and scientistswho had begun to notice that the fish were not asplentiful as in the past.
By the early 1980s, declining catches, highinterest rates and changing consumer tastestowards higher quality products caused severalfishing companies to fail, despite escalating government loan guarantees and direct subsidiesintended to preserve employment in the region.
In response to this situation, the governmentof Canada and the affected provincial govern-ments stepped in to restructure the Atlantic fish-ery. Two of the largest independent companies,National Sea Products (based in Nova Scotia) andFishery Products Ltd. (based in Newfoundland),were chosen as the vehicles to create an econom-ically viable and competitive industry.
Fishery Products International—A Fresh Start
In December 1984, Fishery Products Ltd.,two other corporate entities and assets from
several other seafood companies were amalga-mated to form Fishery Products InternationalLtd. Through a $150-million package of cashand conversion of debt to equity, the federal gov-ernment ended up holding 63 percent of the newcompany; the Newfoundland and Labrador government, 26 percent and the Bank of NovaScotia, 11 percent.
Vic Young, then chairman and CEO ofNewfoundland Hydro Group, a provincialCrown corporation,5 was jointly appointed by theprovincial and federal governments to lead thenewly formed company. Young had started hiscareer with the provincial government in 1968and had risen to deputy minister of the TreasuryBoard at age 27, from which position he laterserved as special advisor to the Premier ofNewfoundland and Labrador.
At the time of Young’s appointment, FPI wasstill operating under bankruptcy protection andembroiled in a major strike. Young was able toresolve these issues and under his leadership, thecompany quickly embarked on a modernizationprogram, closing or selling marginal assets andinvesting in the 19 processing plants, 58 fishingvessels and eight port facilities it continued tooperate.
FPI operated as a Crown corporation for itsfirst three years, suffering losses in 1984 and1985, but achieving profitability by 1986. As hadbeen planned at the time of the government inter-vention, FPI was then returned to the private sector, albeit with some conditions.
An Act Respecting the Return of the Businessof Fishery Products International Limited toPrivate Investors (the FPI Act), passed by theNewfoundland government to privatize FPI, stip-ulated that no single shareholder could own morethan 15 percent of FPI’s common voting shares;that shareholders could not act in concert to circumvent this provision; that a majority of themembers of the board of directors be residents of Newfoundland; that the company could notapply to continue under another jurisdiction; thatthe company could not exit the business of har-vesting, processing and marketing seafood; andthat only one member of management could be a member of the board of directors. The limit of
Strategic Leadership • 303
11-Rowe-45233.qxd 3/26/2007 12:52 PM Page 303

304
* to
nn
es (
1 to
nn
e ==
2,20
5 p
ou
nd
s)19
9919
9819
9719
9619
9519
9419
9319
9219
9119
9019
8919
8819
87
Land
ings
1*
Gro
undf
ish
21,4
0016
,400
7,80
09,
900
5,20
010
,800
45,0
0069
,000
111,
100
123,
400
139,
300
164,
000
172,
700
She
llfis
h10
,200
8,50
06,
600
5,40
03,
600
4,00
0S
hrim
p16
,100
16,3
009,
400
6,40
06,
400
5,10
0O
ther
1,50
02,
800
3,30
03,
300
300
300
11,4
009,
800
11,8
0012
,400
12,0
0013
,600
8,90
0To
tal
49,2
0044
,000
27,1
0025
,000
15,5
0020
,200
56,4
0078
,800
122,
900
135,
800
151,
300
177,
600
181,
600
Pro
cure
men
t2*
Gro
undf
ish
fille
ts15
,500
15,3
0015
,700
14,5
0016
,100
14,9
0011
,900
8,20
04,
500
4,20
04,
100
2,10
01,
900
Sem
i-pro
cess
ed
3,00
06,
300
8,90
07,
400
7,90
010
,500
4,90
02,
300
——
——
—gr
ound
fish
Raw
shr
imp
2,30
02,
700
2,80
01,
800
1,60
01,
400
n/a
——
——
——
Tota
l20
,800
24,3
0027
,400
23,7
0025
,600
26,8
0016
,800
10,5
004,
500
4,20
04,
100
2,10
01,
900
Val
ue-a
dded
pro
duct
ion
*29
,300
28,7
0029
,300
25,1
0024
,400
25,7
0021
,500
18,9
0019
,300
20,8
0016
,300
17,2
0016
,300
Act
ive
vess
els
1815
1314
1213
3147
5151
6166
66(d
urin
g ye
ar)3
Act
ive
plan
ts
1111
1010
99
1017
1919
1919
19(d
urin
g ye
ar)3
Tota
l em
ploy
ees
3,40
03,
400
3,20
03,
000
2,60
02,
600
3,90
07,
200
8,40
08,
400
8,60
08,
600
8,60
0(d
urin
g ye
ar)3
She
llfis
h in
clud
ed in
Oth
er u
ntil
1994
Shr
imp
incl
uded
in O
ther
unt
il 19
94
Exh
ibit
1Se
lect
ed O
pera
ting
Stat
istic
s
Sour
ce:
FPI A
nnua
l Rep
orts
. Whe
re f
igur
es h
ave
been
res
tate
d in
late
r re
port
s,th
e m
ost r
ecen
t fig
ure
has
been
use
d.
1. L
andi
ngs
wer
e ha
rves
ted
by F
PI it
self
or
purc
hase
d fr
om in
depe
nden
t New
foun
dlan
d fi
sher
men
.2.
Pro
cure
men
t qua
ntiti
es w
ere
obta
ined
oth
er th
an b
y “l
andi
ng,”
prim
arily
fro
m in
tern
atio
nal s
ourc
es.
3. S
ome
of th
e ve
ssel
s,pl
ants
and
em
ploy
ees
show
n as
act
ive
duri
ng th
e ye
ar m
ay n
ot n
eces
sari
ly h
ave
been
act
ive
by y
ear
end.
11-Rowe-45233.qxd 3/26/2007 12:52 PM Page 304
15 percent ownership per shareholder was alsoenshrined in the FPI bylaws.6
Despite these conditions, FPI’s initial publicoffering (IPO), April 15, 1987, was successful,raising $177 million that was used to buy out the governments’ positions. Pension fundsand financial institutions took the bulk of the stock, but 560,000 shares were granted to eligi-ble employees, not including executives.
On its first trading day FPI stock closed up $3from its issue price of $12.50, and within a fewmonths had risen to $21.25. The shares paid divi-dends at an annual rate of $0.48, raised to $0.56 inDecember 1987. That year FPI also distributed $6.6million in profit-sharing to its employees, plus aspecial $1 million “Award for Excellence” for theircontribution to the company’s turnaround; it alsopaid a bonus to its inshore fishery suppliers for their “demonstration of loyalty.” The company’sachievements were recognized with a Gold Medalfor Productivity at the 1987 Canada Awards forBusiness Excellence, and a Canada Export Award.
Even before privatization, Young had setabout to make the company more market-drivenand diversified, investing heavily in technologyand its workforce, in order to be able to meetconsumer demands for higher quality products.
In June 1987, FPI completed the conversionof an old primary-processing7 plant in Burin,Newfoundland, into a world-class secondary-processing7 facility, tripling its capacity to 7,000tonnes per year, well above demand at the time. That same month, FPI entered into a joint-venture agreement to market FPI secondary-processed products in Japan with with NichiroGyogyo Kaisha (Nichiro), the third largestJapanese seafood trading company.
FPI had been exporting raw materials to Japan for years, but the Japanese consumer mar-ket posed very different challenges, including amaze of government regulations, culturally spe-cific business customs and exacting demands forunusual quality and packaging standards.
Nevertheless, FPI persisted, and with the helpof three quality control specialists from Nichiroworking in the Burin plant alongside FPIemployees for a time, eventually achieved the
capability to produce to rigorous Japanese specifications. A successful launch in February1988, made FPI the first North American seafoodcompany to have its value-added products onJapanese retail shelves.
Crises and Changes
In January 1989, the Government of Canadaannounced the first of what was to become aseries of reductions in fishing quotas for theAtlantic Canada fishery, in response to mountingconcerns about the state of the fish stock. Each of these reductions was a hotly debated compro-mise between environmental pressure to protectthe dwindling fish stocks and political pressureto maintain employment in Atlantic Canada bykeeping the fishery open. Before long, the roomfor compromise, like the fish stock itself, wasexhausted, and a complete moratorium on har-vesting several groundfish species,8 includingcod, was imposed on September 6, 1993.
Groundfish, of which cod was the most com-mon and valuable, had been the basis for 85 percent of FPI sales in the late 1980s—in 1987,FP had “landed” (either harvested itself orpurchased from independent Newfoundland fishermen) 172,700 metric tonnes of groundfish,primarily cod; in 1995, it would land just 5,200tonnes, none of which was cod. As a result, 6,000FPI employees eventually lost their jobs, astrawlers were deactivated and plants were closed(see Exhibit 1); even then, capacity utilization inthe remaining plants was only 65 percent.Surplus assets were sold or leased to the extentpossible, but often for only nominal amounts.Newfoundland-based assets had to be writtendown by $85 million, and the company sufferedlosses in the early 1990s (see Exhibits 2 and 3).
During this period, the company did its best tocushion the blow for its employees and theircommunities by spreading what work there wasamong its plants to allow as many workers aspossible to qualify for Employment Insurance9
(EI) payments from the federal government.Nevertheless, labor unrest and angry publicdemonstrations were widespread.
Strategic Leadership • 305
11-Rowe-45233.qxd 3/26/2007 12:52 PM Page 305

306
All
fig
ure
s ’0
00s
1999
1998
1997
1996
1995
1994
1993
1992
1991
1990
1989
1988
1987
Ass
ets
Cur
rent
Ass
ets
Cas
h$
916
933
5,60
94,
981
5,46
01,
659
7,25
63,
595
3,77
66,
190
5,82
834
,102
36,0
48A
ccou
nts
Rec
eiva
ble
80,6
4490
,424
84,1
5578
,178
71,7
4767
,521
58,3
7969
,517
61,9
0567
,945
57,2
4542
,305
38,9
92In
vent
orie
s11
9,47
112
3,86
615
0,01
211
1,37
412
2,00
212
4,15
111
2,12
613
0,44
997
,360
87,5
8887
,909
68,6
3265
,448
Pre
-pai
d E
xpen
ses
5,63
74,
429
3,89
63,
024
2,87
41,
832
1,96
72,
475
2,78
12,
825
2,52
02,
210
2,08
4To
tal C
urre
nt A
sset
s20
6,66
821
9,65
224
3,67
219
7,55
720
2,08
319
5,16
317
9,72
820
6,03
616
5,82
216
4,54
815
3,50
214
7,24
914
2,57
2P
rope
rty,
Pla
nt a
nd
93,6
7789
,318
71,1
6567
,501
66,1
4074
,585
76,6
9495
,907
152,
403
158,
522
159,
334
154,
123
134,
610
Equ
ipm
ent
(P,P
&E
)O
ther
Ass
ets
14,0
5716
,782
11,6
8110
,353
14,8
3912
,985
11,5
0810
,829
6,95
46,
348
16,3
967,
777
1,07
4
Tota
l Ass
ets
$314
,402
325,
752
326,
518
275,
411
283,
062
282,
733
267,
930
312,
772
325,
179
329,
418
329,
232
309,
149
278,
256
Lia
bili
ties
an
d S
har
eho
lder
s’E
qu
ity
Cur
rent
Lia
bilit
ies
Ban
k In
debt
edne
ss$4
3,12
470
,373
65,8
8042
,101
68,4
3051
,410
49,2
6456
,928
21,9
7419
,171
13,8
18—
—A
ccou
nts
Pay
able
&
37,2
5231
,739
41,6
5438
,211
35,0
8445
,488
49,0
7364
,045
48,6
1547
,782
56,7
8241
,853
45,3
63A
ccru
ed L
iabi
litie
sC
urre
nt P
ortio
n of
8,
351
8,26
26,
488
8,54
66,
077
6,35
75,
671
7,36
36,
398
7,55
77,
856
5,92
93,
174
Long
-ter
m L
iabi
litie
sTo
tal C
urre
nt L
iabi
litie
s88
,727
110,
374
114,
022
88,8
5810
9,59
110
3,25
510
4,00
812
8,33
676
,987
74,5
1078
,456
47,7
8248
,537
Long
-ter
m L
iabi
litie
s62
,323
57,4
7158
,351
37,0
4230
,314
32,2
4432
,415
37,4
1434
,230
40,6
1547
,785
38,5
9317
,487
Tota
l Lia
bili
ties
151,
050
167,
845
172,
373
125,
900
139,
905
135,
499
136,
423
165,
750
111,
217
115,
125
126,
241
86,3
7566
,024
Sha
re C
apita
l48
,044
48,4
3949
,148
52,1
1752
,023
51,9
7351
,942
51,9
2616
0,55
816
0,52
416
1,09
915
8,62
115
8,43
0C
ontr
ibut
ed S
urpl
us75
,083
75,3
8375
,836
79,4
1379
,413
79,4
1379
,413
108,
645
Ret
aine
d E
arni
ngs*
41,5
3533
,331
24,9
0516
,712
10,6
0213
,881
—(1
3,86
5)53
,434
53,7
2241
,951
64,1
5353
,802
For
eign
Cur
renc
y (1
,310
)75
44,
256
1,26
91,
119
1,96
715
231
6(3
0)47
(59)
Tran
slat
ion
Adj
ustm
ent
Tota
l Sh
areh
old
ers’
163,
352
157,
907
154,
145
149,
511
143,
157
147,
234
131,
507
147,
022
213,
962
214,
293
202,
991
222,
774
212,
232
Eq
uit
y
Tota
l Lia
bili
ties
an
d
$314
,402
325,
752
326,
518
275,
411
283,
062
282,
733
267,
930
312,
772
325,
179
329,
418
329,
232
309,
149
278,
256
Sh
areh
old
ers’
Eq
uit
y
Exh
ibit
2C
onso
lidat
ed B
alan
ce S
heet
s fo
r Yea
rs E
ndin
g D
ecem
ber
31
* A
ccum
ulat
ed D
efic
it ca
ncel
led
by a
tran
sfer
fro
m C
ontr
ibut
ed S
urpl
us in
199
3.
Sour
ce:
FPI A
nnua
l Rep
orts
. Whe
re f
igur
es h
ave
been
res
tate
d in
late
r re
port
s,th
e m
ost r
ecen
t fig
ure
has
been
use
d.
Con
trib
uted
Sur
plus
incl
uded
in S
hare
Cap
ital a
bove
11-Rowe-45233.qxd 3/26/2007 12:52 PM Page 306

307
All
fig
ure
s $0
00's
exce
pt
per
sh
are
1999
1998
1997
1996
1995
1994
1993
1992
1991
1990
1989
1988
1987
Sal
es$
708,
911
681,
563
675,
945
664,
598
643,
009
665,
596
601,
179
590,
351
542,
937
535,
044
349,
791
366,
611
395,
705
Cos
t of
Goo
ds S
old
633,
124
614,
467
613,
617
606,
473
593,
096
598,
250
549,
844
536,
373
483,
046
468,
924
314,
347
302,
808
285,
671
Gro
ss P
rofit
75,7
8767
,096
62,3
2858
,125
49,9
1367
,346
51,3
3553
,978
59,8
9166
,120
35,4
4463
,803
110,
034
Com
mis
sion
Inc
ome
3,32
72,
382
2,96
83,
665
3,39
44,
645
2,78
96,
502
7,28
18,
437
1,15
6
Gro
ss P
rofit
plu
s 79
,114
69,4
7865
,296
61,7
9053
,307
71,9
9154
,124
60,4
8067
,172
74,5
5736
,600
63,8
0311
0,03
4C
omm
issi
on
Adm
inis
trat
ion
and
45,4
5642
,152
39,9
6339
,865
39,7
1140
,718
32,9
7544
,945
44,9
8847
,335
33,6
8729
,444
27,9
66M
arke
ting
Dep
reci
atio
n an
d 9,
883
8,96
78,
656
7,87
28,
484
8,38
010
,040
12,4
4115
,005
16,6
9414
,849
13,3
6013
,763
Am
ortiz
atio
nP
rofit
Sha
ring
1,54
11,
088
1,06
384
0—
1,68
4—
—11
058
6—
1,83
77,
599
Inte
rest
7,14
67,
467
5,89
05,
669
8,24
26,
786
6,66
76,
210
5,07
44,
566
665
159
46
Ope
ratin
g E
xpen
ses
64,0
2659
,674
55,5
7254
,246
56,4
3757
,568
49,6
8263
,596
65,1
7769
,181
49,2
0144
,800
49,3
74
Ope
ratin
g In
com
e15
,088
9,80
49,
724
7,54
4(3
,130
)14
,423
4,44
2(3
,116
)1,
995
5,37
6(1
2,60
1)19
,003
60,6
60
Gai
n (lo
ss)
on
715
1,00
53,
202
(998
)(1
04)
(1,3
34)
(1,8
08)
(2,2
70)
For
eign
Exc
hang
eG
ain
(loss
) on
21
438
182
959
203
Dis
posa
l of
P,P
&E
Sha
re in
gai
n (lo
ss)
(1,0
27)
(1,6
75)
of jo
int
vent
ure
Ext
raor
dina
ry I
tem
(s)
(965
)(2
0,00
0)(6
5,00
0)(1
85)
7,96
2(7
,500
)26
,959
Inco
me
befo
re
14,1
239,
804
9,72
47,
565
(2,6
92)
15,3
20(1
4,62
1)(6
6,38
6)81
213
,234
(21,
435)
17,1
9585
,349
Inco
me
Taxe
s
Inco
me
Taxe
s4,
097
1,37
81,
531
1,45
558
71,
439
746
913
1,10
01,
463
767
440
27,3
86
Net
Inc
ome
10,0
268,
426
8,19
36,
110
(3,2
79)
13,8
81(1
5,36
7)(6
7,29
9)(2
88)
11,7
71(2
2,20
2)16
,755
57,9
63
Net
Inc
ome
per
shar
e$
0.66
0.55
0.51
0.37
(0.2
0)0.
85(0
.94)
(4.1
0)(0
.02)
0.72
(1.3
8)1.
053.
62
Exh
ibit
3C
onso
lidat
ed S
tate
men
ts o
f In
com
e fo
r Yea
rs E
ndin
g D
ecem
ber
31
Sour
ce:
FPI A
nnua
l Rep
orts
. Whe
re f
igur
es h
ave
been
res
tate
d in
late
r re
port
s,th
e m
ost r
ecen
t fig
ure
has
been
use
d..
11-Rowe-45233.qxd 3/26/2007 12:52 PM Page 307
Over time, FPI was able to compensate somewhat by developing an international procure-ment network to source cod and other groundfish(from Alaska, Iceland, Norway and Russia) forprocessing in Newfoundland and by developinguses for other groundfish species for which the stock in Canadian waters was more plentiful.However, even by 1999, the company’s ground-fish processing was still limited to three plantsoperating on a seasonal basis.
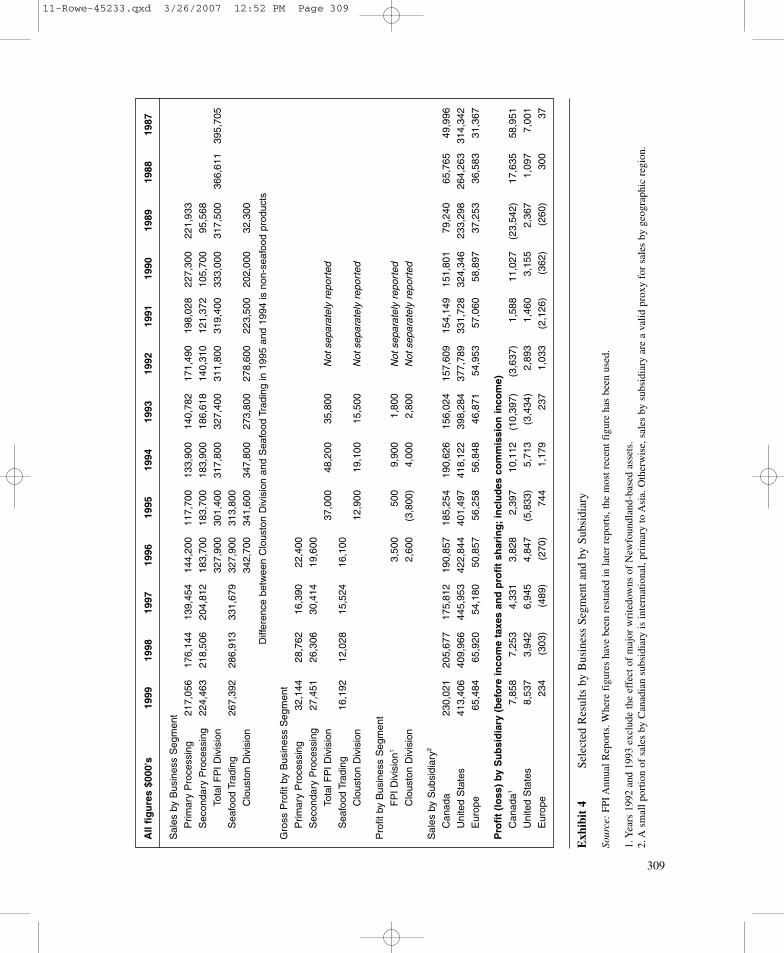
The effect on FPI’s revenue was mitigated by the October 1989 acquisition—FPI’s first—ofClouston Foods of Montreal, an internationalseafood trading, marketing and brokerage opera-tion with a substantial presence in the Canadianmarket. The acquisition operated as a separatedivision for a time, buying and selling seafood,primarily shrimp, throughout the world. Thesenew activities added $202 million to FPI 1990sales (see Exhibit 4), albeit at a lower marginthan the production activities. The Clouston division also came to act as FPI’s marketing armin Canada and Europe, as FPI placed new empha-sis on producing and marketing secondary-processed products.
In September 1992, FPI acquired the U.S.foodservice business of National Sea Products.This strengthened the company’s position in theAmerican market and brought the establishedvalue-added shrimp brand “Treasure Isle” to itsproduct portfolio. At first, FPI had to contract outproduction for this new line, but soon brought itin-house at its Boston plant, as shrimp and othershellfish10 became an important new product cat-egory for the company.
Shrimp was the largest species component of per capita seafood consumption in NorthAmerica on a dollar basis, and demand wasgrowing. In 1990, FPI commissioned a newshrimp freezer trawler to take fuller advantage of the cold-water shrimp resources offNewfoundland and Labrador that were still in ahealthy state. In the following years, it twiceupgraded its shrimp processing facility in Port au Choix and also converted an idle groundfishplant at Port Union to shrimp. By the late 1990s,the company had become dominant in the
Newfoundland cold-water shrimp industry,even introducing a new branding strategy, “FPIIce Shrimp, from the Icy Cold Waters ofNewfoundland.”
By 1995, these adjustments in progress hadstabilized the company’s situation, but there wasa significant downturn in the seafood market thatyear. In response, FPI consolidated its two U.S.processing plants into one (realizing $5 millionfrom sale of the redundant plant), and subse-quently consolidated U.S. warehousing opera-tions around the remaining plant in Danvers,Massachusetts. These changes resulted in annualoperating savings of $2.5 million and superiordistribution capabilities for the U.S. market.
Seafood trading continued to make up a sig-nificant portion of FPI sales. However, towardsthe end of the decade, the company chose tofocus on core product lines and eliminate anycategories in which FPI could not differentiate.
THE SEAFOOD INDUSTRY
Seafood was a global commodity, sourced,processed, sold and consumed worldwide. TheFood and Agriculture Organization of the UnitedNations (FAO) estimated that 30 million peopleworldwide derived a living from the fishingindustry in 1997, and that 95 percent of fisherswere from developing countries.
After increasing steadily for more than 30years, annual world harvest of fish from naturalhabitat had dropped sharply in 1990, stabiliz-ing between 90 million and 95 million tonnesthrough the mid-1990s. The FAO estimated that70 percent of marine species were then beingharvested at, or beyond, sustainable levels. As aresult, aquaculture (fish farming) was becom-ing more important, producing 28 million tonnesworldwide in 1997, more than double the 1990quantity.
Human consumption of seafood grew steadilythroughout the 1990s, but growth was slowingdue to supply constraints. Seafood was generallywell regarded as a healthy and nutritious food,but had to compete with other protein sources
308 • CASES IN LEADERSHIP
11-Rowe-45233.qxd 3/26/2007 12:52 PM Page 308
309
All
fig
ure
s $0
00's
1999
1998
1997
1996
1995
1994
1993
1992
1991
1990
1989
1988
1987
Sal
es b
y B
usin
ess
Seg
men
t
Prim
ary
Pro
cess
ing
217,
056
176,
144
139,
454
144,
200
117,
700
133,
900
140,
782
171,
490
198,
028
227,
300
221,
933
Sec
onda
ry P
roce
ssin
g22
4,46
321
8,50
620
4,81
218
3,70
018
3,70
018
3,90
018
6,61
814
0,31
012
1,37
210
5,70
095
,568
Tota
l FP
I D
ivis
ion
327,
900
301,
400
317,
800
327,
400
311,
800
319,
400
333,
000
317,
500
366,
611
395,
705
Sea
food
Tra
ding
267,
392
286,
913
331,
679
327,
900
313,
800
Clo
usto
n D
ivis
ion
342,
700
341,
600
347,
800
273,
800
278,
600
223,
500
202,
000
32,3
00
Gro
ss P
rofit
by
Bus
ines
s S
egm
ent
Prim
ary
Pro
cess
ing
32,1
4428
,762
16,3
9022
,400
Sec
onda
ry P
roce
ssin
g27
,451
26,3
0630
,414
19,6
00
Tota
l FP
I D
ivis
ion
37,0
0048
,200
35,8
00
Sea
food
Tra
ding
16,1
9212
,028
15,5
2416
,100
Clo
usto
n D
ivis
ion
12,9
0019
,100
15,5
00
Pro
fit b
y B
usin
ess
Seg
men
t
FP
I D
ivis
ion1
3,50
050
09,
900
1,80
0
Clo
usto
n D
ivis
ion
2,60
0(3
,800
)4,
000
2,80
0
Sal
es b
y S
ubsi
diar
y2
Can
ada
230,
021
205,
677
175,
812
190,
857
185,
254
190,
626
156,
024
157,
609
154,
149
151,
801
79,2
4065
,765
49,9
96
Uni
ted
Sta
tes
413,
406
409,
966
445,
953
422,
844
401,
497
418,
122
398,
284
377,
789
331,
728
324,
346
233,
298
264,
263
314,
342
Eur
ope
65,4
8465
,920
54,1
8050
,857
56,2
5856
,848
46,8
7154
,953
57,0
6058
,897
37,2
5336
,583
31,3
67
Pro
fit
(lo
ss)
by S
ub
sid
iary
(b
efo
re in
com
e ta
xes
and
pro
fit
shar
ing
;in
clu
des
co
mm
issi
on
inco
me)
Can
ada1
7,85
87,
253
4,33
13,
828
2,39
710
,112
(10,
397)
(3,6
37)
1,58
811
,027
(23,
542)
17,6
3558
,951
Uni
ted
Sta
tes
8,53
73,
942
6,94
54,
847
(5,8
33)
5,71
3(3
,434
)2,
893
1,46
03,
155
2,36
71,
097
7,00
1
Eur
ope
234
(303
)(4
89)
(270
)74
41,
179
237
1,03
3(2
,126
)(3
62)
(260
)30
037
Exh
ibit
4Se
lect
ed R
esul
ts b
y B
usin
ess
Segm
ent a
nd b
y Su
bsid
iary
Sour
ce:
FPI A
nnua
l Rep
orts
. Whe
re f
igur
es h
ave
been
res
tate
d in
late
r re
port
s,th
e m
ost r
ecen
t fig
ure
has
been
use
d.
1. Y
ears
199
2 an
d 19
93 e
xclu
de th
e ef
fect
of
maj
or w
rite
dow
ns o
f N
ewfo
undl
and-
base
d as
sets
.2.
A s
mal
l por
tion
of s
ales
by
Can
adia
n su
bsid
iary
is in
tern
atio
nal,
prim
ary
to A
sia.
Oth
erw
ise,
sale
s by
sub
sidi
ary
are
a va
lid p
roxy
for
sal
es b
y ge
ogra
phic
reg
ion.
Diff
eren
ce b
etw
een
Clo
usto
n D
ivis
ion
and
Sea
food
Tra
ding
in 1
995
and
1994
is n
on-s
eafo
od p
rodu
cts
Not
sep
arat
ely
repo
rted
Not
sep
arat
ely
repo
rted
Not
sep
arat
ely
repo
rted
Not
sep
arat
ely
repo
rted
11-Rowe-45233.qxd 3/26/2007 12:52 PM Page 309
such as poultry, pork and beef, as well as pasta,all of which were very cost-competitive.
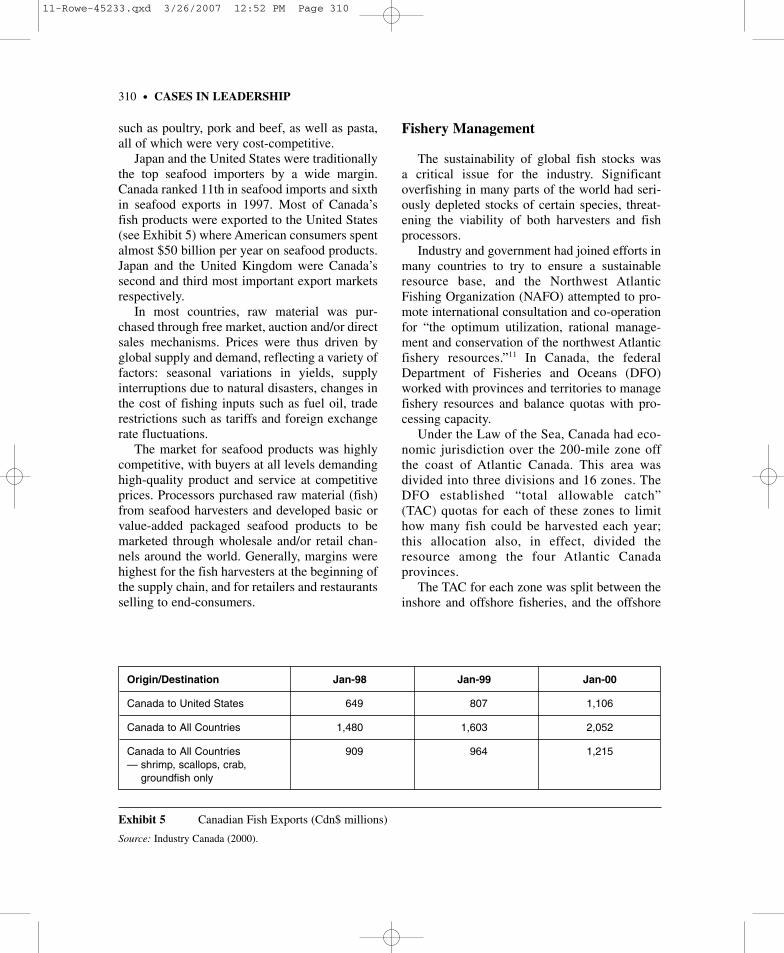
Japan and the United States were traditionallythe top seafood importers by a wide margin.Canada ranked 11th in seafood imports and sixth in seafood exports in 1997. Most of Canada’sfish products were exported to the United States(see Exhibit 5) where American consumers spentalmost $50 billion per year on seafood products.Japan and the United Kingdom were Canada’ssecond and third most important export marketsrespectively.
In most countries, raw material was pur-chased through free market, auction and/or directsales mechanisms. Prices were thus driven byglobal supply and demand, reflecting a variety offactors: seasonal variations in yields, supplyinterruptions due to natural disasters, changes inthe cost of fishing inputs such as fuel oil, traderestrictions such as tariffs and foreign exchangerate fluctuations.
The market for seafood products was highlycompetitive, with buyers at all levels demandinghigh-quality product and service at competitiveprices. Processors purchased raw material (fish)from seafood harvesters and developed basic orvalue-added packaged seafood products to bemarketed through wholesale and/or retail chan-nels around the world. Generally, margins werehighest for the fish harvesters at the beginning ofthe supply chain, and for retailers and restaurantsselling to end-consumers.
Fishery Management
The sustainability of global fish stocks was a critical issue for the industry. Significant overfishing in many parts of the world had seri-ously depleted stocks of certain species, threat-ening the viability of both harvesters and fishprocessors.
Industry and government had joined efforts inmany countries to try to ensure a sustainableresource base, and the Northwest AtlanticFishing Organization (NAFO) attempted to pro-mote international consultation and co-operationfor “the optimum utilization, rational manage-ment and conservation of the northwest Atlanticfishery resources.”11 In Canada, the federalDepartment of Fisheries and Oceans (DFO)worked with provinces and territories to managefishery resources and balance quotas with pro-cessing capacity.
Under the Law of the Sea, Canada had eco-nomic jurisdiction over the 200-mile zone offthe coast of Atlantic Canada. This area wasdivided into three divisions and 16 zones. TheDFO established “total allowable catch”(TAC) quotas for each of these zones to limithow many fish could be harvested each year;this allocation also, in effect, divided theresource among the four Atlantic Canadaprovinces.
The TAC for each zone was split between theinshore and offshore fisheries, and the offshore
310 • CASES IN LEADERSHIP
Origin/Destination Jan-98 Jan-99 Jan-00
Canada to United States 649 807 1,106
Canada to All Countries 1,480 1,603 2,052
Canada to All Countries 909 964 1,215— shrimp, scallops, crab,
groundfish only
Exhibit 5 Canadian Fish Exports (Cdn$ millions)
Source: Industry Canada (2000).
11-Rowe-45233.qxd 3/26/2007 12:52 PM Page 310
quotas were then allocated to individual compa-nies by means of licences, giving them the rightto harvest certain amounts of specific fish. FPIregularly received the largest TAC allocation ofany company.
Fish processors also required licences foreach species; these were issued by provincial and territorial governments. Only Canadian-controlled companies were eligible for theselicences.
These regulations strictly limited foreignaccess to fish stocks off the Canadian coast,and as a consequence, many European nationsimposed high tariffs on Canadian seafoodimports. However, neither Canadian regulationsnor the voluntary NAFO guidelines could pre-vent foreign vessels from fishing just outside the
edge of Canada’s 200-mile economic zone. Thiswas a source of constant concern to the Canadianfishing industry.
Competition
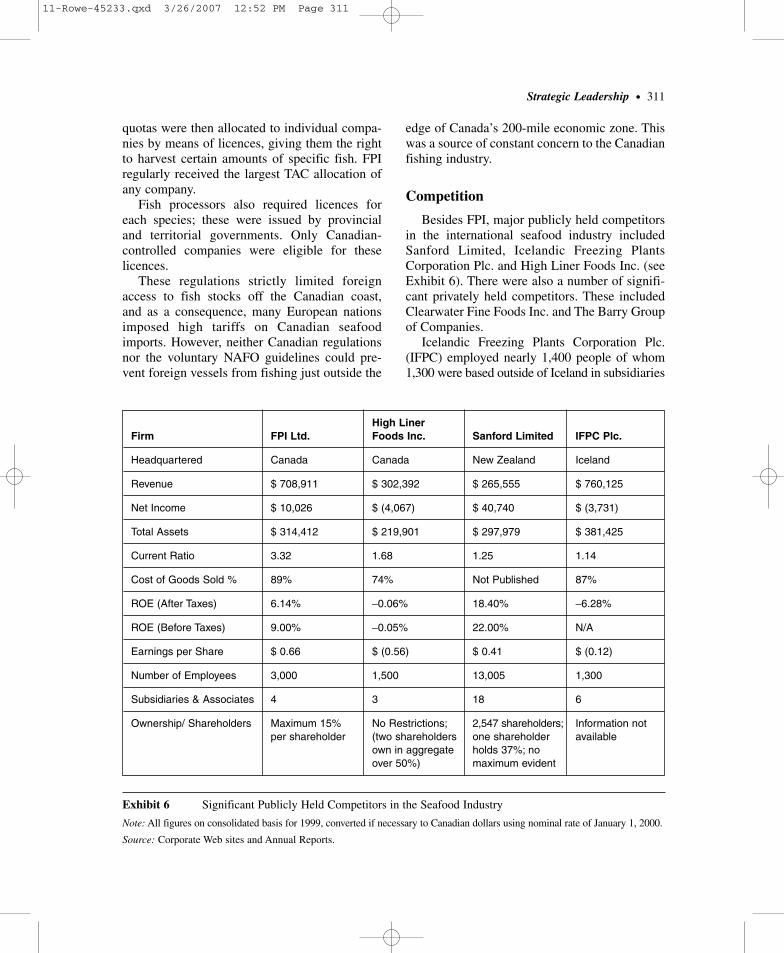
Besides FPI, major publicly held competitorsin the international seafood industry includedSanford Limited, Icelandic Freezing PlantsCorporation Plc. and High Liner Foods Inc. (seeExhibit 6). There were also a number of signifi-cant privately held competitors. These includedClearwater Fine Foods Inc. and The Barry Groupof Companies.
Icelandic Freezing Plants Corporation Plc.(IFPC) employed nearly 1,400 people of whom1,300 were based outside of Iceland in subsidiaries
Strategic Leadership • 311
High LinerFirm FPI Ltd. Foods Inc. Sanford Limited IFPC Plc.
Headquartered Canada Canada New Zealand Iceland
Revenue $ 708,911 $ 302,392 $ 265,555 $ 760,125
Net Income $ 10,026 $ (4,067) $ 40,740 $ (3,731)
Total Assets $ 314,412 $ 219,901 $ 297,979 $ 381,425
Current Ratio 3.32 1.68 1.25 1.14
Cost of Goods Sold % 89% 74% Not Published 87%
ROE (After Taxes) 6.14% −0.06% 18.40% −6.28%
ROE (Before Taxes) 9.00% −0.05% 22.00% N/A
Earnings per Share $ 0.66 $ (0.56) $ 0.41 $ (0.12)
Number of Employees 3,000 1,500 13,005 1,300
Subsidiaries & Associates 4 3 18 6
Ownership/ Shareholders Maximum 15% No Restrictions; 2,547 shareholders; Information not per shareholder (two shareholders one shareholder available
own in aggregate holds 37%; no over 50%) maximum evident
Exhibit 6 Significant Publicly Held Competitors in the Seafood Industry
Note: All figures on consolidated basis for 1999, converted if necessary to Canadian dollars using nominal rate of January 1, 2000.
Source: Corporate Web sites and Annual Reports.
11-Rowe-45233.qxd 3/26/2007 12:52 PM Page 311
located in Europe, Russia, Norway, the UnitedKingdom and the United States. IFPC offeredover 40 species, primarily harvested near Iceland,and sold in over 30 countries including the FarEast. Its customers included large supermarkets,distributors, wholesalers, as well as restaurantsand food processors for its product line of wholefrozen fish, fillets and fillet portions, shellfish anda wide variety of convenience products.
Sanford Limited (Sanford) was New Zealand’slargest seafood company with 18 subsidiaries,associate companies in four countries and 1,500employees. Sanford produced a wide range ofseafood products, primarily for export to Europe(31 percent of sales) and to North and SouthAmerica (23 percent). Sanford was one of theoldest publicly listed companies in New Zealand.One shareholder owned 37 percent of the company.
There were approximately 1,000 seafoodcompanies operating in the United States, and150 in Canada. These varied widely in size andproduct line. Like IFPC and Sanford, many ofthese firms (including FPI) were vertically integrated, fishing from company-owned vessels,processing in company-owned plants, and distributing and marketing through in-houserepresentatives.
Canadian-based High Liner Foods Ltd. (HighLiner), formerly National Sea Products, was thelargest Atlantic Canada-based supplier of freshgroundfish to the U.S. market. It processed andmarketed seafood under High Liner and otherbrands and had a strong position in the retail frozen seafood market. The company operated inNova Scotia, Ontario and the United States andemployed 1,500 people. High Liner procured mostof its raw material internationally, although it alsoharvested approximately 11,000 tonnes of seafoodeach year from Nova Scotia to Labrador. Even so,the company’s advanced processing facilities oper-ated at just over 40 percent capacity. High Linerhad recently diversified into non-seafood productsby acquiring Italian Village, a pasta products oper-ation. Two corporate investors owned more than 50 percent of High Liner’s shares.
The Barry Group of Companies (The BarryGroup), based in Corner Brook, Newfoundland,
was a fourth-generation family business estab-lished in 1910. It owned and operated 17 plantsin Atlantic Canada employing more than 3,000people, and marketed its products under theOcean Leader and Seafreeze brands.
Clearwater Fine Foods Inc., (Clearwater)based in Halifax, Nova Scotia, specialized in lob-ster, sea scallops, surf clams and shrimp. Thecompany owned and operated eight shore-basedprocessing plants in Atlantic Canada as well as23 vessels with capacity to harvest more than20,000 tonnes of fish per year. Clearwateremployed more than 2,000 people, 1,100 ofwhom had been added since the cod moratoriumhad been announced.
FISHERY PRODUCTS
INTERNATIONAL LTD. IN 2000
FPI was headquartered in St. John’s, Newfoundlandand Labrador, Canada, and had subsidiaries inthe United States and Europe.
Company advertisements proclaimed “theFPI flag flies proudly in 42 countries.” FPI main-tained sales offices in Canada (St. John’s,Montreal, Toronto, Calgary and Vancouver),the United States (Danvers, Massachusetts and Seattle, Washington), Reading, England, andCuxhavin, Germany, as well as a brokerage anddistribution network throughout North Americaand Europe. The Canadian operation handledexports to Asia.
The company also had co-packing arrange-ments in shrimp-processing plants in Thailand,Ecuador, Indonesia and Mexico; at fish-process-ing facilities in Norway and Chile; and at aqua-culture farms and secondary-processing plants in China. Integrated information systems keptemployees around the world connected to suppli-ers, customers and each other in real time.
Products and Marketing
FPI produced and marketed primary- andsecondary-processed seafood products including
312 • CASES IN LEADERSHIP
11-Rowe-45233.qxd 3/26/2007 12:52 PM Page 312

cold-water shrimp, snow crab, sea scallops, cod,flounder, sole, redfish, pollock, Greenland hal-ibut, haddock and capelin.
FPI was a leading marketer of primary-processed cold-water shrimp and snow crab inEurope, North America and Asia. Three-quartersof FPI’s value-added sales were to the foodser-vice market (restaurant and hotel chains, airlinecaterers, hospitals, etc.) and wholesale clubstores in the United States. Most of the remain-ing 25 percent went to restaurant and retail markets in Canada, where FPI was the leadingsupplier to the private label market. Some wentto overseas markets, primarily Switzerland,which was the only tariff-free European countryfor Canadian seafood exports in 2000.
The company conducted product develop-ment through a full-time staff of food scientistsand food technologists. FPI’s development staff often worked closely with customer menu-development departments, to generate newprocess concepts and value-added products. Newproduct launches annually generated more than15 percent of FPI sales.
FPI had developed a strong brand and a repu-tation for quality. Buyers frequently requestedFPI products by brand name, and the companywas regularly recognized for its sales and marketing excellence by industry associationsand independent trade organizations. In 1999,FPI received “outstanding supplier” awards fromNorth America’s largest independent foodservicedistributor, largest retail chain, and severalnational restaurant chains.
These customers tended to be somewhat flexible regarding price if they were assured of astable and high-quality supply. However, largecustomers such as McDonald’s, Price Club andRed Lobster posed a special challenge for FPIand all seafood companies because of their pricesensitivity. These customers demanded top qual-ity and excellent service, but were quite preparedto switch suppliers or even change to substitutefoodstuffs at a certain price point.
The company’s seafood trading businessearned commission income by brokering interna-tionally sourced seafood products such as black
tiger and warm water shrimp (which made up 60 percent of trading sales), king crab, farmedscallops, North Atlantic lobster, salmon and seabass. These products, many originating fromaquaculture, were sourced from other producersin North America, Southeast Asia, SouthAmerica and Europe.
Operations
FPI reported its operations in three categories:primary processing, secondary processing andseafood trading (see Exhibit 4).
Primary processing turned fresh-caught fishinto ready-to-market basic products (such asloose fillets or shrimp) or into inputs for furthervalue-added processing. All primary processingwas done in Atlantic Canada through nineprocessing plants, many of which had beenupgraded to state-of-the-art technology.
Secondary processing increased the value ofprimary-processed products by adding non-seafood ingredients such as batter, stuffings andsauces to create finished products ready for con-sumers’ plates. FPI’s two secondary processingplants (Burin, Newfoundland, for the Canadianmarket and Danvers, Massachusetts, for the U.S.market) had recently been upgraded with newtechnologies such as automated weighing, pack-aging and freezing capabilities and now had acombined annual capacity of 43,000 tonnes ofvalue-added products.
All FPI plants were treated as cost centres. Asa result, plant management tended to be verycost-conscious and operated relatively indepen-dently of the marketing side of the company.
Raw material for the plants was partiallysourced by FPI’s own fleet of 18 fishingvessels—12 outfitted for catching groundfish,five for sea scallops and one for shrimp—thatoperated off Newfoundland and Nova Scotia andwere serviced from the company’s refit centre in Burin. This backward integration reducedvolatility in raw material costs and secured a cer-tain volume of supply. However, natural condi-tions and government quotas limited its totalcatch, so FPI also purchased raw material from
Strategic Leadership • 313
11-Rowe-45233.qxd 3/26/2007 12:52 PM Page 313
more than 3,000 independent Newfoundlandfishers, and sourced 25 seafood species fromover 30 countries. FPI technical personnelworked with suppliers at source around theworld to ensure quality and to build long-termsupplier relationships.
Quality Assurance and Environmental Awareness
All seafood companies were required to adhereto strict quality assurance standards. FPI’s qualityassurance practices and processing facilitiescontinually met or exceeded the Canadian FoodInspection Agency’s (CFIA) regulatory require-ments. FPI was periodically audited by the CFIA,the U.S. Food and Drug Administration, the U.S.Department of Commerce and customers.
FPI’s quality management programs werebased on the principles of Hazard AnalysisCritical Control Point (HACCP), originallydeveloped by the Pillsbury Company to providesafe food for American astronauts. An HACCPsystem involved inspection at different points of the production process, rather than simplyinspecting the end product. Many importers,including all U.S. companies, accepted seafoodproducts only from foreign suppliers using anHACCP system.
FPI was committed to maintaining a sustain-able fishery and regularly stated its support forthe DFO’s conservation measures, difficult asthose had been for the company. Manage-ment structure included a standing committeethat monitored operations to ensure regulatorycompliance and sound environmental policies.The company continually improved its fishing practices to avoid catching undersized fish or restricted species and fully supported indepen-dent-observer monitoring of its harvesting oper-ations.
FPI vessels and crew had participated in 25directed research surveys in co-operation withthe DFO to gather scientific data on which TACquotas were based. FPI also supported tworesearch chairs in oceanography and fish conser-vation at Memorial University in St. John’s withmore than $800,000 in grants.
Human Resources
Teamwork and innovation have beenthe heart and soul of our success. . . .While seafood is our business, peopleare our strength.
—Vic Young, FPI 1999 Annual Report
Of FPI’s 3,400 employees worldwide, 3,000worked in Atlantic Canada. The company’sannual reports consistently attributed its successto the commitment of its employees. Turnoverwas low among staff and executive management.
Trawler workers, plant workers and fisherswere unionized through the Fish, Food andAllied Workers (FFAW) affiliated with theCanadian Auto Workers (CAW). The company’srelationships with its employees and theirunions, as well as with the communities in whichit operated, were positive. Many people attrib-uted this to Young, whose negotiating abilitieswere recognized beyond the company; as aspecial mediator for a 1994 labor disputebetween Newfoundland and Labrador teachersand the provincial government, Young was cred-ited with preventing a bitter strike.
Collective agreements had provided for wage increases for FPI’s Newfoundland-basedemployees in eight of the last nine years, and thecompany considered the wages it paid to be“industry-leading.” As well, the company had adefined benefit pension plan and a profit-sharingplan that distributed 10 percent of pre-tax profitbefore extraordinary items to employees. FPI alsoreserved over 200,000 shares issuable at marketvalue for its employee share purchase plan.
In 1997, FPI appointed its first female plantmanager, Angela Bugden, at its Riverport, NovaScotia, scallop-harvesting operation. Bugdenwas also responsible for the five scallop trawlersand the refit yard for those vessels.
As part of its long-standing commitment tothe professional development of its employees,FPI had invested in teamwork training for themanagement teams at its two shrimp plants.Team building posed some special challenges inthe small, closely knit Newfoundland communi-ties, in which a single extended family might
314 • CASES IN LEADERSHIP
11-Rowe-45233.qxd 3/26/2007 12:52 PM Page 314
include a member of plant management, a unionrepresentative, as well as independent fishermenand plant employees. As a result, informationabout cost structure was closely held.
Leadership and Governance
CEO Young had led FPI for all of its 15-yearexistence to date, becoming a prominent figurein the process. During that period, he was namedFinancial Times’ 1994 CEO of the Year, inductedinto the Order of Canada in 1996 and, that sameyear, awarded an honorary doctorate by his almamater, Memorial University.
Young was very active in the businesscommunity, as a director of four other prominentCanadian corporations and a member of anumber of fishing industry associations andadvisory committees. He also regularly lent hissupport and stature to a variety of worthy causes.
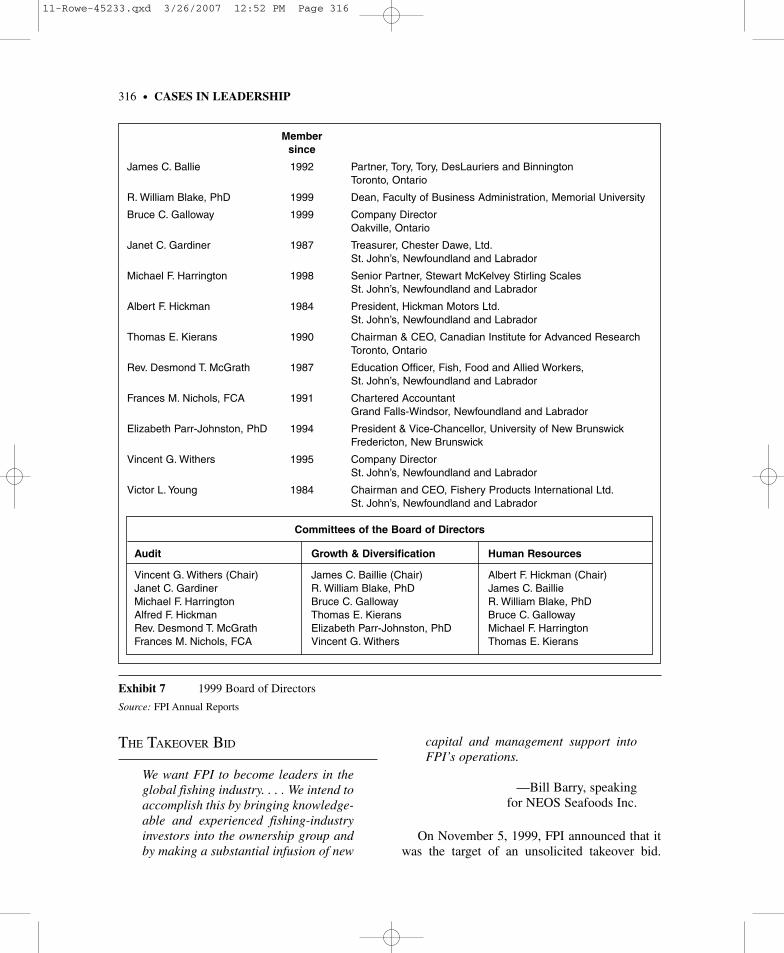
As chairman, CEO and president, Young wasthe only member of management on FPI’s 12-member board of directors (see Exhibit 7). The11 other members were all unrelated, as definedby TSE guidelines. Seven members were fromthe province of Newfoundland and Labrador,three from Ontario and one from NewBrunswick. One position on the Board wasreserved for FFAW, a legacy of the agreementending the 1984 strike at FPI. In 1999, the boardof directors, as a group, owned less than one percent of FPI’s outstanding stock.
The chairperson of the board’s humanresources committee was designated the role ofdealing with matters of governance, includingoverseeing the relationship between the boardand senior management. It was not unusual forsenior management other than Young to attendboard meetings to present business information.However, at each meeting the board held somediscussions without the CEO or other manage-ment in attendance.
Finance
In the early 1990s, the company struggledwith severe industry supply shortages, andrecorded losses from 1991 through 1993 (see
Exhibit 3). Since then, with the exception of aloss in 1995, due to lower quotas and poor mar-ket conditions in the United States and Mexico,EPS had improved every year. In 1999, FPI paida dividend ($0.12 per share) on its common stockfor the first time in 11 years.
FPI practised conservative fiscal manage-ment, maintaining high liquidity and low debt,because “Fish and debt don’t mix,” as Young wasfond of saying. Like other local seafood compa-nies, FPI financed some independent harvestersthrough mortgages secured against their vessels;it had helped some inshore fishers convert theirboats to shrimp fishing in this way. Accountsreceivable credit risk was minimal as FPI’s 10largest customers made up less than 30 percentof sales and no single customer represented morethan six percent.
FPI stock traded on the TSE. Since 1987, itsshare price had declined to a range between $5 to$7 on comparatively low trading volume (seeExhibits 8 and 9). FPI had taken advantage ofthis situation to buy back one million commonshares at an average price of $6.75 during 1997,and continued to buy back shares in 1998(250,300) and 1999 (164,400). Nevertheless, a$100 investment in FPI’s IPO, including rein-vestment of all dividends, was worth only $59.50at the beginning of November 1999. The sameinvestment over that period in the TSE indexwould have been worth $192. However, if placedin High Liner Foods (the successor company to National Sea Products), $100 would havedeclined to less than $6!
During the summer of 1999, FPI initiated dis-cussions with the government of Newfoundlandand Labrador about dropping the 15 percentownership limit per shareholder on FPI stock,arguing that it restricted the company in its abil-ity to raise capital and enter into mergers orstrategic alliances. These discussions resulted inthe understanding that if FPI were to propose amajor initiative requiring large amounts ofcapital, the government would consider remov-ing the share ownership restriction, although theonus would be on FPI to convince shareholders,employees and the communities affected of thewisdom of doing so.
Strategic Leadership • 315
11-Rowe-45233.qxd 3/26/2007 12:52 PM Page 315
316 • CASES IN LEADERSHIP
Membersince
James C. Ballie 1992 Partner, Tory, Tory, DesLauriers and BinningtonToronto, Ontario
R. William Blake, PhD 1999 Dean, Faculty of Business Administration, Memorial University
Bruce C. Galloway 1999 Company DirectorOakville, Ontario
Janet C. Gardiner 1987 Treasurer, Chester Dawe, Ltd.St. John’s, Newfoundland and Labrador
Michael F. Harrington 1998 Senior Partner, Stewart McKelvey Stirling ScalesSt. John’s, Newfoundland and Labrador
Albert F. Hickman 1984 President, Hickman Motors Ltd.St. John’s, Newfoundland and Labrador
Thomas E. Kierans 1990 Chairman & CEO, Canadian Institute for Advanced ResearchToronto, Ontario
Rev. Desmond T. McGrath 1987 Education Officer, Fish, Food and Allied Workers,St. John’s, Newfoundland and Labrador
Frances M. Nichols, FCA 1991 Chartered AccountantGrand Falls-Windsor, Newfoundland and Labrador
Elizabeth Parr-Johnston, PhD 1994 President & Vice-Chancellor, University of New BrunswickFredericton, New Brunswick
Vincent G. Withers 1995 Company DirectorSt. John’s, Newfoundland and Labrador
Victor L. Young 1984 Chairman and CEO, Fishery Products International Ltd.St. John’s, Newfoundland and Labrador
Committees of the Board of Directors
Audit
Vincent G. Withers (Chair)Janet C. GardinerMichael F. HarringtonAlfred F. HickmanRev. Desmond T. McGrathFrances M. Nichols, FCA
Growth & Diversification
James C. Baillie (Chair)R. William Blake, PhDBruce C. GallowayThomas E. KieransElizabeth Parr-Johnston, PhDVincent G. Withers
Human Resources
Albert F. Hickman (Chair)James C. BaillieR. William Blake, PhDBruce C. GallowayMichael F. HarringtonThomas E. Kierans
Exhibit 7 1999 Board of Directors
Source: FPI Annual Reports
THE TAKEOVER BID
We want FPI to become leaders in theglobal fishing industry. . . . We intend toaccomplish this by bringing knowledge-able and experienced fishing-industryinvestors into the ownership group andby making a substantial infusion of new
capital and management support intoFPI’s operations.
—Bill Barry, speaking for NEOS Seafoods Inc.
On November 5, 1999, FPI announced that itwas the target of an unsolicited takeover bid.
11-Rowe-45233.qxd 3/26/2007 12:52 PM Page 316
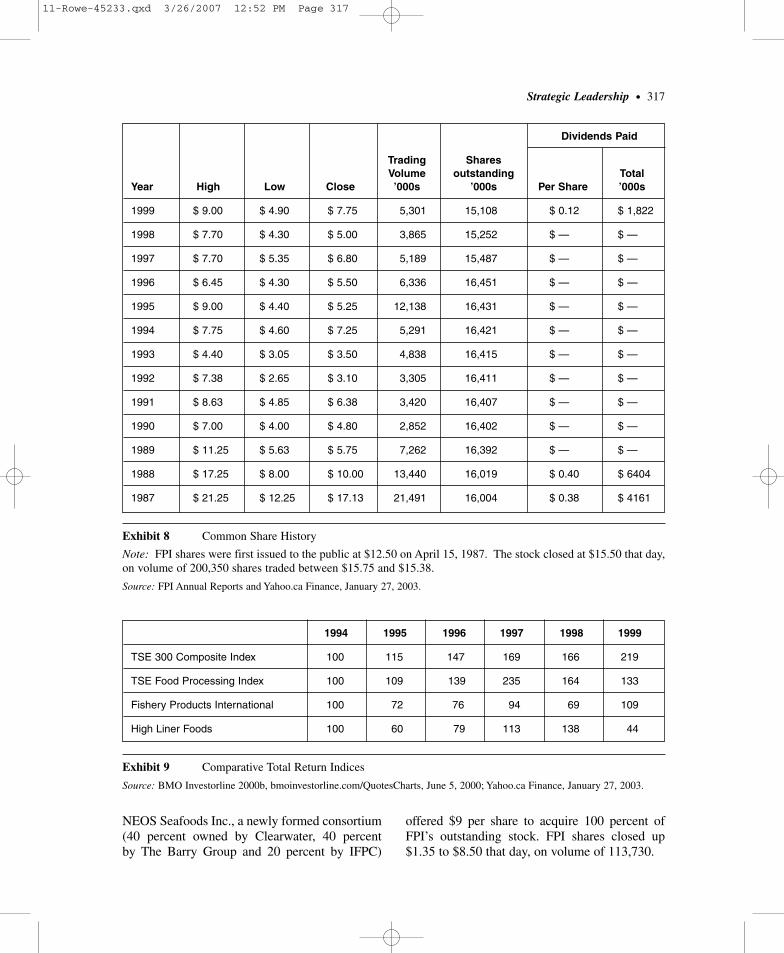
Strategic Leadership • 317
Dividends Paid
Trading Shares Volume outstanding Total
Year High Low Close ’000s ’000s Per Share ’000s
1999 $ 9.00 $ 4.90 $ 7.75 5,301 15,108 $ 0.12 $ 1,822
1998 $ 7.70 $ 4.30 $ 5.00 3,865 15,252 $ — $ —
1997 $ 7.70 $ 5.35 $ 6.80 5,189 15,487 $ — $ —
1996 $ 6.45 $ 4.30 $ 5.50 6,336 16,451 $ — $ —
1995 $ 9.00 $ 4.40 $ 5.25 12,138 16,431 $ — $ —
1994 $ 7.75 $ 4.60 $ 7.25 5,291 16,421 $ — $ —
1993 $ 4.40 $ 3.05 $ 3.50 4,838 16,415 $ — $ —
1992 $ 7.38 $ 2.65 $ 3.10 3,305 16,411 $ — $ —
1991 $ 8.63 $ 4.85 $ 6.38 3,420 16,407 $ — $ —
1990 $ 7.00 $ 4.00 $ 4.80 2,852 16,402 $ — $ —
1989 $ 11.25 $ 5.63 $ 5.75 7,262 16,392 $ — $ —
1988 $ 17.25 $ 8.00 $ 10.00 13,440 16,019 $ 0.40 $ 6404
1987 $ 21.25 $ 12.25 $ 17.13 21,491 16,004 $ 0.38 $ 4161
Exhibit 8 Common Share History
Note: FPI shares were first issued to the public at $12.50 on April 15, 1987. The stock closed at $15.50 that day,on volume of 200,350 shares traded between $15.75 and $15.38.
Source: FPI Annual Reports and Yahoo.ca Finance, January 27, 2003.
1994 1995 1996 1997 1998 1999
TSE 300 Composite Index 100 115 147 169 166 219
TSE Food Processing Index 100 109 139 235 164 133
Fishery Products International 100 72 76 94 69 109
High Liner Foods 100 60 79 113 138 44
Exhibit 9 Comparative Total Return Indices
Source: BMO Investorline 2000b, bmoinvestorline.com/QuotesCharts, June 5, 2000; Yahoo.ca Finance, January 27, 2003.
NEOS Seafoods Inc., a newly formed consortium(40 percent owned by Clearwater, 40 percent by The Barry Group and 20 percent by IFPC)
offered $9 per share to acquire 100 percent ofFPI’s outstanding stock. FPI shares closed up$1.35 to $8.50 that day, on volume of 113,730.
11-Rowe-45233.qxd 3/26/2007 12:52 PM Page 317

Young promptly responded that the offer wasbelow book value per share of $10.75 and“extremely low.” He further pointed out that anysuccessful bid on FPI would have to persuadeboth the shareholders and the Newfoundland andLabrador government to lift the 15 percent own-ership cap in FPI bylaws and provincial legisla-tion respectively, although he also stated that,“We’re not going to hide behind that restrictionin respect to this bid.”
Newfoundland and Labrador Premier BrianTobin described FPI as a “vital institution” butindicated that the government would considerlifting the ownership restriction, given a “dealspecific” acquisition or merger opportunity thatwas deemed to be in the best interest of theprovince. The Telegram (the St. John’s dailynewspaper) quoted Tobin as saying:
Our interest is not a commercial one and our interestis not a shareholder interest. Our interest is a publicpolicy interest. Our analysis will have nothing to dowith shareholder value. . . . our analysis will have todo with how many jobs in how many locations, howmany species, how much technology, how muchtechnology transfer and what new opportunities.
Both FPI and NEOS moved quickly to maketheir respective cases to shareholders, the public andother stakeholders. NEOS took out full-page ads innewspapers throughout the province, explaining itsintentions for the company, highlighting its princi-pals’ track records and claiming that FPI neededmore entrepreneurial management to capitalize on“An Ocean of Opportunity.” Bill Barry, who actedas its primary spokesperson, promised NEOSwould invest in new and existing processing plants,leading to more jobs and longer periods of work, aswell as guarantee a fixed percentage share of FPI’sTAC to existing plants and their communities.
FPI ran its own full-page ads highlighting itsachievements over the past decade and praising its 3,000 Newfoundland-based employees as the“heart and soul” of the company. Over the next fewweeks, Young also issued 10 internal bulletins tokeep employees informed and invited them to con-tact him directly with any questions or concerns,even providing his residence phone number.
Both parties also met with representatives ofthe communities in which FPI operated and ofthe unions that represented the majority of FPIemployees.
Critics of the deal, including FFAW, arguedthat The Barry Group, which already had part-nerships with other fish companies in theprovince, would control the entire shrimp fisheryand much of the crab and cod fisheries if the bidwent through. Concerns were also raised aboutNEOS’s ability to live up to its promises, espe-cially given its announced intention to replace$150 million of FPI equity with debt. FFAW alsocited the positive labor relations climate at FPIand noted that only five of the 17 plants in TheBarry Group were unionized.
By mid-November, FFAW’s 30,000 member-ship had voted “resoundingly” against the deal,and all but two of the municipalities in which FPIoperated plants had stated their opposition to the takeover and urged the government to leavethe ownership cap in place. Buzz Hargrove, pres-ident of the CAW, with which FFAW was affili-ated, called on the provincial government tomake a quick decision to keep the legislativerestrictions in place, and thus end the uncertaintyfor the communities involved.
By contrast, the Fisheries Association ofNewfoundland and Labrador, which representedproducers, was in favor of removing the owner-ship cap. And NEOS contended that shareholderstogether holding over 50 percent of FPI’s shareshad formally asked FPI to hold a shareholdermeeting on or before December 28 to evaluateNEOS’s proposal. (FPI later acknowledged sucha request from shareholders holding more thanfive percent.) It was rumored that some of theseinvestors were also lobbying the government toremove ownership restrictions on FPI.
On November 28, Young and the special com-mittee of the FPI board of directors struck to dealwith this matter issued a circular formally rec-ommending that shareholders reject the NEOSoffer and calling a special meeting of sharehold-ers for January 17, 2000, to consider removal ofthe ownership cap from the company bylaws. Itwas considered inappropriate to hold such a
318 • CASES IN LEADERSHIP
11-Rowe-45233.qxd 3/26/2007 12:52 PM Page 318

meeting during the Christmas season, becausesome shareholders might have to travel a longdistance to attend.
The provincial Progressive Conservativeparty, then in opposition, publicly came outagainst the deal on November 29 and suggestedthat there should be further restrictions on FPI,such as requiring legislative approval to transferharvesting, processing or marketing units withinthe company or to make any changes in the oper-ating status of FPI plants.
The special committee of the FPI board ofdirectors subsequently met with NEOS princi-pals on December 6 to discuss their proposal.According to FPI, this meeting resulted in nonew information and no change of opinion on the offer.
Shortly thereafter, the provincial governmentannounced it would not consider the issue ofremoving the ownership restriction before the NEOS offer was due to expire at the end ofthe month, and NEOS withdrew its offer onDecember 8. That same day, Young announcedthat FPI would be reactivating three of its southcoast processing plants for more than 20 weekseach in the coming year—something that had nothappened for the last seven years.
FPI shares closed down $1.20 to $7.55 onDecember 9 on volume of 35,000. When all wassaid and done, contesting the NEOS bid had costFPI close to $1 million, lowering overall earn-ings per share to $0.66 for the year.
OTHER DEVELOPMENTS
FPI stock had traded much more actively thanusual during the final quarter of 1999, and amongthe transactions were significant purchases bySanford, the New Zealand fishing company.Sanford CEO Eric Barratt indicated that this posi-tion in FPI was a long-term investment, not ashort-term play due to the takeover bid.
By January 2000, Sanford had accumulated a15 percent ownership position in FPI, making itequal to FPI’s other two other major sharehold-ers, MacKenzie Financial Corporation (a Canadian
mutual fund company) and Hamblin WatsaInvestment Counsel (a Toronto investment man-agement firm). The next two largest shareholderswere another family of Canadian mutual fundsand a municipal employees’ pension fund, eachowning 11 percent.
In this context, Vic Young pondered theupcoming special meeting of shareholders andthe many challenges that no doubt lay ahead forhim and for FPI in the year 2000 and beyond.
NOTES
1. This case has been written on the basis of pub-lished sources only. Consequently, the interpretationand perspectives presented in this case are not neces-sarily those of Fishery Products International Ltd. orany of its employees.
2. Governor General of Canada Web site: http://www.gg.ca/Search/honours_descript_e.asp?type=2&id=3624 (January 27, 2003).
3. All currency figures in Canadian dollars,unless otherwise noted.
4. Atlantic Canada is a collective name for thefour Canadian provinces located on the east coast ofCanada bordering the Atlantic Ocean: Newfoundlandand Labrador, Nova Scotia, New Brunswick andPrince Edward Island. The province of Newfoundlandand Labrador comprises the island of Newfoundlandand the mainland region of Labrador.
5. “Crown corporation” is a Canadian term for abusiness entity owned by government.
6. A limit on ownership per shareholder was notunprecedented in Canada. Similar conditions had beenor were still in place for Air Canada (10%), Petro-Canada (15%), Canadian National (15%) andCanadian banks (10%).
7. Primary processing turned fresh-caught fishinto ready-to-market basic products such as loose fil-lets or into inputs for further processing. Secondaryprocessing, also known as value-added processing,increased the value of fresh-caught fish or primary-processed inputs by adding non-seafood ingredientssuch as batter, stuffings and sauces to create finishedproducts ready for consumers’ plates.
8. Groundfish, so named as a category becausethey swim close to the ocean bottom, include cod,flounder, pollock, flounder, redfish, turbot, sole,perch, haddock, greysole, sea bass and yellowtail.
Strategic Leadership • 319
11-Rowe-45233.qxd 3/26/2007 12:52 PM Page 319

9. Employment Insurance was a program oper-ated by the Government of Canada as a financial safetynet to protect Canadians from hardship when they lost their jobs and while they were looking for work. Workers in the fishing industry could qualify for
payments under special terms—in some cases, as littleas 10-weeks’ work.
10. Shellfish, so named as a category because theyhave shells, include shrimp, lobster, crab and scampi.
11. NAFO Web site, www.nafo.ca (January 27, 2003).
320 • CASES IN LEADERSHIP
COMPASSION CANADA
Prepared by Hari Bapuji under the supervision of Professor Glenn RoweCopyright © 2003, Ivey Management Services Version: (A) 2006-10-13
Barry Slauenwhite, chief executive officer (CEO)of Compassion Canada, had reason to be happywhen he reviewed the figures of sponsorshipgrowth in 2002. Compassion Canada had grownfrom 18,684 sponsorships in 2001 to over 21,886in 2002, a growth of 17 percent against the 11percent projected for the year. However,Slauenwhite needed to turn his attention to thetarget of reaching 100,000 sponsorships by 2013.In the last 10 years, Compassion Canada hadonly doubled its sponsorships. Now, the goal wasto achieve a five fold growth in the same amountof time. He needed a strategic plan that wasbased on a comprehensive analysis of the com-petitive landscape and resources and capabilitiesof Compassion Canada.
COMPASSION INTERNATIONAL
INCORPORATED
Compassion Canada was associated with Compas-sion International Incorporated, a Christian non-profit ministry dedicated to the long-term holisticdevelopment of poor children, particularly thosein developing nations. Everett Swanson, anAmerican evangelist established the ministry in1952 in the basement of his house in Chicago.During the early 1950s, Swanson went to SouthKorea to preach to soldiers. In Korea, he wit-nessed the conditions in which many orphaned
and abandoned children lived. He was moved by their condition and established the EverettSwanson Evangelist Association (ESEA). Heappealed to American sponsors to help the needyKorean children with their schooling, clothing,food and health care. In his words :
Christians have a responsibility to share with those inneed. Surely our homes are the finest in the world,and our children are well clothed and happy. Ourtables are spread with good things, and we enjoymany luxuries. Our babies do not need to cry forfood or milk. We ought to thank God for His greatgoodness to America. But while God is good to us,in Korea there are thousands of boys who walk thestreet carrying a little tin can or pail, begging for alittle morsel of bread. More Americans put more intheir garbage can every day than Koreans have to eat.
Soon ESEA grew and attracted a largenumber of supporters who were willing to spon-sor the costs of providing food, education andhealth care to the needy children. In 1963, ESEAchanged its name to Compassion InternationalIncorporated. It worked solely in South Koreauntil it expanded its operations to Indonesia andIndia in 1968. As of June 2002, its operationsspanned over 22 countries in Africa, Asia, theCaribbean, Central America and South America,helping a total of 350,484 children in thesecountries with food, shelter, health care and education. ESEA consisted of eight entities:
11-Rowe-45233.qxd 3/26/2007 12:52 PM Page 320
Compassion International Incorporated, thefounding entity in the Compassion Internatio-nal Incorporated (United States), CompassionCanada; TEAR Fund Great Britain (CompassionUnited Kingdom); Compassion Australia; TEARFund New Zealand; SEL France; CompassionNetherlands; and Compassion Italia. A briefsketch of Compassion organization is presentedin Exhibit 1.
COMPASSION CANADA
Compassion Canada was established in 1963. Itbegan its operations in the basement of a home inBlenheim, Ontario, and moved to its own office suite in London, Ontario, in 1972, shiftingto a bigger office space in 1986. CompassionCanada’s activities, as reflected in its mission andpurpose, revolved around helping needy childrenin developing countries in the areas of education,food, health care and overall development.
Mission
In response to the Great Commission, Compas-sion Canada exists as an advocate for children, torelease them from their spiritual, economic, socialand physical poverty and enable them to becomeresponsible and fulfiled Christian adults.
Purpose
Assisting children to be:
• Christian in faith and deed• Responsible members of their family, church
and community• Self-supporting• Able to maintain their health
In pursuit of its mission and purpose,Compassion Canada found individuals who were willing to sponsor the expenses forchildren, linked individual sponsors with indi-vidual children and helped them maintain thatlink. Compassion Canada believed that most
people cared enough to help needy children, ifthey could find a dependable and reliable mech-anism through which to do so. CompassionCanada aimed to provide that mechanism in anefficient manner so that most of the money col-lected from the sponsors was spent on thechildren. In addition, it implemented projectsaimed at child development through partnershipswith local churches and community memberswho approached Compassion Canada and wereapproved through a stringent screening process.
“The child is the absolute key to whatever we do,” said Slauenwhite. The activities ofCompassion Canada aptly reflected that. As men-tioned, it found sponsors who would support oneor more children by giving Cdn$31 per child per month as a tax deductible donation. In addition, Compassion Canada found donors whowould support larger projects aimed at developingthe communities in which the sponsored childrenlived. A list of current community projects ofCompassion Canada is presented in Exhibit 2.
CHILD SPONSORSHIP
An individual willing to sponsor a child wasrequired to make a tax-deductible donation ofCdn$31 per month to Compassion Canada.Sponsors could choose the child of their choiceor request Compassion Canada to randomlyselect one. The child so sponsored would beenrolled in the project of Compassion Canadaand provided education, food and health care.When Compassion Canada enrolled a child inany of its projects, the funds were committed tohelp the child through to graduation from school(usually until attaining the age of about 16 or 17years, depending on the education system of thecountry in which the child lived). However, itwas not binding on the sponsor to continue tosponsor a child until this age. Sponsorship couldbe discontinued anytime.
Compassion Canada facilitated the interactionbetween sponsor and child. The sponsor wasencouraged to write to the child regularly andwas allowed to send monetary gifts two times in
Strategic Leadership • 321
11-Rowe-45233.qxd 3/26/2007 12:52 PM Page 321

322 • CASES IN LEADERSHIP
DONORS
AND
SPONSORS
NEEDY
CHILDREN
Co-ordinationwith Sponsors
and Donors
Examples ofProject
Co-ordination &Administration
ProjectImplementation
TEAR FundGreat Britain(Compassion
United Kingdom)
CompassionAustralia
CompassionInternationalIncorporated
(U.S.)
CompassionCanada
TEAR FundNew Zealand
SEL France
CompassionNederlands
CompassionItalia
CompassionProject Office –
DominicanRepublic
CompassionProject Office –
Ethiopia
CompassionProject Office –
Guatemala
LocalImplementing
Partners
LocalImplementing
Partners
CompassionProject Office –Mozambique
CompassionProject Office –
Tanzania
CompassionProject Office –
Uganda
LocalImplementing
Partners
Exhibit 1 Schematic Diagram of Compassion Activities
11-Rowe-45233.qxd 3/26/2007 12:52 PM Page 322

Strategic Leadership • 323
EDUCATION
Vocational and Primary Education
These projects focus on skills development for young people. Compassion Canada’s primary education effortsare presently related to programs with children that fall outside of standard child development work (e.g., streetchildren). Vocational training involves essential life trade skills for teens in areas such as carpentry, metal-work,hairdressing, tailoring and other clothing pattern work.
Current Projects
• Bujora Children’s Home Vocational Training Centre—Tanzania
• Casa de Plastilina Children’s Education—Mexico
• Community Leaders Educated AIDS Response (CLEAR) Phase II—Kenya
• Kumi Staff Training—Uganda
• Meals for Children Program: Day Love Children’s Project 2001-2002—Kenya
• Meals for Children Program: Mathare Street Children Rescue Centre 2001-2002—Kenya
• Mukura Technical School Expansion—Uganda
• Ukuru Community Development—Uganda
HEALTH
Primary Health Care
Compassion Canada’s primary health-care partnerships focus on important preventative measures—likeimmunization, personal hygiene, nutrition, and health training for mothers with children under five years of age.
Current Projects
• Children’s Medical Program: House of Hope—Haiti
• Children’s Medical Program: Kiwoko Hospital Community Health Care—Uganda
• Community Leaders Educated AIDS Response (CLEAR) Phase II—Kenya
• Dessalines Community Health Program—Haiti
• Rubirizi Gravity Flow Water Project—Uganda
• Ukuru Community Development—Uganda
CLEAN WATER
Clean-Water Supply
Compassion Canada supports initiatives aimed at supplying clean water to families. This may take the form ofgravity-fed water systems in mountainous areas, well drilling or spring capping. Often the projects also include a sanitation component, such as the building of pit latrines, as uncontaminated water and effective wastemanagement measures need to be in harmony.
Current Projects
• Agwata Water and Sanitation—Uganda
• Rubirizi Gravity Flow Water Project—Uganda
Exhibit 2 Community Project Types (Continued)
11-Rowe-45233.qxd 3/26/2007 12:52 PM Page 323
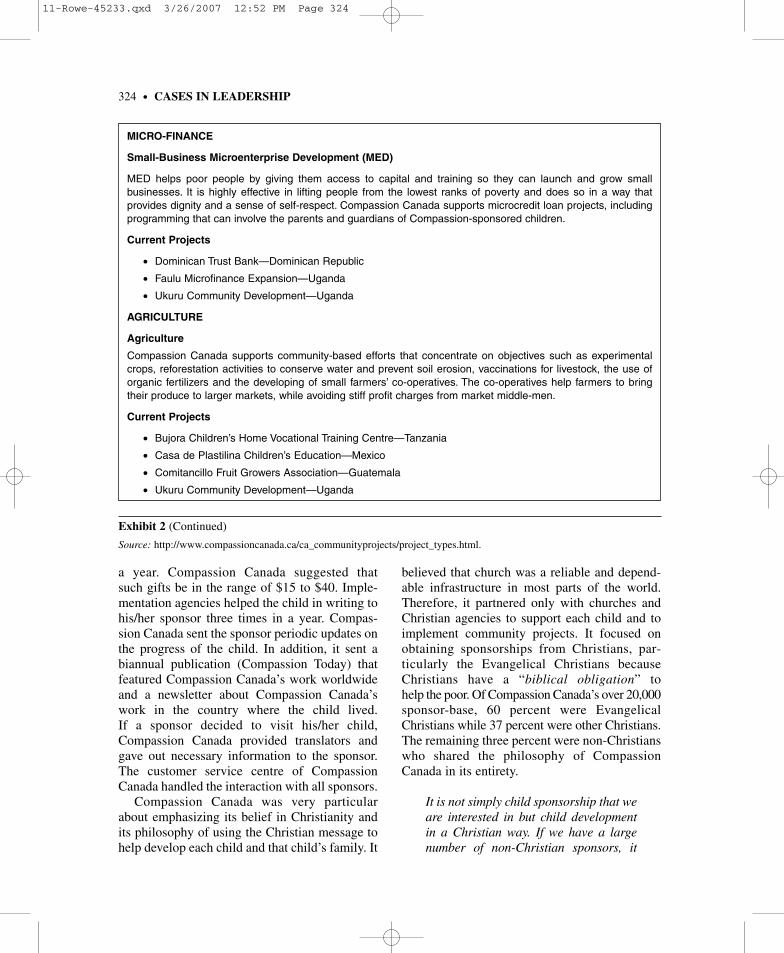
a year. Compassion Canada suggested that such gifts be in the range of $15 to $40. Imple-mentation agencies helped the child in writing tohis/her sponsor three times in a year. Compas-sion Canada sent the sponsor periodic updates onthe progress of the child. In addition, it sent abiannual publication (Compassion Today) thatfeatured Compassion Canada’s work worldwideand a newsletter about Compassion Canada’swork in the country where the child lived. If a sponsor decided to visit his/her child,Compassion Canada provided translators andgave out necessary information to the sponsor.The customer service centre of CompassionCanada handled the interaction with all sponsors.
Compassion Canada was very particularabout emphasizing its belief in Christianity andits philosophy of using the Christian message tohelp develop each child and that child’s family. It
believed that church was a reliable and depend-able infrastructure in most parts of the world.Therefore, it partnered only with churches andChristian agencies to support each child and toimplement community projects. It focused onobtaining sponsorships from Christians, par-ticularly the Evangelical Christians becauseChristians have a “biblical obligation” to help the poor. Of Compassion Canada’s over 20,000sponsor-base, 60 percent were EvangelicalChristians while 37 percent were other Christians.The remaining three percent were non-Christianswho shared the philosophy of CompassionCanada in its entirety.
It is not simply child sponsorship that weare interested in but child developmentin a Christian way. If we have a largenumber of non-Christian sponsors, it
324 • CASES IN LEADERSHIP
MICRO-FINANCE
Small-Business Microenterprise Development (MED)
MED helps poor people by giving them access to capital and training so they can launch and grow smallbusinesses. It is highly effective in lifting people from the lowest ranks of poverty and does so in a way thatprovides dignity and a sense of self-respect. Compassion Canada supports microcredit loan projects, includingprogramming that can involve the parents and guardians of Compassion-sponsored children.
Current Projects
• Dominican Trust Bank—Dominican Republic
• Faulu Microfinance Expansion—Uganda
• Ukuru Community Development—Uganda
AGRICULTURE
Agriculture
Compassion Canada supports community-based efforts that concentrate on objectives such as experimentalcrops, reforestation activities to conserve water and prevent soil erosion, vaccinations for livestock, the use oforganic fertilizers and the developing of small farmers’ co-operatives. The co-operatives help farmers to bringtheir produce to larger markets, while avoiding stiff profit charges from market middle-men.
Current Projects
• Bujora Children’s Home Vocational Training Centre—Tanzania
• Casa de Plastilina Children’s Education—Mexico
• Comitancillo Fruit Growers Association—Guatemala
• Ukuru Community Development—Uganda
Exhibit 2 (Continued)
Source: http://www.compassioncanada.ca/ca_communityprojects/project_types.html.
11-Rowe-45233.qxd 3/26/2007 12:52 PM Page 324

would be difficult for them as well as for us. There were occasions when weturned down offers of huge money fromsome donors because they did not shareour philosophy. They would either ask usto work on areas that we were not inter-ested in or ask us to be secular. In fact,we even stopped actively approachingthe Canadian government for financialsupport because it expected agenciesthat received government aid to maintaina secular nature in their activities. Inaddition, government aid had the poten-tial of diverting a large part of our ener-gies towards interfacing with them.
—Barry Slauenwhite, CEO
In the past, Compassion Canada targeted allsegments of the population, including youngand high school-age sponsors who were moreready to lend a helping hand. However, overtime, the focus has been refined to target youngmarried couples and post high school sponsorswho tended to remain sponsors for a longertime. Compassion Canada enlisted the supportof sponsors largely through promotion andadvertising. It adopted a multipronged approachto promotional campaigning. First, it deployedChristian speakers and artists who supportedCompassion Canada and were willing to pro-mote its cause as part of their speaking orsinging engagement. These artists became theambassadors of Compassion Canada’s cause.Second, it advertised on a growing network of15 Christian radio stations throughout Canada.Third, it requested sponsors to promote itscause, in what was termed “Awareness toAdvocacy.” Sponsors were encouraged toapproach pastors to promote CompassionCanada one Sunday each year; the Sundayselected was the last Sunday in May. Further,sponsors were encouraged to enrol new spon-sors and volunteer their own time and effort topromote the cause of Compassion Canada.
Compassion Canada acquired sponsorsthrough many ways. It participated in Christianevents such as Kingdom Bound, Creation West,Teen Mania, Missions Fest Edmonton, and YC
Edmonton. It helped sponsor these events andused them to promote the concept of child spon-sorship and enrol new sponsors. It received spon-sorships as a result of the Compassion Sundaythat was held in churches. Speakers and artistswho promoted the cause of Compassion Canadaoften persuaded their audience members to spon-sor children. Compassion Canada’s own staff,volunteers, existing sponsors, Internet and theCompassion Today magazine were other sourcesthrough which new sponsors were acquired.Acquisition of sponsorships through each ofthese sources is presented in Exhibit 3.
Acquiring sponsors was not an easy task andrequired investment of resources in advertisingand marketing. Compassion Canada believedthat it was important to be cost-effective, notonly in sponsor management but in the sponsoracquisition as well. Accordingly, the ministrystrived to bring down these costs continuouslyeach year. In 2001, Compassion Canada spent anaverage of $103 to acquire a sponsor, whereas inthe years 1999 and 2000, the costs were $121and $130, respectively.
Compassion Canada strived to ensure thatoverhead costs (cost of raising funds andadministration costs) were less than 20 percentand program costs (costs towards child sup-port, grants and services, field services, spon-sor ministry and gifts in kind) were over 80percent. A breakdown of the costs over the lastfive years is presented along with a pictorialrepresentation of how sponsorship money wasspent in Exhibit 4.
Compassion Canada consisted of 27 full-timeemployees. Besides the full-time employees,many individuals who shared its cause volun-teered their services. These volunteers attendedthe office as per a prearranged work scheduleand performed activities such as mailing, readingletters, sending letters, etc. About 40 volunteersperformed the work of three full-time staffmembers in 2002. Availability of staff wasreviewed every quarter to ensure that an appro-priate number of employees were available tosmoothly manage the operations. An additionalemployee was hired for every 1,000 new spon-sorships expected. When a new employee was
Strategic Leadership • 325
11-Rowe-45233.qxd 3/26/2007 12:52 PM Page 325

hired, besides the qualifications, their sense ofcommitment to Compassion Canada’s cause andphilosophy was evaluated. Typically, CompassionCanada employees were over-qualified for theirjobs but joined because they had “a sense ofcalling” and decided to do something that wasintrinsically satisfying. Each employee wastrained in Compassion Canada’s systems depart-ment for a period of six months before beinggiven a formal responsibility. CompassionCanada had not laid off any employee in its 40-year history although some were asked to leavefor reasons of under-performance.
When an employee had served CompassionCanada for a period of five years, that person wassent to visit one of the overseas projects to meetwith sponsored children and to witness in personthe real impact of their work. Major events andachievements were celebrated within Com-passion Canada. For example, when CompassionCanada crossed the 20,000 sponsorships mark,Slauenwhite organized a huge dinner for theemployees because crossing that mark meantthat Compassion Canada had “changed the livesof 20,000 children.”
Compassion International Incorporated, withwhich Compassion Canada was associated, reliedheavily on planning and co-ordination. Conse-quently, Compassion Canada was required tosend monthly projections of its growth toCompassion International Incorporated. Theseprojections were made one year in advance andwere based on sound planning. Each of the pro-jections was supported by the campaign eventsplanned, number of people expected to attendand the number of people likely to become spon-sors. When an individual became a sponsor,their profile was prepared and added to the spon-sor database. These profiles were periodicallyanalysed to understand the characteristics so thatpersons with similar profiles could be targeted inthe future for child sponsorships. Although thegrowth in Compassion Canada was high, it wascontrolled growth.
CHILD DEVELOPMENT STRATEGY
Compassion Canada’s approach to child devel-opment was different from the approach of other
326 • CASES IN LEADERSHIP
Source Number
Christian Events 766
Canadian Office (from another sponsor/donor, Web, etc.) 749
Campaigns (such as Compassion Sunday) 529
Speakers 310
Staff 302
Volunteers 213
U.S. Office (from other sponsors, Web, etc.) 116
Artists 46
Advertising (Compassion Today magazine) 31
Other 303
Exhibit 3 Sponsorships by Source (July 2000 to June 2001)
Source: Company files.
11-Rowe-45233.qxd 3/26/2007 12:52 PM Page 326

similar organizations. The organization believedthat to develop a child, one must help the childdirectly by providing food, education, healthcare, shelter and spiritual development in aChristian way. Accordingly, Compassion Canadafocused most of its energies on child sponsor-ship. Other agencies followed a somewhat differ-ent strategy. They focused their energies onhelping the communities and families to become
self-sufficient. Focus on children was, therefore,not as visible in their projects and activities,although their mission was “child development.”
Most of the child sponsorship agencies fol-lowed a community-based approach to child develop-ment, while Compassion Canada employed a directapproach in which the child sponsorship moneywas spent exclusively on child development bylinking the sponsor and the child on a one-to-one
Strategic Leadership • 327
Activity 2002 2001 2000 1999 1998 1997
Raising funds 838,367 722,639 676,558 660,881 646,761 601,032
Administration 522,267 495,512 430,420 438,813 335,638 328,519
Child support 6,311,438 5,407,600 4,842,005 4,498,724 3,482,028 3,215,897
Sponsor ministry 431,236 442,808 315,630 266,564 294,198 273,411
Child Support49%
Administration9%
Fund-raising10%
Gifts in Kind1%
SponsorMinistry
6%
Grants &Services
15%
FieldServices
10%
Typical distribution of sponsorship income
Notes:• Child support component reflects the money used to provide learning opportunities for registered and
sponsored children.• Sponsor ministry supports letter translation, pays cost of child photographs and other incidental expenses
related to strengthening the relationship of child and sponsor
Exhibit 4 Usage of Sponsorship Income (1997 to 2002)
Source: Company files.
11-Rowe-45233.qxd 3/26/2007 12:52 PM Page 327
basis. Compassion Canada’s other programs ran parallel to child sponsorship and supportedchild development in an indirect manner. Theorganization raised money for community pro-jects through a separate stream, and utilized themand accounted for them under a separate heading.On the other hand, the money raised by the orga-nizations that followed the community-basedapproach was pooled together and centrally allocated for various projects aimed at childdevelopment, including direct benefits to childrenin the form of education, food and health care.Among the child sponsorship agencies inCanada, World Vision Canada, Foster ParentsPlan and Christian Children’s Fund of Canadawere prominent competitors for the sponsorshiprevenue that Compassion Canada needed to fulfilits mission. Financial and other details of theseorganizations and Compassion Canada are pre-sented in Exhibit 5.
World Vision Canada
World Vision Canada (WVC) was “a Christianhumanitarian organization that reached out to theWorld’s poor.” It was established in 1950 to carefor orphans in Asia. WVC worked to “create apositive and permanent change in the lives ofpeople suffering under the oppression of povertyand justice through long-term sustainable devel-opment.” WVC’s approach to child developmentwas based on its community-based strategy, i.e.,to initiate projects that were aimed at communitydevelopment so that the community itselfbecame self-sufficient over time and took care ofits children. It developed an area developmentprogram (ADP) model to help communitiesachieve sustainable development. Activitiesincluded emergency relief (in cases of naturalcalamities such as drought, floods, earthquake,etc.), health related projects (such as tuberculo-sis, AIDS and nutritional health projects), andlong-term development projects (such as sanita-tion, irrigation, vocational training and farming).
Almost 80 percent of WVC’s funding camefrom private sources, including individuals, cor-porations and foundations. The remainder came
from governments and multilateral agencies.Besides the cash contributions, WVC accepted“gifts in kind,” typically food commodities, med-icine and clothing donated through corporationsor government agencies.
Approximately half of WVC’s programs werefunded through child sponsorship. In 2001, morethan 207,000 Canadians supported its childsponsorship program. The money so receivedfrom Canada and other countries across theworld was pooled together and centrally allo-cated to projects that were designed to support1.6 million children in 40 countries.
Foster Parents Plan
Foster Parents Plan (FPP) of Canada was amember of Plan International, which was foundedin 1937, as “Foster Parents Plan for Children inSpain” to help children whose lives were dis-rupted by the Spanish Civil War. With the out-break of the Second World War, Plan Internationalextended its work to include displaced childrenwithin war-torn Europe in the 1940s. Gradually,its operations expanded to other countries and asof 2001, it was organized into 16 national organi-zations, of which Canada was one (also known as donor countries), an international headquartersand over 40 program countries.
FPP implemented projects in health, educa-tion, water, sanitation, income-generation andcross-cultural communication. Most of the fundsfor its community projects came from individualsponsors. FPP actively involved local communi-ties in setting up and implementing projects,including families and children. Its motto was“sustainable development: a better world forchildren now and in the long-term future.” FPPbelieved that to help a child in a lasting way,the organization must also help that child’sfamily and the local community to become self-sufficient.
FFP identified the countries in need of devel-opment work with the help of a number of crite-ria, such as infant mortality rates (more than 25deaths per 1,000 live births), per capita grossnational product (less than US$1,700), and
328 • CASES IN LEADERSHIP
11-Rowe-45233.qxd 3/26/2007 12:52 PM Page 328
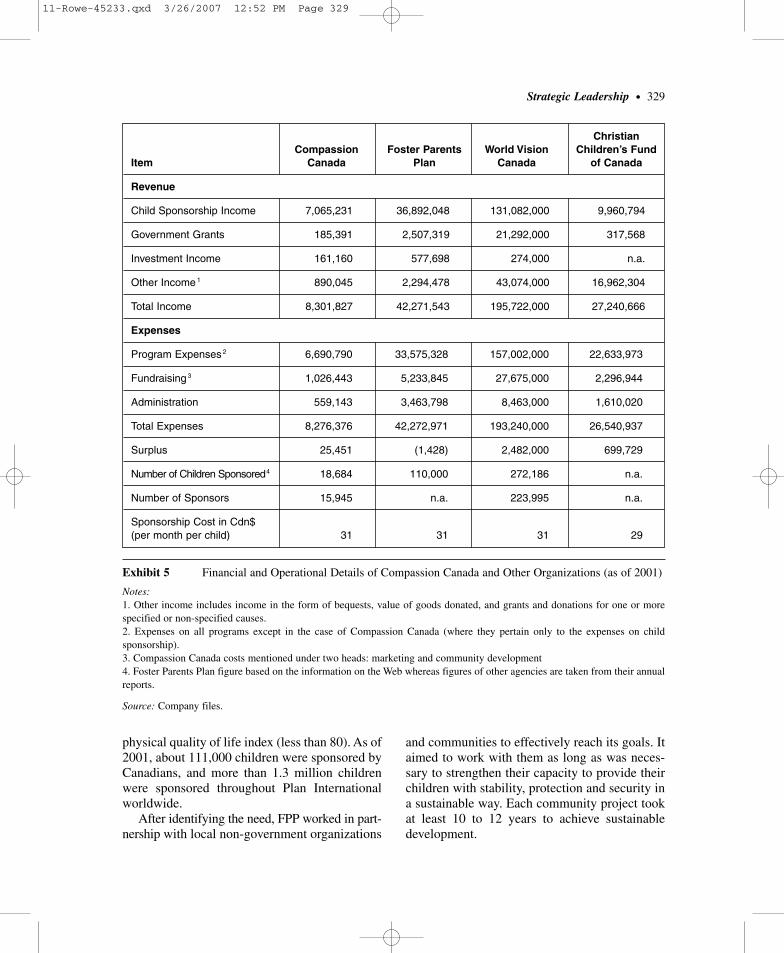
physical quality of life index (less than 80). As of2001, about 111,000 children were sponsored byCanadians, and more than 1.3 million childrenwere sponsored throughout Plan Internationalworldwide.
After identifying the need, FPP worked in part-nership with local non-government organizations
and communities to effectively reach its goals. Itaimed to work with them as long as was neces-sary to strengthen their capacity to provide theirchildren with stability, protection and security ina sustainable way. Each community project tookat least 10 to 12 years to achieve sustainabledevelopment.
Strategic Leadership • 329
Christian Compassion Foster Parents World Vision Children’s Fund
Item Canada Plan Canada of Canada
Revenue
Child Sponsorship Income 7,065,231 36,892,048 131,082,000 9,960,794
Government Grants 185,391 2,507,319 21,292,000 317,568
Investment Income 161,160 577,698 274,000 n.a.
Other Income 1 890,045 2,294,478 43,074,000 16,962,304
Total Income 8,301,827 42,271,543 195,722,000 27,240,666
Expenses
Program Expenses 2 6,690,790 33,575,328 157,002,000 22,633,973
Fundraising 3 1,026,443 5,233,845 27,675,000 2,296,944
Administration 559,143 3,463,798 8,463,000 1,610,020
Total Expenses 8,276,376 42,272,971 193,240,000 26,540,937
Surplus 25,451 (1,428) 2,482,000 699,729
Number of Children Sponsored4 18,684 110,000 272,186 n.a.
Number of Sponsors 15,945 n.a. 223,995 n.a.
Sponsorship Cost in Cdn$(per month per child) 31 31 31 29
Exhibit 5 Financial and Operational Details of Compassion Canada and Other Organizations (as of 2001)
Notes:1. Other income includes income in the form of bequests, value of goods donated, and grants and donations for one or morespecified or non-specified causes.2. Expenses on all programs except in the case of Compassion Canada (where they pertain only to the expenses on childsponsorship).3. Compassion Canada costs mentioned under two heads: marketing and community development4. Foster Parents Plan figure based on the information on the Web whereas figures of other agencies are taken from their annualreports.
Source: Company files.
11-Rowe-45233.qxd 3/26/2007 12:52 PM Page 329

In 2001, when Canadian contributions werecombined with those of other supporters aroundthe world, over $365 million went to programimplementation. Of this amount, over 24 percentwas spent on habitat projects, roughly 20 percenton education, over 11 percent on health, 12 per-cent on building relationships and six percent onlivelihood.
Christian Children’s Fund of Canada
Christian Children’s Fund was founded in1938 by Dr. J. Calvitt Clarke, a Virginia mission-ary, to care for Chinese-Japanese war orphans. Hecalled it the China Children’s Fund. It expandedinto Europe during the Second World War andbecame Christian Children’s Fund. CCF Canada(CCFC) was formed in 1960. As of 2001, morethan 600,000 children were supported by CCFCand its International Co-operative of ChristianChildren’s Fund around the world.
CCFC believed in making the communitiesself-sufficient so that children were taken careof by the community in the long run. Thesponsorship amount received each month was spent on “providing food, clothing, shel-ter, medical care, education, school suppliesand love to the sponsored” child. It was alsospent to provide food, health care, vocationaltraining, and agricultural expertise to thesponsored child’s family and to the child’scommunity. CCFC’s projects included clean
water wells, immunization programs andmicro-enterprise training.
The organization derived its revenue mainlyfrom monthly sponsorship support for children,families and communities. Other sources of support were: donated goods and contributions,general contributions and bequests from public,and restricted or specific contributions that weredonated for a particular purpose or project.
COMPASSION CANADA’S
TARGET OF 100,000 BY 2013
Barry Slauenwhite, the chief executive officer ofCompassion Canada, believed in taking a profes-sional approach to the management of non-profitorganizations. With experience in industry and pas-toral service and the sense of God’s calling in hisheart, he was in a perfect position to professional-ize and grow the activities of Compassion Canada.
Compassion Canada had set itself a target of100,000 child sponsorships by 2013. To achievethat target, the organization needed to reach itsprojected figure of 26,150 for 2003 and then growat the rate of 15 percent per year. Projections andgrowth in child sponsorships over the past fewyears are presented in Exhibit 6. Reaching thefigure of 100,000 in 2013 would be a greatachievement for Compassion Canada for it wouldmark two milestones: 50 years of operations and100,000 children.
330 • CASES IN LEADERSHIP
Number of children sponsored 2002 2001 2000 1999 1998 1997 1996 1995
Projected 20,775 17,800 16,473 15,732 14,898 14,196 13,330 12,310
Actual 21,886 18,684 16,659 15,377 14,505 13,556 12,818 12,088
Exhibit 6 Growth in Compassion Canada—Projected Versus Actual
Source: Company files.
11-Rowe-45233.qxd 3/26/2007 12:52 PM Page 330
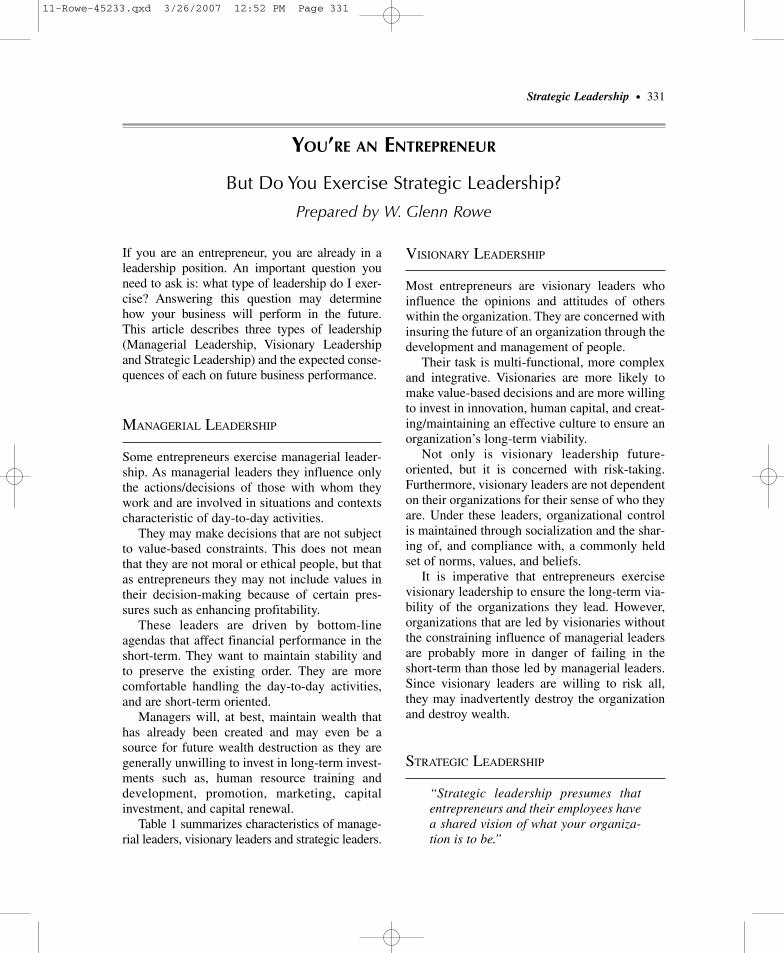
If you are an entrepreneur, you are already in aleadership position. An important question youneed to ask is: what type of leadership do I exer-cise? Answering this question may determine how your business will perform in the future. This article describes three types of leadership(Managerial Leadership, Visionary Leadershipand Strategic Leadership) and the expected conse-quences of each on future business performance.
MANAGERIAL LEADERSHIP
Some entrepreneurs exercise managerial leader-ship. As managerial leaders they influence onlythe actions/decisions of those with whom theywork and are involved in situations and contextscharacteristic of day-to-day activities.
They may make decisions that are not subjectto value-based constraints. This does not meanthat they are not moral or ethical people, but thatas entrepreneurs they may not include values intheir decision-making because of certain pres-sures such as enhancing profitability.
These leaders are driven by bottom-line agendas that affect financial performance in theshort-term. They want to maintain stability andto preserve the existing order. They are morecomfortable handling the day-to-day activities,and are short-term oriented.
Managers will, at best, maintain wealth thathas already been created and may even be asource for future wealth destruction as they aregenerally unwilling to invest in long-term invest-ments such as, human resource training anddevelopment, promotion, marketing, capitalinvestment, and capital renewal.
Table 1 summarizes characteristics of manage-rial leaders, visionary leaders and strategic leaders.
VISIONARY LEADERSHIP
Most entrepreneurs are visionary leaders whoinfluence the opinions and attitudes of otherswithin the organization. They are concerned withinsuring the future of an organization through thedevelopment and management of people.
Their task is multi-functional, more complexand integrative. Visionaries are more likely tomake value-based decisions and are more willingto invest in innovation, human capital, and creat-ing/maintaining an effective culture to ensure anorganization’s long-term viability.
Not only is visionary leadership future-oriented, but it is concerned with risk-taking.Furthermore, visionary leaders are not dependenton their organizations for their sense of who theyare. Under these leaders, organizational controlis maintained through socialization and the shar-ing of, and compliance with, a commonly heldset of norms, values, and beliefs.
It is imperative that entrepreneurs exercisevisionary leadership to ensure the long-term via-bility of the organizations they lead. However,organizations that are led by visionaries withoutthe constraining influence of managerial leadersare probably more in danger of failing in theshort-term than those led by managerial leaders.Since visionary leaders are willing to risk all,they may inadvertently destroy the organizationand destroy wealth.
STRATEGIC LEADERSHIP
“Strategic leadership presumes thatentrepreneurs and their employees havea shared vision of what your organiza-tion is to be.”
Strategic Leadership • 331
YOU’RE AN ENTREPRENEUR
But Do You Exercise Strategic Leadership?
Prepared by W. Glenn Rowe
11-Rowe-45233.qxd 3/26/2007 12:52 PM Page 331

“There are three categories of people—the person who goes into the office,puts his feet up on his desk, and dreamsfor, 12 hours; the person who arrives at 5 a.m. and works for 16 hours, neveronce stopping to dream; and the personwho puts his feet up, dreams for onehour, then does something about thosedreams.”
—Steven J. Ross, Former Chairman and co-CEO of Time-Warner
Strategic leadership is defined as the ability toinfluence your employees to voluntarily makedecisions on a day-to-day basis that enhance thelong-term viability of the organization while atthe same time maintaining the short-term finan-cial stability of the organization.
Entrepreneurs and employees make decisionsevery day as they interact with their firm’s stake-holders, customers, suppliers, the communitiesin which they operate, and each other. Whatneeds to be addressed is: are these decisions inaccordance with the strategic direction of the
332 • CASES IN LEADERSHIP
Table 1 Strategic, Visionary, or Managerial—What Kind of Leader Are You?
Strategic Leaders
• Display a synergistic combination of managerial and visionary leadership. Emphasize ethical behaviourand value-based decision making.
• Oversee operating (day-to-day) and strategic (long-term) responsibilities.• Formulate and implement strategies for immediate impact and preservation of long-term goals to enhance
organizational survival, growth, and long-term viability.• Have strong, positive expectations of the performance they expect from superiors, peers, subordinates,
and themselves.• Believe in strategic choice, i.e., their choices make a difference in their organization and environment.
Visionary Leaders
• Are proactive, shape ideas, change the way peoplethink about what is desirable, possible,and necessary.
• Work to develop choices, fresh approaches to long standing problems; work from high-riskpositions.
• Are concerned with ideas; relate to people inintuitive and empathetic ways.
• Feel separate from their environment; work in, butdo not belong to, their organization.
• Influence the attitudes and opinions of otherswithin the organization.
• Know less than their functional area experts.• More likely to make decisions based on values.• Are more willing to invest in innovation, human
capital, and creating and maintaining an effectiveculture to ensure long-term viability.
• Believe their choices make a difference in theirorganizations and environment.
Managerial Leaders
• Are reactive; adopt passive attitudes towardsgoals. Goals arise out of necessities, not desiresand dreams; goals are based on past.
• View work as enabling process involving somecombination of ideas & people interacting toestablish strategies.
• Relate to people according to their roles in thedecision-making process.
• See themselves as conservators and regulators ofexisting order; sense of who they are depends ontheir role in the organization.
• Influence actions and decisions of those withwhom they work.
• Are experts in their functional area.• Are less likely to make value-based decisions.• Are more likely to engage in, and support, short-
term, least-cost behaviour to enhance financialperformance figures.
• Believe their choices are determined by theirinternal and external environments.
11-Rowe-45233.qxd 3/26/2007 12:52 PM Page 332

organization? Will these decisions enhance the future viability of the organization, as well asthe short-term financial stability? The answer isABSOLUTELY.
It makes sense to suggest that if you can counton employees to voluntarily make decisions thatbenefit the organization, entrepreneurs will nothave to expend as much effort on monitoring andcontrolling their employees. Further, entrepre-neurs will have more capacity to examine whatthe organization needs to do, both in the shortand long term.
On the other hand, if employees do not knowthe strategic direction of the organization theymay inadvertently make decisions that damageit. Influencing subordinates to voluntarily makedecisions that enhance the organization is themost important part of strategic leadership.
Noel Tichy argues that, “When you can’t con-trol, dictate or monitor, the only thing you can dois trust. And that means leaders have to be sure thatthe people they are trusting have values that aregoing to elicit the decisions and actions they want.”
As presented above, the definition of strategicleadership presumes an ability to influence one’semployees. It further presumes that the entrepre-neur understands the emergent strategy processgiven that it has a greater impact on performancethan the intended strategic planning process.This is related to understanding the importanceof voluntary decision-making.
The decisions voluntarily made and theactions voluntarily taken by employees on a day-to-day basis eventually determine what strategywill emerge. Entrepreneurs who are strategicleaders understand and utilize this emergentprocess to ensure the future viability of theirorganizations.
Strategic leadership presumes that entrepre-neurs and their employees have a shared visionof what the organization is to be so that day-to-day decision-making, or emergent strat-egy process is consistent with this vision. It pre-sumes agreement between entrepreneurs andtheir employees on the opportunities that can betaken advantage of, and the threats that can beneutralized, given the resources and capabilitiesof their organization.
Entrepreneurs need to develop the skills andabilities that are required to exercise strategicleadership. Those few that are managerial innature need to develop their visionary side andthose who are visionary need to develop theirmanagerial side. To demonstrate that entrepre-neurs need to exercise strategic leadership twoentrepreneurs who made a difference to their firmsand to their industries will be discussed next.
“Without effective strategic leadership,the probability that a firm can achievesuperior or even satisfactory perfor-mance when confronting the challengesof the global economy will be greatlyreduced.”
—R. Duane Ireland and Michael A. Hitt
TWO ENTREPRENEURS WHO
WERE STRATEGIC LEADERS
Konosuke Matsushita is the founder and formerCEO of Matsushita Electric. At $49.5 billion, hisrevenue growth was the highest of any 20th cen-tury entrepreneur. The next closest were SoichiroHonda at $35.5 billion and Sam Walton at $35.0billion. Matsushita was an incredible visionarywho demanded revenue growth but with evenmore dramatic profit growth. One story describeshow he told his senior managers that within fiveyears he wanted revenue growth to quadrupleand profit to more than quadruple. This goal wasachieved in four years. How did he do this?Matsushita concentrated on creating products forhis customers that created value in their mindsthat was greater than what they expected.However, he always wanted it done at a profit forhis company. Matsushita’s long-term vision wasfor the products his companies sold to createworldwide prosperity in such a way that in sev-eral hundred years there would be world peace.
The second entrepreneur is Bob Kierlin.Kierlin is the CEO of Fastenal, a company thatsells nuts and bolts. His leadership style ischaracterized by employee empowerment,
Strategic Leadership • 333
11-Rowe-45233.qxd 3/26/2007 12:52 PM Page 333
participation, wage compression (he pays himself $120,000 US per year) and promotionfrom within. However, he strongly encourages profitable revenue growth. This has been verybeneficial for his employees, customers, andshareholders. In 1998, Fastenal’s market valueadded was $0.077B—it was $1.609B in 1996—anincrease of $1.53 billion. Kierlin started Fastenalin 1967 because he was unhappy with thebureaucracy at IBM.
These strategic leaders believed that theirdecisions would affect their companies’ environ-ments. They put great emphasis on achievingtheir visions by influencing the attitudes as wellas behaviours of their employees. Moreover, theyalso ensured that their visions were achieved in a manner that was best for their employees,customers, and shareholders. In essence, theseleaders were able to manage the paradox ofinvesting strategically in their employees, in pro-motion through advertising, in research anddevelopment, and in capital equipment while stillensuring that their organizations were financiallystable in the short term.
THE PARADOX OF
LEADING AND MANAGING
A recent Statistics Canada study found that thetwo most important reasons for the bankruptciesof small-to-medium-size firms were (1) pooroverall management skills, such as lack ofknowledge, lack of vision, and poor use of out-side advisers, and (2) imperfect capital structures
due to either institutional constraints or manage-rial inexperience.
The authors argue that managers in smallfirms need to be trained in general managementand financial management skills. It is interestingthat this study found a need for visionary andmanagerial leadership in small-to-medium-sizefirms just as it is needed in large firms such asGeneral Motors and IBM.
Being a strategic leader is exciting as you cre-ate chaos, make mistakes, get occasionallyrapped on the knuckles by your employees, andeven occasionally have to apologize to youremployees for creating too much disorder beforethey were ready for it. But the rewards are worthit as those with whom you work become ener-gized and more productive—they accomplishmore in less time and do not have to work dread-fully long days away from their families.Employees come to enjoy work more, as theybecome more creative and innovative, and moreprone to taking risks because they know thisenhances long-term viability.
Working through the paradox of leading andmanaging is an exciting challenge. One that isdemanding and difficult, but one that is achiev-able for entrepreneurs. Entrepreneurs should startthinking of themselves as strategic leaders whohave to accept and merge the visionaries andmanagerial leaders in their organizations. Fightagainst the constraining influence of financialcontrols and fight for the exercise of strategic andfinancial controls with the emphasis on strategiccontrols. The reward will be wealth creation andthe achievement of above normal performance.
334 • CASES IN LEADERSHIP
11-Rowe-45233.qxd 3/26/2007 12:52 PM Page 334