11 Optimize Asset Implementation and Availability Using Condition Based Maintenance Tom Hosea,...
35
Optimize Asset Implementation and Optimize Asset Implementation and Availability Using Condition Based Availability Using Condition Based Maintenance Maintenance Tom Hosea, OSIsoft
-
Upload
wilfrid-jordan -
Category
Documents
-
view
223 -
download
2
Transcript of 11 Optimize Asset Implementation and Availability Using Condition Based Maintenance Tom Hosea,...
11
Optimize Asset Implementation and Availability Optimize Asset Implementation and Availability Using Condition Based MaintenanceUsing Condition Based Maintenance
Tom Hosea, OSIsoft

2
AgendaAgenda
Objective & Evolution of Asset Management
CBM Drivers
Why use real-time data
Implementation example & deployment results
SDG&E RtCBM Program
OSIsoft Enabling Technology
– Business Process
– Sample Capabilities

3
Asset Management : Objectives and GoalsAsset Management : Objectives and Goals
Maximize asset performance at lowest life-cycle cost
– Reduce maintenance and corresponding O&M expense
– Dispatch skillful technicians for specific problems
– Manage trouble response to minimize cost
Maximize equipment performance
– Utilization
– Reliability
Optimize asset replacement strategyand
Eliminate or reduce catastrophic equipment failures
4
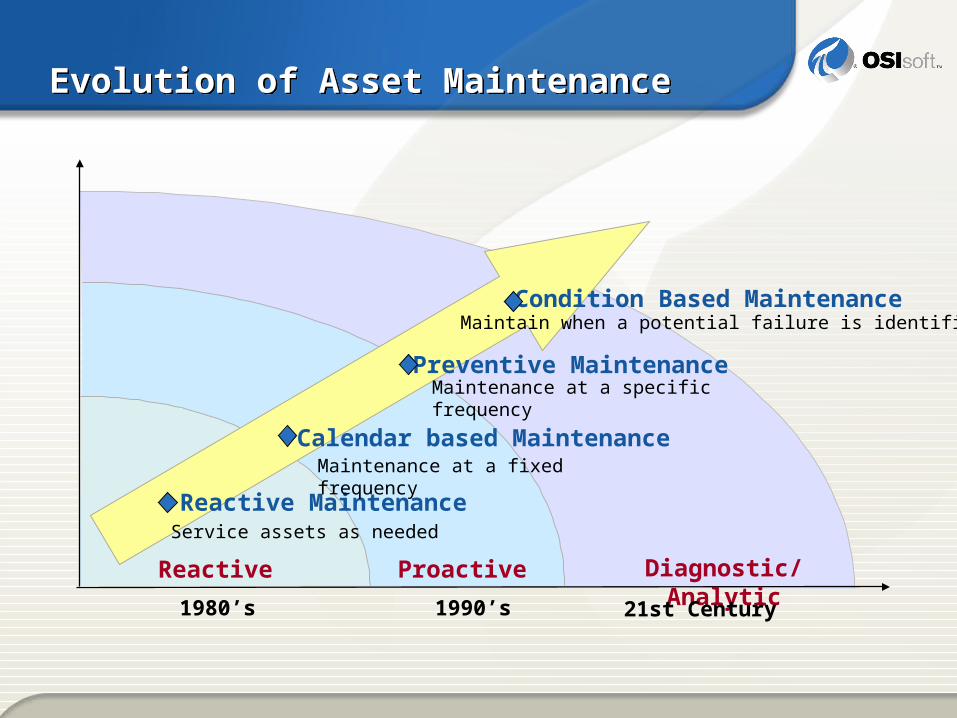
Reactive Proactive Diagnostic/Analytic
Reactive MaintenanceService assets as needed
Preventive Maintenance
Condition Based Maintenance
Maintenance at a specific frequency
Maintain when a potential failure is identified
1980’s 1990’s 21st Century
Calendar based MaintenanceMaintenance at a fixed frequency
Evolution of Asset MaintenanceEvolution of Asset Maintenance

5
Why Integrate Real-time Data? Why Integrate Real-time Data?
Better automated processes for CBM
Operations Benefits – provides access to the real condition of the asset, better utilize the asset
Maintenance Benefits – facilitates fine tuning of maintenance processes
– Drill down to what is really driving the condition
– Determine whether to send someone now or later

66
San Diego Gas & ElectricSan Diego Gas & Electric(SDG&E) (SDG&E)
RtCBM Program

7
Workstations
RtPortal Thick (Smart) Clients
RtPortal Thick (Smart) Clients
PI Manual Data
Logger
PI Manual Data
Logger
Workstations
RtPortal Web-based Clients
RtPortal Web-based Clients
Typical Implementation OverviewTypical Implementation Overview
RLINK Bi-directional
Gateway
RLINK Bi-directional
Gateway
Standard InterfacesPI to PI - OLEDB - OPC - COM connectors - Batch
Standard InterfacesPI to PI - OLEDB - OPC - COM connectors - Batch
Measurement Points
Measurement Points
WorkOrders
WorkOrders
AssetDefinitions
AssetDefinitions
Maintenance Plans
Maintenance Plans
TasksTasks
ERP / MMS
Order HistoryOrder History
OSIsoft TechnologyOSIsoft Technology
PITime Series
Database
PITime Series
Database
RtPortal Web-Server
RtPortal Web-ServerContext
Database
Context Database
Analytical Analytical Tools Tools
Substation Gateway Server
Substation Gateway Server
Substation Gateway Server
Substation Gateway Server
Substation Gateway Server
Substation Gateway Server
Substation Gateway Server
Substation Gateway ServerSubstation
Gateway Server
Substation Gateway Server
TransmSCADA
TransmSCADAMV 90MV 90Distr
SCADA
DistrSCADAHydranHydran DobleDobleDeltaXDeltaX

8
PSE&G’s Estimated Savings with OSIsoft-based CBM DeploymentPSE&G’s Estimated Savings with OSIsoft-based CBM Deployment
2003 - $264,600
– 9 LTC’s and 2 GCB’s 2004 - $800,000
– 5 Transformers 2005 Projected ~ $1M
Notification
With real-time data, we can do even better!
2003 - $300,000– Oil Diagnostics targeted 16 LTC’s, 5
had contact problems
2004 - $1.2M– 5 Transformers were targeted and 2
were identified to have major issues
– 10 LTC’s were targeted and 1 had the potential to create major damage.
2005 Projected ~ $2M
Assessment

9
SDG&E System StatisticsSDG&E System Statistics
2 Generation Facilities (590 MW)
1,805 Electric Transmission Miles
18,000 Transmission Structures
120 Substations
906 Distribution Circuits
7,941 Underground Circuit Miles
6,875 Overhead Circuit Miles
220,362 Distribution Poles
145,764 Distribution Transformers
1,315,134 Electric Meters
CPUC
CAISO
FERC

10
SDG&E RtCBM ObjectivesSDG&E RtCBM Objectives
Minimize personnel dependency (resources & training needed for asset data analysis)
Provide a equipment monitoring and analysis platform for access to all data
Provide drill down navigation abilities through data integration
Notify personnel to respond to equipment conditions
– Automated analysis
– Automated trigger
– Automated notification
• Pager, Email, & Investigating Work Orders
– Reporting capabilities

11
RtCBM Process Enhancement and MoreRtCBM Process Enhancement and More
Benchmark Equipment (with normalized data) Refine equipment specifications Design validation and equipment procurement practice Provide insights into substation design & configuration
geographical variations Standardize Analysis – design trigger algorithms Consider factors like asset age, environment, customer
impact Enhance operational and planning decision support –
e.g. equipment impact due to load transfer Enhance equipment utilization, performance trade-offs

12
RtCBM – Data IntegrationRtCBM – Data Integration
Weekly general inspections– LTC operations
– Alarms, temperature, visual
Monthly equipment inspections– Operation counters
– Temperature, Pressure
– Voltage
– Functional check
General asset – Rating
– Age, Type, Design
– Operating limits
Operational – Relays & Digital fault recorders
– PQ Monitors
Specific equipment – Operating conditions
– Stress factors
– Trouble history
– Maintenance data
– Oil test data
– Electrical test data
– Operating speed
Real-time – Voltage & Current
– Temperature
– Bushing On-line Power Factor
– Hydrogen in Oil
Simulated System & Engineering
13
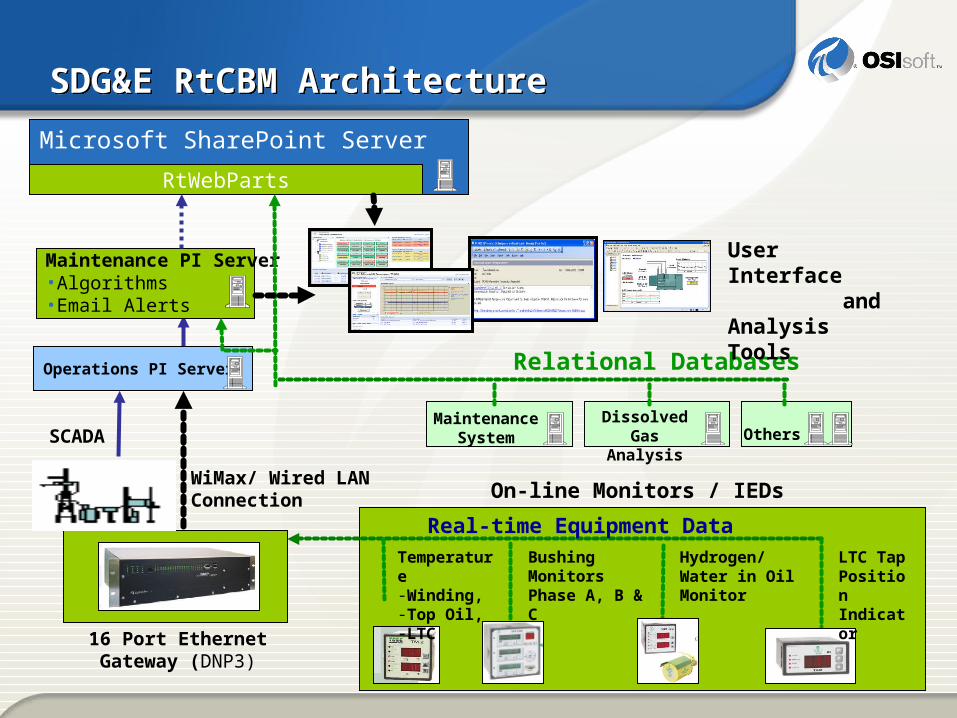
SDG&E RtCBM ArchitectureSDG&E RtCBM Architecture
Microsoft SharePoint Server
RtWebParts
Operations PI Server
Maintenance PI Server•Algorithms•Email Alerts
SCADAMaintenance
SystemDissolved
Gas Analysis Others
16 Port Ethernet Gateway (DNP3)
WiMax/ Wired LAN Connection
Real-time Equipment DataTemperature-Winding,-Top Oil, -LTC
Bushing Monitors Phase A, B & C
Hydrogen/Water in Oil Monitor
LTC Tap Position Indicator
On-line Monitors / IEDs
Relational Databases
User Interface andAnalysis Tools

14
Time-based to RtCBM – Circuit BreakersTime-based to RtCBM – Circuit Breakers
Data Available Weekly safety inspections Monthly equipment insp. Asset Data Historical Data
– Operating conditions– Stress factors– Trouble – Maintenance data– Test data (insul & elec)
Operational data– Relays & Digital fault recorders– PQ Monitors
Real-time data– Voltage & Current
– I2T and Contact Wear
– Operations Counter
Planned
Approach
Maintenance Intervals
3 6 9 Yr.3 6 9 Yr.
3 6 9 Yr.3 6 9 Yr.
15
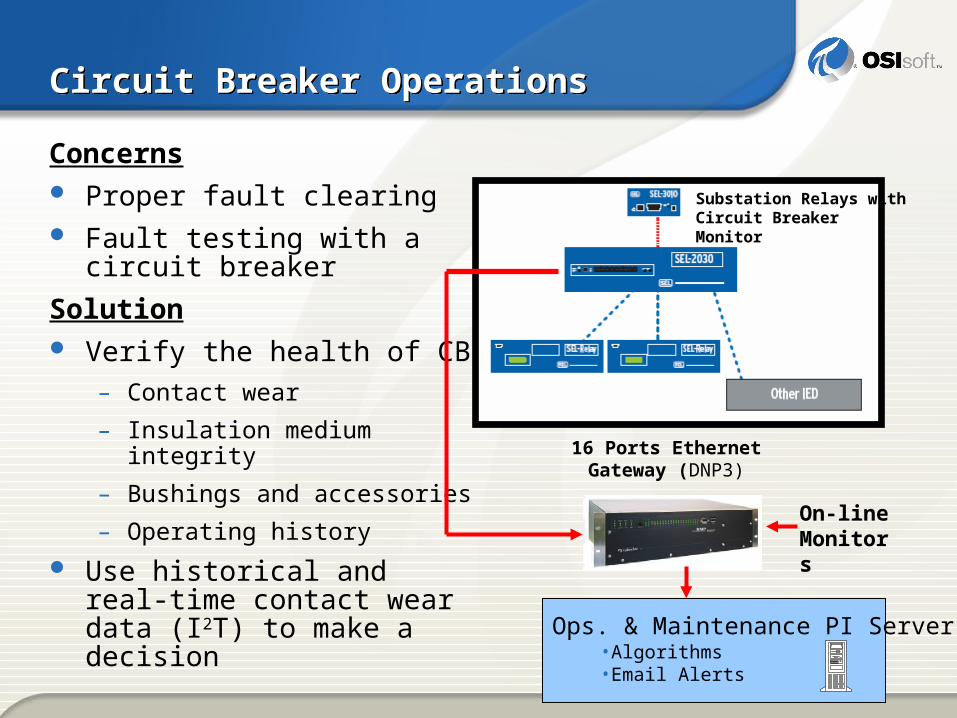
Circuit Breaker OperationsCircuit Breaker Operations
Concerns Proper fault clearing Fault testing with a circuit
breaker
Solution Verify the health of CB
– Contact wear
– Insulation medium integrity
– Bushings and accessories
– Operating history
Use historical and real-time contact wear data (I2T) to make a decision
Substation Relays withCircuit Breaker Monitor
Ops. & Maintenance PI Server•Algorithms•Email Alerts
16 Ports Ethernet Gateway (DNP3)
On-lineMonitors
16
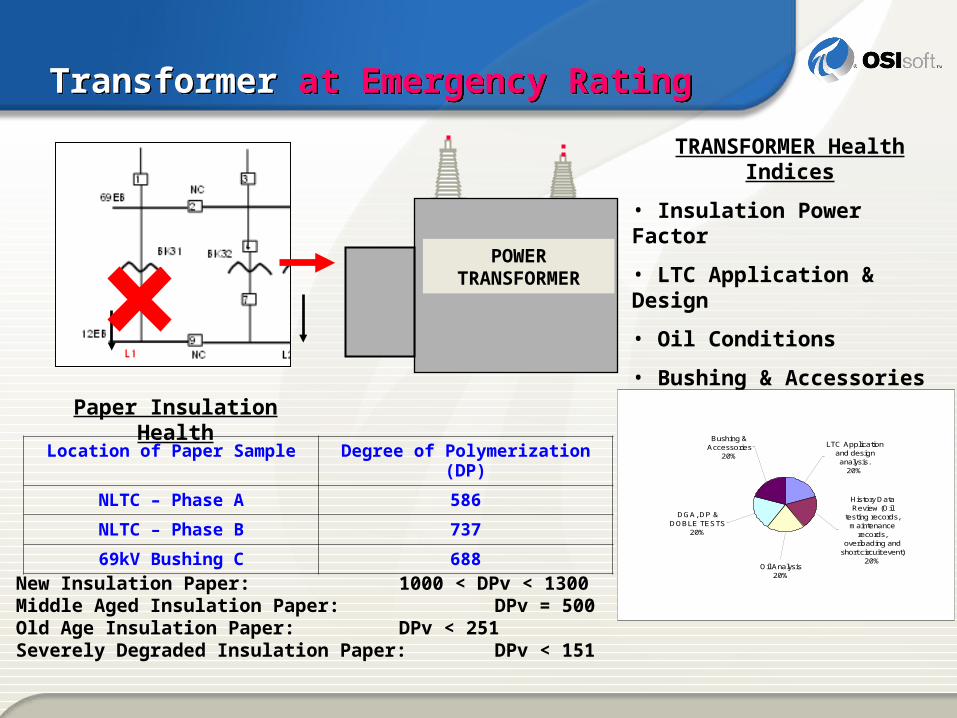
Transformer at Emergency RatingTransformer at Emergency Rating
POWER TRANSFORMER
TRANSFORMER Health Indices
• Insulation Power Factor
• LTC Application & Design
• Oil Conditions
• Bushing & Accessories
• Operating History &
Conditions
Location of Paper Sample Degree of Polymerization (DP)
NLTC – Phase A 586
NLTC – Phase B 737
69kV Bushing C 688
New Insulation Paper: 1000 < DPv < 1300Middle Aged Insulation Paper: DPv = 500Old Age Insulation Paper: DPv < 251Severely Degraded Insulation Paper: DPv < 151
Paper Insulation Health
LTC Application and design analysis.
20%
Bushing & Accessories
20%
History Data Review (Oil
testing records, maintenance
records, overloading and
short circuit event)20%
DGA, DP & DOBLE TESTS
20%
Oil Analysis20%

17
Transformer at Emergency Rating Transformer at Emergency Rating
Top Oil Hot Spot LOLIEEE 105 176 .149Ptload 105 145 .039Actual HS rise 106 131 .014
Comparison of hot spot rise over top oil simulated versus actual
Decision: Based on Transformer Unit Health and Real Time Conditions

18
Summary of RtCBM Expected ResultsSummary of RtCBM Expected Results
Operations Benefits
– Avoid potential equipment failure
– Increase asset availabilities
– Respond to equipment alarms according to priorities
– Maximize asset loading capabilities
Maintenance Benefits
– Early warning and indication to address conditions
– Reduce overtime on reactive maintenance
– Minimize equipment outages
Asset Planning Benefits
– Improve future equipment specification and application to maximize utilization and performance.

1919
OSIsoft Enabling TechnologyOSIsoft Enabling Technology
20
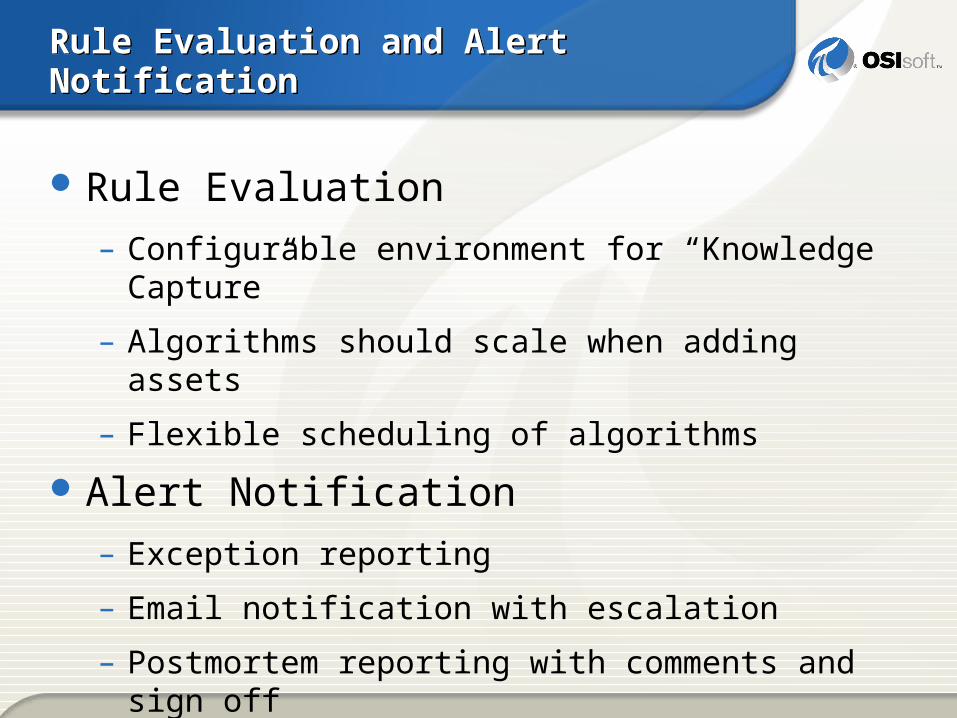
Rule Evaluation and Alert NotificationRule Evaluation and Alert Notification
Rule Evaluation
– Configurable environment for “Knowledge Capture”
– Algorithms should scale when adding assets
– Flexible scheduling of algorithms
Alert Notification
– Exception reporting
– Email notification with escalation
– Postmortem reporting with comments and sign off

21
Visualization, Integration and NavigationVisualization, Integration and Navigation
A web-based presentation is preferred
Scalable: minimize the number of web pages
Reuse of existing ProcessBook graphics
Integration amongst data sources
Navigation hierarchy and drill-down
Benchmarking of assets of the same class
Intuitive: no tag names or query strings required

22
Working by ExceptionWorking by Exception
Real-time RuleAssessment
(PI ACE\PIANO)
Alert Notification(PIANO)
Work Order Generation(RLINK)
Asset Reliability(PI OLEDB and
RtReports)Improve Reliability
Integrated AssetInformation
(RtWebParts)
Asset InformationStructure
(Foundation)
23
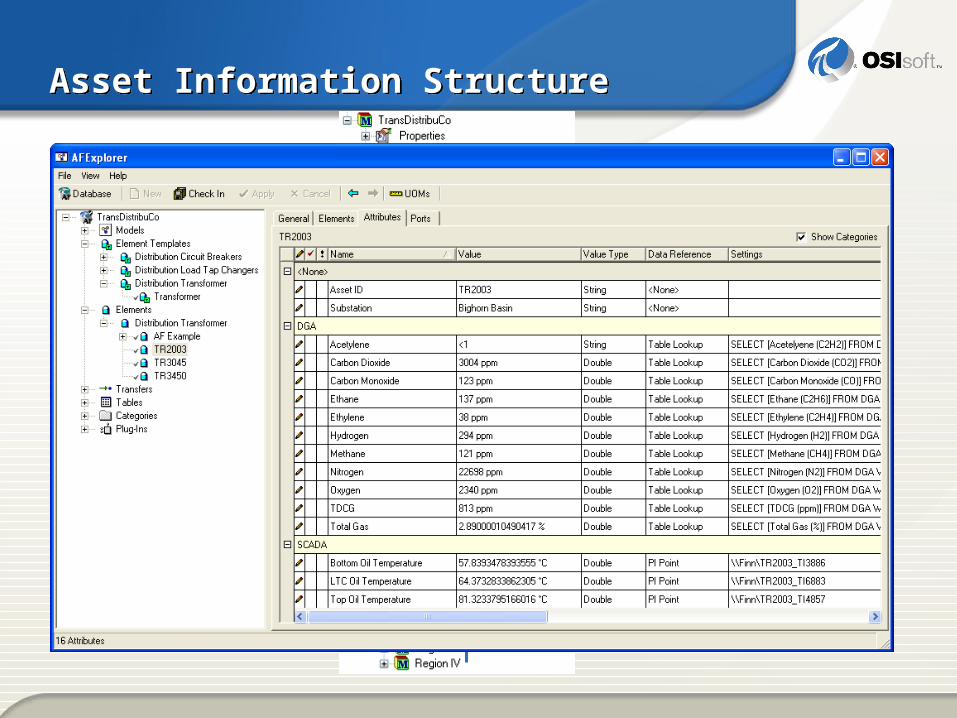
Asset Information StructureAsset Information Structure
DivisionLevel
DistrictLevel
Site
IndividualAsset
Asset Class

24
Level 1
Level 2
Level 3
Level 4
Asset Information Integration HierarchyAsset Information Integration Hierarchy
MaintenanceOverview
SiteDetail
SiteDetail
AssetDetail
RuleDetail
RuleDetail
AssetDetail
SiteDetail
SiteDetail
AssetDetail
25
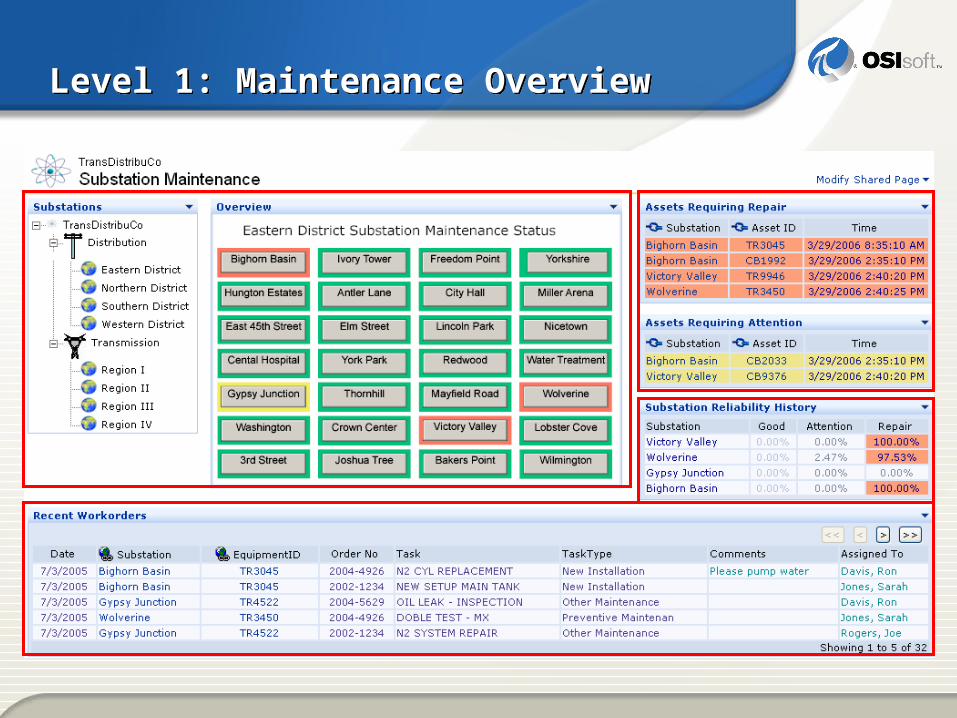
Level 1: Maintenance OverviewLevel 1: Maintenance Overview

26
Level 2: Site DetailLevel 2: Site Detail
27
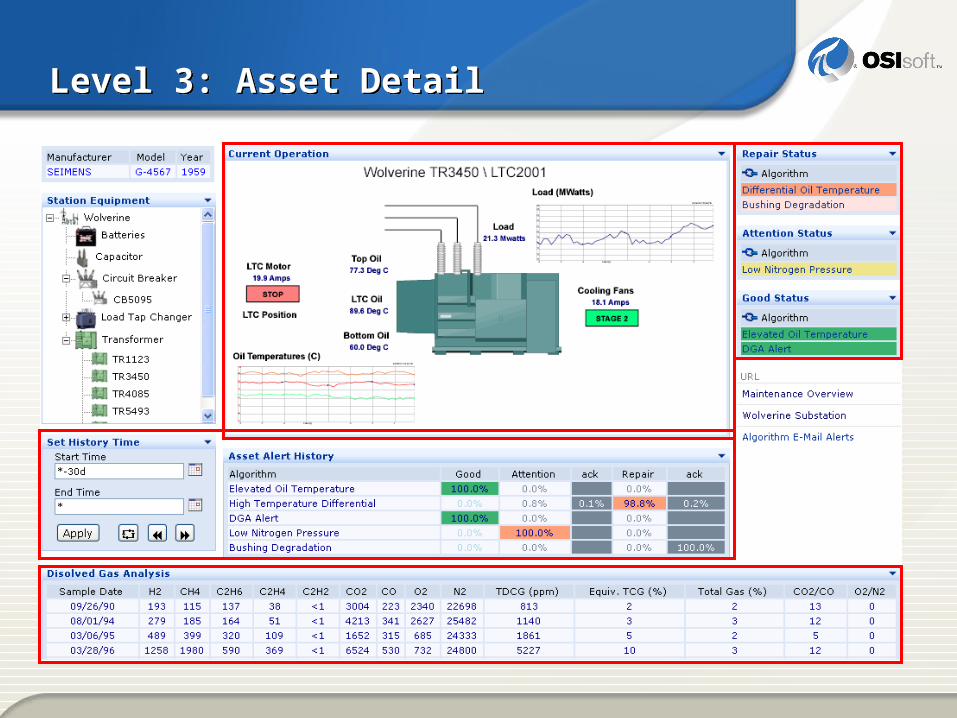
Level 3: Asset DetailLevel 3: Asset Detail
28
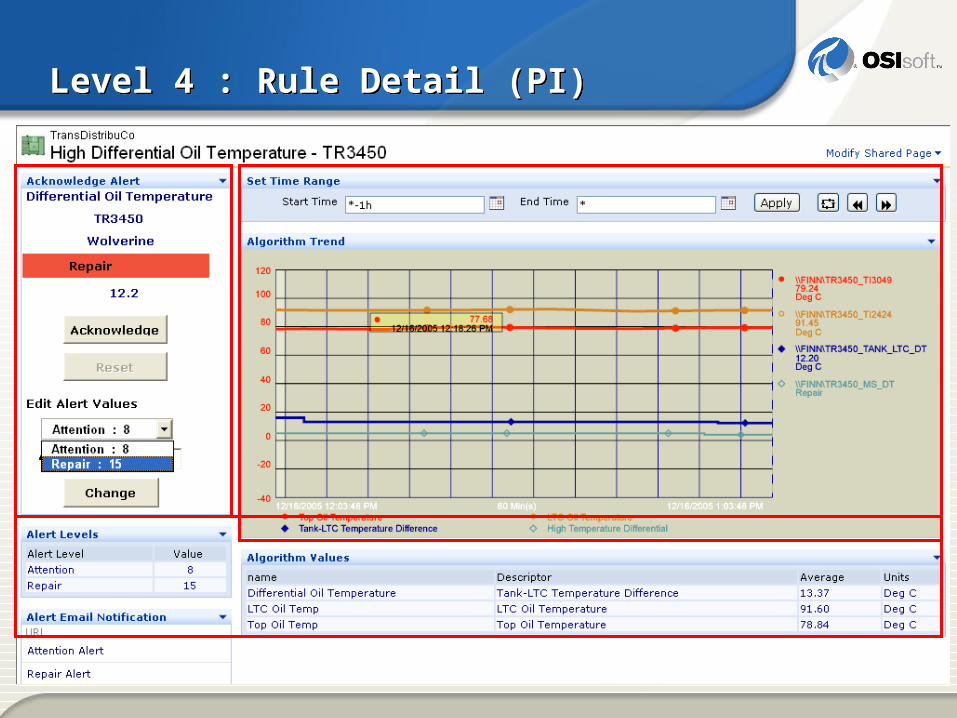
Level 4 : Rule Detail (PI)Level 4 : Rule Detail (PI)

29
Rule Detail (RDB) – Level 4Rule Detail (RDB) – Level 4

30
Maintenance Alert NotificationMaintenance Alert Notification

31
Asset Reliability ReportAsset Reliability Report

32
PSE&G CBM – DashboardPSE&G CBM – Dashboard

33
PSE&G CBM – AnalysisPSE&G CBM – Analysis

34
ConclusionsConclusions
Computer Based Maintenance Applications are evolving
Significant savings are available by moving from calendar based to real-time condition based maintenance
OSIsoft offers a product suite capable of solving these problems

3535
Thanks YouThanks You
Questions?