11 Data Presentation Elements - Yidnekachew · 11 Data Presentation Elements ... Chart recorders...
26
11 Data Presentation Elements The data presentation element is the final element in the measurement system, its func- tion being to communicate the measured value of the variable to a human observer. It is important that the measured value is presented as clearly and easily as possible, otherwise the value registered by the observer may be different. Consider an accurate flow measurement system where the true value of flow rate is 11.3 m 3 h −1 and the measured value 11.5 m 3 h −1 , i.e. a measurement system error of 11.5 − 11.3 = 0.2 m 3 h −1 . If the observed value is 12.0 m 3 h −1 , then the observation error is 12.0 − 11.5 = 0.5 m 3 h −1 . This is greater than the measurement error and means that the high system accuracy is wasted. Observation error depends on many factors: • Distance of the element from the observer • Ambient lighting • Eyesight, patience and skill of the observer. However, a clear presentation is of major importance. This chapter begins by reviewing data presentation elements in current use, and goes on to examine their principles and characteristics in detail. 11.1 Review and choice of data presentation elements Figure 11.1 classifies data presentation elements in wide current use, showing the relevant section in the chapter where the device is covered. It begins by classifying elements into displays and recorders/printers. If no permanent record of measured variables is required, then displays can be used. A choice must first be made between analogue pointer–scale indicators and digital displays. With the pointer–scale indicator, the observer must interpolate if the pointer lies between two scale marks: thus if the pointer lies between 9 and 10 the observer must decide whether the measured value is say 9.4, 9.5 or 9.6. Thus an observation error of up to ±0.5 units is possible. This problem is avoided with a two-decade digital display, which presents the number directly as 9.5. Section 11.3 discusses the principles of character displays, which display numerals and letters of the alphabet, and graphic displays, which can also show line diagrams, graphs and waveforms, etc.
-
Upload
duongthien -
Category
Documents
-
view
214 -
download
1
Transcript of 11 Data Presentation Elements - Yidnekachew · 11 Data Presentation Elements ... Chart recorders...

11 Data PresentationElements
The data presentation element is the final element in the measurement system, its func-tion being to communicate the measured value of the variable to a human observer.It is important that the measured value is presented as clearly and easily as possible,otherwise the value registered by the observer may be different. Consider an accurate flow measurement system where the true value of flow rate is 11.3 m3 h−1
and the measured value 11.5 m3 h−1, i.e. a measurement system error of 11.5 − 11.3= 0.2 m3 h−1. If the observed value is 12.0 m3 h−1, then the observation error is 12.0 − 11.5 = 0.5 m3 h−1. This is greater than the measurement error and means thatthe high system accuracy is wasted.
Observation error depends on many factors:
• Distance of the element from the observer
• Ambient lighting
• Eyesight, patience and skill of the observer.
However, a clear presentation is of major importance. This chapter begins byreviewing data presentation elements in current use, and goes on to examine theirprinciples and characteristics in detail.
11.1 Review and choice of data presentation elementsFigure 11.1 classifies data presentation elements in wide current use, showing the relevant section in the chapter where the device is covered. It begins by classifyingelements into displays and recorders/printers.
If no permanent record of measured variables is required, then displays can be used. A choice must first be made between analogue pointer–scale indicators anddigital displays. With the pointer–scale indicator, the observer must interpolate if the pointer lies between two scale marks: thus if the pointer lies between 9 and 10 the observer must decide whether the measured value is say 9.4, 9.5 or 9.6. Thusan observation error of up to ±0.5 units is possible. This problem is avoided with atwo-decade digital display, which presents the number directly as 9.5.
Section 11.3 discusses the principles of character displays, which displaynumerals and letters of the alphabet, and graphic displays, which can also show linediagrams, graphs and waveforms, etc.

286 DATA PRESENTATION ELEMENTS
There are four types of digital display technology in wide current use: light emitting diodes (LED), cathode ray tubes (CRT), liquid crystal displays (LCD)and electroluminescent displays (EL). LEDs have high power consumption, whichmakes them only suitable for small-scale character displays; they are not used in graphicdisplays. CRTs are used for character and graphics displays, monochrome andcolour, but have the disadvantage of high operating voltages and are high-volumebulky devices. LCDs are used for both character and graphics displays. LCD char-acter displays, usually monochrome, have much lower power consumption thanequivalent LED displays. LCD graphics displays, monochrome and colour, are flatscreen panels and have lower operating voltages and power consumption thanequivalent CRT devices. Electroluminescent displays are also flat screen and are usedfor both character and graphics monochrome displays. They have higher operatingvoltages and power consumption than equivalent LCD devices but greater contrastratio and viewing angle.
A record of the time variation of the measured variables would be essential, forexample, in the following situations:
(a) High-speed events, e.g. a human heartbeat, which are too fast to be followedby a human observer. Changes in the recorded blood pressure waveform willthen show clearly any irregular or abnormal behaviour.
(b) The monitoring of a complex process such as a gas compressor which has anumber of associated measured variables. If the compressor breaks down, thenthe exact sequence of events drop in lubricating oil pressure – rise in bearingtemperature – drop in delivery pressure can be found and the cause of failureestablished.
(c) Large amounts of data which are to be used in numerical calculations.Examples are the calculations of the yield and efficiency of a chemical reactorfrom composition, temperature, pressure and flow-rate data, and the value ofgas transferred from supplier to customer in a given month.
Chart recorders give a record, on paper, of the time variation of a measured vari-able; these can be analogue or digital and the record can be either a continuous lineor a series of dots. They can record up to six variables but have limited speed of response;they also require regular replacement of paper and pens. A chart recorder could be
Figure 11.1Classification of datapresentation elements.

11.2 POINTER–SCALE INDICATORS 287
satisfactorily used in situation (b). Paperless recorders use LCD displays and digitalarchive memory; these typically can record four measured variables and have lessmaintenance requirements than chart recorders. They also have a fast speed ofresponse and could be satisfactorily used in situation (a). Laser printers can printlarge amounts of data, in character or graphics form, on paper. A laser printer wouldtherefore be ideal in situation (c) where large tables of numerical data need to be printedout for checking and calculation.
11.2 Pointer–scale indicatorsThese are analogue display devices. Figure 11.2(a) shows simplified diagrams andan equivalent circuit for a moving coil indicator connected to a Thévenin signal source
Figure 11.2Pointer–scale indicators: principle and recommended scale format:(a) Mechanicalarrangement and circuit(b) Scales.

288 DATA PRESENTATION ELEMENTS
ETh, RTh. The coil is situated in a radial magnetic field of flux density B, so that a current i through the coil produces a deflecting torque:
TD = BnAi [11.1]
where A is the cross-sectional area of the coil and n the number of turns. This deflect-ing torque is opposed by the spring restoring torque:
TR = cθ [11.2]
where c is the spring stiffness and θ the angular deflection. Assuming negligible frictional torque, the resultant unbalanced torque on the coil is TD − TR. This is equalto the product of moment of inertia I and angular acceleration d2θ/dt 2, i.e.
BnAi − cθ = I [11.3]
The current i is given by:
i = [11.4]
where RL is the resistance of the coil and Eb is the back e.m.f. induced in the coil dueto its motion in the magnetic field. Eb can be calculated using Faraday’s law of electro-magnetic induction as shown in Figure 11.1(a). If we consider one turn PQRS of the coil, then the voltage induced in PS, with length l moving with translationalvelocity (b/2)(dθ/dt) perpendicular to the magnetic field B, is Bl(b/2)(dθ/dt). An equaland opposite voltage is induced in QR, so that the resultant voltage in PQRS isBlb(dθ/dt), i.e. BA(dθ/dt) since A = lb. The total back e.m.f. for a coil of n turns is:
Eb = nAB [11.5]
From [11.3]–[11.5] we have:
BnA − cθ = I [11.6]
i.e.
Differential equation for pointer–scale [11.7]indicator
By defining Δθ and ΔETh to be deviations from initial steady conditions θ(0–), ETh(0–) (Section 4.1.2) we can derive the transfer function for the indicator. This canbe expressed in the standard second-order form:
Transfer function for pointer–scale indicator [11.8]
where
ΔΔ
{
+Th
n n
sK
s s
( )
=+ +
1 21
2
2
ωξ
ω
I
c t
nAB
c R R t
nAB
c R RE
Th L Th L
Th
d
d
d
d2
2 2θ θ θ ( )
( )
( )+
+⋅ + =
+
d2θdt2
JL
ETh − nAB(dθ/dt)
RTh + RL
GI
dθdt
ETh − Eb
RTh + RL
d2θdt2

11.3 DIGITAL DISPLAY PRINCIPLES 289
Steady-state sensitivity K = rad V−1
Natural frequency ωn =
Damping ratio ξ =
From eqn [11.8] we see that the steady-state sensitivity K depends on magnetic fluxdensity B, spring stiffness c and total circuit resistance RTh + RL. Reducing c gives a larger K but a lower ωn ; similarly increasing n and A also increases K but this gives a larger moment of inertia I and again reduced ωn. The value of K is affectedby stray magnetic fields, ferrous instrument panels (altering B), temperature and ageing (altering c). Departures from the ideal steady-state relation θ = (nAB/c)i are quantified using error bands (Section 2.1); there are typically nine classes of accuracy, ranging from ±0.05% to ±5% of f.s.d.
A typical meter has a coil resistance of 75 Ω, ±2.5% error bands, input range 0 to1 mA, and output range 0 to π/2 radians, i.e. a current sensitivity of 1.57 × 10³ rad A−1.The moment of inertia I of the coil–former–pointer assembly is fairly large, so thatωn is small, typically fn ≈ 0.5 to 1.5 Hz. The damping ratio ξ depends on the total circuit resistance RTh + RL; a value for ξ of around 0.7 is ideal (Section 4.3). If ξis greater than 0.7 (with a given RTh and RL), it can be reduced by connecting an additional resistance in series with RL. This causes a corresponding reduction in sensitivity. If ξ is less than 0.7, it can be increased by connecting a resistance in parallel with RL. This causes a corresponding increase in sensitivity. The scale corresponds to the range of the measured variable, e.g. 0 to 200 °C, 0 to 50 m3 h−1.In order to reduce observation error it is important that the scale should be legible,clear and not overcrowded with scale marks.
Experiments show that observers are able to mentally subdivide a scale divisioninto five equal parts with reasonable accuracy. To achieve an observation error of1% of f.s.d., each part should be about 1% of the scale range. This means a scalewith 20 minor divisions, usually grouped into four or five major divisions as shownin Figure 11.2(b).
11.3 Digital display principles
11.3.1 Character displays
These are used to display the numerals 0 to 9, the letters of the alphabet A to Z ineither upper or lower case format, and a few other symbols such as punctuation marks.Displays showing alphabetical and numerical information are often referred to asalphanumeric.
Figure 11.3 shows two character formats in widespread use: seven-segment and7 × 5 dot-matrix. Figure 11.3(a) shows seven segments a to g arranged in a figure-of-eight configuration and the corresponding character set. This is limited to the tennumerals and nine upper case letters. The 7 × 5 dot-matrix format enables a far larger
( )
( )
nAB
cI R RTh L
2
2 +
c
I rad s −1
nAB
c(RTh + RL)

290 DATA PRESENTATION ELEMENTS
Figure 11.3 Characterformats for displays:(a) Seven-segmentcharacter format(b) 7 × 5 dot-matrixcharacter format.

11.3 DIGITAL DISPLAY PRINCIPLES 291
set of typically 192 characters to be obtained; this includes all the numerals, upperand lower case letters (Figure 11.3(b)), together with Greek letters and other symbols.A 9 × 7 dot-matrix format gives a better representation of lower case letters.
Each character format is an array of segments or dots; these elements are referredto as pixels. To display a character each pixel must be separately switched ‘on’ and‘off’ independently of the other pixels. When a pixel is switched on, either it is a sourceemitting light or it is modulating light from other sources. When a pixel is switchedoff it is either not emitting light or not modulating light. As an example, suppose wewish to display the numerals 0 to 9 using the seven-segment format (Figure 11.4).Each of the pixels abcdefg can be switched individually on or off using a seven-digitparallel binary code where a ‘1’ corresponds to ‘on’ and a ‘0’ to ‘off’. Figure 11.4shows the seven-segment codes corresponding to the numerals 0 to 9. A seven-segment decoder is used to convert the input parallel digital signal, usually in binarycoded decimal (b.c.d.) or ASCII format, into seven-segment code. Figure 11.4 shows
Figure 11.4 Display ofnumerals using seven-segment format.

292 DATA PRESENTATION ELEMENTS
the table to convert the DCBA code, representing one decade of 8421 b.c.d., to theseven-segment abcdefg code. Decoders are also used to convert input data in parallel b.c.d. or ASCII format into 7 × 5 or 9 × 7 format for dot-matrix displays; thelogic is normally implemented using a read only memory (ROM).
11.3.2 Graphic displays
Graphic displays are used to show line diagrams, graphs, waveforms, bar charts, etc.,and consist of a large number of pixels arranged in rows (along the y-axis) andcolumns (along the x-axis). A typical graphic display consists of 320 × 240, i.e. 76 800, pixels each of area 0.33 mm × 0.33 mm, giving a total viewing area of 120 mm × 92 mm. To make electrical contact with each individual pixel wouldrequire 76 800 electrical connections occupying an area of a few square metres!Since this is clearly impossible, some method of multiplexing must be found.
The principle of pixel matrix multiplexing is based on time division multiplexing,where one pair of conductors can serve many pixels by suitable timing of the volt-age across the conductors. The pixels are arranged in a matrix of columns (x) androws (y). Each column (x) and each row (y) has an electrical conductor giving a corresponding matrix of conductors. Each pixel, with position coordinates (x, y), isconnected across the corresponding x and y conductors at their point of intersection(Figure 11.5(a)). The voltage applied to a column conductor will be present at all ofthe pixels in that column; the voltage applied to a row conductor will be present atall of the pixels in that row. The minimum voltage to turn a pixel ‘on’, i.e. to emitor modulate light, is VS. The column voltages Vx switch between 0 and +VS/2; therewill be m transitions during each repetition period T, where m is the number of pixels in each column. The row voltages Vy switch between 0 and −VS/2; there willbe n transitions during each repetition period T, where n is the number of pixels ineach row. A pixel at position (x,y) is switched on during a time interval when thecolumn voltage Vx is +VS/2 and the row voltage Vy is −VS/2.
Figure 11.5(a) shows a 3 × 3 matrix of pixels and Figure 11.5(b) the correspond-ing column voltage waveforms Vx and row voltage waveforms Vy. The pixel (2, 1) isswitched on during time interval 0 to T/3. The pixels (1, 1), (2, 1), (1, 3) and (2, 3)are switched on during the time interval T/3 to 2T/3. Pixel (3, 2) is switched on dur-ing time interval 2T/3 to T. In this example there are six electrical conductors for ninepixels so that the saving in external connections is small. However, in the above example of a 320 × 240 matrix, 320 + 240 = 560 external connections are requiredto address 76 800 pixels. All waveforms are repeated every repetition period T; thisis to refresh the display. Provided T is sufficiently short, the brightness of the screenremains reasonably constant without flicker.
11.4 Light-emitting diode (LED) displaysWhen a semiconductor diode is forward biased, as shown in Figure 11.6(a), a currentiF flows, which depends exponentially on the forward voltage VF:
iF = is exp [11.9]DF
qVF
kθAC

11.4 LIGHT-EMITTING DIODE (LED) DISPLAYS 293
where is is the reverse saturation current, q the electron or hole charge, kBoltzmann’s constant and θ K the absolute temperature. Taking natural logarithmswe have:
logeiF = VF + logeis [11.10]
i.e. there is an approximately linear relation between logeiF and VF as shown in Figure 11.6(b).
q
Kθ
Figure 11.5Pixel multiplexing:(a) 3 × 3 pixel matrix(b) Voltage waveforms.

294 DATA PRESENTATION ELEMENTS
Figure 11.6LED characteristics and circuits:(a) Forward biased LED(b) Current/voltage(GaAsP)(c) Luminousintensity/current (GaAsP)(d) Relative intensitywavelength (GaAsP)(e) Series resistor(f ) Interconnectionmethods.

11.5 CATHODE RAY TUBE (CRT) DISPLAYS 295
Light-emitting diodes have the special property that when forward biased they emitelectromagnetic radiation over a certain band of wavelengths. Two commonly usedLED materials are gallium arsenide phosphide (GaAsP), which emits red light, and gallium phosphide (GaP), which emits green or yellow light. In both cases theluminous intensity IV of the diode light source increases with current iF; for GaAsPdiodes the relationship is approximately linear (Figure 11.6(c)). The light emitted bya GaAsP (red) diode is distributed over a narrow band of wavelengths centred on 0.655 μm. Figure 11.6(d) shows the relationship between relative luminous intensityand wavelength λ. Similarly the light emitted by a GaP (green) diode is distributedover a narrow band of wavelengths centred on 0.560 μm. The human eye is far moresensitive to green light than red, so a green LED of low radiant power may appearas bright as a red LED of much higher radiant power. The response of LEDs to stepchanges in iF is extremely fast; turn-on and turn-off times of 10 ns are typical.
When switched ‘on’, a typical GaAsP diode requires a forward current iF ofaround 20 mA corresponding to a luminous intensity Iν of 4.0 mcd (millicandela), and a forward voltage VF of 2.2 V. When used as a display pixel the diode should beswitched ‘on’ by a logic signal in the ‘l’ state, and switched ‘off’ when the signal is in the ‘0’ state. Figure 11.6(e) shows a simple circuit for achieving this, using aseries resistor R of 140 Ω. For a ‘1’ input, VS ≈ 5 V, iF = (5 − 2.2)/140 = 20 mA andthe diode is ‘on’. For a ‘0’ input, VS ≈ 0 V, iF is negligible and the diode is ‘off’.Alternatively a 20 mA constant current source may be switched in and out by the logicsignal.
A seven-segment LED display device consists of eight individuals LEDs, one for each segment and one for the decimal point. There are two possible methods ofinterconnection, common anode or common cathode (Figure 11.6(f)).
Using the above data, the power consumption of an individual pixel is 2.2 × 20 ×10−3 W, i.e. 44 mW; the total power consumption of the seven-segment display is therefore around 320 mW. This high power consumption means that LEDs are onlysuitable for character displays and are unsuitable for graphics displays.
11.5 Cathode ray tube (CRT) displaysCathode ray tubes are used to create large-scale displays. These devices are often referred to as monitors. A visual display unit (VDU) is a combination of a CRTdisplay and a keyboard.
Figure 11.7 shows a basic CRT: electrons are emitted at the cathode and acceler-ated towards the anode. A third electrode, called a grid or modulator, is placedbetween cathode and anode: by altering the potential of the modulator the number ofelectrons in the beam, i.e. the beam current, can be adjusted. The beam then passesthrough a focusing system followed by X and Y deflection systems: the focusing anddeflection systems can be electromagnetic (EM), or electrostatic (ES) as shown inthe diagram. The electron beam is brought to a focus on the inside surface of the screen,which is coated with a large number of phosphor dots. These dots form the pixels.Phosphors are semiconductor materials which emit visible radiation in response tothe impact of electrons: a spot of light therefore appears on the screen. In responseto a pulse change in beam current, i.e. a sudden increase followed by a suddendecrease, the light emission does not fall instantaneously but there is a gradual

296 DATA PRESENTATION ELEMENTS
reduction called phosphorescence decay (Figure 11.7). The corresponding decay timeis called the persistence of the phosphor; phosphors with a wide range of persistencesare available, ranging from less than 1 μs (very short) to greater than 1 s (very long).In refresh displays the phosphors must be ‘refreshed’ or re-energised every time the phosphorescence decays to a certain level: this is necessary to obtain a stationarypattern on the screen with minimum flicker. In the more expensive storage displays,the display is retained on the screen and refreshment is not necessary.
A monochrome display is obtained with a non-storage CRT and a standard 312-line raster. In a raster-type display constant amplitude sawtooth deflection voltagesare applied to both X and Y plates (Figure 11.7). The period of the Y voltage, i.e. thetime taken for the display to move from the top to the bottom of the screen, is rela-tively long. A typical period is 20 ms, corresponding to a refreshment rate of 50 framesor pictures per second. This is suitable for a phosphor with a medium persistence ofsay 50 ms. The period of the X voltage, i.e. the time for each traverse across the screen,is 312 times shorter, i.e. 64 μs. The resulting motion of the spot on the screen is shownin Figure 11.8. 312 horizontal ‘lines’ are traced out during the movement of the spotfrom top to bottom of the screen.
Figure 11.7 Cathode rayconstruction andwaveforms.

11.5 CATHODE RAY TUBE (CRT) DISPLAYS 297
Suppose we wish to generate a fixed format of 2000 alphanumeric characters arrangedin 25 lines of 80 characters per line. If a 9 × 7 character format is used, then eachcharacter space occupies 10 × 8 pixels. Thus there are 25 × 10 = 250 horizontal linesof pixels with 80 × 8 = 640 pixels on each horizontal line. To create the characterson the screen, the electron beam is switched on and off to produce the required pat-tern. A high frequency pulse waveform is applied to the modulator electrode, whichcauses the electron beam current to be switched on and off many times during the64 μs required for each horizontal traverse (z modulation). During each traverse theelectron beam moves across a single line of pixels, causing them to be switched either‘on’ or ‘off’ depending on whether the modulator signal is a ‘1’ or a ‘0’. Since thereare nine lines of pixels for each character, nine complete horizontal traverses are requiredto build up each complete line of characters. Figure 11.8 shows how the charactersbuild up in a 7 × 5 format. The entire display of 25 lines, using a character space of10 × 8, is completed in 20 ms using 250 horizontal line scans. This is less than thetheoretical number of 312, partly because of the time required for vertical flyback,and partly because the top and bottom of the CRT screen are not used, to avoid imagedistortion.
The input measurement data to the monitor is usually in serial ASCII digital form(Chapter 10) and must be converted into the serial pulse video signal required by themodulator to energise the pixels. Each horizontal sweep takes 64 μs but only about40 μs is available for character generation; since 640 pixels must be energised during
Figure 11.8 Rasterdisplay and charactergeneration using 7 × 5dot-matrix format.

298 DATA PRESENTATION ELEMENTS
this time, the video signal has 16 × 106 pulses or bits per second. The monitor is normally operated under computer control, and an observer/operator can enter information and instructions via a keyboard. This facility enables the operator to requestdifferent display formats, e.g. the values of the most important measured variablesfor the complete process, or the values of all the measured variables associated witha particular part of the process.
A colour display produces images containing a wide range of colours. Thescreen of a colour CRT is coated with dots of three different types of phosphor: onetype of phosphor emits red light, the second green light, the third blue light. Dots of each type are arranged in equilateral triangles called triads (Figure 11.9(a)). Themonitor has three electron guns, one for each type of phosphor. The correspondingelectron beams are deflected horizontally and vertically to produce a raster display asin a monochrome monitor. As the beams traverse the screens, the intensity of each beamis varied according to the voltage applied to the corresponding modulator electrode.This creates varying colour intensities at the triads and colour images on the screen.
Figure 11.9Colour displays:(a) Phosphor dot triads(b) Chemical plant linediagram.

11.6 LIQUID CRYSTAL DISPLAYS (LCDS) 299
The above colour display system can be used to create graphic displays. In a fixed format alphanumeric display characters occupy fixed positions in a display andeach character is built up using a fixed 7 × 5 or 9 × 7 dot-matrix format. In a graphicdisplay the screen contains a full matrix of pixels, each of which can be turned on or off to produce graphical images or pictures, alphanumeric characters at any position on the screen or a combination of both. Figure 11.9(b) shows, in black-and-white, a colour line diagram of part of a chemical plant; alphanumeric data such as descriptions of process variables and their measured values can be displayed atany appropriate point on the diagram.
CRT displays have the disadvantage that they are not ‘flat screen’ technology andoccupy more volume than comparable liquid crystal displays. They have muchhigher operating voltages (around 16 kV) than LCDs (around 15 V); power consump-tion is also higher in CRT than in LCD displays.
11.6 Liquid crystal displays (LCDs)Liquid crystal displays (LCDs) do not emit light but use light incident on them fromexternal sources. Consequently LCDs use significantly less power (microwatts) thanLEDs (milliwatts). Liquid crystals flow under shear forces as in normal liquids buthave some of the properties of solids. In nematic liquid crystals individual moleculeshave a rod-like shape. As the orientation of the molecules changes so there is a corres-ponding rotation of the plane of polarisation of the incident light. An applied electricfield can alter both the orientation of the molecules and the plane of polarisation ofthe light, thus creating light and dark areas.
Figures 11.10(a) and (b) show the construction of a reflective monochromedisplay using field effect or twisted nematic (TN) liquid crystal material. The LC material is in contact with a pair of conducting electrodes which are transparentto light; a voltage is applied across these to create an electric field. There are glassplates above and below the electrodes. An x polarising filter is situated above the upperglass plate; this transmits only x polarised light. Similarly a y polarising filter belowthe lower glass plate transmits only y polarised light.
Figure 11.10(a) shows the situation when the applied voltage V = 0. Themolecules near the top of the LC are lined up along the x-direction. Moving down-wards through the liquid, their orientation gradually changes so that the moleculesat the bottom are lined up along the y-direction. The light entering the liquid is xpolarised; as it moves downwards the direction of polarisation rotates so that the lightis y polarised on leaving the liquid. The light is therefore able to pass through the ypolarising filter and is reflected back to the observer, the surface appearing pale greyor green.
Figure 11.10(b) shows the situation when the applied voltage V is non-zero. In thiscase the molecules remain aligned along the x direction throughout the liquid crystal:this means that the light remains x polarised as it moves downwards. The light cannottherefore pass through the lower y polarising filter and is absorbed; the surfaceappears black to an observer.
Figure 11.10(c) shows a seven-segment LCD which can display the numerals 0 to 9 and nine upper case letters. Typically the display has an operating voltage of10 V and a total current of 10 μA. The response time of the device, to turn on or turn

300 DATA PRESENTATION ELEMENTS
Figure 11.10 Liquidcrystal displays:(a) Principle: V = 0(b) Principle: V ≠ 0(c) Seven-segment display(after Open UniversityT292 Instrumentation)(d) Character display(e) Graphics display(f) Character displaysystem.

11.6 LIQUID CRYSTAL DISPLAYS (LCDS) 301
off signals, is typically 50 ms. The display is therefore driven by a pulse signal of r.m.s. voltage 10 V and frequency 60 Hz, i.e. a period of 17 ms. This enables thedisplay to be continuously refreshed, giving a contrast ratio of 20:1 with no flicker.Pulsed operation reduces power consumption and avoids electrode deterioration dueto electrolytic effects.
In order to display numerals, upper and lower case letters and other symbols, LCD monochrome character displays are used; here each character is displayed using the 7 × 5 dot matrix format (Section 11.3.1). Figure 11.10(d) shows a displayfor 16 characters on a single line, i.e. 16 × 1 format; formats range typically from 8 × 2 to 40 × 4.
In order to display graphical information monochrome graphics displays are used. These consist of a matrix of pixels (Figure 11.10(e)); the pixel matrix multi-plexing technique described in Section 11.3.2 is used. Display formats vary typic-ally from 122 × 32 to 320 × 240. A 128 × 64 graphics display has a view area of 62.5 mm × 43.5 mm with viewing angles θ between −15° and +45° and φ between−35° and +35° respectively. The contrast ratio is typically 10, and response timesfor rise and fall are typically 250 ms and 300 ms respectively; the LCD supply voltage V is typically 13.0 V.[1]
Figure 11.10(f ) shows a typical system for an LCD character display.[2] It consistsof a microcontroller, segment/pixel driver and LCD panel. The input parallel digitalsignal will be in ASCII form; the microcontroller will, for each character, convertthe input ASCII code into 7 × 5 dot matrix code and send this to the segment driver.
The basic liquid crystal element shown in Figure 11.10(a) can be used to producecolour displays by the addition of a matrix of red, green and blue filter elements betweenthe upper electrode and the x polarising filter. However, in order to produce large areadisplays with sufficient brightness and contrast ratio to be read clearly at low ambientlighting levels, further developments have been made:
(a) The addition of ‘backlighting’, a light source at the bottom underneath the ypolarising filter. The observer now receives light both reflected back throughthe display from external sources and transmitted through the display from thebacklight source.
(b) The development of super-twisted nematic (STN) liquid crystals where theangle of twist, i.e. angle of rotation of the plane of polarisation of light, is greaterthan 90°.
(c) A more recent development is thin film transistor (TFT) technology. Here there is a thin film of semiconductor providing a matrix of transistors, so thatthere is a drive transistor associated with each individual LC pixel. This givesmore effective pixel multiplexing, with all pixels in a given row or column having the same voltage. Figure 11.11(a) shows the construction of a typicalTFT display.[3]
A typical compact STN colour display has a screen size of 8.2 inches, pixel format 640 × 480, brightness 70 cd/m2 and contrast ratio 50:1. A comparable TFTdisplay has screen size 8.4 inches, pixel format 800 × 600, brightness 130 cd/m2 andcontrast ratio 250:1. A larger area TFT display for industrial use has a screen size of15 inches, pixel format 1024 × 768, brightness 250 cd/m2 and contrast ratio 400:1.[4]
These displays can be used to show line diagrams of a section of a process or planttogether with the measured values of process variables at an appropriate point on thediagram (Figure 11.9). Figure 11.11(b) shows a bargraph or strip indicator display

302 DATA PRESENTATION ELEMENTS
of measured values. Large LCD displays have several advantages over comparableCRT displays; these include lower operating voltage, lower power consumption andflat screens/panels.
11. 7 Electroluminescence (EL) displaysWhen a voltage is applied across a phosphor material, light is emitted. This effectis called electroluminescence. A typical electroluminescent phosphor material is zincsulphide doped with small amounts of metals, the metals being chosen according
Figure 11.11 Colourliquid crystal displays:(a) Construction of TFT display(b) Strip indicator display.
(b)

11.7 ELECTROLUMINESCENCE (EL) DISPLAYS 303
to the required colour. For example, an amber colour light with peak wavelength λ = 580 nm is emitted if the zinc sulphide is doped with manganese and copper.Electroluminescent displays consist of a matrix of pixels, where each pixel is a phosphor element which can be switched on and off by an applied voltage.
Figure 11.12(a) shows the construction of an EL display which consists of a num-ber of layers deposited on a glass substrate.[5] The first layer is a number of x-axis orcolumn electrodes which are electrically conductive and transparent to light. Thenthere is the matrix of phosphor elements, which is sandwiched between two dielectriclayers. Finally there are a number of y-axis or row electrodes which absorb light. Each pixel is located at an intersection of an x and a y electrode and connected across
Figure 11.12Electroluminescencedisplays (after TridentMicrosystems Ltd.[5]):(a) Construction(b) Display of measuredvariable waveforms.
(b)

304 DATA PRESENTATION ELEMENTS
them. The display is viewed through the glass substrate; with no voltage across theelectrodes the pixel appears black. If a voltage pulse, typically of height 100 V andduration 10 μs, is applied across the electrodes, the pixel emits light. The luminanceof the pixel decays from an initial value, just after the pulse, of around 1000 cd/m2,with a time constant of typically 500 μs. This means that the display must be continu-ally refreshed to avoid flicker. The pulse is repeated approximately every 1000 μs,i.e. the pulse repetition frequency is 1 kHz; this enables a continuous luminance ofat least 100 cd/m2 to be obtained. Because the voltage is applied for only 1% of thetime, the power required for each pixel is considerably reduced; around 100 μW perpixel is typical. The pulse repetition interval can be increased by adding memory tothe pixel element.
To obtain graphic displays with a matrix of pixels, the multiplexing techniquesdescribed in Section 11.3.2 are used. A typical display with screen size of 3.1 incheshas 160 × 120 pixels and an active display area of 62 × 42 mm; an 8.9-inch screenhas 640 × 240 pixels and an active area of 211 mm × 79 mm.[5] Figure 11.12(b) shows an electroluminescent screen used to display waveforms of three measured variables; the waveforms in amber show up clearly against the black background.[5]
Electroluminescent displays are flat screen-like liquid crystal displays but have a higher operating voltage and greater power consumption. However, EL displays are brighter, with a greater contrast ratio and viewing angle, than comparable LC displays.
11.8 Chart recorders
These provide a continuous record, on paper, of the time variation of measured variables.
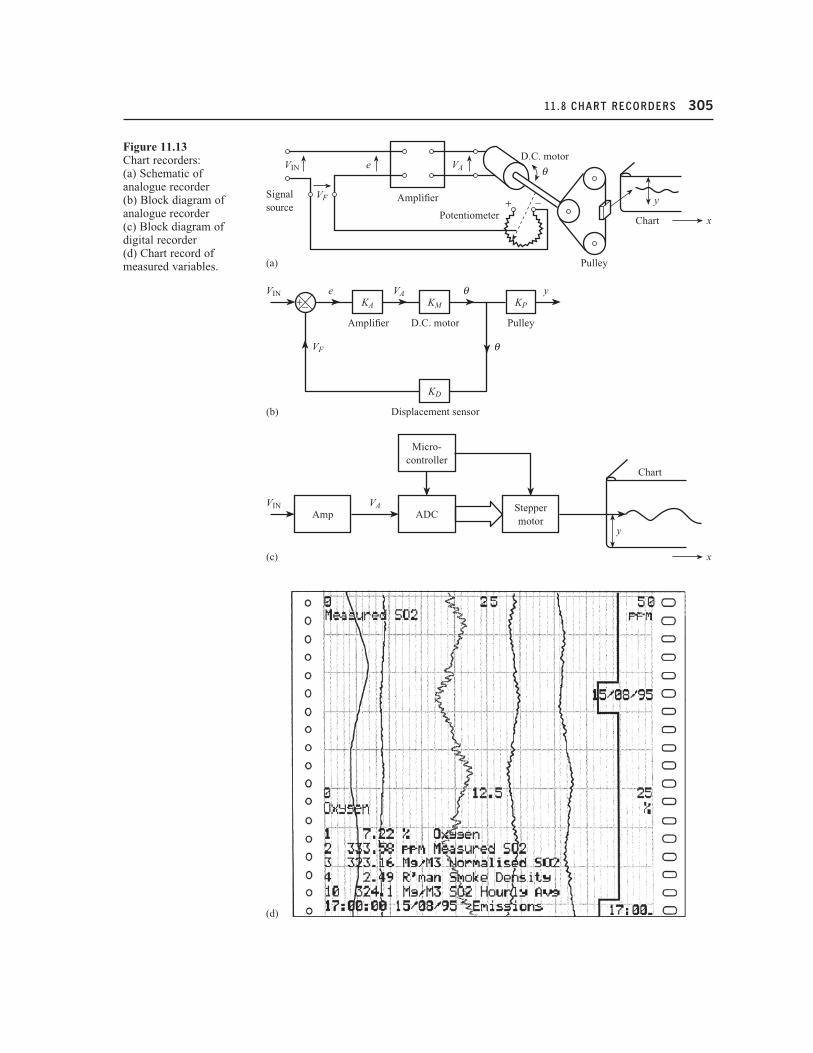
Figures 11.13(a) and (b) show schematic and block diagrams of an analogue chartrecorder. This is a closed-loop system using position feedback. The input voltageVIN is opposed by the feedback voltage VF to give an error voltage:
e = VIN − VF [11.11]
This error voltage is amplified by an amplifier of gain KA, and the amplifier outputvoltage VA is input to a d.c. motor which drives the pen. The angular rotation θ of themotor is converted into the vertical displacement y of the pen by a pulley system.The pen writes on a chart which is driven at a constant speed along the x-direction,i.e. the x position of the pen is proportional to time. The motor angular position θis sensed by a displacement sensor, often a potentiometer, to provide the feedbackvoltage VF, thus closing the loop. An increase in input voltage VIN will cause error e to increase in the short term, causing VA, θ and y to increase. This causes a corresponding increase in VF which reduces e; the system settles out with the pen ata new position y such that VF is as close as possible to VIN.
Using a similar analysis to that of eqns [3.11] to [3.19], the overall sensitivity ofthe closed-loop system is given by:
= [11.12]KAKM KP
1 + KAKM KD
y
VIN
11.8 CHART RECORDERS 305
Figure 11.13Chart recorders:(a) Schematic of analogue recorder(b) Block diagram ofanalogue recorder(c) Block diagram ofdigital recorder(d) Chart record ofmeasured variables.
(d)

306 DATA PRESENTATION ELEMENTS
If the amplifier gain is large, so that KAKM KD � 1, then y/VIN ≈ KP/KD. This meansthat the overall sensitivity is largely independent of KA and KM so that, for example,any changes in KM due to non-linearity have negligible effect.
A typical analogue chart recorder has a displacement span y of 100 mm and aninput range of 0 to 10 V or 4 to 20 mA d.c. The pen positioning accuracy is ±0.2%,the input impedance 250 kΩ and the response time less than 2.0 s for 100% step change.
Figure 11.13(c) shows a block diagram of an open-loop digital chart recorder. Herethe input voltage VIN is amplified if necessary and the resulting voltage VA input to an analogue-to-digital converter (ADC). The parallel digital output signal from the ADC is input to a digital stepper motor which moves the pen in the vertical y-direction. A typical recorder has a recording width (span of y) of 100 mm and aninput range of 0 to 10 V d.c.[6] The ADC has a resolution of 14 1–2 bits; the final motoroutput displacement has 105 steps, giving a pen positioning resolution of 0.1 mV. Inputresistance is 100 kΩ, electrical measurement error within 0.4% and pen positioningerror within 0.35%.
Several measured variables can be recorded using multi-channel recorders.There are two main types. In continuous or line recorders there is a separate motorand pen for each variable and the measured values are recorded as a continuous trace.Normally up to four pens are possible and in order for each pen to travel the full chartwidth and cross each other they must be offset from each other horizontally. Sincehorizontal displacement x is proportional to time, this can be done by creating a smalltime shift between the traces. In the multi-point type there is a single motor and pen which is switched sequentially between the input signals. The first variable isswitched in and a dot printed on the chart, then the second and a dot printed, and so on for all the variables, returning to the first to repeat the process. The trace foreach variable is therefore a series of dots in a given colour. Figure 11.13(d) is a continuous chart record of several variables.
11.9 Paperless recordersThe time variation of measured variables can be recorded without paper using a combination of LCD colour display and digital archive memory. Figure 11.14(a) showsa block diagram of a typical paperless recorder. The input measurement signals are input to a multiplexer and the selected signal is converted into parallel digital form by an analogue-to-digital converter for input to a microprocessor. The micro-processor generates the row and column address signals required for pixel matrix multiplexing in graphic displays (Section 11.3.2). Colour TFT liquid crystal displaysare used (Section 11.6). Input data is stored initially in random access memory(RAM) and then transferred to archive memory; past data can then be retrieved from archive memory and displayed on the screen. A typical recorder of this typewill accept up to 12 analogue input signals, d.c. voltage or current, and has a 144 mm × 144 mm TFT LCD screen.[7] The archive memory is either a 1.4 Mbytefloppy disk or a 300 Mbyte memory card. With the disk and four input variables, each sampled at one-minute intervals, approximately 110 days of record is obtained.Figure 11.14(b) shows continuous time and bar-graph recordings for two measuredvariables.

11.10 LASER PRINTERS 307
11.10 Laser printersFigure 11.15(a) shows the basic layout of a laser printer. The printer receives input datain parallel digital form: for characters this could be in ASCII format (Section 10.4.1);for graphics it will be in vector format, where geometrical shapes are encoded into
Figure 11.14 Paperlessrecorders:(a) System block diagram(b) Typical recording.
(b)

308 DATA PRESENTATION ELEMENTS
numerical values. The operation of the printer is controlled by a computer acting asa print controller. The controller converts this incoming data into bitmap imagepages, each page corresponding to an array of black/white or coloured dots.
The photoreceptor drum is an array of photoconductive elements or pixelswhich correspond to the above bitmap image page. Initially all of the elements aregiven a positive charge; this is done by passing an electric current through thecorona wire. The drum rotates and the controller directs a laser beam to move acrossthe entire photoreceptor array in a raster pattern (Figure 11.8). The laser beam is movedby a rotating polygonal mirror and is switched on and off at high speed as it strikeseach pixel. If light hits an element, its resistance falls sharply, causing the charge tofall to a negative value. If no light is incident, the pixel retains its positive charge.
Figure 11.15Laser printers:(a) Schematic diagram(b) Typical table of data.

REFERENCES 309
The result is that the drum is an array of positively and negatively charged pixels,i.e. an electrostatic image of the bitmap page.
The drum is then coated with positively charged black powder toner. The tonerclings to the negatively charged elements on the drum but not to the positivelycharged elements, thus creating a toner version of the bitmap. The sheet of paper isgiven a negative charge by the transfer corona wire; this charge is greater than thenegative charge of the electrostatic image so that the paper can pull the toner powderaway. The drum rolls over the sheet of paper and the paper picks up the toner to create an exact image on paper. The paper is then discharged so that it can be separ-ated from the drum and finally passes to the fuser. This is a pair of heated rollerswhich melt any loose toner particles so that they fuse with the paper fibres. The print-ing process is now complete. The electrostatic image on the drum surface is then erasedby passing it under the discharge lamp.
Laser printers can create tables of measurement data by printing numbers, lettersand special characters on paper. Figure 11.15(b) shows an extract from a 14-columntable of measured values of temperatures in a reactor. The table has 14 characters on each line which specify the channel number, the measured value and the units ofmeasurement. By printing > or <, the table indicates that the temperature is eithergreater than a specified upper limit (say 200 °C) or less than a specified lower limit(say 100 °C).
The input data to the printer is in parallel ASCII digital form from a computer (Section 10.4.1 and Table 10.6). Figure 11.15(b) gives the 14 binary ASCII input code words corresponding to each of the 14 characters on the first line of the table.
ConclusionThe chapter began by reviewing types of data presentation elements in wide currentuse and the factors influencing choice. The principles and characteristics of analogueand digital displays, recorders and printers were then discussed.
References[1] DV3 Displays 2003 Technical Data on Monochrome Graphics LCD Displays.[2] Nicomatic Displays 2003 Technical Data on LCD Character Displays.[3] Sequoia Technology 2003 Technical Data on Advanced Transflective TFT
Displays.[4] Trident Displays 2003 Technical Data on Colour LCD Displays.[5] Trident Displays 2003 Technical Data on Electroluminescence Displays.[6] Siemens 2001 Catalog MP 20-2001, Process Recorders and Accessories.[7] Eurotherm Controls 1997 Technical Data on 4100G Paperless Recorder.

310 DATA PRESENTATION ELEMENTS
Problems
A moving coil indicator is connected to a Thévenin signal source of resistance 125 Ω. Use thedata given below to answer the following questions.
(a) Calculate the steady-state sensitivity (rad V−1), natural frequency and damping ratio forthe system.
(b) What additional resistance must be connected into the circuit to give a damping ratioof 0.7? What is the sensitivity of the modified system?
Number of turns on coil = 100Coil resistance = 75 ΩCoil area = 10−4 m2
Coil moment of inertia = 2.5 × 10⁻⁵ kg m2
Magnetic flux density = 150 Wb m−2
Spring stiffness = 10−3 Nm rad−1
A closed-loop chart recorder using position feedback consists of the following elements:
Amplifier – sensitivity = 103 V/ V.D.C. motor – sensitivity ≡ 1.0 rad/V.Displacement sensor – sensitivity = 5.0 V/rad.Pulley – sensitivity = 0.15 m/rad.
(a) Find the recorder output range for an input voltage range of 0 to 5 V.(b) Explain why a change in motor sensitivity to 0.9 rad/V has negligible effect on pen
position.
It is desired to display the numerals 0 to 9 and the letters ACEFJH using the seven-segmentcharacter format shown in Figure 11.3(a). Write down a table for the conversion of a four-input DCBA (8:4:2:1 b.c.d.) to the seven-segment output abcdefg code to drive the display.
11.3
11.2
11.1