1.1 Clinical Fluid and Electrolyte Management · PDF fileClinical Fluid and Electrolyte...
52
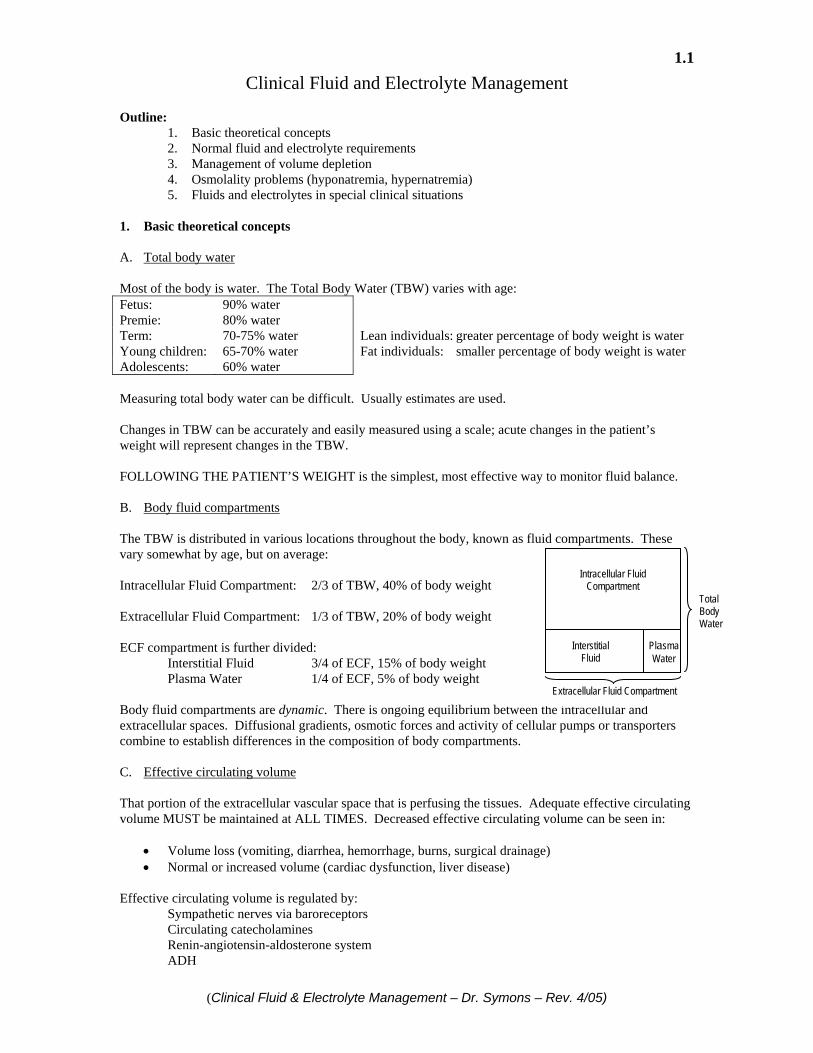
1.1 (Clinical Fluid & Electrolyte Management – Dr. Symons – Rev. 4/05) Clinical Fluid and Electrolyte Management Outline: 1. Basic theoretical concepts 2. Normal fluid and electrolyte requirements 3. Management of volume depletion 4. Osmolality problems (hyponatremia, hypernatremia) 5. Fluids and electrolytes in special clinical situations 1. Basic theoretical concepts A. Total body water Most of the body is water. The Total Body Water (TBW) varies with age: Fetus: 90% water Premie: 80% water Term: 70-75% water Lean individuals: greater percentage of body weight is water Young children: 65-70% water Fat individuals: smaller percentage of body weight is water Adolescents: 60% water Measuring total body water can be difficult. Usually estimates are used. Changes in TBW can be accurately and easily measured using a scale; acute changes in the patient’s weight will represent changes in the TBW. FOLLOWING THE PATIENT’S WEIGHT is the simplest, most effective way to monitor fluid balance. B. Body fluid compartments The TBW is distributed in various locations throughout the body, known as fluid compartments. These vary somewhat by age, but on average: Intracellular Fluid Compartment: 2/3 of TBW, 40% of body weight Extracellular Fluid Compartment: 1/3 of TBW, 20% of body weight ECF compartment is further divided: Interstitial Fluid 3/4 of ECF, 15% of body weight Plasma Water 1/4 of ECF, 5% of body weight Body fluid compartments are dynamic. There is ongoing equilibrium between the intracellular and extracellular spaces. Diffusional gradients, osmotic forces and activity of cellular pumps or transporters combine to establish differences in the composition of body compartments. C. Effective circulating volume That portion of the extracellular vascular space that is perfusing the tissues. Adequate effective circulating volume MUST be maintained at ALL TIMES. Decreased effective circulating volume can be seen in: • Volume loss (vomiting, diarrhea, hemorrhage, burns, surgical drainage) • Normal or increased volume (cardiac dysfunction, liver disease) Effective circulating volume is regulated by: Sympathetic nerves via baroreceptors Circulating catecholamines Renin-angiotensin-aldosterone system ADH Extracellular Fluid Compartment Total Body Water Interstitial Fluid Plasma Water Intracellular Fluid Compartment
Transcript of 1.1 Clinical Fluid and Electrolyte Management · PDF fileClinical Fluid and Electrolyte...
1.1
(Clinical Fluid & Electrolyte Management – Dr. Symons – Rev. 4/05)
Clinical Fluid and Electrolyte Management Outline:
1. Basic theoretical concepts 2. Normal fluid and electrolyte requirements 3. Management of volume depletion 4. Osmolality problems (hyponatremia, hypernatremia) 5. Fluids and electrolytes in special clinical situations
1. Basic theoretical concepts A. Total body water Most of the body is water. The Total Body Water (TBW) varies with age: Fetus: 90% water Premie: 80% water Term: 70-75% water Lean individuals: greater percentage of body weight is water Young children: 65-70% water Fat individuals: smaller percentage of body weight is water Adolescents: 60% water Measuring total body water can be difficult. Usually estimates are used. Changes in TBW can be accurately and easily measured using a scale; acute changes in the patient’s weight will represent changes in the TBW. FOLLOWING THE PATIENT’S WEIGHT is the simplest, most effective way to monitor fluid balance. B. Body fluid compartments The TBW is distributed in various locations throughout the body, known as fluid compartments. These vary somewhat by age, but on average: Intracellular Fluid Compartment: 2/3 of TBW, 40% of body weight Extracellular Fluid Compartment: 1/3 of TBW, 20% of body weight ECF compartment is further divided: Interstitial Fluid 3/4 of ECF, 15% of body weight Plasma Water 1/4 of ECF, 5% of body weight Body fluid compartments are dynamic. There is ongoing equilibrium between the intracellular and extracellular spaces. Diffusional gradients, osmotic forces and activity of cellular pumps or transporters combine to establish differences in the composition of body compartments. C. Effective circulating volume That portion of the extracellular vascular space that is perfusing the tissues. Adequate effective circulating volume MUST be maintained at ALL TIMES. Decreased effective circulating volume can be seen in:
• Volume loss (vomiting, diarrhea, hemorrhage, burns, surgical drainage) • Normal or increased volume (cardiac dysfunction, liver disease)
Effective circulating volume is regulated by: Sympathetic nerves via baroreceptors Circulating catecholamines Renin-angiotensin-aldosterone system
ADH
Extracellular Fluid Compartment
Total Body Water
Interstitial Fluid
Plasma Water
Intracellular Fluid Compartment

1.1
(Clinical Fluid & Electrolyte Management – Dr. Symons – Rev. 4/05)
2. Normal fluid and electrolyte requirements Fluid and electrolytes required to replace daily losses and to maintain an overall net balance of zero gained or lost are often referred to as “maintenance” needs. These needs vary from day to day and from individual to individual. A. Daily water requirements Historically, daily water needs have been estimated based on energy expenditure:
1 kcal expended/day = 1 ml H2O required Based on computed energy expenditure of the average hospitalized patient:
First 10 kg = 100ml/kg/day H2O Second 10 kg = 50 ml/kg/day H2O Weight over 20 kg = 20 ml/kg/day H2O
Therefore, for a 25kg child, the daily fluid requirement based on this scheme would be: 1000ml/day for the first 10kg (10kg X 100ml/kg/day) 500ml/day for the second 10kg (10kg X 50ml/kg/day) + 100ml/day for the 5kg over 20kg (5kg X 20ml/kg/day) TOTAL:1600ml/day for 25kg child
B. Daily electrolyte requirements Estimates for daily electrolytes can be based on metabolic demands or, by extension, on daily water needs:
• Sodium 2 - 3 mEq/100ml H2O /day • Potassium 1 - 2 mEq/100ml H2O /day • Chloride 2 - 3 mEq/100ml H2O /day
The “4-2-1” method of pediatric IV fluids. Looking at these equations you can see that this is the source of the magic “4-2-1” rule that pediatric house officers have passed along through the years. The “4-2-1” method is a mathematical trick that allows you to calculate IV fluids quickly, based on the water/energy relationship outlined above. For “4-2-1”, the rule states that fluids should be ordered as follows:
First 10 kg = 4 ml/kg/hr H2O Second 10 kg = 2 ml/kg/hr H2O Weight over 20 kg = 1 ml/kg/hr H2O
Therefore, for the same 25kg child used in the example above, IV fluids based on this method would be: 40ml/hr for the first 10kg (10kg X 4 ml/kg/hr) 20ml/hr for the second 10kg (10kg X 2 ml/kg/hr) + 5ml/hr for the 5kg over 20kg (5kg X 1 ml/kg/hr) TOTAL: 65ml/hr for 25kg child, or
1560ml/day (65ml/hr X 24 hrs/day), pretty close to the 1600ml/day calculated by the long method, above. Note that this method is an estimation of the longer method, which is already an estimation based on assumptions about average metabolism in hospitalized patients at given body weights. Since most pediatric patients have normal cardiac and renal function, the patient can adjust for the inherent errors in this system, increasing or decreasing urine output as necessary. However, some patients are not able to compensate appropriately; for them, more rigorous methods for prescribing fluids must be used.
Although there are unusual clinical situations with large electrolyte losses from the skin or GI tract, most patients lose their daily electrolytes in urine. Consequently, oliguric patients require significantly less electrolyte replacement to maintain balance. By contrast, patients with renal tubular dysfunction, who lose excess electrolytes in large volumes of urine, may require very high levels of electrolyte supplementation. Patients with unusual losses will require careful monitoring and adjustment to their electrolyte replacement regimen.
1.1
(Clinical Fluid & Electrolyte Management – Dr. Symons – Rev. 4/05)
C. Important caveats about daily fluid and electrolyte management Equations for fluid and electrolyte “maintenance” are based on a series of ASSUMPTIONS, including:
• Average insensible losses • Average energy expenditure and metabolism • Average urinary losses • No additional losses from other sites • Normal renal function
Hospitalized patients frequently have abnormalities that go counter to the above assumptions. Fluid and electrolyte therapy must be adjusted based on the clinical circumstances. 3. Fluid Replacement Therapy Most important goal of fluid replacement therapy is restoration of an adequate effective circulating volume. Volume needed varies with the clinical situation; continuing reevaluation is required. A. Estimating the fluid deficit
(1) Check the weight Essential information in fluid replacement therapy. Rapid changes in weight likely represent changes in TBW. You need the weight to plan where you’re going with your replacement.
(2) History Ask about losses (diarrhea, vomiting, how much, how often), attempts at replacement (what fluids used, how much given, how successful), urine output.
(3) Physical exam findings Mental status, pulse, BP, body weight, mucous membranes, skin turgor, skin color.
(4) Laboratory evaluation Serum chemistries, hematocrit, and urine studies can guide therapy and check for complications. History and physical exam give a better measure of the volume deficit.
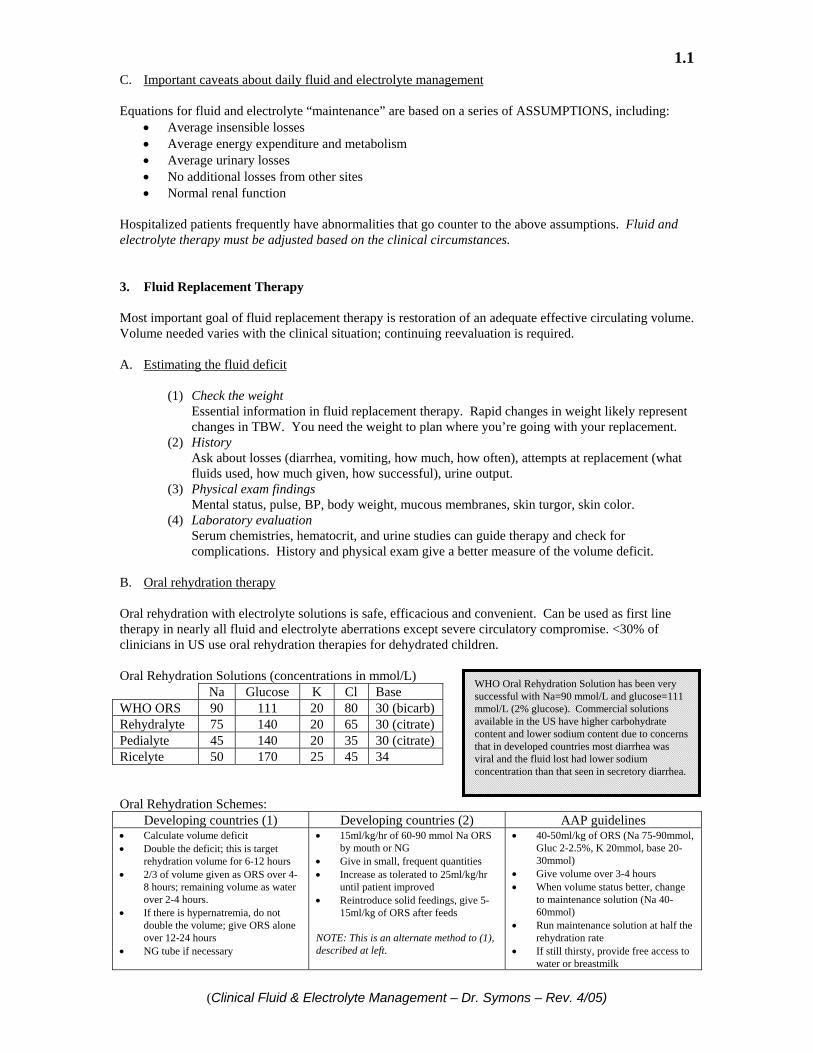
B. Oral rehydration therapy Oral rehydration with electrolyte solutions is safe, efficacious and convenient. Can be used as first line therapy in nearly all fluid and electrolyte aberrations except severe circulatory compromise. <30% of clinicians in US use oral rehydration therapies for dehydrated children. Oral Rehydration Solutions (concentrations in mmol/L) Na Glucose K Cl Base WHO ORS 90 111 20 80 30 (bicarb) Rehydralyte 75 140 20 65 30 (citrate) Pedialyte 45 140 20 35 30 (citrate) Ricelyte 50 170 25 45 34 Oral Rehydration Schemes:
Developing countries (1) Developing countries (2) AAP guidelines • Calculate volume deficit • Double the deficit; this is target
rehydration volume for 6-12 hours • 2/3 of volume given as ORS over 4-
8 hours; remaining volume as water over 2-4 hours.
• If there is hypernatremia, do not double the volume; give ORS alone over 12-24 hours
• NG tube if necessary
• 15ml/kg/hr of 60-90 mmol Na ORS by mouth or NG
• Give in small, frequent quantities • Increase as tolerated to 25ml/kg/hr
until patient improved • Reintroduce solid feedings, give 5-
15ml/kg of ORS after feeds NOTE: This is an alternate method to (1), described at left.
• 40-50ml/kg of ORS (Na 75-90mmol, Gluc 2-2.5%, K 20mmol, base 20-30mmol)
• Give volume over 3-4 hours • When volume status better, change
to maintenance solution (Na 40-60mmol)
• Run maintenance solution at half the rehydration rate
• If still thirsty, provide free access to water or breastmilk
WHO Oral Rehydration Solution has been very successful with Na=90 mmol/L and glucose=111 mmol/L (2% glucose). Commercial solutions available in the US have higher carbohydrate content and lower sodium content due to concerns that in developed countries most diarrhea was viral and the fluid lost had lower sodium concentration than that seen in secretory diarrhea.

1.1
(Clinical Fluid & Electrolyte Management – Dr. Symons – Rev. 4/05)
C. Intravenous therapy Absolute indications for IV therapy are limited. Clearly indicated in shock; sometimes in settings of high ongoing losses or in those children who cannot accomplish rehydration orally. Reestablishing effective circulating volume is the main goal.
(1) What IV fluid should I use? Initial IV therapy should be with isotonic fluid to improve effective circulating volume.
Na+ (meq/L) K+ (meq/L) Base (meq/L) Ca++ (mg/dL) Normal saline (0.9% NaCl) Ringer’s Ringer’s Lactate
154 147 130
4 4
28 (lactate)
4.5 3
Note that Ringer’s has K+, which may be contraindicated if urine output is poor. If the patient has volume depletion due to hemorrhage, the best volume expander is blood.
(2) How much IV fluid should I give initially? 10-20ml/kg IV over 30-60minutes. Use clinical findings to determine if patient is responding (mental status, vital signs, urine output). Repeat this infusion if necessary. If the patient has not improved significantly despite giving 60ml/kg IV during this initial period, give strong consideration to central venous monitoring to accurately assess intravascular volume. NOTE: This type of empiric therapy may be contraindicated in patients with cardiac, pulmonary or renal disease. Consider the clinical situation and continue to reassess.
(3) How should I continue IV fluids? Most children do not require continued IV fluids after effective circulation has been restored. Oral rehydration should be resumed if possible. Continue IV fluids in situations where oral rehydration will be difficult, such as high ongoing losses, severe electrolyte abnormalities, poor mental status or inability to tolerate enteral fluids. When continuing IV fluids consider:
• Remaining deficit that needs to be replaced (both water and electrolytes) • Ongoing losses (volume and electrolyte composition) • Daily requirements for water and electrolytes • Clinical conditions that can effect use of IV fluids (e.g., cardiac, renal disease)
(a) Estimate remaining deficits
Volume: Check current weight and compare to desired baseline. If using pre-resuscitation weight, consider the amount of volume given in resuscitation. Sodium: If hyponatremic, calculate the sodium deficit (see hyponatremia section) Free water: If hypernatremic, calculate free water deficit (see hypernatremia section)
(b) Estimate daily needs Estimate daily needs for water and electrolytes, as for any patient. Adjust based on the clinical situation (e.g., fever, coma, ventilator, etc.)
(c) Consider ongoing losses Monitor for losses such as stool, drains, etc. Consider replacing these as needed.
(d) Provide therapy Add up water and electrolyte needs from deficits and daily requirements.
Clinical example: A normally healthy girl who weighed 11kg two weeks ago comes to the ER with gastroenteritis. She has only been taking water and juice; now she refuses all fluids. She weighs 10kg on admission to the ER, has tachycardia and dry mucous membranes. Initial serum sodium is 134mEq/L. You give volume expansion with 0.9% NaCl, 200ml IV over 1 hour. Heart rate comes down and she makes some urine but she still refuses fluids; you plan to continue IV rehydration. Fluid deficit is now 800ml, since you gave 200ml. Daily fluid needs are about 1000ml/d. With volume depletion she lost sodium equivalent to isotonic fluid (800ml at 154mEq/L, or about 120mEq). The small sodium deficit from the hypotonic fluids she was drinking is probably negligible in this case. Daily sodium needs are about 30mEq/d. Adding it up, for the next 24 hours, fluid should be 1800ml and Na should be 150mEq, or 1.8 liters of fluid with 83mEq/L of Na. You could choose to run D5 0.45% NaCl (77mEq/L of Na) at 75ml/hr, which will closely approximate this patient’s fluid and sodium needs.

1.1
(Clinical Fluid & Electrolyte Management – Dr. Symons – Rev. 4/05)
4. Osmolality problems (hyponatremia, hypernatremia)
A. Water homeostasis and serum osmolality Normal cellular function requires normal serum osmolality. Water homeostasis maintains serum osmolality. Major factors contributing to serum osmolality are Na, glucose and BUN.
Serum osmolality estimation: (2 x serum Na) + (serum glucose/18) + (BUN/2.8) In most situations, sodium is the major contributor. The sodium concentration is, therefore, a measure of the serum osmolality rather than total body sodium. Osmolality is regulated by: Urinary concentration and dilution, under control of ADH Thirst mechanism Acute changes in serum osmolality will cause rapid changes in cell volume and can lead to neurological abnormalities (due to changes in brain cell volume). These abnormalities need to be corrected quickly. The body can compensate for slower changes in serum osmolality by adjusting intracellular osmolality. Correction of a more long-standing abnormality of serum osmolality should be performed more slowly given the establishment of the body’s adaptive mechanisms. B. Hyponatremia Defined as: serum Na < 130 mEq/L Usually due to too much water for solute, rather than too little sodium. Sodium deficit calculation: [(normal Na(mEq/L)) – (measured Na(mEq/L)] x TBW (L) Use 135mEq/L as normal Na; estimate TBW as 0.6L/kg x body weight (kg) Need to determine the patient’s overall fluid status to help clarify cause of hyponatremia.
Evaluation of Hyponatremia ↓ Volume Status Normal or ↑ Volume Status
↓ Urine Na ↑ Urine Na ↓ Urine Na ↑ Urine Na ↓ volume state activates renin/A-II/aldo system to avidly retain Na, decreasing Na in urine. ↑ ADH due to low volume state. Ongoing losses (gastroenteritis, long-term diuretic use, burns, hemorrhage, vascular leak syndromes) and ↑ water retention lead to ↓ serum Na.
Low volume state with high urine Na indicates renal salt wasting: evaluate for renal tubule dysfunction, diuretic use, adrenal insufficiency.
TBW and total body sodium are in excess, e.g., nephrotic syndrome, cardiac failure, liver failure. Usually have edema. Despite increased weight, often have decreased effective circulating volume, leading to more sodium and water retention (ADH turned on due to decreased ECV).
Usually SIADH, can also see in renal failure (decreased GFR, increased FE-Na) or water intoxication.
Therapy: Volume expansion, Na replacement for deficit.
Therapy: Adequate salt and water replacement, hormone replacement if indicated.
Therapy: Try to balance maintenance of ECV with restriction of Na and water.
Therapy: Restrict free water intake.
Symptomatic Hyponatremia: Decreased serum sodium (usually <120mEq/L) with seizures or mental status changes.
Hypertonic saline is indicated only in this situation. Give: How Much? Calculate: Rate of infusion:
3% NaCl (513mEq/L)
Enough to raise serum Na by ~5mEq/L
TBW(L) x desired ∆ in Na(mEq/L) = mEq’s needed Quick estimate: wt(kg) x 6=ml’s to infuse
Limit rise of Na to no more than 3mEq/L/hr; best to infuse over 3-4hrs.
NOTE: There is no role for hypertonic saline in the treatment of asymptomatic hyponatremia.

1.1
(Clinical Fluid & Electrolyte Management – Dr. Symons – Rev. 4/05)
C. Hypernatremia Defined as: serum Na > 150 mEq/L Significant neurological effects usually seen with Na > 160 mEq/L Free water deficit calculation:
measured Na (mEq/L) desired Na (mEq/L) X TBW (L)
Use 145mEq/L as desired Na; estimate TBW as 0.6L/kg x body weight (kg) Usually due to a relative deficiency of water for normal extracellular solute. Can occur in setting of excess water losses (DI) or loss of Na and water that is dilute compared to serum (diarrhea; Na=60mEq/L). Rising serum Na leads to rising serum osmolality. Osmoreceptors sense increased osmolality and trigger ADH release. Thirst mechanism is triggered with elevated osmolality. Both mechanisms should return osmolality to normal. Hypernatremia should almost never occur in a patient with normal osmolality sensing mechanisms, normal thirst and a normal ability to seek water.
Evaluation of Hypernatremia ↓ Volume Status ↑ Volume Status
Patient has losses that are hypotonic to serum with insufficient replacement of water (e.g., diarrhea or DI with reduced PO intake).
Overload of exogenous sodium. Usually occurs only if the patient can not seek water on his own. Usually have signs of volume overload (e.g., edema).
Therapy: Volume expansion, followed by careful adjustment of the abnormal osmolality. If possible, permit the patient’s own mechanisms for osmoregulation (thirst, normal ADH) to function. Severe or chronic hypernatremia needs to be corrected slowly to prevent acute water flux into cells (no faster than 10 – 15 mEq/L/day). Monitor labs closely.
Therapy: Remove sodium, provide water. Consider dialysis for severe volume overload and hypernatremia.
5. Fluids and electrolytes in special clinical situations “Maintenance” fluid and electrolyte calculations assume normal renal function and normal daily losses, mostly from urine. Patients with renal failure, high ongoing losses or those in an ICU setting must be assessed on an individual basis for fluid and electrolyte therapy. The conservative approach outlined below will work for any patient; it must be used for the more complicated patient who cannot autoregulate fluid and electrolyte status. • Assure an adequate effective circulating volume
All patients require an adequate effective circulating volume to permit tissue perfusion. Provide isotonic crystalloid to volume depleted patients until ECV is stabilized. Infusion volumes should be smaller and rates slower if it is not clear that the patient can tolerate aggressive fluids. Frequent evaluation of clinical status is mandatory.
• Determine goals for overall fluid balance
If the patient’s overall fluid balance is appropriate, the goal is to keep it that way. The most conservative method involves providing fluids at a baseline rate to replace insensible losses and to replace all other measured losses on a milliliter-per-milliliter basis. By conservation of matter, this must keep the patient balanced. Strict monitoring of input, output and weight changes is essential. Any additional fluids, such as medications, flushes or continuous drips, must be considered in the balance since they are not offset by a loss.
− TBW (L)

1.1
(Clinical Fluid & Electrolyte Management – Dr. Symons – Rev. 4/05)
Conservative Fluid Management for Complicated Patients Determine amount Consider composition Choose an IV fluid Infusion rate
Insensible losses (evaporative losses, respiratory losses)
Average Pt: 300-400ml/m2/day Increase for activity, fever; decrease for coma, ventilator
Insensible losses are mostly water without electrolytes
D5W
Daily loss/24hrs to give infusion rate/hr
Measured losses Urine Stool Surgical drains Chest tubes Gastric drainage
These losses must be measure by hospital staff. All measurable losses must be considered.
Electrolyte composition of body fluids can be highly variable; send fluids for analysis if the losses are significant.
0.45% NaCl as empiric fluid for replacement; Adjust fluid based on fluid analysis, clinical situation
Replace losses ml/ml
• Limit fluids for volume overloaded patients
Decrease daily input as much as possible for the volume overloaded patient. Concentrate continuous drips and nutrition. Consider the use of diuretics to increase urine output. Do not replace the full volume of all losses. Closely monitor input, output and weights; adjust regimen as needed.
• Consider dialysis and ultrafiltration
The conservative fluid regimen may limit your ability to provide nutrition or therapy to your patient. Dialysis or continuous ultrafiltration can remove fluid efficiently, preventing the imbalance of fluid while the patient receives the needed treatment.

1.1
(Clinical Fluid & Electrolyte Management – Dr. Symons – Rev. 4/05)
(This page intentionally left blank.)
1.2
(Potassium - Dr. McDonald – Rev. 5/05)
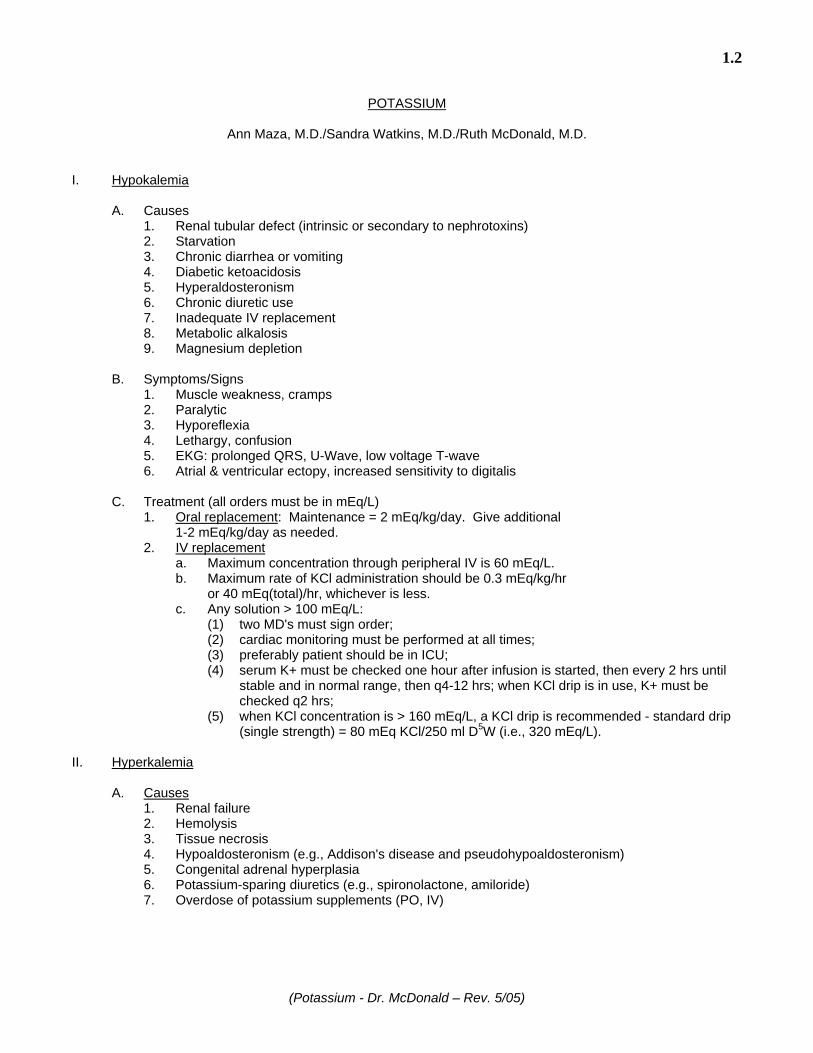
POTASSIUM Ann Maza, M.D./Sandra Watkins, M.D./Ruth McDonald, M.D. I. Hypokalemia
A. Causes 1. Renal tubular defect (intrinsic or secondary to nephrotoxins) 2. Starvation 3. Chronic diarrhea or vomiting 4. Diabetic ketoacidosis 5. Hyperaldosteronism 6. Chronic diuretic use 7. Inadequate IV replacement 8. Metabolic alkalosis 9. Magnesium depletion
B. Symptoms/Signs
1. Muscle weakness, cramps 2. Paralytic 3. Hyporeflexia 4. Lethargy, confusion 5. EKG: prolonged QRS, U-Wave, low voltage T-wave 6. Atrial & ventricular ectopy, increased sensitivity to digitalis
C. Treatment (all orders must be in mEq/L)
1. Oral replacement: Maintenance = 2 mEq/kg/day. Give additional 1-2 mEq/kg/day as needed.
2. IV replacement a. Maximum concentration through peripheral IV is 60 mEq/L. b. Maximum rate of KCl administration should be 0.3 mEq/kg/hr
or 40 mEq(total)/hr, whichever is less. c. Any solution > 100 mEq/L:
(1) two MD's must sign order; (2) cardiac monitoring must be performed at all times; (3) preferably patient should be in ICU; (4) serum K+ must be checked one hour after infusion is started, then every 2 hrs until
stable and in normal range, then q4-12 hrs; when KCl drip is in use, K+ must be checked q2 hrs;
(5) when KCl concentration is > 160 mEq/L, a KCl drip is recommended - standard drip (single strength) = 80 mEq KCl/250 ml D5W (i.e., 320 mEq/L).
II. Hyperkalemia
A. Causes 1. Renal failure 2. Hemolysis 3. Tissue necrosis 4. Hypoaldosteronism (e.g., Addison's disease and pseudohypoaldosteronism) 5. Congenital adrenal hyperplasia 6. Potassium-sparing diuretics (e.g., spironolactone, amiloride) 7. Overdose of potassium supplements (PO, IV)
1.2
(Potassium – Dr. McDonald – Rev. 5/05)
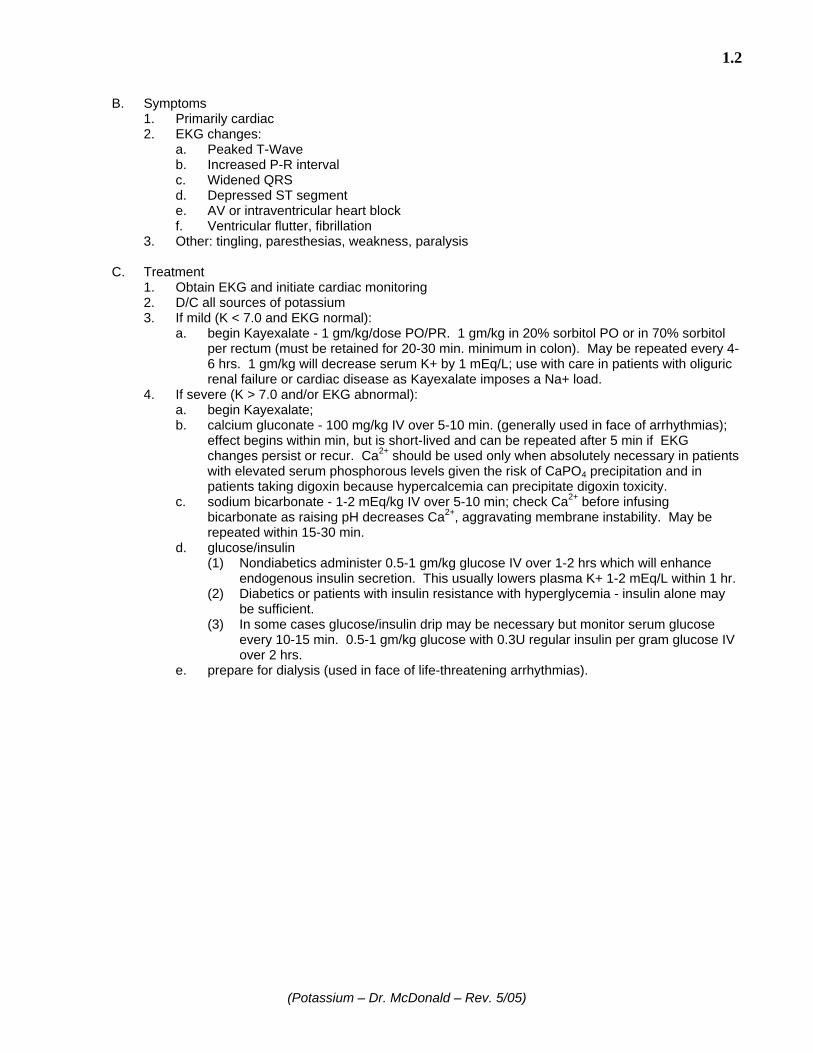
B. Symptoms 1. Primarily cardiac 2. EKG changes:
a. Peaked T-Wave b. Increased P-R interval c. Widened QRS d. Depressed ST segment e. AV or intraventricular heart block f. Ventricular flutter, fibrillation
3. Other: tingling, paresthesias, weakness, paralysis
C. Treatment 1. Obtain EKG and initiate cardiac monitoring 2. D/C all sources of potassium 3. If mild (K < 7.0 and EKG normal):
a. begin Kayexalate - 1 gm/kg/dose PO/PR. 1 gm/kg in 20% sorbitol PO or in 70% sorbitol per rectum (must be retained for 20-30 min. minimum in colon). May be repeated every 4-6 hrs. 1 gm/kg will decrease serum K+ by 1 mEq/L; use with care in patients with oliguric renal failure or cardiac disease as Kayexalate imposes a Na+ load.
4. If severe (K > 7.0 and/or EKG abnormal): a. begin Kayexalate; b. calcium gluconate - 100 mg/kg IV over 5-10 min. (generally used in face of arrhythmias);
effect begins within min, but is short-lived and can be repeated after 5 min if EKG changes persist or recur. Ca2+ should be used only when absolutely necessary in patients with elevated serum phosphorous levels given the risk of CaPO4 precipitation and in patients taking digoxin because hypercalcemia can precipitate digoxin toxicity.
c. sodium bicarbonate - 1-2 mEq/kg IV over 5-10 min; check Ca2+ before infusing bicarbonate as raising pH decreases Ca2+, aggravating membrane instability. May be repeated within 15-30 min.
d. glucose/insulin (1) Nondiabetics administer 0.5-1 gm/kg glucose IV over 1-2 hrs which will enhance
endogenous insulin secretion. This usually lowers plasma K+ 1-2 mEq/L within 1 hr. (2) Diabetics or patients with insulin resistance with hyperglycemia - insulin alone may
be sufficient. (3) In some cases glucose/insulin drip may be necessary but monitor serum glucose
every 10-15 min. 0.5-1 gm/kg glucose with 0.3U regular insulin per gram glucose IV over 2 hrs.
e. prepare for dialysis (used in face of life-threatening arrhythmias).

1.3
(Calcium – Dr. Zelikovic– Rev. 5/05 by Dr. McDonald)
CALCIUM Israel Zelikovic, M.D. I. Calcium Homeostasis:
● Calcium in serum: Ionized - 45%, bound to proteins (mostly albumin) - 45%, complexed (with bicarbonate, phosphate, citrate) - 10% Normal serum concentration: Total: 8.8-10.5 mg/dl (decreased when serum protein is low). Ionized: 4.0-5.6 mg/dl (decreased in alkalosis; increased in acidosis).
● Biological function: Bone growth and mineralization, stability of neural membranes and neuromuscular
junction, muscle and myocardial contraction, blood clotting, cellular "second messenger."
● Recommended requirement of calcium: 1 mMol (child) - 3mMol(neonate)/ Kg/day; 1 mMol = 40 mg elemental calcium. 1 mEq = 20 mg elemental calcium.
● Regulation of homeostasis: Essentially through absorption in intestine (duodenum, jejunum) primarily
controlled by 1,25(OH)2 Vit D. Kidney and bone participate.
A. Factors affecting intestinal calcium absorption: ● Increase: 1,25(OH)2D, PTH, hypocalcemia, hypophosphatemia (by stimulation of
1,25(OH)2D production). ● Decrease: High phosphate intake, glucocorticoids, fat malabsorption, low pH in intestine,
dietary phytate, oxalate or citrate (form complexes with calcium).
B. Renal Handling: Of the filtered calcium (ionized + complexed) 98% is reabsorbed in renal tubule (60% proximal convoluted tubule, 20% thick ascending limb of Henle, 20% distal and collecting tubule).
Factors affecting tubular reabsorption of calcium: ● Increase: Low calcium intake, high phosphate intake (because of increased deposition of
calcium in bone), PTH, 1,25(OH)2D (?), calcitonin, alkalosis, thiazides, amiloride. ● Decrease: High calcium intake, low phosphate intake, increased sodium intake, ECF
volume expansion, osmotic diuresis, loop diuretics, carbonic anhydrase inhibitors.
C. Bone: Calcium release from or deposition in bone (combined 1.25(OH)2D and PTH action) help to maintain normal serum calcium concentration.
II. Hypocalcemia:
A. Causes: 1. Neonatal (early, late). Low calcium intake in premature infants. 2. PTH System abnormalities:
● Hypoparathyroidism (cong., acquired) ● Polyglandular autoimmune disease ● Post surgery ● Hypomagnesemia ● Pseudohypoparathyroidism (type I, II)

1.3
(Calcium – Dr. Zelikovic– Rev. 5/05 by Dr. McDonald)
3. Vit. D. System abnormalities: ● Reduced intake, sunlight exposure or absorption ● Hepatic disease ● Anticonvulsants ● Chronic renal failure ● Vit. D. dependent rickets (type I, II)
4. Other: Acute renal failure, acute pancreatitis
B. Clinical Manifestations: 1. Neuromuscular: Irritability (positive Trausseau or Chvostak sign), tetany 2. CNS: Seizures 3. Cardiac: Prolonged Q-T interval, arrhythmia, cardiac arrest
RISK FACTOR: ALKALOSIS! 4. Chronic: Rickets, lethargy and poor feeding (newborn), cataracts, ectopic calcifications
(pseudohypoparathyroidism). C. Treatment:
1. Parenteral: a. Calcium gluconate 10% = 100 mg/ml Ca Gluconate (9 mg elemental calcium/100 mg
calcium gluconate) ● Cardiac arrest: 100 mg/kg/dose repeated q 10 min ● Maintenance: 100 mg/kg/dose q 4 hrs as indicated
b. Calcium chloride 10% = 100 mg/ml CaCl2 (27 mg elemental calcium/100 mg calcium chloride) ● Cardiac arrest: 20 mg/kg/dose over 5 min q 10 min ● Maintenance: 20 mg/kg q 4 hrs as indicated ● Should only be given in a central vein.
Administer IV calcium under ECG monitoring. Watch for bradycardia, hypotension, extravasation.
2. Oral:
Combined treatment with calcium supplements and vitamin D.
Dose of oral calcium: 1-5 mMol (40 mg - 200 mg elemental calcium)/ kg/day. a. Calcium carbonate (40% elemental calcium)
Tums® - 500 mg Tab, OsCal® - 1250 mg Tab, Susp - 250 mg/ml, b. Calcium glubionate (Neo-Calglucon® syrup) 360 mg/ml (23 mg elemental calcium/ml) c. Calcium gluconate (9% elemental calcium) - can give 10% IV solution orally. d. Calcium acetate (PhosLo®) (25% elemental calcium), 667 mg tab, (best phosphorus
binder).
Dose of vitamin D: Individualize (see CHMC Formulary) a. Ergocalciferol (calciferol): Vit D2. Solution (CHMC):
400 units/0.5 ml. Capsule 50,000 units b. Calcitriol (Rocaltrol® + Calcijex®): (1, 25 (OH)2 Vit. D)
0.25 mcg capsule (PO); 1 mcg/ml (IV)
1.3
(Calcium – Dr. Zelikovic– Rev. 5/05 by Dr. McDonald)
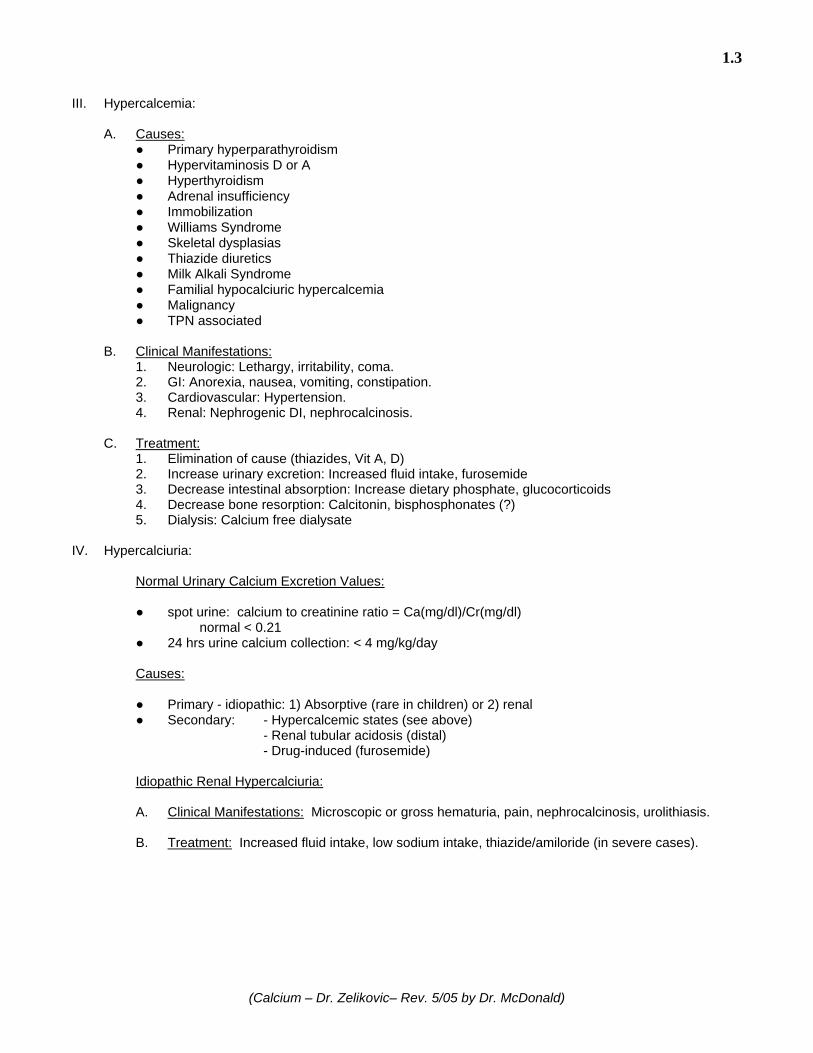
III. Hypercalcemia:
A. Causes: ● Primary hyperparathyroidism ● Hypervitaminosis D or A ● Hyperthyroidism ● Adrenal insufficiency ● Immobilization ● Williams Syndrome ● Skeletal dysplasias ● Thiazide diuretics ● Milk Alkali Syndrome ● Familial hypocalciuric hypercalcemia ● Malignancy ● TPN associated
B. Clinical Manifestations:
1. Neurologic: Lethargy, irritability, coma. 2. GI: Anorexia, nausea, vomiting, constipation. 3. Cardiovascular: Hypertension. 4. Renal: Nephrogenic DI, nephrocalcinosis.
C. Treatment:
1. Elimination of cause (thiazides, Vit A, D) 2. Increase urinary excretion: Increased fluid intake, furosemide 3. Decrease intestinal absorption: Increase dietary phosphate, glucocorticoids 4. Decrease bone resorption: Calcitonin, bisphosphonates (?) 5. Dialysis: Calcium free dialysate
IV. Hypercalciuria:
Normal Urinary Calcium Excretion Values:
● spot urine: calcium to creatinine ratio = Ca(mg/dl)/Cr(mg/dl) normal < 0.21
● 24 hrs urine calcium collection: < 4 mg/kg/day
Causes:
● Primary - idiopathic: 1) Absorptive (rare in children) or 2) renal ● Secondary: - Hypercalcemic states (see above)
- Renal tubular acidosis (distal) - Drug-induced (furosemide)
Idiopathic Renal Hypercalciuria:
A. Clinical Manifestations: Microscopic or gross hematuria, pain, nephrocalcinosis, urolithiasis.
B. Treatment: Increased fluid intake, low sodium intake, thiazide/amiloride (in severe cases).
1.3
(Calcium – Dr. Zelikovic– Rev. 5/05 by Dr. McDonald)
(This page intentionally left blank.)

1.4
(Hypophosphatemia - Dr. Symons - Rev. 4/05)
HYPOPHOSPHATEMIA Steven D. Wanaka, R.Ph. Donna Gentry-Hayward, R.N. Sandra L. Watkins, M.D. Ellis D. Avner, M.D. I. Causes of Severe Hypophosphatemia (Serum Concentration < 1.0 mg/dl)
A. Treatment of diabetic ketoacidosis B. Phosphate-binders C. Prolonged respiratory alkalosis D. Hyperalimentation and nutritional replacement in severe deficiencies E. Chronic alcoholism F. Severe burns G. Renal transplant H. Cisplatin (or other) renal tubular injury
II. Risks of Severe Hypophosphatemia
A. Cardiac: impaired cardiac function B. Neurologic: tremor, confusion, seizures, coma, paresthesias C. Respiratory: acute respiratory failure D. Muscular: pain, diffuse muscle weakness (esp. proximal), rhabdomyolysis E. Skeletal: fractures, osteomalacia, diffuse bone pain F. Renal: renal tubular acidosis, hypercalciuria G. Hematologic: hemolysis, decreased tissue delivery of oxygen, decreased chemotaxis and
phagocytosis, thrombocytopenia, decreased platelet ATP production III. Sources for Phosphate Replacement
A. Note that phosphate exists as HPO4 (80%) and H2PO4 (20%) with virtually none existing as PO4. Therefore, the approximate valence is 1.8. Conversion then can be calculated as follows:
1 mg phosphorus = 0.032 mMol phosphorus (phosphate) 1 mMol phosphorus = 31 mg phosphorus (phosphate)
B. Oral:
1. K-Phos Neutral tablet (8 mMol (250mg) phosphate, 13 mEq sodium, 1 mEq potassium) 2. Neutraphos capsule or packet (8 mMol (250mg) phosphate, 7.1 mEq sodium, 7.1 mEq
potassium) 3. Neutraphos-K capsule or packet (8mMol (250mg) phosphate, 14.25 mEq potassium)
C. Parenteral:
1. Potassium Phosphate injection (3 mMol/ml phosphorus, 93 mg/ml phosphate, 4.4 mEq/ml K+) 2. Sodium Phosphate injection (3 mMol/ml phosphorus, 93 mg/ml phosphate, 4 mEq/ml Na+)
(Parenteral Phosphate must be given as an IV infusion.)
1.4
(Hypophosphatemia - Dr. Symons - Rev. 4/05)
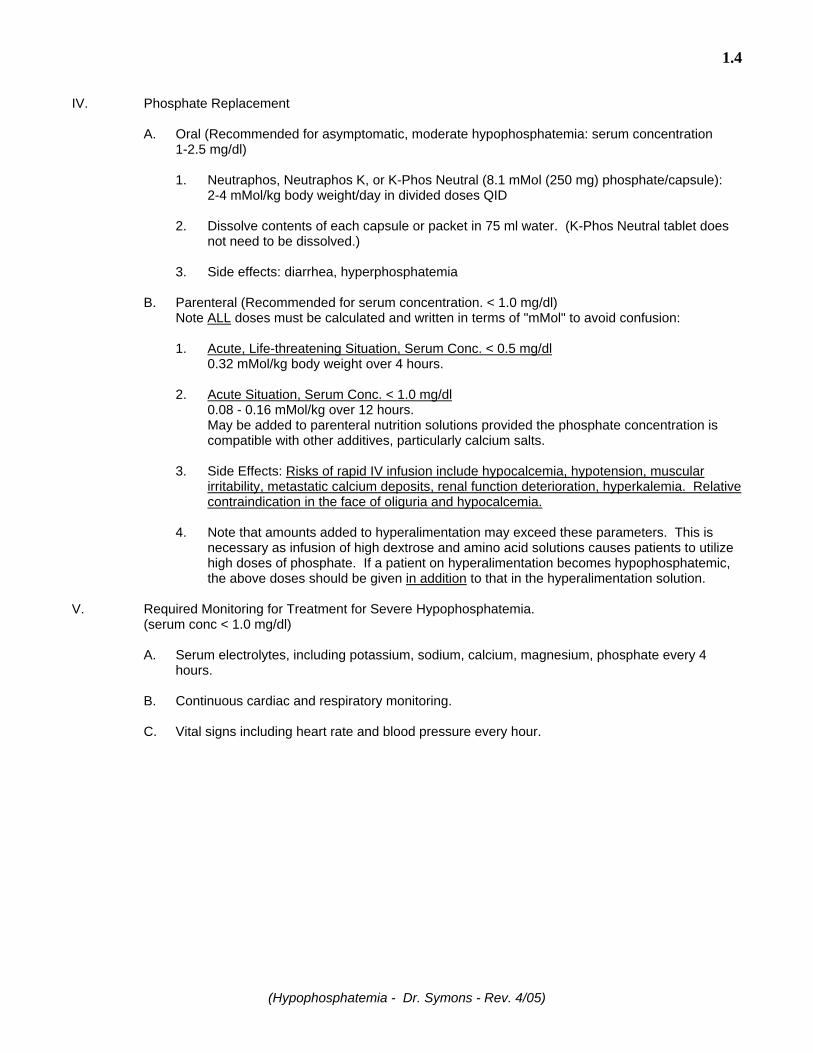
IV. Phosphate Replacement
A. Oral (Recommended for asymptomatic, moderate hypophosphatemia: serum concentration 1-2.5 mg/dl)
1. Neutraphos, Neutraphos K, or K-Phos Neutral (8.1 mMol (250 mg) phosphate/capsule): 2-4 mMol/kg body weight/day in divided doses QID
2. Dissolve contents of each capsule or packet in 75 ml water. (K-Phos Neutral tablet does
not need to be dissolved.)
3. Side effects: diarrhea, hyperphosphatemia
B. Parenteral (Recommended for serum concentration. < 1.0 mg/dl) Note ALL doses must be calculated and written in terms of "mMol" to avoid confusion:
1. Acute, Life-threatening Situation, Serum Conc. < 0.5 mg/dl
0.32 mMol/kg body weight over 4 hours.
2. Acute Situation, Serum Conc. < 1.0 mg/dl 0.08 - 0.16 mMol/kg over 12 hours. May be added to parenteral nutrition solutions provided the phosphate concentration is compatible with other additives, particularly calcium salts.
3. Side Effects: Risks of rapid IV infusion include hypocalcemia, hypotension, muscular
irritability, metastatic calcium deposits, renal function deterioration, hyperkalemia. Relative contraindication in the face of oliguria and hypocalcemia.
4. Note that amounts added to hyperalimentation may exceed these parameters. This is
necessary as infusion of high dextrose and amino acid solutions causes patients to utilize high doses of phosphate. If a patient on hyperalimentation becomes hypophosphatemic, the above doses should be given in addition to that in the hyperalimentation solution.
V. Required Monitoring for Treatment for Severe Hypophosphatemia.
(serum conc < 1.0 mg/dl)
A. Serum electrolytes, including potassium, sodium, calcium, magnesium, phosphate every 4 hours.
B. Continuous cardiac and respiratory monitoring.
C. Vital signs including heart rate and blood pressure every hour.

1.5
(Hypomagnesemia - Dr. Symons – Rev. 4/05)
HYPOMAGNESEMIA Ellis D. Avner, M.D. I. Basic Facts about Magnesium (1 mEq = 12 mg elemental)
A. Normal serum levels = 1.8-2.4 mg/dl (20% protein bound). B. GI absorption is inversely proportional to intake. Major sites of absorption are jejunum and
ileum (minor = colon). C. Renal handling is by GFR and tubular reabsorption (thick ascending limb > proximal tubule).
Factors which decrease excretion = PTH, ECF depletion, Mg depletion, hypocalcemia, hypothyroidism, metabolic alkalosis. Factors which increase excretion = ECF expansion, hypermagnesemia, hypercalcemia, metabolic acidosis, loop or osmotic diuretics, phosphate depletion, alcohol ingestion, toxins (i.e., cisplatin).
D. Normal daily requirement = 3-6 mg elemental Mg/kg/day. Normal dietary sources include green vegetables, seafood, grains, nuts, and meat.
II. Causes of Hypomagnesemia
A. Gastrointestinal: reduced intake, malabsorption. B. Renal: tubulo-interstitial disease, drug-induced (diuretics, aminoglycosides, chemotherapy,
cyclosporin). C. Endocrine: hypoparathyroidism, hyperthyroidism, diabetes mellitus, hyperaldosteronism. D. Redistribution: insulin therapy, rapid bone formation. E. Miscellaneous: excessive lactation or sweating, alcohol ingestion, pancreatitis, hypercalcemia,
phosphate depletion, volume expansion. III. Risks of Severe Hypomagnesemia (Serum levels < 1.0 mg/dl)
A. Neuromuscular: weakness, muscle fasciculation, tremors, tetany. B. CNS: anxiety, delirium, psychoses, seizures. C. Cardiac: prolong QT interval, ventricular arrhythmias. D. Electrolyte imbalance: hypocalcemia, hypokalemia.
IV. Treatment
A. Oral (Recommended whenever possible)
1. Protein-magnesium complex tablets (133 mg elemental) 2. Magnesium sulfate 50% IV Solution (given orally) 500 mg/ml
(1 ml= 48 mg elemental)
DOSE: 6-15 mg elemental Mg/kg/day divided Q.I.D. Diarrhea usually limits therapy, but in unusually resistant cases may push to 30 mg elemental Mg/kg/day if tolerated.
B. Parenteral (Hypotension, respiratory depression possible; calcium gluconate should be
available as antidote)
1. Magnesium sulfate solution 50% = 500 mg/ml (1 ml= 48 mg elemental)
DOSE: 25-50 mg magnesium sulfate/kg/dose q 4-6 h prn. (equals 3-6 mg elemental magnesium/kg/dose)

1.5
(Hypomagnesemia - Dr. Symons – Rev. 4/05)
(This page intentionally left blank.)
1.6 ENTERAL NUTRITION
Clinical Nutrition 1 Children’s Hospital & Regional Medical Center 3/03, revised 4/05
Susan Casey RD CD Kathy Hunt RD CD
Maura Sandrock MS RD CD Polly Lenssen MS RD CD
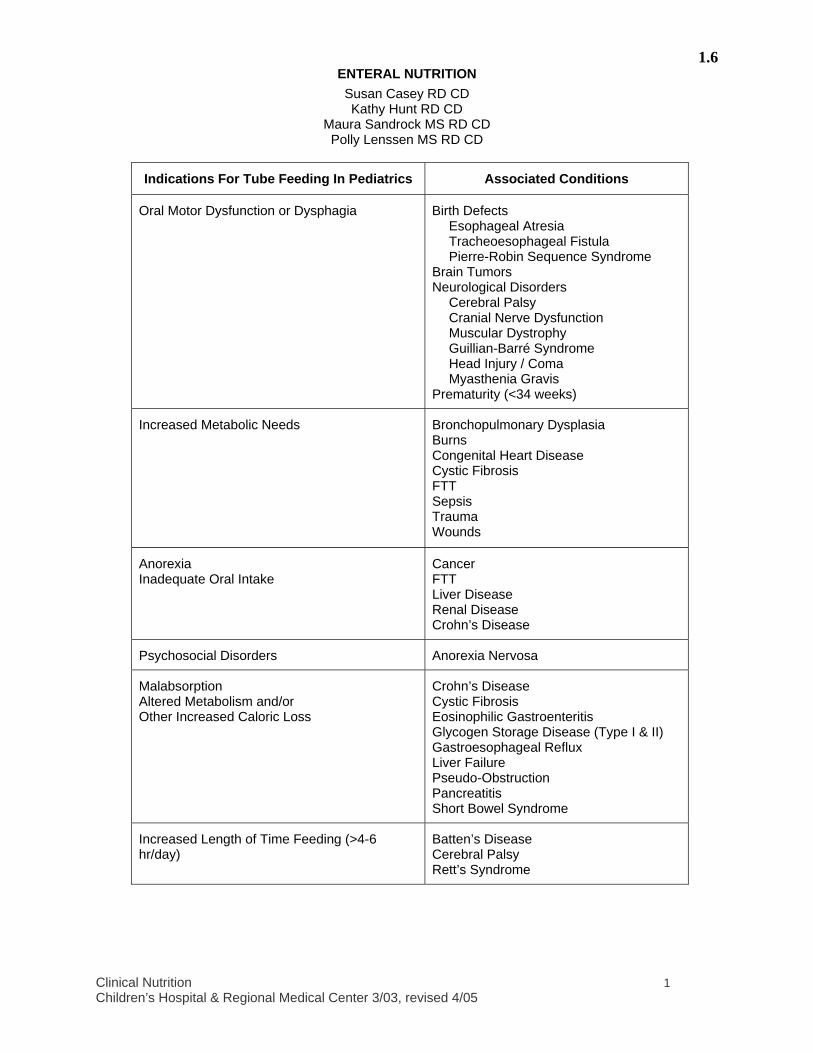
Indications For Tube Feeding In Pediatrics Associated Conditions
Oral Motor Dysfunction or Dysphagia Birth Defects Esophageal Atresia Tracheoesophageal Fistula Pierre-Robin Sequence Syndrome
Brain Tumors Neurological Disorders
Cerebral Palsy Cranial Nerve Dysfunction Muscular Dystrophy Guillian-Barré Syndrome Head Injury / Coma Myasthenia Gravis
Prematurity (<34 weeks)
Increased Metabolic Needs Bronchopulmonary Dysplasia Burns Congenital Heart Disease Cystic Fibrosis FTT Sepsis Trauma Wounds
Anorexia Inadequate Oral Intake
Cancer FTT Liver Disease Renal Disease Crohn’s Disease
Psychosocial Disorders Anorexia Nervosa
Malabsorption Altered Metabolism and/or Other Increased Caloric Loss
Crohn’s Disease Cystic Fibrosis Eosinophilic Gastroenteritis Glycogen Storage Disease (Type I & II) Gastroesophageal Reflux Liver Failure Pseudo-Obstruction Pancreatitis Short Bowel Syndrome
Increased Length of Time Feeding (>4-6 hr/day)
Batten’s Disease Cerebral Palsy Rett’s Syndrome

1.6 ENTERAL NUTRITION
Clinical Nutrition 2 Children’s Hospital & Regional Medical Center 3/03, revised 4/05
1. When to intervene with enteral nutrition: • Nutrient intake (energy, protein, fluid) are <75% estimated needs with concurrent weight loss • Child has failed trials of nutrient-dense oral supplements • Decrease in weight velocity (malnutrition) -- crosses 2 weight channels • Decrease in height velocity (stunting) -- <95 % of 50th percentile height for age • Diminished muscle and / or fat reserves (upper arm anthropometry < 5%ile) • Dysphasia resulting in NPO status • Therapies when expected outcome is anorexia, poor oral intake and malnutrition without nutrition
support (e.g., intensive cycles of chemotherapy)
2. How to determine nutrition goals: Order a Nutrition Consult. The dietitian will assess nutrition status, determine nutrient needs and provide tube feeding recommendations.
3. How to select a formula: see CIS - Formula Orders
CHILDREN’S HOSPITAL ENTERAL FORMULARY
Premature • Premature Formula: Enfamil Premature, Similac Special Care • Breast Milk + HMF (Human Milk Fortifier) • Post-Premature: Neosure
Infants • Breast Milk (can concentrate nutrient density with infant formulas and / or
modular products) • Standard Infant Formulas with Iron: Enfamil, Similac, Prosobee, Isomil • Hydrolyzed Protein: Pregestimil, Nutramigen, Alimentum • Elemental Formula: Pediatric Vivonex, Tolerex, Neocate Infant Formula
Children 1-10 years • Standard Pediatric Formulas: Enteral Pediasure, Enteral Pediasure with Fiber,
Compleat Pediatric • Semi-Elemental / Elemental Formulas: Peptamen Jr, Pediatric Vivonex,
Tolerex (This is an adult product occasionally used in children) Children >10 years
• Standard Adult Formulas: Osmolite 1 Cal, Isosource Standard • Fiber Formulas: Jevity 1 Cal, Compleat Modified, Fibersource Standard • Semi-Elemental / Elemental: Peptamen, Peptamen 1.5, Vivonex TEN • High Calorie: Deliver 2.0
Modular Products • Protein: Promod • Carbohydrate: Polycose • Fat: Microlipid • Carbohydrate + Fat: 80056, Duocal

1.6 ENTERAL NUTRITION
Clinical Nutrition 3 Children’s Hospital & Regional Medical Center 3/03, revised 4/05
4. How to select feeding tube and route:
Length of
Therapy
Route Tube type/size
Nasogastric
Nasoduodenal • Indicated if severe reflux, emesis • Feeds must be given as continuous drip
Infants 5-6 French Children and adolescents 6-8 French Corpak or Frederick Miller
Short Term
Nasojejunal • Placed by Interventional Radiology under flouroscopy
Frederick Miller
Gastrostomy – surgical placement • Order surgery consult for evaluation of tube placement • Requires 2 day admission or longer • Not generally used until 7 days after placement to
allow healing of tract; NG feeds required in interim • Surgery available to follow up with problems
Bard Button
Gastrostomy -- endoscopic placement (PEG) • Order GI consult for evaluation of tube placement • Requires 2 day admission • May be used within 24 hrs after placement • GI available to follow up with problems
PEG tube – may be changed to MicKey or Bard Button 12 weeks after placement; requires second OR procedure
Gastrostomy – Poke and dilate procedure • Schedule with Interventional Radiology • May be used within 24 hrs after placement • No follow up with tube problems
Ross Balloon tube – may be changed to Button G-tube 12 weeks after placement; second OR procedure not required
Long Term (> 3 mo)
Jejunostomy • Indicated if severe GE reflux, chronic vomiting • May be placed by Surgery or Interventional Radiology • G / J tube may be placed after G-tube site is healed
Frederick Miller
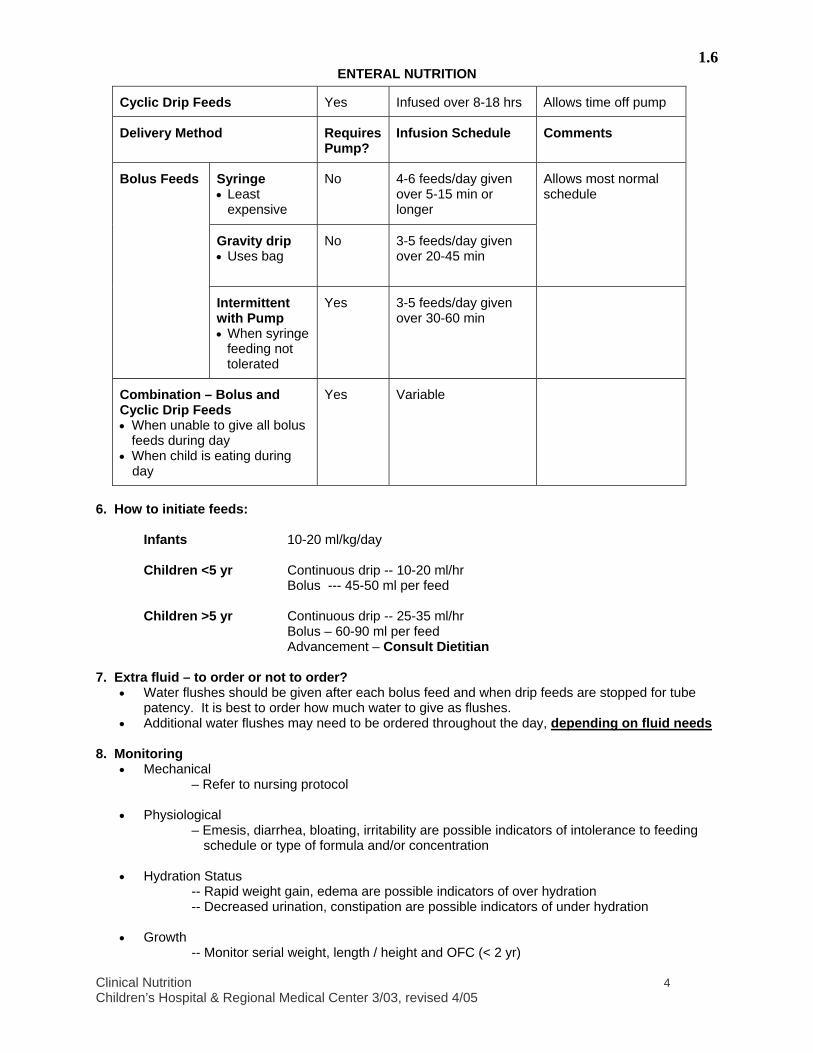
5. How to select delivery method for feeds:
Delivery method is selected based on the type of tube, quantity and concentration of formula, child’s tolerance to formula, and the child and parent’s schedule at home.
Delivery Method Requires Pump?
Infusion Schedule Comments
Continuous Drip Feeds • When initiating feeds • When other methods not
tolerated
Yes Infused at a prescribed rate over 24 hr
Difficult to use for active children as being hooked up to the pump limits activity
1.6 ENTERAL NUTRITION
Clinical Nutrition 4 Children’s Hospital & Regional Medical Center 3/03, revised 4/05
Cyclic Drip Feeds Yes Infused over 8-18 hrs Allows time off pump
Delivery Method Requires Pump?
Infusion Schedule Comments
Syringe • Least
expensive
No 4-6 feeds/day given over 5-15 min or longer
Gravity drip • Uses bag
No 3-5 feeds/day given over 20-45 min
Allows most normal schedule
Bolus Feeds
Intermittent with Pump • When syringe
feeding not tolerated
Yes 3-5 feeds/day given over 30-60 min
Combination – Bolus and Cyclic Drip Feeds • When unable to give all bolus
feeds during day • When child is eating during
day
Yes Variable
6. How to initiate feeds:
Infants 10-20 ml/kg/day
Children <5 yr Continuous drip -- 10-20 ml/hr Bolus --- 45-50 ml per feed
Children >5 yr Continuous drip -- 25-35 ml/hr Bolus – 60-90 ml per feed
Advancement – Consult Dietitian
7. Extra fluid – to order or not to order? • Water flushes should be given after each bolus feed and when drip feeds are stopped for tube
patency. It is best to order how much water to give as flushes. • Additional water flushes may need to be ordered throughout the day, depending on fluid needs
8. Monitoring
• Mechanical – Refer to nursing protocol
• Physiological – Emesis, diarrhea, bloating, irritability are possible indicators of intolerance to feeding
schedule or type of formula and/or concentration
• Hydration Status -- Rapid weight gain, edema are possible indicators of over hydration -- Decreased urination, constipation are possible indicators of under hydration
• Growth -- Monitor serial weight, length / height and OFC (< 2 yr)
1.6 ENTERAL NUTRITION
Clinical Nutrition 5 Children’s Hospital & Regional Medical Center 3/03, revised 4/05
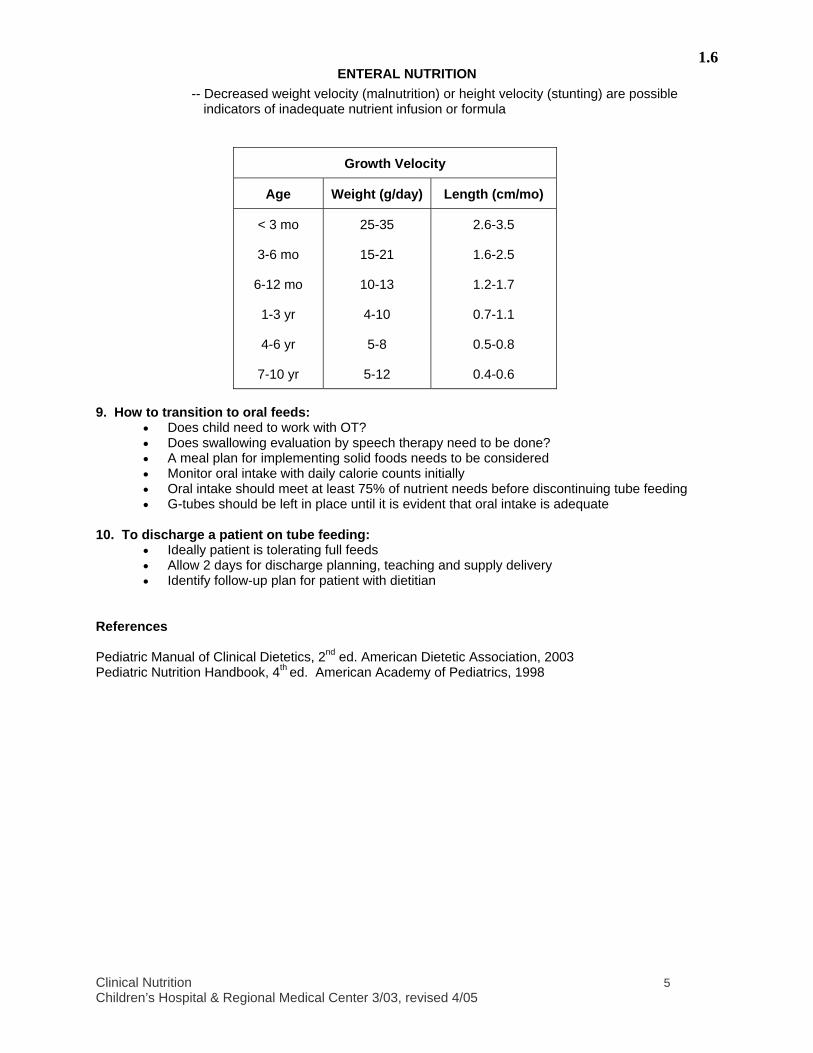
-- Decreased weight velocity (malnutrition) or height velocity (stunting) are possible indicators of inadequate nutrient infusion or formula
Growth Velocity
Age Weight (g/day) Length (cm/mo)
< 3 mo
3-6 mo
6-12 mo
1-3 yr
4-6 yr
7-10 yr
25-35
15-21
10-13
4-10
5-8
5-12
2.6-3.5
1.6-2.5
1.2-1.7
0.7-1.1
0.5-0.8
0.4-0.6
9. How to transition to oral feeds:
• Does child need to work with OT? • Does swallowing evaluation by speech therapy need to be done? • A meal plan for implementing solid foods needs to be considered • Monitor oral intake with daily calorie counts initially • Oral intake should meet at least 75% of nutrient needs before discontinuing tube feeding • G-tubes should be left in place until it is evident that oral intake is adequate
10. To discharge a patient on tube feeding:
• Ideally patient is tolerating full feeds • Allow 2 days for discharge planning, teaching and supply delivery • Identify follow-up plan for patient with dietitian
References Pediatric Manual of Clinical Dietetics, 2nd ed. American Dietetic Association, 2003 Pediatric Nutrition Handbook, 4th ed. American Academy of Pediatrics, 1998

1.6 ENTERAL NUTRITION
Clinical Nutrition 6 Children’s Hospital & Regional Medical Center 3/03, revised 4/05
(This page intentionally left blank.)

1.7 Children’s Hospital and Regional Medical Center
Guideline of Care PARENTERAL NUTRITION
Page 1 of 28
REVISED 4.05 Nutrition Committee
____________________________________________________________________________________ Related Guidelines and Policies: Infant Intensive Care Unit Nutrition Guidelines for Neonates
http://child/departments/iicu/documents/IICU-Nutrit-Guidelines%20rev%2011-18-00.doc SCCA TPN Guidelines for Hematopoetic Stem Cell Transplant Patients TPN Policy and Procedure
http://child/policies_procedures/clinical_services/documents/174-05.doc TPN Cycling Policy and Procedure
http://child/policies_procedures/clinical_services/documents/131-04.doc
I. Indications for TPN ...............................................................................................................................3
II. Nutrient Requirements ..........................................................................................................................3 A. Fluids...........................................................................................................................................3 B. Energy – Total.............................................................................................................................4 C. Fat ...............................................................................................................................................4 D. Carbohydrate ..............................................................................................................................5 E. Protein ........................................................................................................................................5
III. Electrolytes............................................................................................................................................5 A. Sodium .......................................................................................................................................6 B. Chloride (and Acid/Base Balance) ..............................................................................................8 C. Potassium ...................................................................................................................................9 D. Calcium .....................................................................................................................................11 E. Phosphorous.............................................................................................................................12 F. Magnesium ...............................................................................................................................14
IV. Vitamins ..............................................................................................................................................14
V. Trace Elements...................................................................................................................................15
VI. Special Additives.................................................................................................................................17 A. Iron ............................................................................................................................................17 B. Carnitine....................................................................................................................................17 C. Selenium ...................................................................................................................................17 D. Zinc ...........................................................................................................................................17 E. Insulin .......................................................................................................................................17
VII. Aluminum Content of PN Solutions..................................................................................................18
VIII. Cycling / Transitioning off TPN ........................................................................................................18
IX. Peripheral PN (PPN) ........................................................................................................................18
X. Monitoring Guidelines – Clinical, Laboratory ...................................................................................18
1.7
Page 2 of 28
XI. Complications...................................................................................................................................19 A. Mechanical, Infectious, Metabolic...........................................................................................19 B. Management of Metabolic Complications...............................................................................20 C. Fluid Overload -- Concentrating PN Volume ..........................................................................21
XII. Disease Specific Management.........................................................................................................22 A. End Stage Liver Disease ........................................................................................................22 B. Acute Renal Failure.................................................................................................................22 C. CRRT (Continuous Renal Replacement Therapy) and Hemodialysis....................................22
XIII. References .......................................................................................................................................23
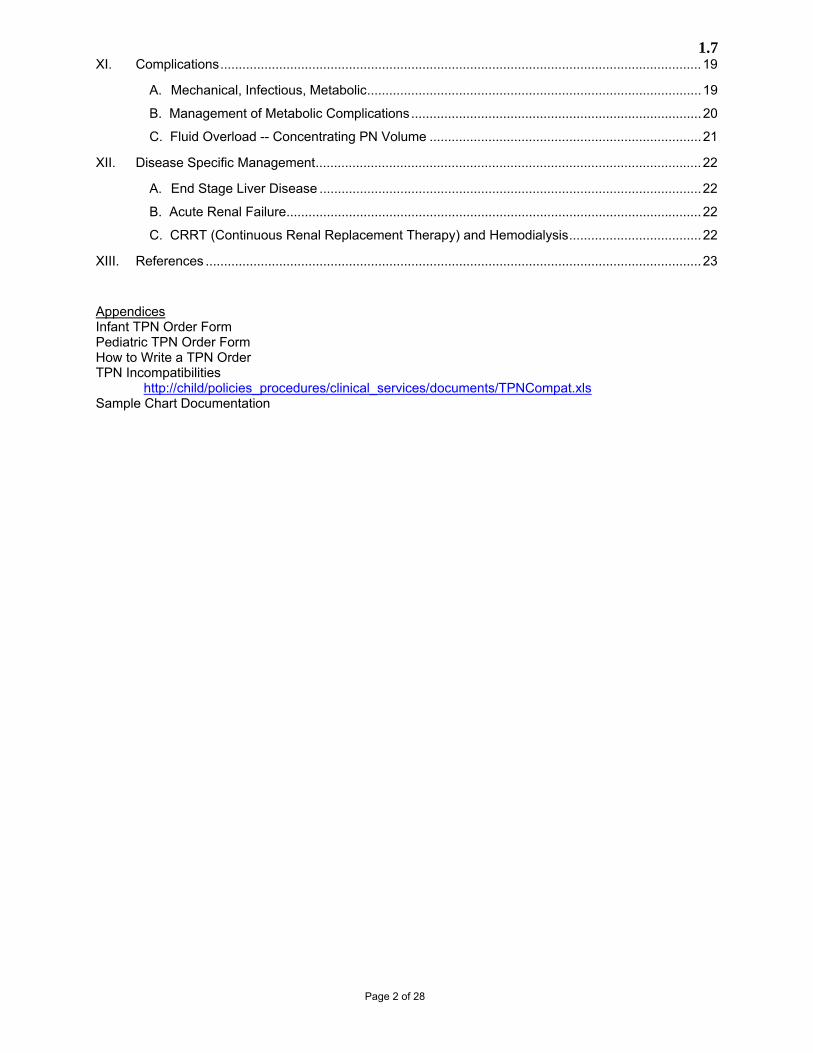
Appendices Infant TPN Order Form Pediatric TPN Order Form How to Write a TPN Order TPN Incompatibilities
http://child/policies_procedures/clinical_services/documents/TPNCompat.xls Sample Chart Documentation
1.7
Page 3 of 28
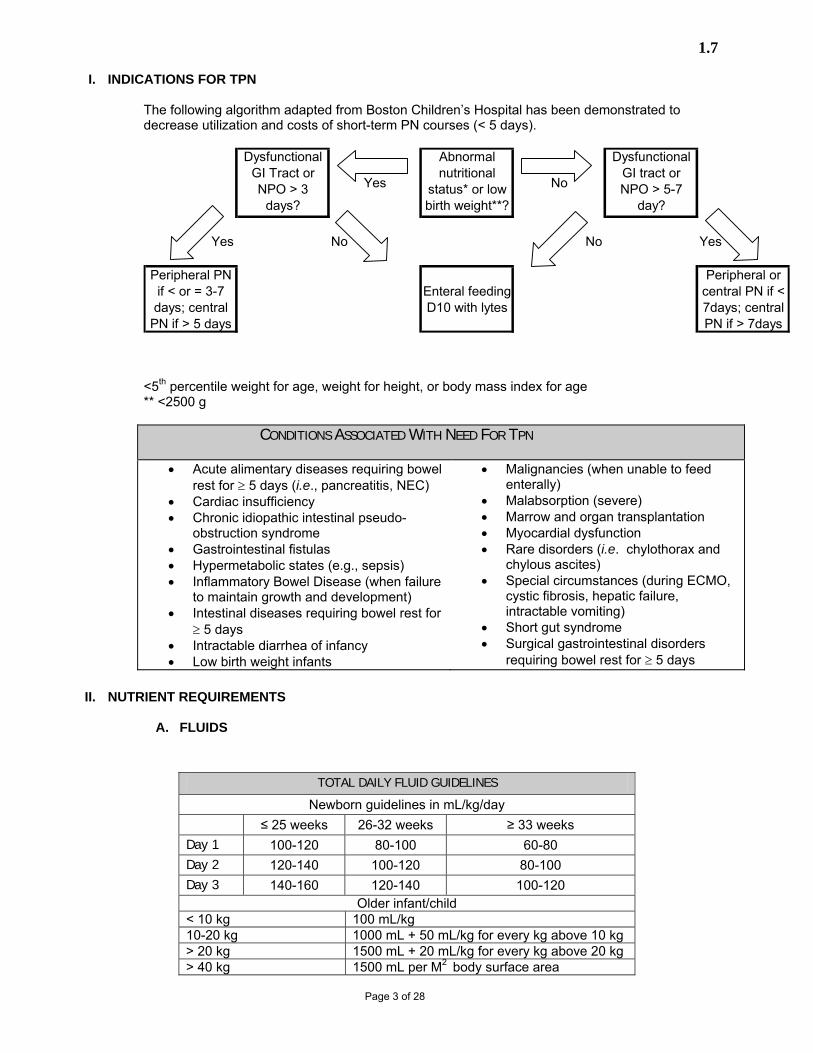
I. INDICATIONS FOR TPN
The following algorithm adapted from Boston Children’s Hospital has been demonstrated to decrease utilization and costs of short-term PN courses (< 5 days).
Dysfunctional GI Tract or NPO > 3
days?
Yes
Abnormal nutritional
status* or low birth weight**?
No
Dysfunctional GI tract or NPO > 5-7
day?
Yes No No Yes
Peripheral PN if < or = 3-7 days; central
PN if > 5 days
Enteral feeding D10 with lytes
Peripheral or central PN if < 7days; central PN if > 7days
<5th percentile weight for age, weight for height, or body mass index for age ** <2500 g
CONDITIONS ASSOCIATED WITH NEED FOR TPN
• Acute alimentary diseases requiring bowel
rest for ≥ 5 days (i.e., pancreatitis, NEC) • Cardiac insufficiency • Chronic idiopathic intestinal pseudo-
obstruction syndrome • Gastrointestinal fistulas • Hypermetabolic states (e.g., sepsis) • Inflammatory Bowel Disease (when failure
to maintain growth and development) • Intestinal diseases requiring bowel rest for
≥ 5 days • Intractable diarrhea of infancy • Low birth weight infants
• Malignancies (when unable to feed enterally)
• Malabsorption (severe) • Marrow and organ transplantation • Myocardial dysfunction • Rare disorders (i.e. chylothorax and
chylous ascites) • Special circumstances (during ECMO,
cystic fibrosis, hepatic failure, intractable vomiting)
• Short gut syndrome • Surgical gastrointestinal disorders
requiring bowel rest for ≥ 5 days
II. NUTRIENT REQUIREMENTS
A. FLUIDS
TOTAL DAILY FLUID GUIDELINES
Newborn guidelines in mL/kg/day ≤ 25 weeks 26-32 weeks ≥ 33 weeks Day 1 100-120 80-100 60-80 Day 2 120-140 100-120 80-100 Day 3 140-160 120-140 100-120
Older infant/child < 10 kg 100 mL/kg 10-20 kg 1000 mL + 50 mL/kg for every kg above 10 kg > 20 kg 1500 mL + 20 mL/kg for every kg above 20 kg > 40 kg 1500 mL per M2 body surface area

1.7
Page 4 of 28
B. ENERGY – TOTAL
Recommendations below are starting points. Factors that increase needs are high activity level, stress, wounds, catch up growth or repletion. Factors that decrease needs are bedrest and sedation. Indirect calorimetry measurements are available in the PICU.
AGE KCAL/KG/DAY
Preterm 80-120 Term 90-120
6-12 months 80-100 1-3 yr 80-110 4-6 yr 70-100 7-10 yr 60-80
Males 11-14 yr 45-60 15-18 yr 40-50 >18 yr 35-40
Females 11-14 yr 40-55 15-18 yr 30-45
.18 yr 30-35
C. FAT
Fat is used to supply approximately 30-40% of the total calories. The minimum amount of lipid required to prevent essential fatty acid deficiency is 4-8% of total energy. The maximum amount of lipid that should be used is 60% of total calories and/or typically 3 gm/kg.
Fat is available as a 20% emulsion that provides 2 kcal/mL (10% emulsions are not used at this institution because of the increased phospholipid content and inferior clearance compared to 20% emulsions. 30% emulsions are also not used since these are only used in compounding 3-in-1 solutions of fat, carbohydrate and amino acids.) The rate should not exceed 0.25 gm/kg/hr. Most patients will not exceed this rate as long as the lipids are given over 12 hours or more.
Advance daily as tolerated until the maximum rate or calories is achieved. Generally, fat emulsion rates are decreased or stopped once ~50% of the feeds are tolerated.
GM/KG/DAY IV LIPIDS
Preterm Term 6-12 month Toddlers Children Adolescents Begin at 0.5 0.5 1 1 1 1
Advance daily as tolerated
0.5 0.5 0.5 1 1 1
Goal 2 - 3 2.5 - 3 2.5 - 3 2-3 2-3 2
CONDITIONS THAT INCREASE FLUID NEEDS
CONDITIONS THAT DECREASE FLUID NEEDS
Temperature (fever, radiant warmers) Heart disease Phototherapy Renal oliguria Gastroschisis, Omphalocele Double-walled incubators Respiratory distress High humidity environments Hypermetabolism Warm humidified air via ETT Diarrhea Heat shields Single walled incubators Thermal blankets

1.7
Page 5 of 28
D. CARBOHYDRATE
Carbohydrate supplies about 40-50% of energy as anhydrous dextrose at 3.4 kcal/g. The doses below will ensure that hepatic clearance rates are not exceeded. Overfeeding of dextrose contributes to many of the complications of TPN including hyperglycemia, cholestasis, and fatty liver.
To conConvert mg/kg/min into total gm dextrose per day, Mg/kg/min x 1440 min/day divided by 1000 mg/g x 24 hr divided by wt in kg E.g., in a 20 kg 5 year old child with a starting goal of 6 mg/kg/min 6 mg x 20 kg/min x 1440 min/day divided by 1000 mg/g = 173 g
E. PROTEIN
Protein needs should be considered first when determining TPN prescription. Larger gains in protein accretion occur with increases in protein intake than with increases in energy intake, and thus patients with fluid restrictions, who can not receive adequate amounts of both energy and protein, should have protein needs prioritized.
Protein provides 4 kcal/g and is included in the calculation of total energy. Infants <12 months (and in bone marrow transplant <2 years) receive a pediatric amino acid formulation fortified with histidine, taurine and tyrosine with added cysteine. These amino acids are conditionally essential in infants on TPN and pediatric formulations are associated with a lower incidence of cholestatic liver disease. Cysteine may be added in older children to lower acidity and improve solubility of calcium and phosphate if needed.
G/KG/DAY PROTEIN
Preterm Term 6-12 month Toddlers Children Adolescents Begin at 2 2 2 1.5-2 1 -2.5 0.8-2.0 Advance daily as tolerated
1 1 1 1
Goal 4 2 - 3 2 - 2.5 1.5-3.0 1.0-2.5 0.8-2.0
III. ELECTROLYTES
ELECTROLYTE AND MINERAL REQUIREMENTS – QUICK OVERVIEW Preterm
mEq/kg/day Term
mEq/kg/day Toddlers/ Children
mEq/kg/day
Adolescents mEq/day
Sodium 3 – 4.5 2 – 4 2-4 60-100 Potassium 2 - 3 2 – 4 2-4 70-150 Chloride 2 - 3 2 – 4 2-4 60-150
Magnesium 0.35 - 0.6 0.25 – 1 0.25-0.5 10-30 Calcium 3 - 4.5 0.5 - 3 1 -2.5 10-30
mMol/kg/day mMol/kg/day mMol/kg/day mMol/kg/day Phosphorus 1.5 – 2.5 0.5 - 2 0.5-2.0 10-40
1 mMol KPhos = 1.5 mEq K+ 1 mMol NaPhos = 1.3 mEq Na+
Acetate -- no specific requirement; add as needed to maintain acid-base balance.
MG/KG/MIN DEXTROSE Preterm Term 6-12 month Toddlers Children Adolescents
Begin at 4 - 6 6 - 7 6 - 7 6-9 6-9 3-5 Advance daily as tolerated
2 2 2 1-2 1-2 1-2
Goal 8 to 12 12 to 14 12 to 14 15 10 5-7

1.7
Page 6 of 28
A. SODIUM
Serum sodium can only be correctly interpreted when examined in relation to fluid status and other clinical information (diagnosis, physical exam, intake and output, etc.) Total sodium content of the body is determined by renal sodium regulatory mechanisms, but the principle determinant of plasma sodium concentration is water metabolism. Plasma sodium reflects the relative proportions of sodium and water, not the absolute amount of sodium in the body.
Normal Sodium Requirements
Preterm Term/Children Adolescent
3-4.5 mEq/kg/day 2-4 mEq/kg/day 60-100 mEq/day
Reference Ranges for Sodium
Age Normal Levels (mEq/L)
Critical Levels (mEq/L)
Newborn 132 - 142 <115 or >160 Child and Adult 135 - 145 <115 or >160
CONTROL OF SODIUM AND FLUID METABOLISM Thirst Stimulated by changes in osmolality; associated with fluid depletion Renal Mechanisms Main site for water and electrolyte balance control Anti-diuretic hormone (ADH)
Prevents diuresis by increasing renal water reabsorption resulting in increased intravascular volume. Also a vasoconstrictor
Aldosterone Increases reabsorption of Na and secretion of K and H, resulting in increased water retention, volume expansion and decreased serum K; can be stimulated by decreased intravascular volume or hypokalemia
Natriuretic Hormone Stimulates Na diuresis
HYPONATREMIA NOTE: Low serum sodium does not equate to a body shortage of sodium, or an automatic addition of more sodium to the TPN. Fluid status requires assessment. Causes Treatment Isotonic Hyponatremia Usually mild hyponatremia 129-134 mEq/L Normal serum osmolality
When isotonic salt-poor solutions (D5W) are infused causing a dilutional effect in the intravascular space During hyperlipidemia or hyperproteinemia when fat or protein alter the ratio of sodium
No change in sodium
Hypertonic Hyponatremia Increased serum osmolality
When large, osmotically active molecules and hypertonic solutions cause water to shift from the intracellular to intravascular fluid space, diluting serum sodium, eg with marked hyperglycemia Note: serum sodium falls 1.6 mEq/L for each 100 mg/dL rise in glucose >180 mg/dL
No change in sodium

1.7
Page 7 of 28
HYPONATREMIA Hypotonic Hyponatremias: need to consider extracellular fluid volume Hypovolemic Hypotonic Hyponatremia “Classic dehydration” with increased BUN/serum creatinine
Loss of “salt-rich” fluid, sometimes followed by replacement with insufficient volume of “salt-poor” fluid – may be seen with diuretic therapy, new ileostomy
Usually need to replace fluid and sodium loss with saline and not try to correct with PN
Hypervolemic Hypotonic Hyponatremia “Third Spacing” or Edema
In advanced liver disease, nephrosis, and CHF when sodium and water are retained, but the disproportionate increase in total body water causes a “dilutional” hyponatremia
Usually PN dextrose and amino acids are concentrated in less volume as part of an overall plan to dose fluids conservatively; generally sodium in PN is not increased
“Isovolemic” Hypotonic Hyponatremia Edema not present yet
Inadequate sodium intake or an expanded fluid volume without clinical edema, most often in conjunction with impaired renal function, hypokalemia, SIADH (Syndrome of Inappropriate Anti-Diuretic Hormone when patients continue to secrete ADH even after consumption of large amounts of fluid)
If sodium intake is low, increase PN sodium
HYPERNATREMIA NOTE: High serum sodium is easier to evaluate than hyponatremia because it is always associated with increased osmolality. In general, hypernatremias are more related to volume depletion than the increased serum sodium concentration. Causes Treatment Hypovolemic Hypernatremia
Loss of hypotonic body fluid most typically in GI, renal, respiratory and adrenal disorders or with diuretics
Decreasing sodium in PN will not resolve hypernatremia associated with hypovolemia – hydration is required with hypotonic fluids (and/or stopping diuretic therapy). Sodium will be regulated by renal mechanisms once hypovolemia is corrected.
Hypervolemia Hypernatremia
Occurs when both sodium and water are retained due to:
Excess mineralocorticoid activity • endogenous (primary
aldosteronism, Cushings Syndrome)
• exogenous (steroids) Excess infusion of saline solutions
Decrease sodium; review appropriateness of PN volume in relation to total fluids – may need to be reduced (Patients often require diuretic therapy)
Isovolemic Hypernatremia
Excessive administration of sodium Clinically unapparent volume deficiency (such as with fevers or respiratory losses) Diuretic therapy
Review total sodium intake from all sources and if excessive, reduce PN sodium
1.7
Page 8 of 28
B. CHLORIDE
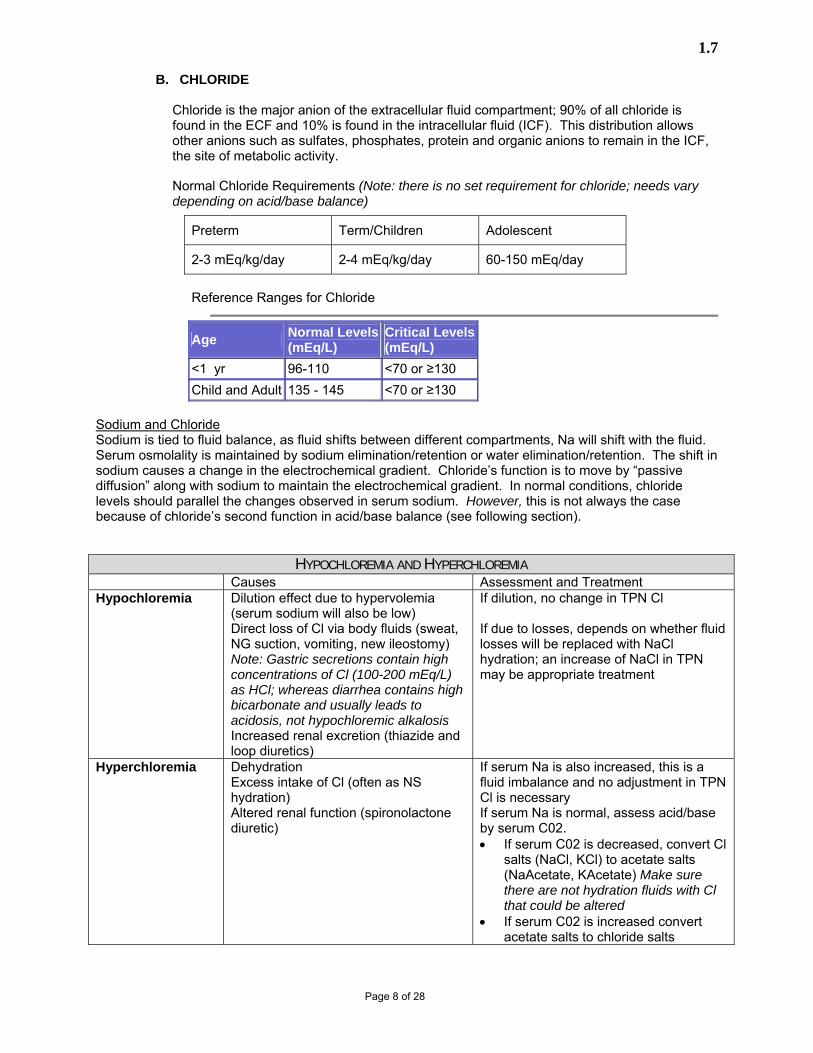
Chloride is the major anion of the extracellular fluid compartment; 90% of all chloride is found in the ECF and 10% is found in the intracellular fluid (ICF). This distribution allows other anions such as sulfates, phosphates, protein and organic anions to remain in the ICF, the site of metabolic activity.
Normal Chloride Requirements (Note: there is no set requirement for chloride; needs vary depending on acid/base balance)
Preterm Term/Children Adolescent
2-3 mEq/kg/day 2-4 mEq/kg/day 60-150 mEq/day
Reference Ranges for Chloride
Age Normal Levels(mEq/L)
Critical Levels(mEq/L)
<1 yr 96-110 <70 or ≥130 Child and Adult 135 - 145 <70 or ≥130
Sodium and Chloride Sodium is tied to fluid balance, as fluid shifts between different compartments, Na will shift with the fluid. Serum osmolality is maintained by sodium elimination/retention or water elimination/retention. The shift in sodium causes a change in the electrochemical gradient. Chloride’s function is to move by “passive diffusion” along with sodium to maintain the electrochemical gradient. In normal conditions, chloride levels should parallel the changes observed in serum sodium. However, this is not always the case because of chloride’s second function in acid/base balance (see following section).
HYPOCHLOREMIA AND HYPERCHLOREMIA Causes Assessment and Treatment
Hypochloremia Dilution effect due to hypervolemia (serum sodium will also be low) Direct loss of Cl via body fluids (sweat, NG suction, vomiting, new ileostomy) Note: Gastric secretions contain high concentrations of Cl (100-200 mEq/L) as HCl; whereas diarrhea contains high bicarbonate and usually leads to acidosis, not hypochloremic alkalosis Increased renal excretion (thiazide and loop diuretics)
If dilution, no change in TPN Cl If due to losses, depends on whether fluid losses will be replaced with NaCl hydration; an increase of NaCl in TPN may be appropriate treatment
Hyperchloremia Dehydration Excess intake of Cl (often as NS hydration) Altered renal function (spironolactone diuretic)
If serum Na is also increased, this is a fluid imbalance and no adjustment in TPN Cl is necessary If serum Na is normal, assess acid/base by serum C02. • If serum C02 is decreased, convert Cl
salts (NaCl, KCl) to acetate salts (NaAcetate, KAcetate) Make sure there are not hydration fluids with Cl that could be altered
• If serum C02 is increased convert acetate salts to chloride salts

1.7
Page 9 of 28
Acid/Base Balance: Serum Levels of Chloride and Bicarbonate (C02) Chloride plays a major role in acid/base balance by its relationship with bicarbonate (or CO2).* Chloride and bicarbonate, two anions, compete for the same route of elimination and absorption at the renal tubules. If the balance between these two anions is disturbed, either directly by loss of Cl or HCO3 or indirectly by a change in the acid-base status, then the acid-base balance is affected. Generally the kidneys will recover huge amounts of bicarbonate (up to 4500 mEq per day in an adult). Many disease states and drug therapies will affect the kidney function and have effects on the bicarbonate recovery/losses. In situations where the bicarbonate level is elevated the patient has a metabolic alkalosis, in situations where the bicarbonate level is low, the patient has a metabolic acidosis.
*Serum CO2 and Bicarbonate -- Total CO2 in the serum includes dissolved CO2, carbonic acid and bicarbonate. Bicarbonate contributes approximately 95% of the total CO2 value and therefore the serum level is generally referred to as bicarbonate. Reference Ranges for Carbon Dioxide -- Synonyms: Bicarbonate (HCO3) ;Blood CO2 (Carbon Dioxide)
Normal Levels(mEq/L)
Critical Levels(mEq/L)
All ages 18-27 <10 or ≥40
ACID BASE BALANCE (METABOLIC) Common Causes Treatment Metabolic Alkalosis
Excessive vomiting or NG suction Prolonged diuretic therapy (lasix) Hyperaldosteronism Excessive antacids CRRT with citrate anticoagulant.
Treat the underlying problem Replace volume and electrolyte losses. Replace potassium and maintain serum levels within normal range Ensure adequate chloride available.
Metabolic Acidosis Excessive accumulation of acids (lactic acidosis, DKA, ESRD) Excessive losses of bicarbonate (severe diarrhea, pancreatic fistula, renal tubular acidosis) Excessive chloride administration.
Correct underlying cause. May need IV/PO bicarbonate. Can provide acetate in PN (changed to bicarbonate in a functional liver). Consider IVF of Lactate Ringers (lactate is converted to bicarbonate in functional liver).
C. POTASSIUM
Potassium is the principle cation in the intracellular space. The high concentration gradient between the intracellular and extracellular fluid is maintained by active transport. Many mechanisms are utilized to ensure strict control of serum potassium level of 3.5-5.5 mEq/L. Unlike other electrolytes and minerals, serum potassium concentrations varies in direct relationship to body potassium stores.
Normal Potassium Requirements
Preterm Term/Children Adolescent
2-3 mEq/kg/day 2-4 mEq/kg/day 70-150 mEq/day
Reference Ranges for Potassium
Age Normal Levels (mEq/L)
Critical Levels (mEq/L)
Newborn 3.7 - 5.9 <3.0 or >6.5 2 Days - 3 Months 3.4 - 5.6 <3.0 or >6.0 Child and Adult 3.5 - 5.5 <3.0 or >6.0
1.7
Page 10 of 28
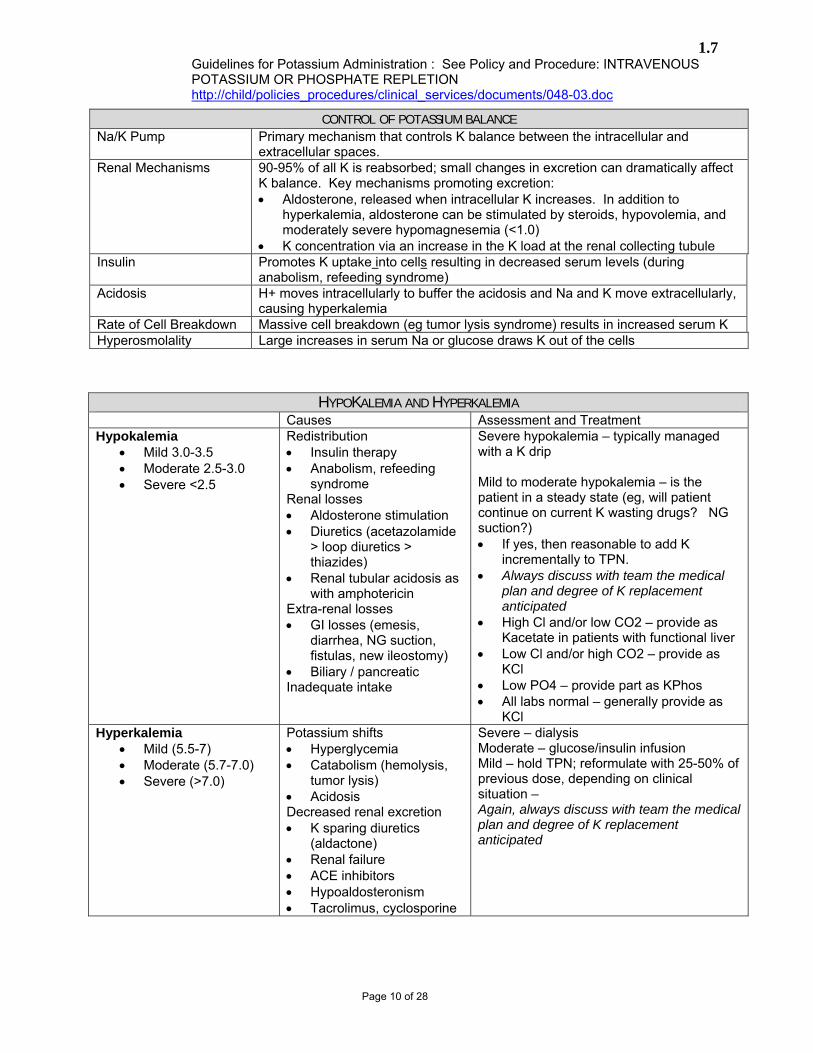
Guidelines for Potassium Administration : See Policy and Procedure: INTRAVENOUS POTASSIUM OR PHOSPHATE REPLETION http://child/policies_procedures/clinical_services/documents/048-03.doc
CONTROL OF POTASSIUM BALANCE Na/K Pump Primary mechanism that controls K balance between the intracellular and
extracellular spaces. Renal Mechanisms 90-95% of all K is reabsorbed; small changes in excretion can dramatically affect
K balance. Key mechanisms promoting excretion: • Aldosterone, released when intracellular K increases. In addition to
hyperkalemia, aldosterone can be stimulated by steroids, hypovolemia, and moderately severe hypomagnesemia (<1.0)
• K concentration via an increase in the K load at the renal collecting tubule Insulin Promotes K uptake into cells resulting in decreased serum levels (during
anabolism, refeeding syndrome) Acidosis H+ moves intracellularly to buffer the acidosis and Na and K move extracellularly,
causing hyperkalemia Rate of Cell Breakdown Massive cell breakdown (eg tumor lysis syndrome) results in increased serum K Hyperosmolality Large increases in serum Na or glucose draws K out of the cells
HYPOKALEMIA AND HYPERKALEMIA Causes Assessment and Treatment Hypokalemia
• Mild 3.0-3.5 • Moderate 2.5-3.0 • Severe <2.5
Redistribution • Insulin therapy • Anabolism, refeeding
syndrome Renal losses • Aldosterone stimulation • Diuretics (acetazolamide
> loop diuretics > thiazides)
• Renal tubular acidosis as with amphotericin
Extra-renal losses • GI losses (emesis,
diarrhea, NG suction, fistulas, new ileostomy)
• Biliary / pancreatic Inadequate intake
Severe hypokalemia – typically managed with a K drip Mild to moderate hypokalemia – is the patient in a steady state (eg, will patient continue on current K wasting drugs? NG suction?) • If yes, then reasonable to add K
incrementally to TPN. • Always discuss with team the medical
plan and degree of K replacement anticipated
• High Cl and/or low CO2 – provide as Kacetate in patients with functional liver
• Low Cl and/or high CO2 – provide as KCl
• Low PO4 – provide part as KPhos • All labs normal – generally provide as
KCl Hyperkalemia
• Mild (5.5-7) • Moderate (5.7-7.0) • Severe (>7.0)
Potassium shifts • Hyperglycemia • Catabolism (hemolysis,
tumor lysis) • Acidosis Decreased renal excretion • K sparing diuretics
(aldactone) • Renal failure • ACE inhibitors • Hypoaldosteronism • Tacrolimus, cyclosporine
Severe – dialysis Moderate – glucose/insulin infusion Mild – hold TPN; reformulate with 25-50% of previous dose, depending on clinical situation – Again, always discuss with team the medical plan and degree of K replacement anticipated

1.7
Page 11 of 28
D. CALCIUM
A little less than 1% of the body calcium is found in the blood; 50% of this is protein bound, primarily to albumin. Serum calcium levels measure “total” calcium, both free and protein bound. Only the free or ionized calcium is biologically active. If there is doubt as to calcium level, always check an ionized calcium.
Normal Calcium Requirements
Preterm Term Children Adolescent
3-4.5 mEq/kg/day 0.5-3 mEq/kg/day 1-2.5 mEq/kg/day 10-30 mEq/day
Reference Ranges for Calcium
Age Normal Levels(mg/dL)
Critical Levels(mg/dL)
Premature Newborn 6.5 - 9.5 Full Term Newborn 7.5 - 11.0 Child and Adult 8.7 - 10.7
<6.0 & >14.0
Correction of serum calcium for hypoalbuminemia
[(4.0 g/dL– serum albumin) x 0.8] + serum Ca+2 = corrected serum Ca+2
This equation is an estimate and may be inaccurate in patients with:
Acidosis – ionized Ca+2 increased; protein binding decreased Alkalosis – ionized Ca+2 decreased; protein binding increased
Ionized Calcium
Age mMol/L
<1 Year 1.16 - 1.45
1 - 4 Years 1.17 - 1.35
4 - 14 Years 1.18 - 1.30
Adult 1.18 - 1.27
Critical, low < or = 0.75
Critical, high > 1.75
CONTROL OF CALCIUM BALANCE PTH (parathyroid hormone) Stimulated by low serum “free” Ca+2; PTH acts at the bone to stimulate
resorption of Ca+2 and PO4- and at the kidney to increase resorption of Ca+2 and decrease PO4- resorption.
Vitamin D Stimulated by PTH; vitamin D acts at the GI tract to stimulate absorption of Ca+2 and Phos and at the bone to release Ca+2 and PO4-
Calcitonin Inhibits bone resorption and decreases serum Ca; also stimulates renal excretion of Ca+2 and PO4-
Calcium / Magnesium Relationship
In severe hypomagnesemia (<1.0), PTH production is stopped resulting in decreased serum Ca+2. Ca+2 will not return to normal until Mg level corrected
1.7
Page 12 of 28
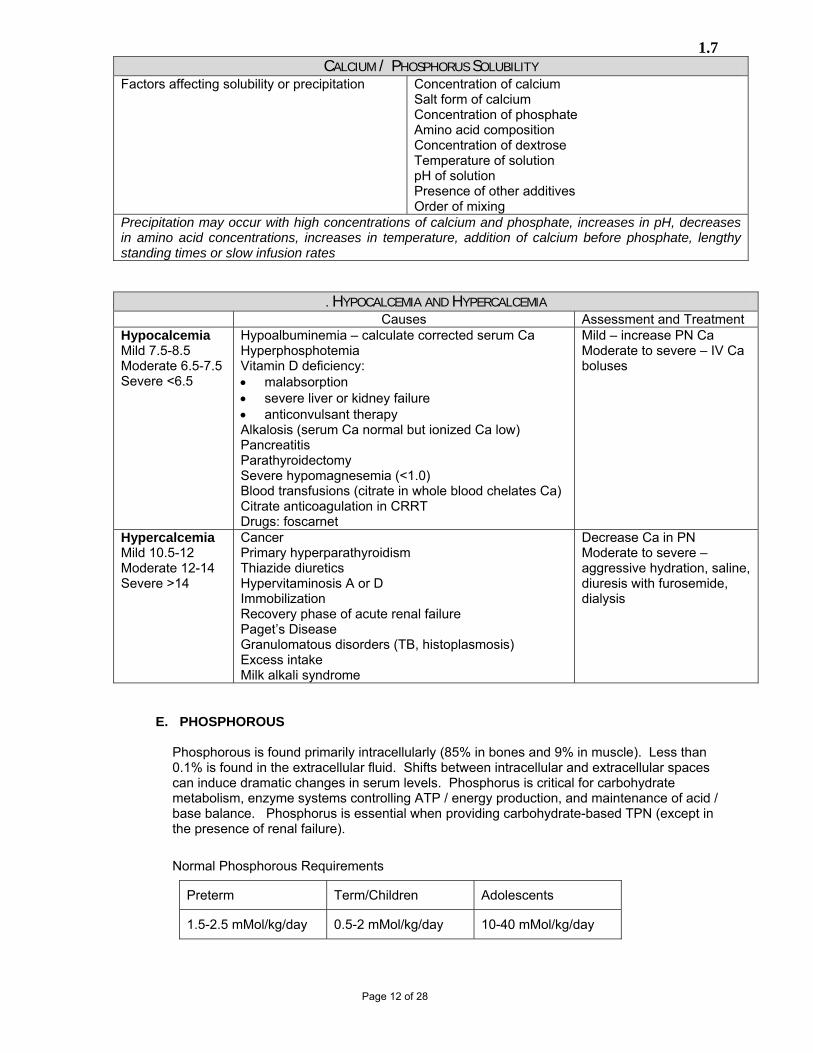
CALCIUM / PHOSPHORUS SOLUBILITY Factors affecting solubility or precipitation
Concentration of calcium Salt form of calcium Concentration of phosphate Amino acid composition Concentration of dextrose Temperature of solution pH of solution Presence of other additives Order of mixing
Precipitation may occur with high concentrations of calcium and phosphate, increases in pH, decreases in amino acid concentrations, increases in temperature, addition of calcium before phosphate, lengthy standing times or slow infusion rates
. HYPOCALCEMIA AND HYPERCALCEMIA Causes Assessment and Treatment Hypocalcemia Mild 7.5-8.5 Moderate 6.5-7.5 Severe <6.5
Hypoalbuminemia – calculate corrected serum Ca Hyperphosphotemia Vitamin D deficiency: • malabsorption • severe liver or kidney failure • anticonvulsant therapy Alkalosis (serum Ca normal but ionized Ca low) Pancreatitis Parathyroidectomy Severe hypomagnesemia (<1.0) Blood transfusions (citrate in whole blood chelates Ca) Citrate anticoagulation in CRRT Drugs: foscarnet
Mild – increase PN Ca Moderate to severe – IV Ca boluses
Hypercalcemia Mild 10.5-12 Moderate 12-14 Severe >14
Cancer Primary hyperparathyroidism Thiazide diuretics Hypervitaminosis A or D Immobilization Recovery phase of acute renal failure Paget’s Disease Granulomatous disorders (TB, histoplasmosis) Excess intake Milk alkali syndrome
Decrease Ca in PN Moderate to severe – aggressive hydration, saline, diuresis with furosemide, dialysis
E. PHOSPHOROUS
Phosphorous is found primarily intracellularly (85% in bones and 9% in muscle). Less than 0.1% is found in the extracellular fluid. Shifts between intracellular and extracellular spaces can induce dramatic changes in serum levels. Phosphorus is critical for carbohydrate metabolism, enzyme systems controlling ATP / energy production, and maintenance of acid / base balance. Phosphorus is essential when providing carbohydrate-based TPN (except in the presence of renal failure).
Normal Phosphorous Requirements
Preterm Term/Children Adolescents
1.5-2.5 mMol/kg/day 0.5-2 mMol/kg/day 10-40 mMol/kg/day

1.7
Page 13 of 28
Reference Ranges for Phosphorous
mg/dL
0 - 7 days 4.6 - 8.0
1 week - 3 years 3.9 - 6.5
4 - 6 years 4.0 - 5.4
7 - 11 years 3.7 - 5.6
12 - 13 years 3.3 - 5.4
14 - 15 years 2.9 - 5.4
16 - 60 years 2.8 - 4.6
Potassium Phosphate 1 mL = 3 mMol phosphate = 285 mg phosphate 1mL = 4.4 mEq potassium = 170 mg potassium 1 mEq = 0.682 mM = 21 mg phosphate 1 mM = 1.33 mEq = 31 mg phosphate Sodium Phosphate 1 mL = 3 mMol phosphorus = 93 mg 1 mL = 4 mEq sodium = 92 mg 1 mEq = 0.75 mM = 23.25 mg phosphate 1 mM = 1.33 mEq = 31 mg phosphate
Phosphorus content 20% lipids = 0.022 mEq/mL (47 mg/100 mL or 1.5 mMol/100 mL)
CONTROL OF PHOSPHATE BALANCE
Cellular Anabolism Utilization increased during feeding (especially if undernourished). Renal Mechanisms Excretion controlled by:
• PTH (decrease serum levels) • Vitamin D (increased serum levels) • Calcitonin (decreased serum levels)
HYPOPHOSPHATEMIA AND HYPERPHOSPHATEMIA
Note: Phosphate excretion is circadian; levels will be highest in early morning and lowest in early evening. Pay attention to time of blood draw and trends Causes Assessment and Treatment Hypophosphatemia Adolescents: Moderate 1.0-2.5 Severe <1.0
Redistribution • Glucose / Insulin therapy • Anabolism “refeeding syndrome” • Alkalosis Renal losses Extra-renal losses • GI losses (emesis, diarrhea,
steatorrhea) • Ingestion phosphate binding agents • Inadequate intake
Moderate: Increase PN PO4 by 1/3-2/3 of current dose Severe: IV bolus
Hyperphosphatemia Adolescents Mild: 4.6-5.6 Moderate: 5.6-6.5 Moderately severe: 6.5-8.0 Severe: >8.0
Renal failure (chronic and acute) Tumor lysis Hypoparathyroidism Excess intake Catabolism
Mild: if not an isolated value or risk factors present, decrease PN PO4 Moderate: if level consistent with clinical picture, remove PN PO4 (or if large doses in PN, decrease by significant %) Moderately severe to severe: Remove PN PO4

1.7
Page 14 of 28
F. MAGNESIUM
About 50% of magnesium is located in bone tissue; the rest is intracellular. Only about 1% is found in the serum. About 1/3 of this protein-bound.
Normal Magnesium Requirements
Preterm Term Children Adolescents
0.35-0.6 mEq/kg/day 0.25-1 mEq/kg/day 0.25-0.5 mEq/kg/day 10-30 mEq/day
Reference Ranges for Magnesium
Age Normal Levels(mg/dL)
Critical Levels(mg/dL)
All ages 1.8 – 2.4 <1.0 & >5.0
Effects on serum levels:
Albumin - There are no widely accepted equations to correct Mg levels for low serum albumin. Serum Mg will be depressed slightly especially with serum albumin <2.5 gm/dL Acidosis – protein-binding decreased so ionized “free” Mg levels increase Alkalosis – protein-binding increased so ionized “free” Mg levels decrease
HYPOMAGNESEMIA AND HYPERMAGNESEMIA
Note: serum levels correlate only loosely with total body levels; a deficit or excess in the extracellular (serum) compartment may not represent the intracellular level. Causes Assessment and Treatment Hypomagnesemia Mild 1.3-1.7 Moderate 1.0-1.3 Severe <1.0
Inadequate supplementation Medications: • Cyclosporine • Tacrolimus • Amphotericin • Foscarnet • Cisplatinum • Furosemide Diarrhea, malabsorption Endocrine disorders Aldosteronism SIADH Ketoacidosis Alcoholism
Mild to moderate: increase PN Mg 25-50% -- note it takes 2-3 days to see the full effect of any change in Mg dose Severe: IV boluses; consult with pharmacist and physician as to implications for PN dose
Hypermagnesemia Mild-moderate 2.4-5.0 Severe >5.0
Renal failure (chronic and acute)
Mild-moderate: remove PN Mg (or if large doses in PN, remove a large %) Severe: remove PN Mg
IV. VITAMINS
There are never any circumstances to exclude B vitamins from TPN. In renal failure fat-soluble vitamins can accumulate and may be restricted. Vitamins are provided by age and weight using a pediatric formulation under 11 years old and an adult vitamin for patients 11 years and older.
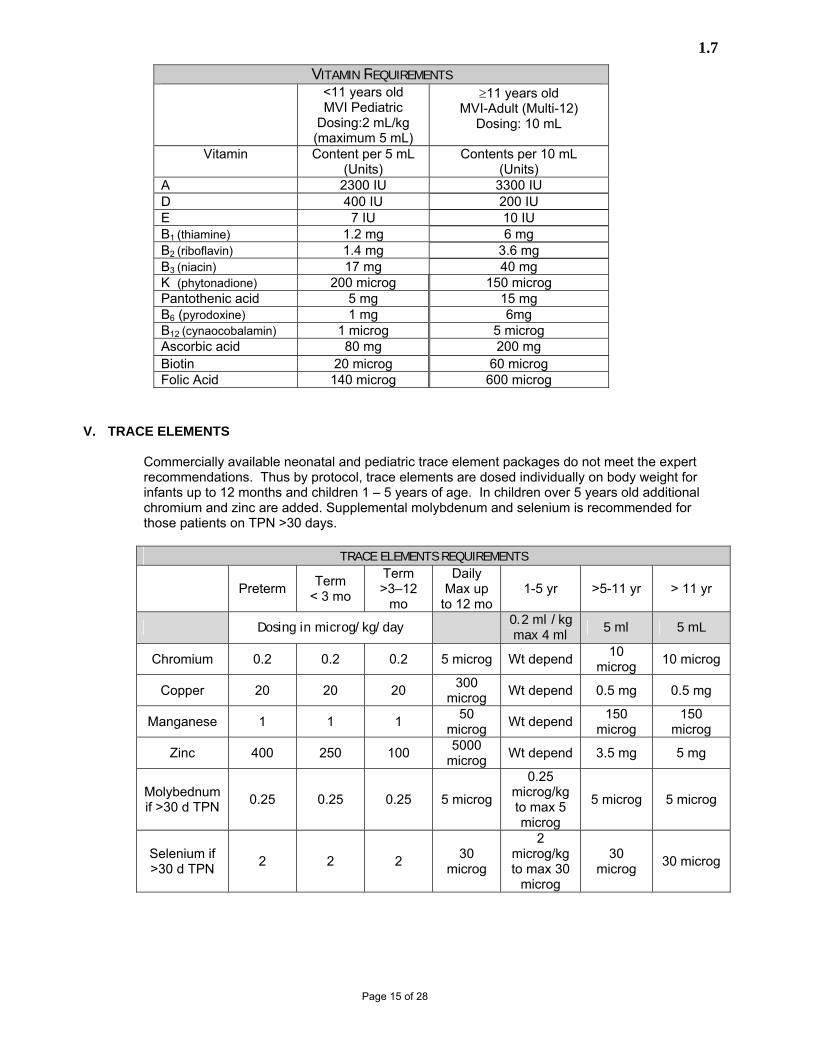
1.7
Page 15 of 28
V. TRACE ELEMENTS
Commercially available neonatal and pediatric trace element packages do not meet the expert recommendations. Thus by protocol, trace elements are dosed individually on body weight for infants up to 12 months and children 1 – 5 years of age. In children over 5 years old additional chromium and zinc are added. Supplemental molybdenum and selenium is recommended for those patients on TPN >30 days.
TRACE ELEMENTS REQUIREMENTS
Preterm Term < 3 mo
Term >3–12
mo
Daily Max up
to 12 mo 1-5 yr >5-11 yr > 11 yr
Dosing in microg/kg/day 0.2 ml /kg max 4 ml 5 ml 5 mL
Chromium 0.2 0.2 0.2 5 microg Wt depend 10 microg 10 microg
Copper 20 20 20 300 microg Wt depend 0.5 mg 0.5 mg
Manganese 1 1 1 50 microg Wt depend 150
microg 150
microg
Zinc 400 250 100 5000 microg Wt depend 3.5 mg 5 mg
Molybednum if >30 d TPN 0.25 0.25 0.25 5 microg
0.25 microg/kg to max 5 microg
5 microg 5 microg
Selenium if >30 d TPN 2 2 2 30
microg
2 microg/kg to max 30
microg
30 microg 30 microg
VITAMIN REQUIREMENTS <11 years old
MVI Pediatric Dosing:2 mL/kg (maximum 5 mL)
≥11 years old MVI-Adult (Multi-12)
Dosing: 10 mL
Vitamin Content per 5 mL (Units)
Contents per 10 mL (Units)
A 2300 IU 3300 IU D 400 IU 200 IU E 7 IU 10 IU B1 (thiamine) 1.2 mg 6 mg B2 (riboflavin) 1.4 mg 3.6 mg B3 (niacin) 17 mg 40 mg K (phytonadione) 200 microg 150 microg Pantothenic acid 5 mg 15 mg B6 (pyrodoxine) 1 mg 6mg B12 (cynaocobalamin) 1 microg 5 microg Ascorbic acid 80 mg 200 mg Biotin 20 microg 60 microg Folic Acid 140 microg 600 microg

1.7
Page 16 of 28
TRACE ELEMENTS DEFICIENCY AND TOXICITY SIGNS AND SYMPTOMS
Trace Element / Function Reference Range Deficiency Toxicity Zinc Part of >200 metalloenzymes Protein synthesis and catabolism Nucleic acid and heme synthesis DNA and RNA polymerases Immune function Bone mineralization
uG/dL: Child 78-150 Adult 60-130
Growth retardation Skin rash Alopeica Diarrhea Immune defects Decrease transport protein Decreased alkaline phophatase
No reported cases TPN
Copper Copper containing oxidative enzymes, superoxide dismutase and cytochrome oxidase. Ferroxidase /ceruloplasm involved with oxidation of ferrous iron; also involved with transfer of iron to sites for heme synthesis. Amine oxidases, monoamine oxidase, diamine oxidase and lysyl oxidase
uG/dL: Birth-6 mo 20-70 6 mo-6 yr 90-190 7-12 yr 80-160 Male ≥ 13 yr 70-140 Female ≥ 13 yr 80-155
Decreased pigmentation in hair and skin Poor growth Neutropenia Hypochromic anemia Osteoporosis and fractures
Acute toxicity is rare Chronic excessive intake and and/or decreased losses (cholestasis)
Selenium Part of glutathione peroxidase
95 - 165 nG/mL When omitted from long term TPN: Pearl white nails Muscle weakness
Changes in morphology of fingernails, garlic odor to the breath, fatigue, abdominal pain
Manganese Metalloenzyme: kinase, decarboxylase, transferase and hydrolases Activates glycosyl transferase for mucopolysaccaride synthesis Pyruvate dehydrogenase a gluconeogenic enzyme
Adult 0.40 - 0.85 nG/mL (no values established for children)
Not reported in humans Need to monitor levels in omitting manganese from TPN due to cholestasis
Potential toxicity with cholestasis Reports of manganese lesion in brain of a child in liver failure and HSCT patients consistent in the latter with Parkinson-like symptoms
Chromium Glucose tolerance factor which helps form a complex between insulin and insulin receptors
<0.3 uG/L Weight loss Hyperglycemia Hypertriglyceridemia High insulin requirements Peripheral neuropathy Deficiency reported when omitted during long term TPN in adults.
Dose may need to adjusted for patients with renal failure
Molybdenum Xanthine oxidase: an enzyme in the terminal oxidation of purines to uric acid Sulfite oxidase: an enzyme necessary for the excretion of sulfur
0.1-3 uG/L
Tachycardia Tachypnea Headache Nightblindess Nausea, vomiting Increased methionine levels Decreased uric acid levels Deficiency reported when omitted during long term TPN in adults.
No reported cases

1.7
Page 17 of 28
VI. SPECIAL ADDITIVES
A. IRON
Patients on TPN do not generally need IV iron because most patients have adequate reserves. Exceptions include premature and low birth weight infants receiving TPN and erythropoietin without any enteral iron. Infants on TPN with EPO should receive iron in TPN dosed at 1 mg/kg/day. Literature suggests doses in the range of 1-3 mg/kg/day although some authors believe that 2 mg/kg/day is excessive.
B. CARNITINE
Carnitine has been added to TPN in premature and other infants as well as patients on long-term TPN who are NPO without a source of carnitine in their diet. Blood levels of carnitine have been found to be low in many of these patients. It has been used for improving lipid tolerance, ketogenesis, weight gain, and hypoglycemia. A survey of neonatologists suggested that 28% of neonates receive carnitine supplemented TPN, only 2% were actually assessed for carnitine deficiency. A Cochrane review did not demonstrate any evidence of benefit from parenteral carnitine supplementation on lipid tolerance, ketogenesis or weight gain for neonates requiring parenteral nutrition. Studies suggest that children can receive carnitine free TPN for many years and have low carnitine levels without showing any adverse effects of the low carnitine.
C. SELENIUM
Selenium is required to normal growth, brain development and metamorphosis. Animal studies link selenium deficiency with oxygen induced lung damage. In very preterm infants, low concentrations have been associated with an increased risk of chronic neonatal lung disease and retinopathy of prematurity. A Cochrane review in 2003 concluded that selenium supplementation in preterm infants was not associated with improved survival, a reduction in neonatal chronic lung disease or retinopathy of prematurity, although no adverse effects were reported. A benefit in terms of reduction in one or more episodes of sepsis was seen only in infants exposed to a full or partial course of antenatal steroids. However, selenium is an essential trace element, and it is advisable to avoid the lower than physiological levels seen in preterm infants. Also, circulating levels of selenium decline rapidly in patients receiving parenteral nutrition with insufficient or no selenium. The current recommended dose for preterm infants, term infants and children is 2 microg/kg/day, not to exceed 30 microg/day.
D. ZINC
Supplemental zinc (in addition to standard amounts0 should be added to compensate for large stool or fistula losses. (17 mg of zinc per liter of stool and 12 mg of zinc per liter of fistula losses). These doses come from adult guidelines. When using these doses in children, it is recommended that levels be monitored more frequently. See HSCT guidelines for zinc replacement with diarrhea due to GVHD or severe conditioning toxicity.
E. INSULIN
Numerous studies have demonstrated decreased insulin availability from a variety of IV solutions due to adsorptive losses to delivery systems. As of February 2005, PN solutions at CHRMC are supplied in bags made of “chemically inert, medical grade ethylene vinyl acetate (EVA).” There are very few published studies looking at insulin adsorption losses from EVA bags. The limited available data suggest 10-80%
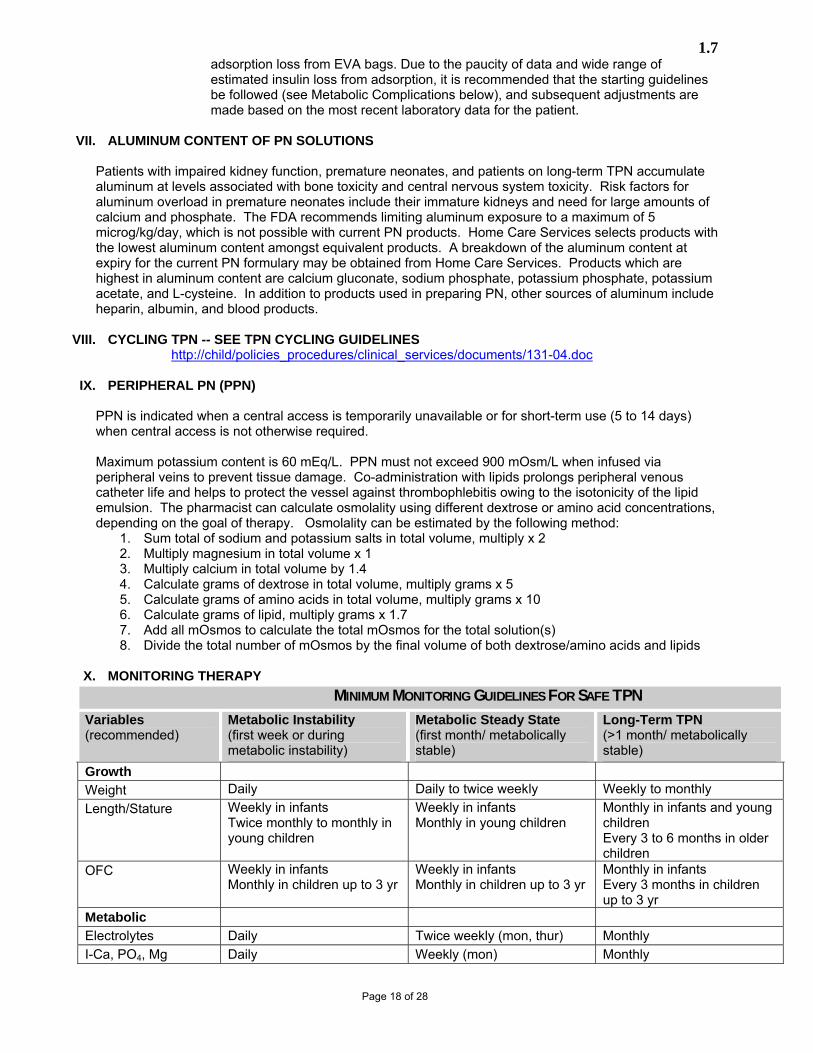
1.7
Page 18 of 28
adsorption loss from EVA bags. Due to the paucity of data and wide range of estimated insulin loss from adsorption, it is recommended that the starting guidelines be followed (see Metabolic Complications below), and subsequent adjustments are made based on the most recent laboratory data for the patient.
VII. ALUMINUM CONTENT OF PN SOLUTIONS Patients with impaired kidney function, premature neonates, and patients on long-term TPN accumulate aluminum at levels associated with bone toxicity and central nervous system toxicity. Risk factors for aluminum overload in premature neonates include their immature kidneys and need for large amounts of calcium and phosphate. The FDA recommends limiting aluminum exposure to a maximum of 5 microg/kg/day, which is not possible with current PN products. Home Care Services selects products with the lowest aluminum content amongst equivalent products. A breakdown of the aluminum content at expiry for the current PN formulary may be obtained from Home Care Services. Products which are highest in aluminum content are calcium gluconate, sodium phosphate, potassium phosphate, potassium acetate, and L-cysteine. In addition to products used in preparing PN, other sources of aluminum include heparin, albumin, and blood products.
VIII. CYCLING TPN -- SEE TPN CYCLING GUIDELINES
http://child/policies_procedures/clinical_services/documents/131-04.doc
IX. PERIPHERAL PN (PPN) PPN is indicated when a central access is temporarily unavailable or for short-term use (5 to 14 days) when central access is not otherwise required.
Maximum potassium content is 60 mEq/L. PPN must not exceed 900 mOsm/L when infused via peripheral veins to prevent tissue damage. Co-administration with lipids prolongs peripheral venous catheter life and helps to protect the vessel against thrombophlebitis owing to the isotonicity of the lipid emulsion. The pharmacist can calculate osmolality using different dextrose or amino acid concentrations, depending on the goal of therapy. Osmolality can be estimated by the following method:
1. Sum total of sodium and potassium salts in total volume, multiply x 2 2. Multiply magnesium in total volume x 1 3. Multiply calcium in total volume by 1.4 4. Calculate grams of dextrose in total volume, multiply grams x 5 5. Calculate grams of amino acids in total volume, multiply grams x 10 6. Calculate grams of lipid, multiply grams x 1.7 7. Add all mOsmos to calculate the total mOsmos for the total solution(s) 8. Divide the total number of mOsmos by the final volume of both dextrose/amino acids and lipids
X. MONITORING THERAPY
MINIMUM MONITORING GUIDELINES FOR SAFE TPN Variables (recommended)
Metabolic Instability (first week or during metabolic instability)
Metabolic Steady State (first month/ metabolically stable)
Long-Term TPN (>1 month/ metabolically stable)
Growth Weight Daily Daily to twice weekly Weekly to monthly Length/Stature Weekly in infants
Twice monthly to monthly in young children
Weekly in infants Monthly in young children
Monthly in infants and young children Every 3 to 6 months in older children
OFC Weekly in infants Monthly in children up to 3 yr
Weekly in infants Monthly in children up to 3 yr
Monthly in infants Every 3 months in children up to 3 yr
Metabolic Electrolytes Daily Twice weekly (mon, thur) Monthly I-Ca, PO4, Mg Daily Weekly (mon) Monthly

1.7
Page 19 of 28
MINIMUM MONITORING GUIDELINES FOR SAFE TPN Variables (recommended)
Metabolic Instability (first week or during metabolic instability)
Metabolic Steady State (first month/ metabolically stable)
Long-Term TPN (>1 month/ metabolically stable)
Glucose Daily Twice weekly (Mon, Thur) Monthly BUN, Creatinine Twice weekly (Mon, Thur) Weekly (Mon) Monthly Pre-albumin Weekly (Mon) Monthly Every other month Albumin Weekly (Mon) First of every month Every other month LFTs: ALT/GGT/ bili (unconj/conj)
Twice weekly (Mon, Thur) Weekly (Mon) Every 3 months
Triglycerides Daily until reach goal (except infants – see IICU Guidelines)
Weekly (Mon) Every 3 months
Urine glucose Every 8 hours Daily Every 3 months Hgb, Hct Twice weekly (Mon, Thur) Twice weekly (Mon, Thur) Monthly Trace elements (manganese, copper, chromium)
Every 6 months
Zinc Monthly Selenium Every 3 months Folate Every 3 months Vitamin A + Retinol Binding Protein
Every 3 months
Vitamin D (25-OH) Every 3 months Vitamin E Every 3 months Prothrombin time Every 3 months
XI. COMPLICATIONS
A. MECHANICAL, INFECTIOUS, METABOLIC
MECHANICAL INFECTIOUS METABOLIC Air embolism Bacterial translocation Azotemia Brachial plexus injury Catheter-related sepsis Cholestasis Cardiac tamponade Chronic liver dysfunction Catheter embolism Electrolyte imbalances Catheter malposition Essential fatty acid deficiency Hemothorax Fibrosis Pleural effusion Fluid overload Pneumothorax Hepatomegaly
Hyperglycemia Hyperlipidemia Refeeding syndrome Rickets
Vitamin/mineral deficiencies Vitamin/mineral toxicities
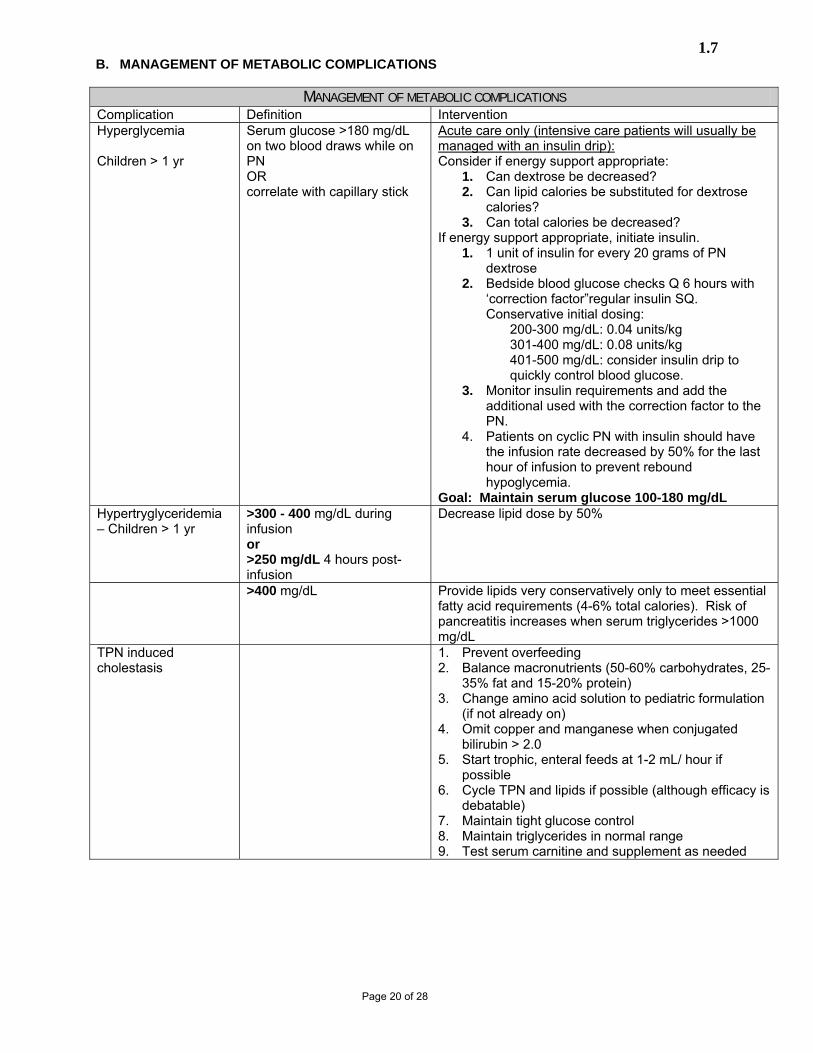
1.7
Page 20 of 28
B. MANAGEMENT OF METABOLIC COMPLICATIONS
MANAGEMENT OF METABOLIC COMPLICATIONS Complication Definition Intervention Hyperglycemia Children > 1 yr
Serum glucose >180 mg/dL on two blood draws while on PN OR correlate with capillary stick
Acute care only (intensive care patients will usually be managed with an insulin drip): Consider if energy support appropriate:
1. Can dextrose be decreased? 2. Can lipid calories be substituted for dextrose
calories? 3. Can total calories be decreased?
If energy support appropriate, initiate insulin. 1. 1 unit of insulin for every 20 grams of PN
dextrose 2. Bedside blood glucose checks Q 6 hours with
‘correction factor”regular insulin SQ. Conservative initial dosing:
200-300 mg/dL: 0.04 units/kg 301-400 mg/dL: 0.08 units/kg 401-500 mg/dL: consider insulin drip to quickly control blood glucose.
3. Monitor insulin requirements and add the additional used with the correction factor to the PN.
4. Patients on cyclic PN with insulin should have the infusion rate decreased by 50% for the last hour of infusion to prevent rebound hypoglycemia.
Goal: Maintain serum glucose 100-180 mg/dL Hypertryglyceridemia – Children > 1 yr
>300 - 400 mg/dL during infusion or >250 mg/dL 4 hours post-infusion
Decrease lipid dose by 50%
>400 mg/dL Provide lipids very conservatively only to meet essential fatty acid requirements (4-6% total calories). Risk of pancreatitis increases when serum triglycerides >1000 mg/dL
TPN induced cholestasis
1. Prevent overfeeding 2. Balance macronutrients (50-60% carbohydrates, 25-
35% fat and 15-20% protein) 3. Change amino acid solution to pediatric formulation
(if not already on) 4. Omit copper and manganese when conjugated
bilirubin > 2.0 5. Start trophic, enteral feeds at 1-2 mL/ hour if
possible 6. Cycle TPN and lipids if possible (although efficacy is
debatable) 7. Maintain tight glucose control 8. Maintain triglycerides in normal range 9. Test serum carnitine and supplement as needed

1.7 Children’s Hospital and Regional Medical Center
Guideline of Care PARENTERAL NUTRITION
Page 21 of 28
Refeeding Syndrome May occur in malnourished patients when electrolytes and minerals shift from extracellular to intracellular space to support anabolism (particularly metabolism of glucose)
Low serum potassium, phosphorus and / or magnesium after initiation of PN
1. Progress PN to goal over several days 2. Check serum electrolytes and minerals daily during
progression of PN to goal 3. Provide bolus repletion doses of any low
electrolytes and adjust PN doses upward
C. FLUID OVERLOAD -- CONCENTRATING PN VOLUME
Concentrating PN is often necessary when the patient is at risk for volume overload and the fluid input needs to be decreased. Concentration of PN refers to the removal of the extra water from the solution. In order to maximally concentrate a PN solution it is necessary to calculate the required volume necessary for provision of each of the substrates, vitamins, minerals, electrolytes, trace elements and any other additives.
Step 1. Calculate the required volume for the dextrose and amino acids. The most concentrated form of dextrose available is 70% dextrose (70 grams per 100 mL) and is used for calculations of the required minimum volume. For amino acids the most concentrated source available is 15% (15 grams per 100 mL) and is used for calculations of pediatric patients >1 yr. Infants <1 yr receive a 10% amino acid solution (10 grams per 100 mL). Note: 20% lipids are the maximal concentration available at this institution. Example: Concentrate the minimum volume for a 12 yr old patient receiving 400 gm dextrose and 125 gm of protein
Dextrose calculation: 70 = 400 or 572 mL of 70% dextrose 100 X
Amino Acid Calculation:
15 = 125 or 834 mL of 15% amino acids 100 X
Step 2. Calculate volume for vitamins and trace elements. Vitamins for children > 11 yo = 10 mL Trace elements = 5 mL Step 3. Calculate volume for electrolytes using the mEq/mL below and summing up:
NaCl 4 mEq/mL NaAcetae 2 mEq/mL NaPO4 4 mEq/mL KPO4 4.4 mEq/mL KCl 2 mEq/mL KAcetate 2 mEq/mL CaGluconate 0.465 mEq/mL Magnesium sulfate 4 mEq/mL
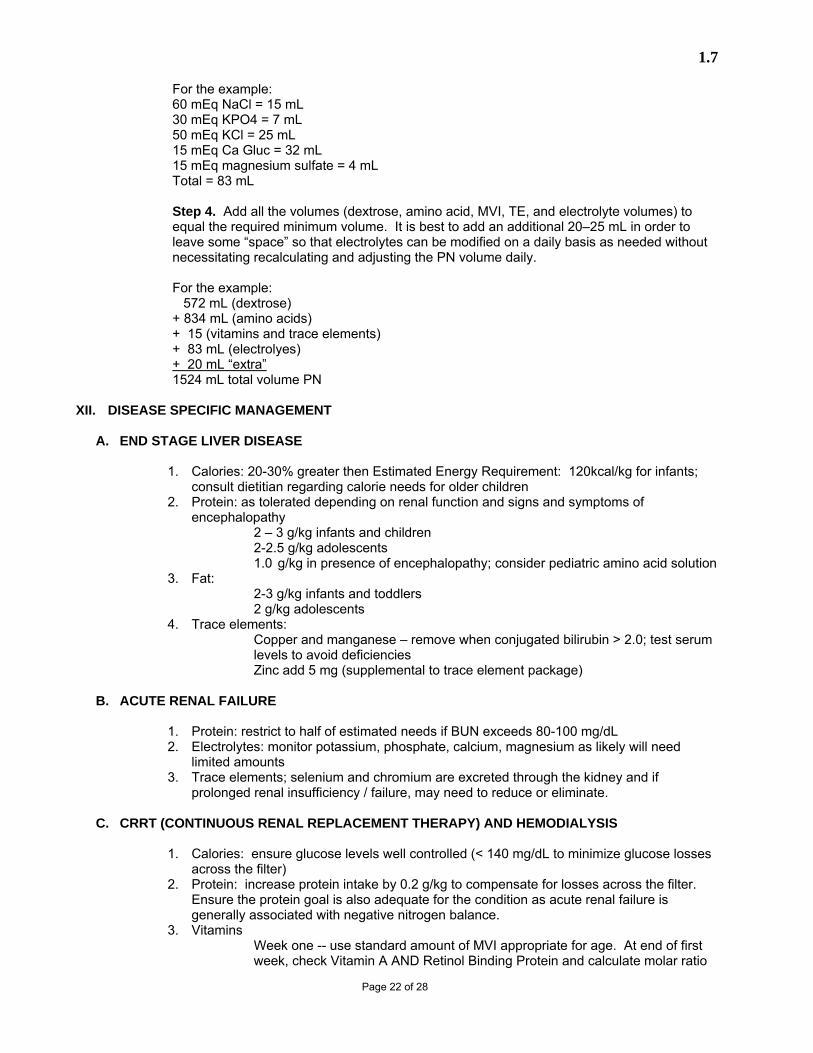
1.7
Page 22 of 28
For the example: 60 mEq NaCl = 15 mL 30 mEq KPO4 = 7 mL 50 mEq KCl = 25 mL 15 mEq Ca Gluc = 32 mL 15 mEq magnesium sulfate = 4 mL Total = 83 mL Step 4. Add all the volumes (dextrose, amino acid, MVI, TE, and electrolyte volumes) to equal the required minimum volume. It is best to add an additional 20–25 mL in order to leave some “space” so that electrolytes can be modified on a daily basis as needed without necessitating recalculating and adjusting the PN volume daily. For the example: 572 mL (dextrose) + 834 mL (amino acids) + 15 (vitamins and trace elements) + 83 mL (electrolyes) + 20 mL “extra” 1524 mL total volume PN
XII. DISEASE SPECIFIC MANAGEMENT A. END STAGE LIVER DISEASE
1. Calories: 20-30% greater then Estimated Energy Requirement: 120kcal/kg for infants; consult dietitian regarding calorie needs for older children
2. Protein: as tolerated depending on renal function and signs and symptoms of encephalopathy
2 – 3 g/kg infants and children 2-2.5 g/kg adolescents 1.0 g/kg in presence of encephalopathy; consider pediatric amino acid solution
3. Fat: 2-3 g/kg infants and toddlers 2 g/kg adolescents
4. Trace elements: Copper and manganese – remove when conjugated bilirubin > 2.0; test serum levels to avoid deficiencies Zinc add 5 mg (supplemental to trace element package)
B. ACUTE RENAL FAILURE
1. Protein: restrict to half of estimated needs if BUN exceeds 80-100 mg/dL 2. Electrolytes: monitor potassium, phosphate, calcium, magnesium as likely will need
limited amounts 3. Trace elements; selenium and chromium are excreted through the kidney and if
prolonged renal insufficiency / failure, may need to reduce or eliminate. C. CRRT (CONTINUOUS RENAL REPLACEMENT THERAPY) AND HEMODIALYSIS
1. Calories: ensure glucose levels well controlled (< 140 mg/dL to minimize glucose losses across the filter)
2. Protein: increase protein intake by 0.2 g/kg to compensate for losses across the filter. Ensure the protein goal is also adequate for the condition as acute renal failure is generally associated with negative nitrogen balance.
3. Vitamins Week one -- use standard amount of MVI appropriate for age. At end of first week, check Vitamin A AND Retinol Binding Protein and calculate molar ratio

1.7
Page 23 of 28
of Retinol: RBP. If molar ratio of retinol: RBP is greater than 1.0, decrease MVI to ½ usual amount and add extra water soluble vitamins as below. Week Two – in addition to MVI dose outlined above add Renal Replacement Vitamin “cocktail’ which is as follows:
Less than 11 years: 0.25 mL B complex injectable by Bioniche Pharma
25 mg thiamine 0.5 mg riboflavin 0.5 mg B6 0.5 mg pantothenic acid 25 mg niacin
15 mg pyridoxine 15 microg B12 500 microg folate 45 mg vitamin C 100 microg vitamin K if half dose MVI 11 years and older 0.5 mL B complex injectable by Bioniche Pharma
50 mg thiamine 1 mg riboflavin 1 mg B6 1 mg pantothenic acid 50 mg niacin
25 mg pyridoxine 30 microg B12 1 mg folate 90 mg vitamin C 100 microg vitamin K if half dose MVI
XIII. REFERENCES
JPEN Guidelines for the Use of Parenteral and Enteral Nutrition in Adult and Pediatric Patients. 2002; vol. 26 (suppl 1) Clinical Parenteral Nutrition, 3rd ed. (ed Rombeau JL, Rolandelli RH). New York: WB Saunders, 2001 The Science and Practice of Nutrition Support: Core Curriculum. American Society of Parenteral and Enteral Nutrition, 2001. Van der Berghe G et al: Intensive insulin therapy in critically ill patients. New Eng J Med 2001;345:1359-67. Miles JM et al: Lipoprotein lipase and triglyceride-rich lipoprotein metabolism. Nutr Clin Prac 2001;16:273-279. Suchy FJ, Sokol RJ, Balistreri WF. Liver Disease in Children. Lippincott Williams & Wilkins, Wolters Kluwer, 2nd Edition 2001; p 224. Anders, Hyltander: Intravenous feeding kinetics and its effects on energy and nitrogen metabolism. Nutrition in Clinical Practice, 1994; 9:51-57 McClary Bennett, Katherine, Rosen, Gail H., Cyclic Total Parenteral Nutrition. Nutrition In Clinical Practice, 1990; 5:163-165 Collier, S., et al, Use of cyclic parenteral nutrition in infants less than 6 months. Nutrition in Clinical Practice, 1994; 9:65-68

1.7
Page 24 of 28
Bistrian, B. : To Replace or Not to Replace Vitamins and Minerals in CVVH. This is the Question. Critical Care Med. 27: (1): 36. 1999. Core Cirriculum for Nephrology Nursing, 3rd Edition. American Nephrology Nurses’ Association. Section XII Continuous Renal Replacement Therapy, pp 325-345. 1995. Davies, S. P. et al: Amino Acid Clearances and Daily Losses in Patients with Acute Renal Failure Treated by Continuous Arteriovenous Hemodialysis. Critical Care Medicine. 19: (1) 1510-1515. 1991. Fortin, M.C., et al: Serum Concentrations and Clearances of Folic Acid and Pyridoxal –5’-Phosphate During Venovenous Continuous Renal Replacement Therapy. Intensive Care Med. 25: 594-598. 1999. Frankenfield, D.C. et al. Amino Acid Loss and Plasma Concentration During Continuous Hemodiafiltration. JPEN. 17: (6) 551-561. 1993. Frankenfield, D.C. et al: Glucose Dynamics During Continuous Hemodiafiltration and Total Parenteral Nutrition. J Intensive Care Med. 21: 1016-1022. 1995. Klein, C.J. et al: Magnesium, Calcium, Zinc and Nitrogen Loss in Trauma Patients During Continuous Renal Replacement Therapy. JPEN. 26: (2) 77-93. 2002. Manns, M. et al: Continuous Renal Replacement Therapies: An Update. AJKD. 32: (2) 185-207. 1998. Story, D.A., et al: Trace Element and Vitamin Concentrations and Losses in Critically Ill Patients Treated with Continuous Venovenous Hemofiltration. Critical Care Med. 27: (1) 220-223. 1999. Duggan C, Rizzo C, Cooper A et al: Effectiveness of a clinical practice guideline for parenteral nutrition: A 5-year follow-up study in a pediatric teaching hospital. JPEN 2002;26:377-381. Matsusue, S., Nishimura, S., Koizumi, S., etal: Preventative Effect of Simultaneously infused lipid emulsion against thrombophlebitis during postoperative peripheral parenteral nutrition. Surg Today. 25: (8) 667-671. 1995. Pollack, A, Hayde, M., Hayn, M. et al: Effect of Intravenous Iron Supplementation on Erythropoiesis in Erythropoietin treated Premature Infants. Pediatrics 2001; 107: 78-85. Garcia, MG., Hutson, AD., Christensen, RD.: Effect of Recombinant Erythropoietin on Late Transfusions in the Neonatal Intensive Care Unit: A Meta-Analysis. Journal of Perinatology. 22: 108-111. 2002. Kling, PJ., Winzerling, JJ.: Iron Status and the treatment of the anemia of prematurity. Clin Perinatol. 29: 283-294. 2002. Friel, JK., Andrews, WL., Hall, MS., et al: Intravenous Iron Administration to very low birth weight newborns receiving total and partial parenteral nutrition. JPEN. 19: (2): 114-118. Ohls, RK., Harcum, J., Schibler, KR. et al: The effect of erythropoietin on the transfusion requirements of preterm infants weighing 750 grams of less: a randomized, double blind, placebo controlled study. J Pediatrics Online. 131: (5): 1-9. 1997. Cairns, PA., Stalker, DJ.: Carnitine supplementation of parenterally fed neonates. The Cochrane Database of Systematic Reviews. Vol 1. 2005. Most recent update 27 August 2002. Esteban- Cruciani, NV., Gopalareddy, VV., Singh, D. Total parenteral Nutrition and Carnitine Supplementation Practices in Premature Neonates: A National Survey. Pediatr Res. 49: 398A. 2001. Moukarzel, AA., Dalhstrom, KA., Buchman, AL et al: Carnitine Status of Children Receiving Long term total parenteral nutrition: A longitudinal Prospective Study. J Pediatr. 120: 759-762. 1992.

1.7
Page 25 of 28
Dalhstrom, KA., Ament, ME., Moukarzel, A. et al: Low Blood and Plasma Carnitine Levels in Children Receiving Long Term parenteral Nutrition. J Pediatric Gastroenterology. 11: 375-379. 1990. Wolman, SL., Anderson, GH., Marliss, EB.et al: Zinc in total parenteral nutrition: requirements and metabolic effects. Gastroenterology. 76:458-467.1979. American Society for Parenteral and Enteral Nutrition Aluminum Task Force: A.S.P.E.N. Statement on Aluminum in Parenteral Nutrition Solutions Nutr Clin Pract 19:416-417, 2004.

1.7
Page 26 of 28
HOW TO WRITE A TPN ORDER
____________________________________________________________________________________ TPN on CIS: All new PN or lipid orders or changes to existing PN or lipid orders must be made via the paper form. However, a new order indicating the patient’s PN status must be placed on CIS for each day that the patient is on PN. There are two options under ‘PN status’ on CIS – new or same PN. If a patient is on the same PN as the previous day, it is not necessary to fill out a paper form but include the date of the most recent paper order in the CIS order (for example: SAME AS 2/2/05). I. General Guidelines – please refer to Policy and Procedure on CHILD –
http://child/policies_procedures/clinical_services/documents/174-05.doc II. A nutrition assessment will be performed on all patients prior to starting TPN to provide
recommendations for energy, protein, lipids and, when different than the standard requirements, electrolytes, minerals and trace elements.
III. INFANT (< ONE YEAR) TPN Orders -- All shaded boxes must be filled in to be a complete order.
Step 1 - Patient Demographics • Reference weight • Reference length • Indication • Catheter – check type (central, PICC, or peripheral)
Step 2 - Total Daily Fluids (T) Determine the patient’s total daily fluid requirements in mL per day (use the guidelines on back of form.) This number is T for TOTAL DAILY FLUIDS. In the box marked T, place the total volume of fluid the patient will receive in 24 hours using the patient’s current reference weight. Step 3 - Medication drip volume (M) Determine the volume of fluid received via drips (ie dopamine drip, arterial flush, morphine drip) in mL per day. This value is M for MEDICATION DRIPS. In the box marked M, place the volume of fluid the patient will receive in 24 hours from medication drips. Step 4 - Fat Emulsion volume (F) and rate Calculate the patient’s fat requirements in mL per day (use the guidelines on the back of form or dietitian’s recommendations). Only 20% fat emulsion is available, providing 1 gram of fat per 5 mL. This value is F for FAT EMULSION. In the box marked F, place the volume of fat emulsion the patient will receive in 24 hours. In the shaded box on the right, express the lipid rate in mL/hr times the amount of hours for which the total volume of fat is to be infused. Step 5 - Feed volume Indicate the rate or volume of feeds the patient is receiving. If none, indicate NPO. Step 6 – Total TPN volume
Determine the total TPN volume for 24 hours. Step 6a – IICU Medical Infants (patients with fluctuating feed volume)
Total TPN volume = T – M – F
= Total daily fluids – Medication drips – Fat emulsion
= Step 2 – Step 3 – Step 4
Divide the 24-hour volume by the number of hours the TPN will be infused over. Fill this rate in mL/hr in Box 1A (top right hand side) and indicate the number of hours to be infused over.
1.7
Page 27 of 28
Step 6b – All Other Infants (patients who are tolerating their feeds or who are fluid restricted)
Total TPN volume = T – M – F–Feeds
= Total daily fluids – Medication drips – Fat emulsion–Feeds
= Step 2 – Step 3 – Step 4–Step 5
Divide the 24-hour volume by the number of hours the TPN will be infused over. Fill this rate in mL/hr in Box 1B and indicate the number of hours to be infused over.
Step 7 - Initial TPN rate – for IICU Medical Infants only To determine the initial TPN rate, subtract the total feed volume from the total TPN volume (step 6a) and divide it by the number of hours the TPN is being infused over. This rate may change throughout the next 24 hours if feed rates are changed. The initial TPN infusion rate will be the same as the maximum TPN infusion rate if the patient is not receiving feeds.
Step 8 – Dextrose Indicate the grams of dextrose by calculating the dextrose infusion rate and multiplying by kg (use the back of the form for appropriate dextrose infusion rates and advancement.) Newborns, especially low birth weight infants, will need to be advanced carefully. This calculation helps check whether the concentration of dextrose ordered is appropriate.
Step 9 – Protein Determine the amount of protein (referring to back of order form for initial, advancement and goal amounts). The amino acids are provided as a pediatric formulation.
Step 10 - Electrolytes & Minerals Determine electrolyte and mineral requirements in mEq/kg/day. Typical starting guidelines are indicated on the front of the form for each salt. Use the guidelines on the back of the form and the laboratory values as a guide. Any space left blank will be interpreted as a zero. All electrolytes and minerals are ordered as the salt form (no balancing necessary).
The recommendations on the chart for electrolytes and minerals are for total daily needs. This total may be distributed amongst the salt forms. For instance, if the total daily goal is 3 mEq/kg/day of sodium, the sodium may be ordered as sodium chloride, sodium acetate, sodium phosphate, or as a combination. To add up how much chloride the patient is receiving, both the sodium chloride and the potassium chloride values must be added. This is also the case for potassium, acetate and phosphate.
Calcium and phosphorus solubility and maximum concentrations: The order must be entered into the BAXA software to calculate the calcium and phosphorus solubility. Solubility graphs are used to determine whether these values need to be lowered. If one of them is taken out, it needs to be provided via a separate infusion.
Step 11 - Vitamins and Trace Elements • Vitamins and trace elements are added per protocol (see back of order form for doses.). • If ½ dose or removal of multivitamin is desired, indicate this by checking the appropriate box. • If a trace element needs to be removed (for example in renal and liver failure), first check the
box to delete ‘trace elements per protocol.’ Then add desired trace elements to the PN by filling in the amount per day next to the needed elements (see back of form for dosing guidelines).
• If a trace element needs to be supplemented at a higher dose than the protocol amount, specify desired additional amount next to the element.
• For patients on CRRT or daily hemodialysis, renal replacement vitamins are added by checking the appropriate box (see back of form for contents)

1.7
Page 28 of 28
• After 30 days of PN, most patients should have selenium and molybdenum added to PN.
Step 12 - Other Additives Other additives may be added to the PN (ranitidine, heparin, insulin, carnitine, iron). A dose must be written in the space provided. Typical doses are listed. Step 13 – Calculate Total Calories (optional but recommended) There is a space on the back of the form to calculate the total calories from the TPN, other drips and feeds. For all infants, the caloric goal will not be met until about day 3 or 4 of TPN as long as the patient has a central line and adequate fluids can be given. Step 14 – Sign the order, print your name, pager number, date and time order.
IV. PEDIATRIC (>ONE YEAR) TPN Orders -- All shaded boxes must be filled in to be a complete order. Step 1 - Patient Demographics Same as infant. Step 2 - Fat emulsion volume and rate Enter the volume and rate in on the right side of the form based on the dietitian’s recommendation. Or, to calculate the fat requirements in mL per day, use the worksheet on the left and the guidelines on the back of form for gm/kg/day. Only 20% fat emulsion is available, providing 1 gram of fat per 5 mL. Divide this volume by the number of hours to infuse lipid. Step 3 - Total PN Volume
Total PN volume = Total daily fluids –Obligatory non-TPN fluids (meds and feeds) - Fat emulsion
Step 4 – PN Infusion rate Enter the volume of PN solution, the infusion rate, and the number of hours to infuse PN. For infusions <20 hours AND if the patient is receiving insulin or is at risk for hypoglycemia, check the CIS taper order set and fill it out in CIS. See Policy and Procedure on Cycling TPN on CHILD – insert hyperlink
Step 5 - Dextrose Indicate the amount of dextrose in grams per day, using the back of the form for initial dosing and advancement guidelines in gm/kg/day. (This is currently in % dextrose but will be changed to gm) Step 6 - Protein Indicate the amount of amino acids gm/kg/day using the back of the form for dosing guidelines. If non standard amino acid solution is required, indicate the brand in the blank. The peripheral line maximum depends on the dextrose, protein and lipid doses equally a maximum osmolality of 900 mOsm/L.
Step 7 - Electrolytes & Minerals Determine the patient’s electrolyte and mineral requirements in mEq/day. Typical starting guidelines are indicated on the front of the form for each salt in. Use the guidelines and the laboratory values as a guide. Any space left blank will be interpreted as a zero. See the Infant PN section above for information on ordering the individual electrolytes as salts as well as information on calcium and phosphorus maximum concentrations. Steps 8 and 9 - Vitamins and Trace Elements / Other Additives – Same as Infant PN orders
Step 10 – Sign the order, print your name, pager number, date and time order.