11 - cdn.intechweb.orgcdn.intechweb.org/pdfs/13269.pdf · 11 Data Mining in Higher Education...
21
11 Data Mining in Higher Education Roberto Llorente and Maria Morant Universidad Politécnica de Valencia, Spain 1. Introduction Higher Education targets to develop complex theoretical, abstract and analytical reasoning capabilities in the alumni. This objective can be accomplished addressing four major steps: Theoretical foundation, practice, communication and assessment (Petry, 2002). Theoretical background and practical exercise comprise the basic knowledge building process at initial stages. Assessment guides the alumni through higher complexity studies permitting the student to identify the weak points in the knowledge building where further theory study and/or practice is required. Theoretical foundation and problem-solving practice are well known aspects in Higher Education. High-quality materials in printed and electronic format, sometimes including multimedia –audio, video or computer graphics–, sometimes delivered through the Internet are readily available today. Teaching-aids as computer-feed overhead projectors or electronic blackboards in the classroom are common place and facilitate the knowledge- building process. Moreover, computers in the classroom are a powerful tool linking theory and problem-solving practice in engineering studies (Beyerlein et al., 1993). On the other hand, the assessment process has been evolving slowly in the last decades. Pen-and-paper examination techniques have been translated to the computer-enabled classroom as software applications that present an exam in the screen and record the student answers. This process can be seen as an external assessment targeting to evaluate the skills of the student in order to give a pass/fail on a given subject. The external evaluation can be useful for the student in order to know the skill level, but usually fails short when the student wants to now “what’s wrong”, i.e. to know not only what question was missed but also what knowledge areas the student is finding difficulties. Weak areas identification cannot be done from a single question or set of questions. It requires the assessment process, examination or similar, to be considered as a whole. Student attention time or time spent thinking on a specific question –relative to the other question, as some students think faster than others- clearly indicates the areas where difficulties hide, by example. The pattern followed when answering the exam questions, by example, is another useful indicator. The student will try to answer first the questions he feels more comfortable with. Dubitation on the answer –change the answer several times– is another useful parameter. All these parameters and many others can be compiled and processed by the unprecedented analytic processing capabilities of modern data mining techniques. Collaborative assessment appears as a the natural evolution from the individual learning to the collaborative learning, which was proposed as a suitable technique to speed-up development of analytical reasoning as different approaches are continuously suggested www.intechopen.com
Transcript of 11 - cdn.intechweb.orgcdn.intechweb.org/pdfs/13269.pdf · 11 Data Mining in Higher Education...

11
Data Mining in Higher Education
Roberto Llorente and Maria Morant Universidad Politécnica de Valencia,
Spain
1. Introduction
Higher Education targets to develop complex theoretical, abstract and analytical reasoning capabilities in the alumni. This objective can be accomplished addressing four major steps: Theoretical foundation, practice, communication and assessment (Petry, 2002). Theoretical background and practical exercise comprise the basic knowledge building process at initial stages. Assessment guides the alumni through higher complexity studies permitting the student to identify the weak points in the knowledge building where further theory study and/or practice is required. Theoretical foundation and problem-solving practice are well known aspects in Higher Education. High-quality materials in printed and electronic format, sometimes including multimedia –audio, video or computer graphics–, sometimes delivered through the Internet are readily available today. Teaching-aids as computer-feed overhead projectors or electronic blackboards in the classroom are common place and facilitate the knowledge-building process. Moreover, computers in the classroom are a powerful tool linking theory and problem-solving practice in engineering studies (Beyerlein et al., 1993). On the other hand, the assessment process has been evolving slowly in the last decades. Pen-and-paper examination techniques have been translated to the computer-enabled classroom as software applications that present an exam in the screen and record the student answers. This process can be seen as an external assessment targeting to evaluate the skills of the student in order to give a pass/fail on a given subject. The external evaluation can be useful for the student in order to know the skill level, but usually fails short when the student wants to now “what’s wrong”, i.e. to know not only what question was missed but also what knowledge areas the student is finding difficulties. Weak areas identification cannot be done from a single question or set of questions. It requires the assessment process, examination or similar, to be considered as a whole. Student attention time or time spent thinking on a specific question –relative to the other question, as some students think faster than others- clearly indicates the areas where difficulties hide, by example. The pattern followed when answering the exam questions, by example, is another useful indicator. The student will try to answer first the questions he feels more comfortable with. Dubitation on the answer –change the answer several times– is another useful parameter. All these parameters and many others can be compiled and processed by the unprecedented analytic processing capabilities of modern data mining techniques. Collaborative assessment appears as a the natural evolution from the individual learning to the collaborative learning, which was proposed as a suitable technique to speed-up development of analytical reasoning as different approaches are continuously suggested
www.intechopen.com

New Fundamental Technologies in Data Mining
202
(Sharan & Sharan, 1992). Working in group provides opportunities for developing the student generic skills such as organization, team work, delegation and cooperation. Group work can be used in science career studies for introducing the students in real world work as it provides the opportunity to work in multidisciplinary teams. The aim of group work is to produce better results in presentations and reports. This is achieved combining the individual talent of each member of the group, contributing knowledge and ideas. Nevertheless, cooperative learning is usually disregarded because groupal work assessment cannot provide individual marks. This can be seen as an unfair evaluation method becoming an important issue when the student faces competition in his initial career stages. Data mining can remove the assessment roadblocks in the collaborative learning scenario altogether providing an unprecedented level of information pinpointing the learning process bottlenecks. This breakthrough approach permits accurate per-student marks when using cooperative learning. In this way, collaborative work and groupal assessment could be regarded as fair, efficient knowledge-building technique. In this chapter, a generic data mining based assessment technique applied to Higher Education is proposed and analysed. An ad-hoc online evaluation software for deep data-gathering is described in Section 2. Parameters, learning patterns and bottleneck identification techniques are discussed considering a case study. Next in Section 3, an overview of groupal activities methodologies and the associated data mining assessment technique is presented. Finally Section 4 summarizes the main conclusions.
1.1 Educational data mining principle Data mining addresses data analysis by software in order to find patterns, regularities or the opposite –irregularities- in very large information sets. A lot of companies use data mining to comb through databases and adapt their business plans. Readily examples can be found in supermarkets where data mining is used in order to figure out which of their products sells best and where. Data mining processing can be successfully extended to the education environment, specifically at Higher Education levels. A data mining process can be defined and applied for exploring and analysing data to identify useful patterns in the evaluation results. In this section, the state-of-the-art of data mining definitions applied to education is summarized highlighting the main steps, phases and factors to be considered. Educational Data Mining (EDM) is defined as the process used for transforming raw data compiled by education systems in useful information that could be used by the lecturers to take corrective actions and answer research questions (Heiner et al., 2006). EDM is the application of data mining in the educational field, with the main objective of better understanding the student learning process in order to improve the quality of the education system. Fig.1 shows the process of applying educational data mining on the results obtained from educational methodologies. The lecturers are the responsible of designing and planning the classes using different methodologies. The students use and participate in these activities working individually or in groups. The data obtained are processed by data mining in order to classify, identify patterns or associate different terms. The main objective is to identify the learning pattern of each student according to its student profile. As it is already known, we can find different student profiles in the same class, from which we can classify in two big groups: those who are able to self-regulate their own learning processes and do prefer a free approach of exploring the subject, and those who prefer close teacher control and need more guidance. It is necessary to identify these profiles in order to evaluate the learning pattern of each student.
www.intechopen.com

Data Mining in Higher Education
203
Educational methodologies - Evaluation techniques - e-learning systems - On-line tools
Data Mining - Classification - Student profile - Pattern identification - Association
Lecturer
Students
Use, participate, work in groups
Show results and recommendations. Identify roadblocks
Show results and learning patterns
Data interaction Corrective actions
Design and planning
Fig. 1. Data mining for identification of the student’ learning pattern
As a conventional data mining processes, several steps should be performed for EDM analysis. The different steps can be summarized in: 1. Data pre-processing: In this phase the data to be studied are processed before being
analysed. Usually it consists of calculating descriptive data summarizations and measures of central tendency (such as mean and mode) and data dispersion (like quantiles, variances and standard deviation). Data cleaning methods can be applied too in order to handle missing values or inconsistent data. Integration and transformation of the data may be applied before starting the data mining study.
2. Data mining: The data are processed performing correlations to identifying associations in the information gathered. Frequency pattern mining analysis should be applied at this stage.
3. Classification: In this stage the metric is evaluated using decision tree and decision rule induction. They can be used linear or non-lineal models for classification. Cluster analysis and sequence or trend analysis can be applied over the classified information.
4. Visualization: The data mining results are presented in a readable form. Two main outputs are presented: One for the students and the other one for the lecturer. It is important to give feedback to the students on their learning patterns pointing out the roadblocks identified so they can take action to solve them. Further tracking on the bottlenecks identified for a given student, can also identify the problem. In that way, they can use that knowledge to address learning tasks with more intention, thereby achieving positive results in terms of assessments of performance and interaction with other students. On the other hand, the analysis of the information provided by data mining can be used by the lecturers for introducing corrective actions, instructional changes and other improvements, which were derived from the learning pattern results.
1.2 Assessment state-of-the-art
Usually, qualitative methods are used for evaluation with different criteria. General criteria for judging qualitative studies are different depending on the purpose. In order to achieve collaborative learning it is required that the lecturers develop an effective plan. This plan is in reality like a route-map that the students should follow. In order to prepare a suitable
www.intechopen.com

New Fundamental Technologies in Data Mining
204
plan the lecturers must know the actual situation (where you are in the map) and define the goals (where you want to go). In learning, like in other situations, the development of successes is uncertain and the plan must be adaptive in order to add corrective actions. To do this, appropriate evaluation tools are needed. The evaluation tools typically employed in Higher Education can be classified in written and oral techniques. Written examination so far tries to bring the students to their maximum potential after several years of studies. The examination procedure can be oral, but chances of successful computer-processing are reduced as human voice – to machine translation techniques are not sufficiently advanced. Written assessment techniques can summarised in: • Questionnaires: A questionnaire consists of a number of questions of given concepts
that the student has to answer. A distinction is made between open-answer and closed-answer questions as it will be explained later. • Problem solving: A mathematical problem is given to the student to be solved in every step till reaching the final answer. The student should explain how each step is achieved and the reasons. In this case, not only that the final correct answer is achieved is considered, the steps to reach it are taken into account too. • The portfolio: One of the last evaluation methods which includes an assessment technique of the portfolio as a collection of materials of the students’ abilities and achievements that can be used as a method for testing and examinations (Lupton, 2005). These are individual techniques which require time-consuming stand-alone work. • Rubrics: A rubric is a scoring tool used for linking the students’ criteria to the learning objectives. One of the key advantages of the rubrics for the lecturers is that they establish clear benchmarks for achieving success and make grading more efficient. • Concept maps: Diagrams showing the relationships among different concepts. When establishing the key concepts and their relationships the student demonstrates the knowledge about the subject. • Notebook revision: The teachers review the student’s notebooks where they take notes and develop the concepts given in class. • Academic work: Written documents prepared by the student developing a given task. This can be applied to summarize ideas for a given concept, describe processes, compiling information or state-of-the-art between others. • Essays: The student writes a short document giving its opinion of a concept or develops an idea from a topic. • Study case: A real-life example is given to the student who should understand it, study the problem to propose solutions and develop it. • Project: The students develop a technical project document. This is used to integrate concepts and apply them to a project case. • One minute paper: This technique consists in a writing activity of very short duration (it should take one minute or less to complete it) developing a proposed subject or specific question. This technique has been commonly introduced in Higher Education to prompt the students to summarize the day’s lesson.
Typical oral assessment techniques: • Oral exam: The students should present the answer of a question or a summary of a concrete subject orally to the teacher. In this case other aspects more than the knowledge of the question can be evaluated (speech techniques, body language, etc.)
• Presentation: Activities done in the classroom where the student gives a short presentation of a work that he has prepared and explains it to the rest of the class.
www.intechopen.com
Data Mining in Higher Education
205
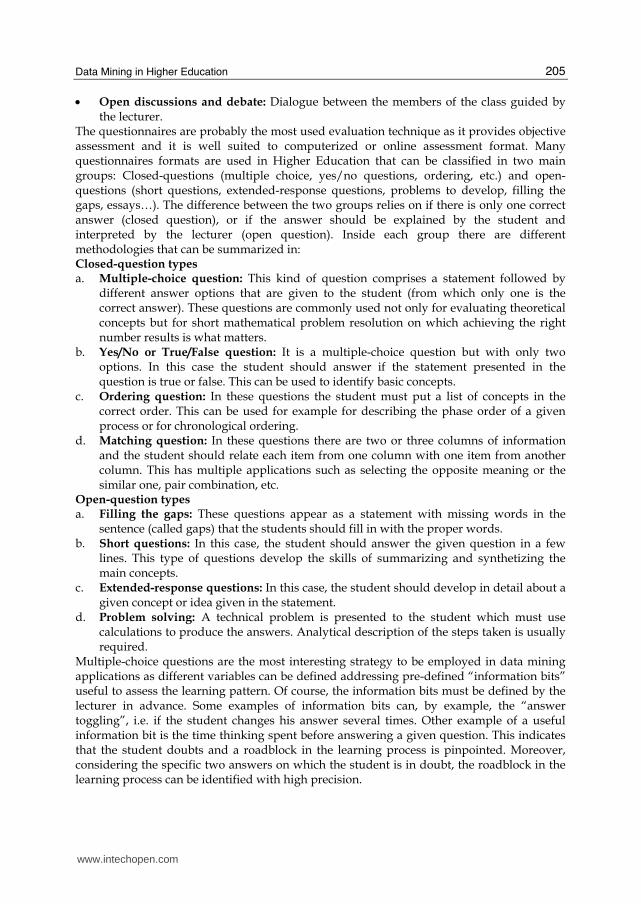
• Open discussions and debate: Dialogue between the members of the class guided by the lecturer.
The questionnaires are probably the most used evaluation technique as it provides objective assessment and it is well suited to computerized or online assessment format. Many questionnaires formats are used in Higher Education that can be classified in two main groups: Closed-questions (multiple choice, yes/no questions, ordering, etc.) and open-questions (short questions, extended-response questions, problems to develop, filling the gaps, essays…). The difference between the two groups relies on if there is only one correct answer (closed question), or if the answer should be explained by the student and interpreted by the lecturer (open question). Inside each group there are different methodologies that can be summarized in: Closed-question types a. Multiple-choice question: This kind of question comprises a statement followed by
different answer options that are given to the student (from which only one is the correct answer). These questions are commonly used not only for evaluating theoretical concepts but for short mathematical problem resolution on which achieving the right number results is what matters.
b. Yes/No or True/False question: It is a multiple-choice question but with only two options. In this case the student should answer if the statement presented in the question is true or false. This can be used to identify basic concepts.
c. Ordering question: In these questions the student must put a list of concepts in the correct order. This can be used for example for describing the phase order of a given process or for chronological ordering.
d. Matching question: In these questions there are two or three columns of information and the student should relate each item from one column with one item from another column. This has multiple applications such as selecting the opposite meaning or the similar one, pair combination, etc.
Open-question types a. Filling the gaps: These questions appear as a statement with missing words in the
sentence (called gaps) that the students should fill in with the proper words. b. Short questions: In this case, the student should answer the given question in a few
lines. This type of questions develop the skills of summarizing and synthetizing the main concepts.
c. Extended-response questions: In this case, the student should develop in detail about a given concept or idea given in the statement.
d. Problem solving: A technical problem is presented to the student which must use calculations to produce the answers. Analytical description of the steps taken is usually required.
Multiple-choice questions are the most interesting strategy to be employed in data mining applications as different variables can be defined addressing pre-defined “information bits” useful to assess the learning pattern. Of course, the information bits must be defined by the lecturer in advance. Some examples of information bits can, by example, the “answer toggling”, i.e. if the student changes his answer several times. Other example of a useful information bit is the time thinking spent before answering a given question. This indicates that the student doubts and a roadblock in the learning process is pinpointed. Moreover, considering the specific two answers on which the student is in doubt, the roadblock in the learning process can be identified with high precision.
www.intechopen.com

New Fundamental Technologies in Data Mining
206
1.3 Higher education framework
The European Higher Education Area, intended to be established by end of 2010 according to the Bologna Process (The Bologna Declaration of June 1999), established deep reforms targeting a more European Higher Education more compatible and attractive for the students (European Commission, 1999). In the new European Higher Education Area the students will be able to choose from a wide range of high quality courses in a transparent way with the benefit from smooth recognition procedures. Three main objectives of the Bologna process can be summarized in: introduction of the three cycle system (defined as bachelor, master and doctorate), quality assurance and recognition of qualifications and periods of study. Moreover, in the European Higher Education Area based on the Bologna principles, laboratory lessons have been incorporated in all the subjects of the internal curricular units. According to this, almost all science graduate students will use a laboratory at some point in their graduate careers. Laboratory work in engineering studies involves not only practise on-the-field work but team-work. In fact, what enterprises are looking for are mature graduates with a good understanding of the principles of engineering as well as excellent team-working and management skills. To achieve this, the curriculum must incorporate active, engaging and relevant learning, teaching and assessment strategies to develop self-aware, well-motivated, enterprising and independent learners. In addition, assessment and feedback must be used to promote, as well as to measure, the student learning and progress. In order to introduce successfully cooperative learning in Higher Education it is required to assess the precise and accurate tracking of the learning process and to be able to identify and separate the individual outcomes from the outcome of each member of the group. This tracking can be performed by data mining on the collection of several variables during the learning process both individually and also in the cooperative work. All this information can be processed by deep data mining. For this, some variables can be considered in order to obtain two key outcomes: First, an accurate estimation of the effectiveness of the learning process. And second, a precise identification of the bottlenecks of areas where the student is facing problems in the knowledge acquisition process. This is of great importance in order to take corrective actions by the lecturer if necessary. Laboratory lessons can be used as discovery process for the students as they uncover the mechanisms behind important scientific principles described in theory. In the laboratory, the student learns how to use the related instrumentation and techniques to obtain useful data. The practical work is thoroughly guided in the first parts but, eventually, the student must become autonomous in the measurements. The laboratory time is intended to practice the theoretical concepts previously introduced in the theoretical lessons. The student qualification includes the practice marks obtained in the laboratory sessions. In this chapter we study different strategies to evaluate the laboratory lessons and group-work in engineering studies. To evaluate this kind of activities in group-work, ordinary exams in the laboratory sessions are time-consuming and most of the times produce lack of interest in alumni due to the large number of sessions. In fact, according to the 2009 “Eurobarometer” survey on Higher Education reform among students (Gallup Organization, 2009), this lack of interest is affecting the engineering students who were the least likely to intend to go on to further study with a 32% vs. 71% of medical students who had plans to continuing their studies doing a Doctorate or another Masters course. Also the number of students per session (around 35) prevents the possibility of oral or individual exams. For this reason, on-line
www.intechopen.com
Data Mining in Higher Education
207
evaluation techniques based in test using multiple-choice, filling the gaps or short questions have been commonly introduced and accepted at the university in the last years. The tests are powerful educational tools that if are carefully designed can be used for evaluating accurately the student learning. These tests can reinforce learning by providing students with indicators of what topics they should revise. But this type of evaluation and e-learning activities needs a control of the evolution of the learning skills in order to validate the results. This can be solved applying data mining to the examination results and advising the lecturer with the student success rate statistics broke down by the concepts introduced in the session. E-learning techniques are used too for distance education where web-based technology was very quickly adopted and used for course delivery and knowledge sharing (Zaïne, 2001). In Section 2 of this chapter, an overview of data mining techniques that can be used for enhance on-line education not only for the students but for the lecturers is included. These techniques offer researchers unique opportunities to study how students learn and what approaches to learning lead to success (Minaei-Bidgoli et al., 2003). This allows classifying students in order to predict their final grade based on features extracted from the collected data during the web-based on-line evaluation tool. Some example cases applied to real could dataset results are commented in this chapter according to (Minaei-Bidgoli et al., 2003), (Llorente & Morant, 2009), (Merceron & Yacef, 2005). However, this becomes more difficult when we add group-centric work as it is more complicated to identify the work done and skills developed by each member of the group individually. When we talk of cooperative work we mean collaboration between all the partners. As we know, good collaboration is not achieved only having students sit side-by-side called collaborative work, a group must have clear positive interdependence: members must promote each other's learning and face-to-face interaction. But the evaluation and qualification of this kind of problem-based results it is also a much deeper issue, as it is very difficult to identify the level of each member of the group in the whole result. In Section 3 of this chapter, a groupal evaluation technique is proposed taken into account for data mining calculations for obtaining a fair evaluation result. In order to obtain an accurate learning pattern of each student it is necessary to identify small bits of information that can be analysed by data mining.
2. Data mining and e-Learning
With the insertion of the new technologies in education, novel evaluation techniques appeared in order to make the evaluation process simpler and different for the students. Moreover, using evaluation tools for monitoring the students learning evolution can be extended to study deeply the learning pattern of the students. This can be achieved if more information is taken into account apart from only the answer in the exams. There are a lot of bits of information that, despite if you look at them separately they have no obvious meaning, when analysed with data mining can give us exact relation with learning concepts and predict roadblocks in the learning process. In this Section we will describe how data mining techniques can be applied in Higher Education studies.
2.1 Data gathering
The main goal of a lecturer should be to make the most effective use of the lecturing time in order to give students a beneficial experience of doing science. In order to achieve this, lecturers can use different methods to include technical and practical aspects to the concepts
www.intechopen.com
New Fundamental Technologies in Data Mining
208
they want to explain, for example laboratory and seminar sessions. About engineering studies, different aspects have to be considered that are, most of the times, interrelated and complementary: a pedagogy factor to determining the best teaching methods for the desired outcomes, and a logistic factor to ensuring that the evaluation process is correct and that the students understand the tasks they need to accomplish. Several tools can be used by the lecturers and lecturers in order to evaluate the learning pattern of the students. We can classify some as:
• Native applications that run in a computer or mobile devices to compile information presenting several questions to the user. This type of applications has been extended for work in the field using PDA without the necessity of having a computer. Applications running in the PDA can be used for updating the stock of a company, user surveys in the street, etc.
• Pure online applications that run in a website navigator such as Microsoft Explorer, Mozilla Firefox, Opera, Safari, etc. Nowadays they use commonly HTML4 or HTML5 and usually require connectivity to Internet. This kind of applications has main the advantage that the data compilation can be done remotely from several users at different locations. The data can be stored in the same database and it is transparent to the final user.
• Middleware software based on XML, SOAP and Web services. This is an extension of the only application where not only the website navigator is needed but a custom-made application must be installed to run the program. These service-oriented architectures provide a more functional set of application programming interfaces that can be applied for online testing. An example could be Adobe Air applications.
2.2 Data analysis
In (Llorente & Morant, 2009) the data mining technique in Higher Education is proposed for monitoring the learning tracking at the end of the lesson using a web-based exam. The exam comprises a questionnaire showing the questions in increasing difficulty order. The developed application stores the results and other information that can be analysed by data mining to identify roadblocks. This technique consists of five phases which can be summarized as:
• Data collection: This phase starts with the initial data collection using the on-line test
application described before. In this phase we get familiar with the data, to identify
data quality problems, or to detect interesting subsets to form hypotheses for hidden
information. This could be very useful for lecturers that need to update the contents of
their lessons depending on the results obtained in the previous ones.
• Data preparation phase: This phase covers the activities needed to construct the final
database. This phase is included in the on-line test programming to record the data that
is needed for data mining directly in a database. However, data preparation tasks are
likely to be performed multiple times, as after using this technique some variations
could be needed to add parameters that could be interesting to study or to remove data
that is not significant to the study.
• Modelling phase: In this phase, various data mining techniques can be selected and
applied. Typically, there are several techniques for the same data mining problem type.
Some techniques have specific requirements on the form of data. Therefore, stepping
back to the data preparation phase is often needed.
www.intechopen.com

Data Mining in Higher Education
209
• Evaluation stage: This phase comprises the knowledge building assessment. The lecturer monitoring the obtained data. In this phase, the lecturer takes decisions about the concepts that need to be clarified and includes the corresponding changes in the deployment phase.
The information gathered during the process is stored and following data mining processes will benefit from the information of the previous ones. The phase sequence shown in Fig. 2 is not strict. The arrows indicate the most important and frequent dependencies between the phases. Moving back and forth between different phases can be done if it is required. It depends on the outcome of each phase or which particular task has to be performed next. The life cycle of a data mining process is based on a modification of the CRoss-Industry Standard Process for Data Mining (named CRISP-DM). The outer circle in Fig. 2 represents the cyclic nature of data mining itself.
DATA
Data Understanding
Data Preparation
Evaluation
Deployment
Modelling
Fig. 2. Educational data mining structure (Llorente & Morant, 2009)
2.3 Information bits and pattern identification
The special importance of the proposed technique is that data mining is done at class-level and also at student-level, which permits the proper guide of the knowledge building process at personal level capturing and analysing individual bits of information. We could say that the technique is based on relationship mining, which main goal is to discover if there are relationships between variables in the data set saved containing a large number of bits of information. In this may we try to find out which variables are most strongly associated with a single variable of particular interest or discover which relationships between any two variables are strongest. Sequential pattern mining is interesting too. In this case, the objective is to find temporal associations between events, for example to determine which kind of student behaviours lead to an eventual event or result. The procedure for correcting the assessment on-line tests is, naturally, the individuation of right and wrong answers. The control panel system applies tailored deep data mining (Witten & Frank, 2005) to track the knowledge construction process of the alumni. This aims to monitor the results and the quality of the learning in the laboratory.
www.intechopen.com

New Fundamental Technologies in Data Mining
210
Usually the computer is the responsible for finding the patterns by identifying the
underlying rules and features in the data. In this case, data mining is applied over a large set
of variables which are tracked during a simple on-line exercise done at the end of the
laboratory lesson. As we said before, in data mining, the process of using a model to derive
predictions or descriptions of behaviour that is yet to occur is called "scoring". Following a
traditional analysis, a new model of database has to be built to score new data, or the data
has to be moved from relational tables. But the on-line application for laboratory test used in
this case records directly in a data base the obtained score of the alumni. This application
has been modified to include other parameters that are useful for data mining evaluation of
the results performance of the students. The bits of information considered for deep data
mining in this case can be classified in three levels depending on the complexity of the
relation that analyses: First level: Answer
- Answer: Selected answer. This value is the first one to be taken into account in order to
know if the answer provided by the student is correct or not. Afterwards other information
will be evaluated in order to find out the procedure the student followed to reach that
answer and elaborate the learning pattern. Second level: Timing
- Ts: Time spent by the student observing the question on-screen. This value can give the
lecturer an idea about if the group has discussed about the answer selection a lot of less
time. This parameter can have several meanings. For example, if the theoretical concept that
the question is addressing is well understood or should be recalled in the next lesson to be
clarified. Another meaning could be if the question is in a wrong format. This monitoring
can give the lecturer the opportunity of giving the students another question in the same
topic to observe the results and explain the concept again if necessary. Third level: Sequence
- Tr: Number of times the student has recalled the question to be presented in the screen.
This parameter includes at the background the internal relationships between the questions
presented to the students. If a question is recalled after answering it, the reason could be
because the students has understood the concept after solving a question that was presented
afterwards, and they want to change the previous selection.
- Ai: Number of times the studies has changed the answer. This parameter is related with the
two previous ones. The students can spend some time observing the question and if the
selected answer is changed many times it indicates that there is no agreement of all the
members of the group. This variable is related with Tr if the question is recalled after
answering.
- Seq_a: Sequence of answers selected by the student when changing the answer of a given
question. This is a very important parameter to be considered. Data mining studies can
point out if any question was wrong-answered but if the previous selected answers
contained the correct one. Moreover, it is interesting to consult this parameter if a question
has been recalled after answering it, because most of the times when an test answer is
changed the previously selected was the correct one.
- Seq_q: Sequence of questions requested by the student after the first presentation. This
parameter contains the questions the students wanted to recall after answering the complete
test.
- Lq: Last question answered by the student.
www.intechopen.com

Data Mining in Higher Education
211
Additional data gathered: - S1… SN: Individual scores per question. - S: Final score. The correlation of the different variables above is analysed in order to identify the bottlenecks or roadblocks in the student learning process. This is taken into account in the web application developed for the case study example explained in next point for laboratory evaluation purposes dealing with Fourier and Laplace domains in Telecommunication engineering. This on-line application includes a “control panel” of the subject which is presented in real-time to the lecturer during the realisation of the on-line exercise. This control panel is a translation of the business control panel that can be found in advanced business administration techniques. See by example (Romero et al., 2008).
2.4 Examination tool example
An e-learning tool has been developed targeting to solve the low assistance and relatively poor results obtained in laboratory sessions. The implemented tool combines adaptive examination with on-the-fly data mining techniques in the e-learning examination phase (Monk, 2005). The examination consists in an on-line exam for groups of two or three students to be done in the last 15 minutes of every laboratory session. The exam is composed on-the-fly by an examination server that chooses the questions from a question database, and saves the student results in a result database (answers and spent time are recorded). The results database is analysed by data mining and continually monitored in order to track the success rate of the different concepts addressed in the exam. If a particular concept is detected to be too difficult (a local minima during the data mining is identified), then the exam generator is instructed to go further, presenting questions with fine details to other students in order to identify the concept that has not been properly understood (Cheng et al., 2005). The examination tool has been implemented as a web application employing HTML and
JavaScript. Data storing, retrieval and analyse has been implemented employing ActiveX
Data Objects (ADO) modules for database access.
This technique was introduced for the first time in the academic year 2006/2007 in the
subject Análisis de Sistemas Contínuos (ASC), in Telecommunication Engineering studies at
the Escuela Politécnica Superior de Gandia (Universidad Politécnica de Valencia, Spain)
(www.epsg.upv.es). This subject (ASC) is a single term subject that became a keystone in
Telecommunication studies, as it includes basic circuit analysis in continuous time and the
Fourier and Laplace transforms tools.
ASC subject comprises 75 lecturing hours and provides the theoretical basis (80 % time) and
laboratory sessions (20 % time) deep into time invariant systems characterisation using the
impulse response, convolution operation, continuous time Fourier Transform, and signal
and system analysis in the Laplace domain. Interactive seminars are included as a part of
the theoretical classes to apply the explained concepts to solve a proposed problem. Using
this method students resolve proposed problems first as a team in the seminars, then with a
partner in the laboratory sessions, and finally during the lecturing via examples and in-class
resolved problems. This makes easier to the student to prepare this very problem-solving
oriented subject. The application was developed using Oracle Data Mining (ODM) software.
This software contains several data mining and data analysis algorithms for classify, predict,
clustering, and for making regression, associations and anomaly detection. This platform
provides means for the creation and management of data mining models inside a given
www.intechopen.com

New Fundamental Technologies in Data Mining
212
database. ODM simplifies model deployment by offering Oracle SQL functions to score data
stored right in the database. ODM is employed for extract the important information in the
control panel application developed for ASC laboratory evaluation. A first study identifies alumni who have the same doubts about the same topic, and generates the relation with the questions that have been answered correctly and wrong. Several functions and algorithms can be selected in ODM depending on the usage and the features of the data. Table 1 shows an example of the stored data for data mining evaluation. In this case five questions are presented and the different parameters described before are recorded in the database. In this case the control panel obtains the overall difficulty level of each question. Based on this results the cross correlation factor between the presented questions is obtained, as is shown for the same example in Table 2. The obtained cross correlation factor points out that the question Q3 is estimated of similar difficulty as Q5.
Question Q1 Q2 Q3 Q4 Q5
Ts (s) 154 132 214 202 197 Tr 3 1 5 3 2
Ai 0 0 1 0 1 Seq_a "1" "2-1" "1" "1" "3-2" Seq_q "1" "2" "3" "4" "3-5" Lq "1" "2" "3" "3" S 1 1 1 1 0 Difficulty Level 18.00 18.43 23.29 21.43 25.07
Table 1. Capture example of the stored data for data mining
Q1 Q2 Q3 Q4 Q5
Q1 1 Q2 1 Q3 1 1
Q4 1 Q5 1
Table 2. Cross correlation factor of the difficulty of the presented questions
This is particularly true in the case presented, as both question address Fourier Transform particular aspects. In particular, the questions were:
Q3: “Giving the coefficients of Fourier Series decomposition given below, indicate which of the signals presented in the figure corresponds with the original continuous-time signal.”
Q5:”Observe carefully the spectrum shown in the Figure below. This spectrum corresponds to a continuous signal. Indicate the number of sinusoidal signals present, their frequency, amplitude and phase.”
After the development of the data mining tool and the introduction of this panel, several bottlenecks in the subject taught were identified. Corrective lecturing actions like allocating more time for the Fourier Analysis lecturing, where introduced and the pass-rate of the laboratory work in the subject increased by in 37% the compared with the first year the laboratory work was introduced (academic year 2003/2004). This improvement has been
www.intechopen.com

Data Mining in Higher Education
213
sustained over time, as can be observed in the final marks historic series for the last four academic years shown in Fig. 3.
Pass
61.2%
Fail
8.8%
Pass
70.2%
Fail
29.8%
Pass
70.6%
Fail
29.4%
Pass
76.6%
Fail
23.4%
2005/2006 2006/2007 2007/2008
Pass
61.2%Fail
8.8%
2004/2005
Fig. 3. Evaluation results, before and after introducing the data mining tool
It should be pointed out that the introduction of the on-line evaluation tool in the laboratory in 2005/2006 made a 32% increase in attendance to the laboratory sessions, and 9% increase in alumni passing the subject. In 2007/2008 with the data mining tool a 6% increase was observed.
3. Data mining for collaborative learning
Cooperative learning is based in small teams conformed by students of different levels of ability that interact to improve their understanding of a subject. Each member of the group is responsible not only for learning what is taught but also for helping their team mates to learn. If cooperative learning is correctly structured, it engages people working in teams to accomplish a common goal, under conditions that involve both positive interdependence (all members must cooperate to complete the task) and both individual and group accountability (each member is accountable for the complete final outcome). But cooperative work is not achieved only having students sit side-by-side at the same desk. To be cooperative a group must have clear positive interdependence: members must promote each other's learning and face-to-face interaction. Interaction between teacher and students and between students plays a fundamental role in the whole learning process. In many cases also the practical application in the laboratory or in seminar activities of the notions acquired by the students constitutes a very important step.
3.1 Collaborative work
As previously discussed, it is important that the students develop working-in-group skills. This leads to incorporate practise lessons and discussion activities in Higher Education in order to introduce cooperative learning. In cooperative learning, the team members work together in the classroom for the success of their team and not only for individual success. Students have to get rid of its self-interest for the larger interest of the team. In order to achieve the goals, students have to assist and help each other to solve the problems. The members of the group have a positive interdependence on each other. By communicating with each other, they get to learn from their partners. Cooperative learning in the classroom has many advantages over the conventional or traditional ways of learning. The traditional ways of learning involves working individually without much interaction with other students. Using this technique probably the students will remain unaware of the new methods of problem solving. The quality of work reported delivered by students working in a group will better as compared to the students working individually. This is because in a group, every suggestion is cross-checked by the other members of the team which minimize the chances of errors.
www.intechopen.com

New Fundamental Technologies in Data Mining
214
Cooperative learning can also speed up the completion of the task as those working in a group will complete their work faster than those working individually. Moreover, working in group provides opportunities for developing the student generic and social skills such as organisation, team work, delegation, cooperation, gender and creativity (Gokhale, 1995). Group work can be used in engineering studies for introducing the students in real world work as it provides the opportunity to work in multidisciplinary teams. The aim of group work is to produce better results in presentations and reports. This is achieved combining the individual talent of each group member, contributing knowledge and ideas. Obviously, from the teacher point of view, it is mandatory to evaluate if the success of the work comes from the entire team and not to only from any particular member of the team, which is studied in this section.
3.2 Groupal assessment
In (Llorente & Morant, 2009) interactive groupal seminars were proposed for encouraging collaborative work. Based on this we can propose evaluation techniques in order to obtain a deeper knowledge of the skills acquired by the individual students, decorrelating the group evaluation scores from the actual individual score by different approaches. The groupal seminar technique proposed is shown in Fig. 4. and it is developed in four phases as:
Lecturer explanation
Work in groups to solve the problem
Give the solved problem to the lecturer
Solution explanation and problem check
Fig. 4. Proposed seminar technique
1. In the first part of the seminar the alumni listen to the lecturer explanation of theoretical concepts related with the problem that will be proposed afterwards. This focuses student attention on the material to be learned. In this phase the lecturer clearly defines the assignment, teaches the required concepts and strategies. It is needed to specify the positive interdependence and individual accountability and give the criteria for success.
2. In the second phase, the students work in group trying to solve the proposed problem. The group size is a factor to take into account. Smaller groups (of three students) contain less diversity of thinking styles and make more difficult the management (as it means that there will be a larger number of groups in the same class). Conversely, in larger groups it is difficult to ensure that all members participate (Gokhale, 1995). In this study the group were set up to five students.
This phase needs the organisation of the class to be changed. Effective classroom organisation maximises time spent on teaching and learning experiences by eliminating or minimising the distractions caused by behaviour problems. For this reason, during this phase the classroom organisation is changed as shown in Fig. 5. During the first phase of the seminar the classroom organisation remains as in a usual lesson, in order to make easier to the students attending the lecturer explanation. After the explanation, the placement of furniture is changed grouping 5 students in small clusters of desks to form different groups of work. This provides a separated area of work for each group of students (that facilitates small group cooperative learning) and ease of movement around the room for the teacher.
www.intechopen.com

Data Mining in Higher Education
215
L
S
L
S
|¢ ~
¡
Fig. 5. Plan view of the organisation of the class for the different phases of the seminar, L: Lecturer, S: Students. The numbers represents the different phases
3. In the third step of the seminar, the students give the solution of the proposed problem to the lecturer that will return it solved back in the next session.
4. The fourth and last phase consist in the exposition of the problem solution by the lecturer.
This technique can be used by the lecturers to monitor the quality of the results. In the last phase of the seminar the lecturer can go deeper in the concepts that were not clear during the development of the problem inside the group. In most of the cases, a group is comprised by students with different levels of ability and it is a challenge for the lecturer to evaluate individually each member. This can be solved using decorrelation techniques in the evaluation process. The herein proposed technique targets to obtain a deeper knowledge of the skills acquired by decorrelating the group evaluation scores evaluation from the individual scores by different approaches: Group score
The first decorrelation technique evaluates the results obtained by the group during the groupal seminar. In this score all group members are pooled together, taking into account the quality the intermediate steps used by the student to solve the problem (Si) and if the correct solution of the problem is achieved (Ss). Including this score in the evaluation process aims to promote a positive interdependence inside the group, as the team members perceive that they need each other in order to complete the group's task. This is important as it and avoids the effect of pseudo-learning group. The called pseudo-learning group effect occurs when students are assigned to work together but they have no interest in doing so. Sometimes students think that they will be evaluated by being ranked from the highest performer to the lowest performer, so they start competing between them. They see each other as a rival who must be defeated, and in this case, students would achieve better results if they were working alone. However, it would be not fair using only this score to evaluate the students, as remains the commented possibility of the work was left to one or a few students of the whole group. Cooperation is not assigning a task to a group of students where one or a few students do all the work and the others only put their names on the report as well. This is the reason why decorrelation techniques are needed to evaluate the individual members of the group. Individual participation A second technique is based on evaluating the participation of each student inside the group. This promotes face-to-face interaction, assessing the quality and quantity of each member's contributions to the group.
www.intechopen.com

New Fundamental Technologies in Data Mining
216
During the second phase of the seminar, the lecturer observes each group and records the frequency with which each member contributes to the group's work. Based on this information, the lectures assigns an individual score (Sp) to each student depending on its participation inside the group. The final score is given by the score obtained by the group presented solution weighted by the individual score Sf=Sp*(Si+Ss). Peer-to-peer student evaluation The third technique takes into account on peer-to-peer student evaluation at group level. Lecturers need to ensure that all the members of the cooperative learning group are involved in the task. Groups need to describe what member actions are helpful and unhelpful. This technique is based on each student gives a score to each student inside the same group. The lecturer provides time and a structure for the students of each learning group to process how effectively they have been working together. When a given score is recorded for the student in different groups, this correction factor is accurate. Percentile evaluation The last technique is based on a percentile evaluation for the group and session. In order to avoid conflicts in the group where some students can be too domineering or do not do their share of the work, the student groups must be different in each groupal seminar session. It is important to change student groupings frequently. This ensures each student interacts with different students throughout the semester. Small groups can be formed in different ways: randomly (i.e. by seat proximity), teacher-selected or student-selected. The individual scores are extracted from the percentile of the group scores over all sessions on different group environment. If a large number of scores are recorded, the final score of each student is precisely the percentile above the mean of the class.
3.3 Case study example
The case study was evaluated in the same subject in the Universidad Politécnica de Valencia UPV over three years involved with the interactive seminar technique: a preliminary period of a year without using this technique, and engagement with interactive seminars for two academic years comprising 406 students.
2004/2005 2006/2007
Pass 61.2% 70.6%
Fail 38.8% 29.4%
Pass
61.2%
Fail
38.8%
Pass
70.6%
Fail
29.4%
2006/20072004/2005
Fig. 6. Evaluation results of the subject ASC in the academic year 2004/2005 and 2006/2007
The introduction of the groupal seminar was reflected in an increase of 9.4% of the passing alumni (from 61.2 % to 70.6 % of the presented alumni) in the analysed year (2006/2007) over the first year of the curricula of the ASC subject was set (2004/2005). The feasibility of the groupal seminal method presented in this paper is demonstrated in a case study of 16 alumni in 3 seminar sessions in the academic year 2006/2007. In Table 3 are shown the alumni score of the proposed problem without employing these evaluation techniques, for shake of comparison the variance is obtained comparing with the practical online exam results.
www.intechopen.com

Data Mining in Higher Education
217
The seminar score of the problem is based on if the correct solution was achieved and, in this case, the score is recorded using a gradual scale of B (equivalent to 9 points), R+ (corresponding to 8 points), and R (to 6 points). In Table 3 can be observed that the variance compared with the results obtained in the practical online exam achieves values of even 0.88. For this reason the different decorrelation techniques should be used to improve the evaluation method of the seminar lessons.
Student Sp score
Seminar 1 Sp score
Seminar 2 Sp score
Seminar 3 Seminar
Mean Online Exam
Variance
#1 8 (R+) 8 (R+) 6 (R) 7.33 7.9 0.16 #2 6 (R) 8 (R+) 6 (R) 6.66 7.6 0.43 #3 9 (B) 8 (R+) 9 (B) 8.66 8.3 0.067 #4 8 (R+) 9 (B) 9 (B) 8.66 8 0.22 #5 9 (B) 8 (R+) 9 (B) 8.66 8.6 0.002 #6 8 (R+) 9 (B) 9 (B) 8.66 9.3 0.2 #7 6 (R) 9 (B) 6 (R) 7 5.8 0.72 #8 9 (B) 8 (R+) 9 (B) 8.66 8.6 0.002 #9 8 (R+) 8 (R+) 6 (R) 7.33 6.5 0.34
#10 9 (B) 9 (B) 9 (B) 9 9.3 0.045 #11 6 (R) 8 (R+) 9 (B) 7.66 8.6 0.43 #12 8 (R+) 8 (R+) 9 (B) 8.33 7.6 0.26 #13 8 (R+) 8 (R+) 9 (B) 8.33 9.6 0.8 #14 8 (R+) 8 (R+) 9 (B) 8.33 9.2 0.37 #15 8 (R+) 6 (R) 9 (B) 7.66 7.6 0.0022 #16 6 (R) 8 (R+) 9 (B) 7.66 9 0.88
Table 3. Case study: Seminar Session 1
In Table 4 are shown the results of the case study for two seminar sessions where the described decorrelation techniques have been implemented. These tables contain several data: • Group (G): Four groups were formed in each seminar session and labelled 1, 2, 3 and 4
respectively in order to obtain the mean score of the group and the percentile study. It can be observed that each student is in a different group in each session to ensure the percentile evaluation described before. • Si: Quality of the intermediate steps used by the student to solve the problem • Ss: Score of the problem considering if the correct solution was achieved. • Sp: Individual participation inside the group. This value is recorded by the lecturer during the seminar session. This parameter has a maximum value of 0.5. • Sf: Score obtained by the group presented solution weighted by the individual score Sf=Sp*(Si+Ss). • Peer-to-peer (P2P): Score given by each student to the other student inside the same group. The lecturer asks the student to record each score with an integer number. • Final (F): Final score of the seminar session. This score is weighted in this way: Final=0.6*Sf+0.4*P2P.
It can be observed in Table 4 that the peer-to-peer score has a high value in the first session. This is normal due to the general impression that this score could mask the final mark. For this reason the final score of the seminar is not obtained as the mean of the lecturer evaluation and the students’ evaluation. The final score is weighted to avoid that most popular students could achieve better scores for friendship.
www.intechopen.com

New Fundamental Technologies in Data Mining
218
Seminar Session 1 Seminar Session 2 Student
G Si Ss Sp Sf P2P F S1 G Si Ss Sp Sf P2P F S2
#1 1 10 8 0.4 7.2 9 7.92 4 9 8 0.4 6.8 7 6.88 #2 2 6.5 6 0.5 6.25 9 7.35 4 9 8 0.4 6.8 9 7.68 #3 3 9.5 9 0.4 7.4 8 7.64 4 9 8 0.4 6.8 9 7.68 #4 1 8.5 8 0.4 6.6 7 6.76 1 9.5 9 0.3 5.55 8 6.53 #5 3 9.5 9 0.4 7.4 8 7.64 3 9 8 0.4 6.8 8 7.28 #6 1 8.5 8 0.5 8.25 9 8.55 1 9.5 9 0.5 9.25 9 9.15 #7 2 6.5 6 0.3 3.75 7 5.05 1 9.5 9 0.3 5.55 7 6.13 #8 3 9.5 9 0.5 9.25 9 9.15 2 8.5 8 0.4 6.6 9 7.56 #9 1 8.5 8 0.3 4.95 7 5.77 2 8.5 8 0.3 4.95 8 6.17 #10 3 9.5 9 0.5 9.25 9 9.15 1 9.5 9 0.4 7.4 9 8.04 #11 2 6.5 6 0.5 6.25 9 7.35 2 8.5 8 0.5 8.25 9 8.55 #12 4 10 8 0.4 7.2 7 7.12 4 9 8 0.3 5.1 8 6.26 #13 4 10 8 0.5 9 9 9 3 9 8 0.5 8.5 9 8.7 #14 4 10 8 0.5 9 9 9 3 9 8 0.5 8.5 8 8.3 #15 4 10 8 0.4 7.2 7 7.12 2 6.5 6 0.4 5 7 5.8 #16 2 6.5 6 0.5 6.25 9 7.35 3 9 8 0.5 8.5 9 8.7
Table 4. Case study: Seminar Session 1 and 2
However, it can be observed in next tables that this impression changes and the students gives more realistic score to their partners.
Student Seminar 1 Seminar 2 Seminar 3 Seminar
Mean Online Exam
Variance
#1 7.92 6.88 6.96 7.25 7.9 0.20 #2 7.35 7.68 5.72 6.93 7.6 0.22 #3 7.64 7.68 7.64 7.65 8.3 0.20 #4 6.76 6.53 8.75 7.34 8 0.21 #5 7.64 7.28 9.15 8.02 8.6 0.16 #6 8.55 9.15 8.75 8.81 9.3 0.11 #7 5.05 6.13 5.32 5.5 5.8 0.045 #8 9.15 7.56 7.24 7.98 8.6 0.19 #9 5.77 6.17 5.72 5.88 6.5 0.18 #10 9.15 8.04 9.15 8.78 9.3 0.13 #11 7.35 8.55 8.04 7.98 8.6 0.19 #12 7.12 6.26 8.75 7.37 7.6 0.024 #13 9 8.7 9.15 8.95 9.6 0.21 #14 9 8.3 9.15 8.81 9.2 0.073 #15 7.12 5.8 8.04 6.98 7.6 0.18 #16 7.35 8.7 9.15 8.4 9 0.18
Mean 7.66 8.21 0.16
Table 5. Evaluation results and variance comparing with the practical online exam score
Table 5 summarizes the obtained results for the case study of 16 students in 3 seminar sessions. Comparing scores obtained from the groupal work including the correction by the four decorrelation techniques with the individual score obtained in the practical work score.
www.intechopen.com

Data Mining in Higher Education
219
This is a comparable measurement as the practical work score is obtained via an on-line exam almost at the same dates during the course progress. A maximum variance of 0.22 is obtained comparing the result of the decorrelating technique proposed with the practical on-line exam. The low variance obtained indicates the suitability of the approach proposed, compared with the results obtained without using the proposed decorrelation techniques shown in Table 3. The overall satisfaction of the alumni regarding groupal interaction has been as measured
by the “Instituto de Ciencias de la Educación” (ICE), an internal education-quality control
organism of the Universidad Politécnica de Valencia. The obtained results of satisfaction of
the alumni rose from 6.86 (over 10) to 8.24 points (over 10) in the academic year 2006/2007.
This means a 20.12% increase compared with the previous year.
4. Conclusion
In this chapter, deep data mining analysis applied to evaluation techniques in Higher Education was proposed as an assessment technique permitting to identify the learning pattern of each student according to the student profile. Data mining takes advantage of computer assisted evaluation techniques used in e-Learning. Data mining is applied to decorrelate the incomes in groupal activities such as laboratory lessons or seminars. Data mining for e-learning It has been presented that data mining can be applied over bits of information taken during the online evaluation. These small pieces of information can be classified in three levels depending on the complexity of the relation that analyses, mainly: answer, timing and sequence. The correlation of these bits of information can be analysed in order to identify the bottlenecks or roadblocks in the student learning process. Data mining for groupal assessment Data mining applied to groupal activities was also presented in order to decorrelate the inputs of each member of the group. Interactive groupal seminars were proposed as a problem-based evaluation method suitable for engineering studies. A case study over a real subject comprising laboratory lessons and seminar was presented confirming the validity of the proposed techniques to identify the learning pattern of the students. Further improvements can be introduced in the proposed techniques by using deeper data mining analysis and corrective techniques in the following years.
5. References
Beyerlein, S., Ford, M., & Apple, D. (1993) Using a Learning Process Model to Enhance Learning with Technology. Proceedings of Frontiers in Education Conference 1993, pp. 456-460, ISBN: 0-7803-1482-4, Washington, USA, Nov. 2003.
Cheng, S-C., Yueh-Min Huang, Y-M., Chen, J-N., & Lin., Y-T. (2005). Automatic Leveling System for E-Learning Examination Pool Using Entropy-Based Decision Tree. Advances in Web-Based Learning ICWL 2005, pp. 273-278, Springer.
European Commission (1999). The European Higher Education Area. The Bologna Declaration of 19 June 1999. Joint declaration of the European Ministers of Education. Available at http://ec.europa.eu/
Gallup Organization (2009). 2009 Eurobarometer survey on Higher Education reform among students. In: Eurobarometer surveys on Higher Education in Europe, March 2009,
www.intechopen.com

New Fundamental Technologies in Data Mining
220
available at the website: http://ec.europa.eu/education/higher-education/doc/studies/barometersum_en.pdf
Gokhale, A. A. (1995). Collaborative Learning Enhances Critical Thinking. Journal of Technology Education, Vol. 7, No. 1, ISSN 1045-1064, 1995.
Heiner, C., Baker, R. & Yacef, K. (2006). Preface in Proceedings of the Workshop on Educational Data Mining at ITS 2006, Jhongli (Taiwan), 2006.
Llorente, R. & Morant, M. (2009). Accurate knowledge evaluation by deep data-mining in telecommunication engineering studies. Proceedings of EAEEIE Annual Conference Innovation in Education for EIE, ISBN 978-84-8363-428-8, Valencia (Spain), June 2009, IEEE.
Llorente, R. & Morant, M. (2009). The control panel: a deep data-mining technique for the lecturing of engineering-related studies. Proceedings of INTED 2009, ISBN 978-84-612-7578-6, Valencia (Spain), March 2009, Ed. IATED.
Lupton, K. (2005). Portfolio versus syllabus methods in experiential education. Innovative Higher Education. Vol. 4, Number 2, pp. 114-126, DOI: 10.1007/BF01080440.
Merceron, A. & Yacef, K. (2005). Educational Data Mining: a Case Study. In: Artificial Intelligence in Education, IOS Press, ISBN 1-58603-530-4, Amsterdam (Netherlands).
Minaei-Bidgoli, B. ; Kashy, D.A.; Kortemeyer, G. & Punch, W.F. (2003). Predicting student performance: an application of data mining methods with the educational web-based system LON-CAPA. Proceedings of SEE/IEEE Conference 2003 ISBN 0-7803-7444-4, Boulder, CO, November 2003, IEEE.
Monk, D. (2005). Using Data Mining for e-Learning Decision Making. Electronic Journal of e-Learning, Vol. 3, Issue 1, pp. pp 41-54.
Petry, E. (2002). Architectural education: evaluation and assessment Proceeding of Frontiers in Education 2002, Vol. 2, ISBN: 0-7803-7444-4.
Rau W. & Heyl B. S. (1990). Humanizing the college classroom: Collaborative learning and social organization among students. Teaching Sociology, Vol. 18, pp. 141-155, American Sociological Association, April 1990.
Romero, C.; Ventura, S.; Espejo, P. & Hervas, C. (2008). Data mining algorithms to classify students. Proceedings of EDM 2008. pp. 182-185, ISBN 0-6153-0629-2, Montreal (Canada), June 2008.
Sharan, Y. & and Sharan, S. (1992). Expanding Cooperative Learning through Group Investigation, Ed. Teachers College Press, ISBN 0-8077-3190-0.
Smith, K. A. (1995). Cooperative Learning: Effective Teamwork for Engineering Classrooms. Proceedings of IEEE Frontiers in Education Conference, pp. 13-18, ISBN 0-7803-3022-6, Atlanta (USA), November 1995, IEEE.
Witten, I. H. & Frank, E. (2005). Data Mining: Practical Machine Learning Tools and Techniques, Ed. Morgan Kaufman, ISBN 0-12-088407-0, San Francisco, CA.
Zaïane, O. R. (2001). Web usage mining for a better web-based learning environment. Proceedings of Conference on Advanced Technology for Education 2001, pp. 60–64, Banff, AB, June 2001
www.intechopen.com

New Fundamental Technologies in Data MiningEdited by Prof. Kimito Funatsu
ISBN 978-953-307-547-1Hard cover, 584 pagesPublisher InTechPublished online 21, January, 2011Published in print edition January, 2011
InTech EuropeUniversity Campus STeP Ri Slavka Krautzeka 83/A 51000 Rijeka, Croatia Phone: +385 (51) 770 447 Fax: +385 (51) 686 166www.intechopen.com
InTech ChinaUnit 405, Office Block, Hotel Equatorial Shanghai No.65, Yan An Road (West), Shanghai, 200040, China
Phone: +86-21-62489820 Fax: +86-21-62489821
The progress of data mining technology and large public popularity establish a need for a comprehensive texton the subject. The series of books entitled by "Data Mining" address the need by presenting in-depthdescription of novel mining algorithms and many useful applications. In addition to understanding each sectiondeeply, the two books present useful hints and strategies to solving problems in the following chapters. Thecontributing authors have highlighted many future research directions that will foster multi-disciplinarycollaborations and hence will lead to significant development in the field of data mining.
How to referenceIn order to correctly reference this scholarly work, feel free to copy and paste the following:
Roberto Llorente and Maria Morant (2011). Data Mining in Higher Education, New Fundamental Technologiesin Data Mining, Prof. Kimito Funatsu (Ed.), ISBN: 978-953-307-547-1, InTech, Available from:http://www.intechopen.com/books/new-fundamental-technologies-in-data-mining/data-mining-in-higher-education