11 - Audit Commission Value for Money Profile Tool 1 Shropshire and Wrekin Fire and Rescue Authority...
35
11 1 Shropshire and Wrekin Fire and Rescue Authority Strategy and Resources Committee 18 September 2008 Audit Commission Value for Money Profile Tool 2008 Report of the Chief Fire Officer For further information about this report please contact Alan Taylor, Chief Fire Officer on 01743 260201. 1 Purpose of Report This report provides Members with details of the updated 2008 version of the ‘value for money profile tool’ recently provided by the Audit Commission to support their auditors in undertaking this years ‘use of resources’ and ‘direction of travel’ audits which form important parts of the fire and rescue performance assessment for 2008. 2 Recommendations The Committee is asked to: a) Note the findings of an analysis conducted by officers of the 2008 version of the ‘value for money profile tool’ provided by the Audit Commission; b) Determine whether they would wish to approve the proposed responses to auditors on behalf of the Fire Authority; c) If necessary, identify areas where they feel that further more detailed analysis would be beneficial; and d) Determine whether they would wish the findings of the analysis to be forwarded to the Audit Commission to assist with future improvement of the ‘value for money profile tool.’ 3 Background Members may recall that, during 2007, the Audit Commission made available two data tools which they used to support their work with Fire and Rescue Authorities (FRAs) and which formed an important aspect of their performance assessments in that year. The tools consisted of a ‘performance information profile tool’ (the updating of which is described in a separate paper to this Committee) and a ‘value for money profile tool.’
Transcript of 11 - Audit Commission Value for Money Profile Tool 1 Shropshire and Wrekin Fire and Rescue Authority...

11
1
Shropshire and Wrekin Fire and Rescue Authority Strategy and Resources Committee
18 September 2008
Audit Commission Value for Money Profile Tool 2008 Report of the Chief Fire Officer For further information about this report please contact Alan Taylor, Chief Fire Officer on 01743 260201. 1 Purpose of Report
This report provides Members with details of the updated 2008 version of the ‘value for money profile tool’ recently provided by the Audit Commission to support their auditors in undertaking this years ‘use of resources’ and ‘direction of travel’ audits which form important parts of the fire and rescue performance assessment for 2008.
2
Recommendations The Committee is asked to: a) Note the findings of an analysis conducted by officers of the 2008
version of the ‘value for money profile tool’ provided by the Audit Commission;
b) Determine whether they would wish to approve the proposed responses to auditors on behalf of the Fire Authority;
c) If necessary, identify areas where they feel that further more detailed analysis would be beneficial; and
d) Determine whether they would wish the findings of the analysis to be forwarded to the Audit Commission to assist with future improvement of the ‘value for money profile tool.’
3 Background
Members may recall that, during 2007, the Audit Commission made available two data tools which they used to support their work with Fire and Rescue Authorities (FRAs) and which formed an important aspect of their performance assessments in that year. The tools consisted of a ‘performance information profile tool’ (the updating of which is described in a separate paper to this Committee) and a ‘value for money profile tool.’

2
Members may also recall that in 2007, whilst the performance tool proved to be extremely useful, the value for money tool was deemed to be a major disappointment. It was found to contain un-evidenced generalisations throughout; to use time-limited Best Value Performance Indicator (BVPI) data to compare improvement; to contain financial information of doubtful validity; and, perhaps most importantly, the credibility of some of the comparisons chosen meant that a good opportunity for identifying areas where value for money could be improved appeared to have been missed. In consequence, and at the request of Members, the Chief Fire Officer wrote to the Audit Commission highlighting their concerns and received assurance from the Fire and Rescue Service National Policy Lead Officer that the Audit Commission recognised that there was still room for improvement with the tools, and would take on board their feedback.
4 Value for Money Profile Tool - 2008
On 4 September 2008 the updated ‘fire value for money profile tool’ was made available on the Audit Commission web site at
http://firevfm.audit-commission.gov.uk A copy of the ‘full report’ available from the tool is attached at Appendix A to this report. It should be noted that access to the tool on the web site allows more in depth analysis of the data behind the charts contained in the attached report.
5 Analysis of the Tool
In the ‘background’ information to the tool, the Audit Commission once again confirm its limitations with the following statement:
“The tool provides a starting point for discussions on value for money, not a definitive answer. The indicators selected for use in this tool are intended to give an overall picture of performance without giving particular weight to anyone particular aspect. It is emphasised that the tool is only one source of evidence and should not be considered in isolation.”
The indicators selected by the Audit Commission are listed below and a full analysis of each is included in Appendix B to this report. Overall Value for Money Cost per head of population Cost per head of population versus service assessment score (new) Cost per head of population and index of social deprivation Fire authority council tax precept versus public satisfaction (amended) Efficiency savings as a proportion of expenditure Increase in cost per head (new)

3
Community Fire Safety Value for Money Proportion of spending on community safety (new) Impact of fire prevention activity Accidental dwelling fires Home fire risk assessments and the change in accidental dwelling fires Smoke alarm installations and the change in deaths and injuries (amended) Community fire safety expenditure and the change in road traffic accidents Fire-fighting and Rescue Operations Value for Money Firefighting cost per head versus deaths and injuries (new) Operational appliances and the number of fire stations Operational capacity (amended) Support Services Value for Money Reallocated expenditure set against total expenditure
Appendix B to this report includes the chart for each indicator, followed by the brief commentary of the Audit Commission and, finally, the proposed response of Shropshire and Wrekin Fire Authority (SWFA). Members are asked to confirm, on behalf of the Fire Authority, that they approve for these responses to be provided to auditors who are due to carry out their ‘performance assessment’ of SWFA during the last week of September 2008.
In view of the findings of the analysis, it is anticipated that Members of the Committee will once again be generally disappointed with the value for money profile tool. There are clearly a number of improvements in the tool since last year including the introduction of a measurement which actually relates cost to quality i.e. the true measurement of value for money. Unfortunately, however, the majority of the benchmarking continues to be the same as last year and, as such, it has been necessary throughout the analysis to again highlight the strong limitations of the tool. Once again it appears that a good opportunity for identifying areas where value for money could be improved has been missed. Members are requested to identify any areas where they feel that further more in depth analysis is required. Also, to consider whether they wish the findings detailed in this report to be forwarded to the Audit Commission for use in improving the value for money profile tools.
6 Financial Implications
The financial implications arising from this report are as outlined within the report and its associated appendix.
7 Legal Comment
There are no direct legal implications arising from this report.

4
8 Equality Impact Assessment Officers have considered the Service’s Brigade Order on Equality Impact Assessments (Personnel 5 Part 2) and have decided that there are no discriminatory practices or differential impacts upon specific groups arising from this report. An Initial Equality Impact Assessment has not, therefore, been completed.
9 Appendices Appendix A Fire and Rescue Performance Assessment 2008 – Fire Value for Money Profile Tool. Full Report, Shropshire and Wrekin Fire Authority. Appendix B Analysis of Audit Commission Value for Money Profile Tool
10 Background Papers
Shropshire and Wrekin Fire Authority Strategy and Resources Committee, 2 October 2007 – Report 10 – Audit Commission Value for Money Profile Tool
Implications of all of the following have been considered and, where they are significant (i.e. marked with an asterisk), the implications are detailed within the report itself. Balanced Score Card Integrated Risk Management
Planning
Business Continuity Planning Legal * Capacity Member Involvement Civil Contingencies Act National Framework Comprehensive Performance Assessment * Operational Assurance Efficiency Savings * Retained Environmental Risk and Insurance Financial * Staff Fire Control/Fire Link Strategic Planning Information Communications and Technology
West Midlands Regional Management Board
Freedom of Information / Data Protection / Environmental Information
Equality Impact Assessment *

Fire and Rescue Performance Assessment 2008
Fire Value for Money Profile Tool
Full report
Shropshire and Wrekin Fire Authority
Report generated on 04 Sep 2008 at 17:02:48
- 1 -
syincely
Text Box
Appendix A to report on Audit Commission Value for Money Profile Tool 2008 Shropshire and Wrekin Fire and Rescue Authority Strategy and Resources Committee 18 September 2008

IntroductionFire and Rescue authorities (FRAs) collectively spend over £2 billion pounds per year. They are responsible for ensuring that they have put in place proper arrangements to secure economy, efficiency and effectiveness in its use of resources. The Audit Commission assesses that this is being achieved. To do this the Audit Commission needs to examine FRAs performance and financial management arrangements.
The Audit Commission currently provides this assurance through a combination of its audit work and the regular performance assessments. These assessments make use of an annual judgement made by auditors on how efficiently FRAs are using their resources, known as the use of resources assessment. There is a wealth of data available from which auditors are expected to draw their conclusions. This standard report has been produced to assist FRAs review their own performance as well as to support auditors by acting as an initial filter to help identify the key issues facing a particular FRA, which require explanation.
This data contained in this report are relevant to the Key Lines of Enquiry (KLOE) for use of resources assessments. Specifically KLOE 5.1 How well does the FRA currently achieve good value for money? Within KLOE 5.1. the data in this report is particularly relevant to two areas:
How well do the FRAs overall and service costs compare with others? and To what extent are costs commensurate with service delivery, performance and outcomes achieved?
This data should be used as the starting point for addressing these questions in any updates of a FRAs value for money assessment. Guidance and further details are contained in 'Guide to use of resources and key lines of enquiry' which can be found on the Audit Commission's web-site at www.audit-commission.gov.uk/fire.
This report also contains an appendix (Appendix 1) setting out some high level context information on the FRA.
For further details or queries about the VFM profiles contact the CPA enquiry line on 0845 052 2616 or register a query by using the web form available from www.audit-commission.gov.uk/performance/contactus-form.asp.
- 2 -

BackgroundWe issued VFM Profile Tools for use in the fire and rescue sector in 2006 and 2007 and consulted with internal and external stakeholders in February 2008. This tool is the result of that consultation. As in previous years, the fire tool uses outturn BVPI, CIPFA and CLG data in order to make comparison us up to date and meaningful as possible.
Value for money is about the relationship between costs and performance. We have used performance data collected from FRAs 2008 Best Value Performance Plans at 30 June 2008 and data obtained from the department for Communities and Local Government (CLG). The 2007/08 data is in the process of being validated by CLG and an updated version of the tool containing validated data will be considered before judgements are finalised. FRAs were asked to check the BVPI data extracted in July 2008. We have also used cost and contextual data obtained from CIPFA Statistics. IPF validated this data in July 2008 before passing it on to the Audit Commission.
The Value for Money Profile tool is designed to support judgements about FRAs effective use of resources as part of the use of resources assessment. It illustrates comparative performance of a selected FRA with all 45 other FRAs through 16 standard charts. We consulted the CIPFA Fire Statistics Working Party in our choice of charts. Comparisons in the charts are made against all FRAs.
Much of the information contained in the VFM profile refers to costs (£), that is to say the money that FRAs spent on their services each year. We express spending relative to population to make it easier to make comparisons between FRAs with different scales of operation. The information about spending used in this report is at higher level than unit costs. A unit cost is calculated by expressing spending relative to the number of units of service directly associated with that spending. As a result each item of planned spending will be directed to delivering more than one type of units of service. The CIPFA Statistical Information Service operated by IPF provides CIPFA subscribers with access to more detailed information about FRAs spending. The service can be accessed at www.cipfastats.net (external link).
The tool provides a starting point for discussions on value for money, not a definitive answer. The indicators selected for use in this tool are intended to give an overall picture of performance without giving particular weight to any one particular aspect. It is emphasised that the tool is only one source of evidence and should not be considered in isolation.
It is important to understand that this data should be used to help understand relative spending patterns and prompt questions and areas for further investigation or explanation. It does not provide direct answers to the key lines of enquiry questions. However, the next section provides commentary to help interpret each chart and make judgements on:
overall value for money; community fire safety value for money; fire-fighting and rescue operations value for money; and support services value for money.
- 3 -

Overall Value for MoneyCost per head of population
The chart is the traditional way in which costs are assessed in the fire and rescue service as it has been an established BVPI (BVPI 150) for many years. It is the total cost of all the FRAs services per head of population. It is simple and well-understood but it should not be viewed in isolation of the local context in which the FRA operates. There is a strong correlation between costs and deprivation. Moreover, some predominantly rural authorities are served primarily by retained fire-fighters and retained cover is considerably less expensive than full-time fire stations.
Cost per head of population versus service assessment score
The performance framework includes a service assessment of each FRA based on the operational assessment of service delivery undertaken by CLG in 2006 and the latest audited BVPIs adjusted where appropriate for deprivation. The Audit Commission published service assessment scores for each FRA in January 2007 and we regard this as the best available indicator of service quality. We would expect there to be a correlation between cost and quality and this chart maps BVPI 150 against the latest service assessment score using four quadrants.
- 4 -

Overall Value for MoneyCost per head of population and index of social deprivation
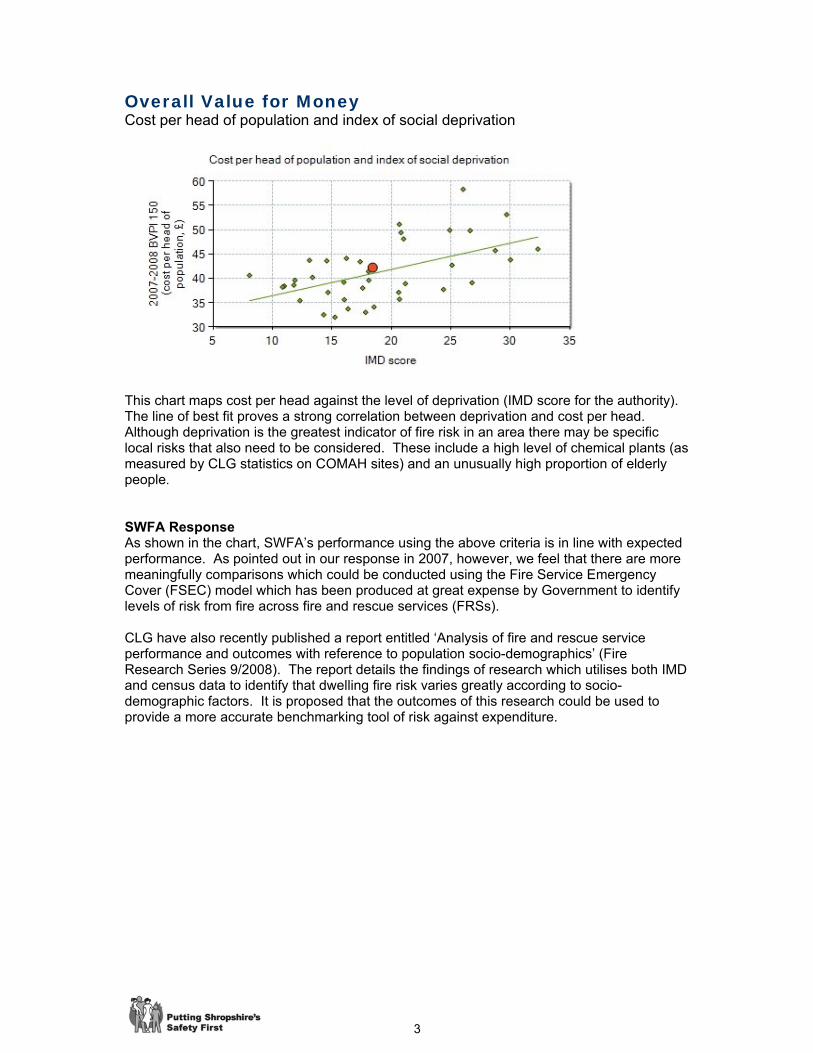
This chart maps cost per head against the level of deprivation (IMD score for the authority). The line of best fit proves a strong correlation between deprivation and cost per head. Although deprivation is the greatest indicator of fire risk in an area there may be specific local risks that also need to be considered. These include a high level of chemical plants (as measured by CLG statistics on COMAH sites) and an unusually high proportion of elderly people.
Fire authority council tax precept versus public satisfaction
The chart compares the council tax precepts of each FRA to the level of public satisfaction reported in BVPI 3 to reflect the actual value for money of the service to the local community. Since CLG funding is largely risk-based the residual cost recovered in council tax can be viewed as a proxy for cost per head adjusted for the level of fire risk. Thus, in some respects it may be a more accurate indicator of relative cost than BVPI 150. The Public may be prepared to pay more for a higher standard of service and there is a triennial satisfaction survey conducted by Opinion Research Services, which provides an indication of the perceived standard of service provided. This chart excludes county FRAs where there is no precept requirement. Each FRA has placed in a quadrant to aid comparison.
- 5 -

Overall Value for MoneyEfficiency savings as a proportion of expenditure
Data is currently unavailable for the chart illustrating Efficiency savings as a proportion of expenditure.
The chart expresses the sum of the last 3 years Gershon efficiency savings declared in backward-looking efficiency statements as a percentage of total expenditure. Some FRAs have implemented integrated risk management plans (IRMPs) that have delivered savings in excess of 10% of their budgets, usually through switching resources from response to prevention and providing the speed of response remains adequate this is a good indication of improved value for money. However, it can be difficult for a rural authority with few whole-time appliances to make the level of savings achieved in more urban areas.
Increase in Cost Per Head
This shows to what extent cost pressures are being controlled by measuring the change in BVPI 150 (cost per head of population) from 2006/07 to 2007/08. Some FRAs are making large efficiency savings but the money is being re-invested so their total costs are continuing to rise above inflation. Where this is the case, questions need to be asked about what service improvements can be linked to the investment. It will be insufficient to describe extra inputs such as new staff appointed without showing the value that these staff have added in terms of tangible outcomes.
- 6 -

Community Fire Safety Value for MoneyProportion of spending on community safety
Some FRAs have embraced the modernisation agenda more fully than others switching a significant proportion of resources from response to prevention. This chart illustrates the level of community safety expenditure relative to total spending. The chart has to be viewed with two qualifications in mind:
FRAs have adopted different means of re-allocating community safety work on stations from fire-fighting to community safety, although local auditors will have ensured that the approaches taken are reasonable when undertaking final accounts work in the summer of 2008; and
rural FRAs are likely to spend a lower proportion on community safety than urban ones because they will contain a large number of retained stations where fire-fighting staff are on call and only available for preventative work a few hours a week.
Impact of fire prevention activity
This chart in this section assesses the impact of fire prevention by comparing CFS expenditure per head with the reduction in primary fires over the past 3 years. This gives an indication of whether or not the large sums that most FRAs have re-directed in CFS in recent years have been properly targeted to maximise impact. Nationally, there have been significant falls in incident levels but this chart answers the question 'at what cost?' The data is presented in quadrant format.
- 7 -

Community Fire Safety Value for MoneyAccidental dwelling fires
The chart in this section concentrates specifically upon the reduction in accidental dwelling fires. This will help assess whether the FRA has a suitably balanced strategy that has achieved impact in reducing accidental as well as deliberate fires. The data is presented in quadrant format.
Home fire risk assessments and the change in accidental dwelling fires
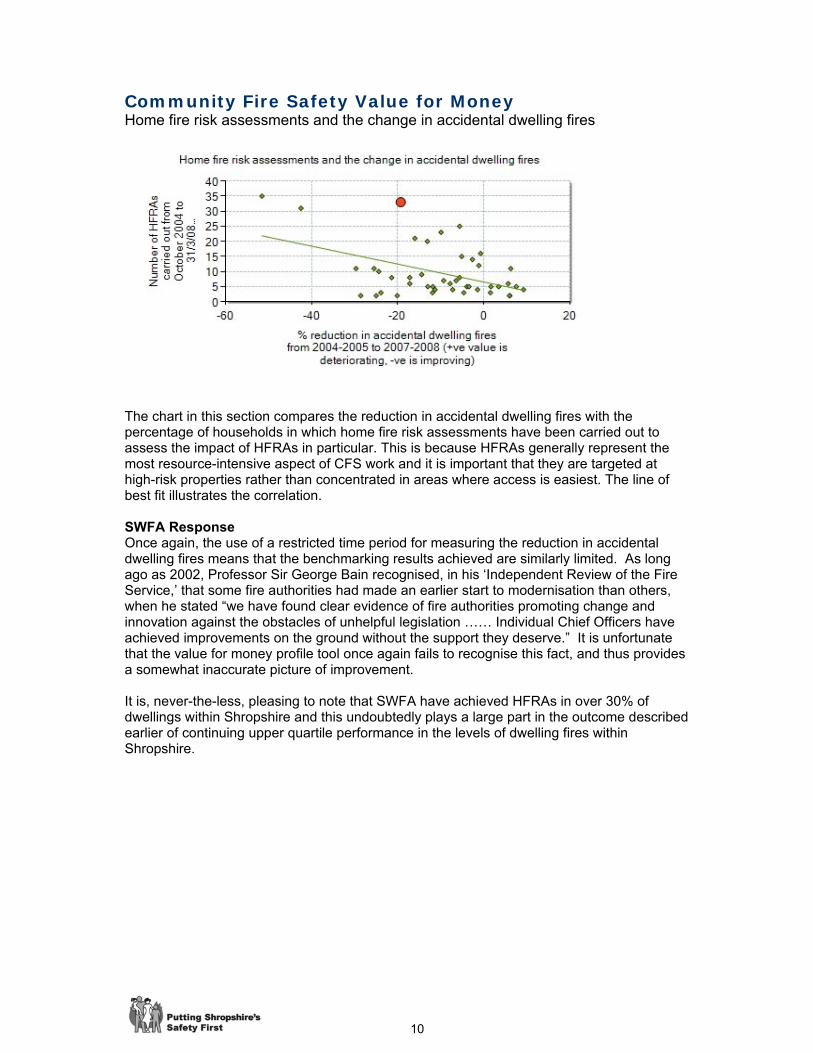
The chart in this section compares the reduction in accidental dwelling fires with the percentage of households in which home fire risk assessments have been carried out to assess the impact of HFRAs in particular. This is because HFRAs generally represent the most resource-intensive aspect of CFS work and it is important that they are targeted at high-risk properties rather than concentrated in areas where access is easiest. The line of best fit illustrates the correlation.
- 8 -
Community Fire Safety Value for MoneySmoke alarm installations and the change in deaths and injuries
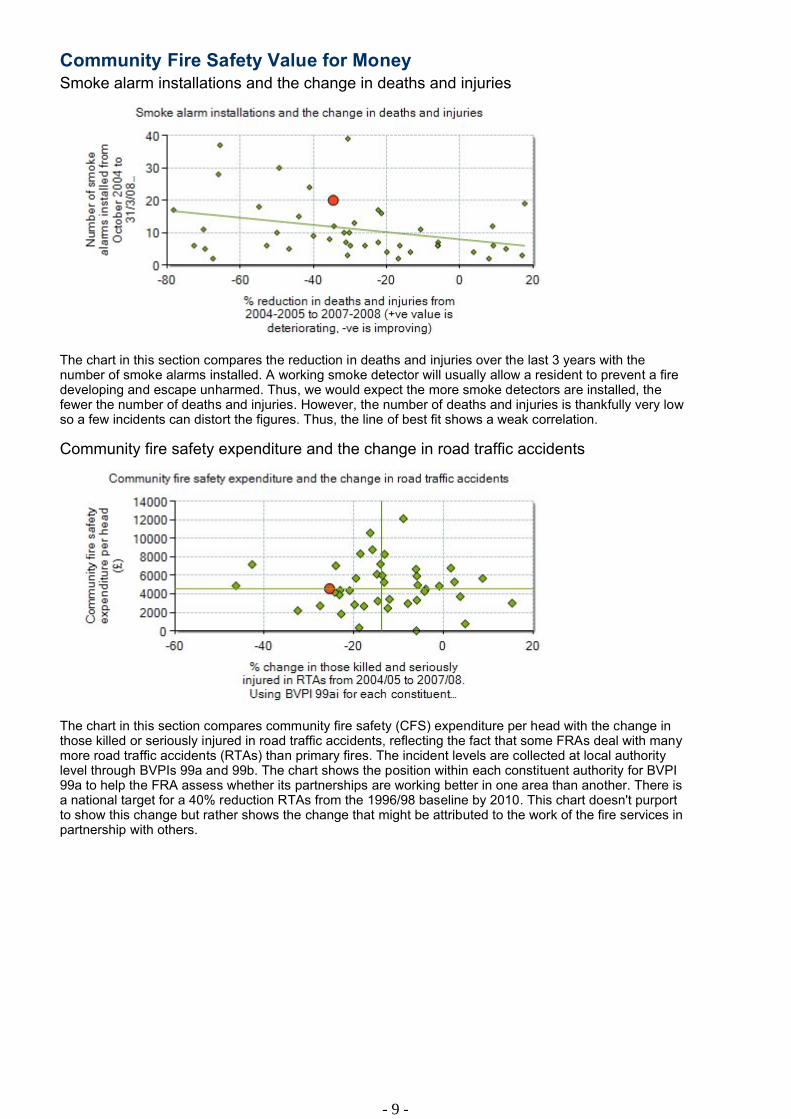
The chart in this section compares the reduction in deaths and injuries over the last 3 years with the number of smoke alarms installed. A working smoke detector will usually allow a resident to prevent a fire developing and escape unharmed. Thus, we would expect the more smoke detectors are installed, the fewer the number of deaths and injuries. However, the number of deaths and injuries is thankfully very low so a few incidents can distort the figures. Thus, the line of best fit shows a weak correlation.
Community fire safety expenditure and the change in road traffic accidents
The chart in this section compares community fire safety (CFS) expenditure per head with the change in those killed or seriously injured in road traffic accidents, reflecting the fact that some FRAs deal with many more road traffic accidents (RTAs) than primary fires. The incident levels are collected at local authority level through BVPIs 99a and 99b. The chart shows the position within each constituent authority for BVPI 99a to help the FRA assess whether its partnerships are working better in one area than another. There is a national target for a 40% reduction RTAs from the 1996/98 baseline by 2010. This chart doesn't purport to show this change but rather shows the change that might be attributed to the work of the fire services in partnership with others.
- 9 -

Fire-fighting and Rescue Operations Value for MoneyFire-fighting cost per head versus deaths and injuries
The first chart in this section shows that the majority of FRAs spending is still allocated to operational response and maps it using quadrant format to the summation of deaths and injuries per head in the last 3 years. Generally, high-spending services will have a greater degree of fire cover and thus faster response times to incidents. They may also have spent more on operational training. Thus, it is reasonable to expect overall casualty rates to be lower although there will be fluctuations from year to year.
Operational appliances and the number of fire stations
The second chart in this section provides a general indication of whether or not the number of operational appliances is appropriate by relating them to the number of stations. The information could be used to assist reviews of fire cover in the IRMP and identify scope for sharing specialist appliances with neighbouring authorities for example. The line of best fit illustrates the correlation.
- 10 -

Fire-fighting and Rescue Operations Value for MoneyOperational capacity
The third chart in this section is designed to assess crewing levels through comparing operational fire-fighter and operational appliance numbers. Many FRAs have made significant savings by reducing their ridership factor (essentially an allowance for unproductive time) or by reducing crewing levels on two-appliance stations to 4 and 4 (4 riders on each appliance rather than 4 on one and 5 on the other). The line of best fit shows the strong correlation between numbers of fire-fighters and appliances.
- 11 -

Support Services Value for MoneyReallocated expenditure set against total expenditure
The cost-effectiveness of support services can be measured by the percentage of expenditure that management and support service expenditure represents. Many FRAs provide most of their support services in-house or through a lead authority and have not formally considered whether these arrangements offer value for money. Others have undertaken best value and service reviews, outsourced support services and collaborated with other FRAs to exploit economies of scale. The local auditor will have a view on the performance of support services and Use of Resources scores for financial reporting, financial management and internal control will also help indicate the effectiveness of some support services (e.g. accountancy, internal audit).
Where the cost of support services is unexpectedly low or high the FRA should be asked to confirm that they have completed the RO forms used to construct CIPFA Statistics in accordance with the associated guidance. IPF found that this is a figure that is often calculated incorrectly and frequently results in queries during their validation processes.
- 12 -

Appendix 1 - Context InformationThe remaining information is intended to assist the understanding of the size, type and characteristics of the FRA to put all the standard charts in context. It is not intended to provide information on value for money but instead to ensure that these judgements are made in the proper context.
POPULATION Latest available figuresPopulation 451200Area in hectares 348756Population per hectare 1.3
FIRE STATIONS BY MANNING
Number as of 31/03/06
Number as of 31/03/07
Number as of 31/03/08
Estimated number as of 31/03/09
Whole Time 3 3 4 4Day (including nucleus) 0 0 0 0Retained 20 20 22 22Total Number of Fire Stations 23 23 26 26
APPLIANCES Number as of 31/03/06
Number as of 31/03/07
Number as of 31/03/08
Estimated number as of 31/03/09
Operational AppliancesPumping Appliances 28 28 28 28Aerial Appliances 2 2 2 2Total Operational Appliances 48 51 45 46
Non-Operational AppliancesTotal Reserve Appliances 4 5 5 5
PERSONNEL FTE FTE 31/03/06 FTE 31/03/07 FTE 31/03/08 Estimated FTE 31/03/09Total Whole-Time Fire-fighters 198 207 214 226Total Retained Fire-fighters 270 273 292 327Control Room Staff 17 19 20 17
- 13 -

Appendix 1 - Context InformationEXPENDITURE -
SUBJECTIVE ANALYSIS
2005/06 Outturn: Expenditure per 1,000 population
(£)
2006/07 Outturn: Expenditure per 1,000 population
(£)
2007/08 Outturn: Expenditure per 1,000 population
(£)
2008/09 Outturn: Expenditure per
1,000 population (£) (estimated)
EmployeesFull time Fire-fighters (whole-time) 14315 14417 15140 16248
Part time Fire-fighters (retained) 4749 5425 5578 6461
Control Room Staff 1235 1403 1423 1392Training Expenses 2150 397 2376 2613Total Employees Expenditure 28499 30391 32566 35348
Non-EmployeesTotal Non-Employees Expenditure 8680 8954 8930 8546
Total Expenditure 37179 39345 41496 43894Total Income -470 -577 -813 -459Total Net Expenditure on Service (Excl. Capital Charges)
36709 38768 40683 43435
OBJECTIVE ANALYSIS
as required by the BVACOP Cost of
Services
2005/06 Outturn: Expenditure per
1,000 population (£)
2006/07 Outturn: Expenditure per
1,000 population (£)
2007/08 Outturn: Expenditure per
1,000 population (£)
2008/09 Outturn: Expenditure per 1,000
population (£) (estimated)
Community Fire Safety 3745 4080 4563 5319
Fire Fighting and Rescue Operations 34387 34222 35829 38992
Fire Service Emergency Planning and Civil Resilience
0 0 0 0
Corporate and Democratic Core (if applicable)
962 1205 1281 667
Non Distributed Costs (if applicable) -329 0 0 0
Total Service Expenditure 38765 39507 41673 44978
- 14 -

Authorities used for the Comparison group All Fire and Rescue authorities within this report:
Avon Fire Authority Bedfordshire and Luton Combined Fire Authority Buckinghamshire and Milton Keynes Fire Authority Cambridgeshire and Peterborough Fire Authority Cheshire Fire and Rescue Authority Cleveland Fire Authority Cornwall Fire And Rescue Authority County Durham and Darlington Fire and Rescue Authority Cumbria Fire and Rescue Authority Derbyshire Fire Authority Devon Fire and Rescue Authority Dorset Fire Authority East Sussex Fire Authority Essex Fire Authority Gloucestershire Fire and Rescue Authority Greater Manchester Fire and Rescue Authority Hampshire Fire And Rescue Authority Hereford And Worcester Fire And Rescue Authority Hertfordshire Fire and Rescue Authority Humberside Fire Authority Isle Of Wight Fire and Rescue Authority Isles of Scilly Fire and Rescue Authority Kent And Medway Fire And Rescue Authority Lancashire Combined Fire Authority Leicester, Leicestershire and Rutland Combined Fire Authority Lincolnshire Fire Authority London Fire and Emergency Planning Authority Merseyside Fire And Rescue Authority Norfolk Fire And Rescue Service North Yorkshire Fire And Rescue Authority Northamptonshire Fire Authority Northumberland Fire Authority Nottinghamshire and City of Nottingham Fire and Rescue Authority Oxfordshire Fire Authority Royal Berkshire Fire Authority Somerset Fire and Rescue Authority South Yorkshire Fire and Rescue Authority Stoke on Trent and Staffordshire Fire and Rescue Authority Suffolk Fire Authority Surrey Fire and Rescue Authority Tyne and Wear Fire and Rescue Authority Warwickshire Fire and Rescue Authority West Midlands Fire and Rescue Authority West Sussex Fire and Rescue Authority West Yorkshire Fire and Rescue Authority Wiltshire And Swindon Fire Authority
- 15 -

Appendix B to Report on Audit Commission Value for Money Profile Tool 2008
Shropshire and Wrekin Fire and Rescue Authority Strategy and Resources Committee
18 September 2008
1
Analysis of Audit Commission Value for Money Profile Tool Overall Value for Money Cost per head of population
The chart is the traditional way in which costs are assessed in the fire and rescue service as it has been an established BVPI (BVPI 150) for many years. It is the total cost of all the FRAs services per head of population. It is simple and well-understood but it should not be viewed in isolation of the local context in which the FRA operates. There is a strong correlation between costs and deprivation. Moreover, some predominantly rural authorities are served primarily by retained fire-fighters and retained cover is considerably less expensive than full-time fire stations. Shropshire and Wrekin Fire Authority (SWFA) Response The commentary provided by the Audit Commission to support the above chart is identical to that provided with the 2007 Value for Money (VfM) Profile Tool. The response of SWFA therefore also remains largely unchanged from that provided in 2007. It is agreed that this is the traditional way in which costs are assessed and also that this indicator should not be viewed in isolation. For example, SWFA has for many years highlighted the fact that sparsity has a large impact upon the cost of providing a fire and rescue service, but that this is not recognised within the Formula Spending Share (FSS). The final sentence appears to imply that retained cover can only be provided in rural areas. This of course is not the case as is demonstrated by the fact that SWFA deploy retained appliances in both Shrewsbury (population 100,000) and Telford (population 160,000). What is undoubtedly true is that retained cover is considerably less expensive than wholetime (approximately one eighth of the cost per appliance). The fact that 23 out of SWFA’s 28 fire appliances are crewed by retained personnel is undoubtedly a major factor in maintaining below average costs despite the large size and rural nature of the county.

2
Overall Value for Money Cost per head of population versus service assessment score
The performance framework includes a service assessment of each FRA based on the operational assessment of service delivery undertaken by CLG in 2006 and the latest audited BVPIs adjusted where appropriate for deprivation. The Audit Commission published service assessment scores for each FRA in January 2007 and we regard this as the best available indicator of service quality. We would expect there to be a correlation between cost and quality and this chart maps BVPI 150 against the latest service assessment score using four quadrants. SWFA Response It is extremely pleasing to note that the Audit Commission regard the service assessment scores as the best available indicator of service quality. SWFA concur fully with this assessment and have derived a great deal of pride from the fact that, during the years which the service assessment has been conducted, the Authority has always achieved the very highest possible rating of 4 – Performing Strongly. To be consistently providing this level of service at average cost (as shown in the chart above) is considered to be the most valid evidence possible that, overall, SWFA are providing excellent value for money for the taxpayers of Shropshire and the Borough of Telford and Wrekin.
3
Overall Value for Money Cost per head of population and index of social deprivation
This chart maps cost per head against the level of deprivation (IMD score for the authority). The line of best fit proves a strong correlation between deprivation and cost per head. Although deprivation is the greatest indicator of fire risk in an area there may be specific local risks that also need to be considered. These include a high level of chemical plants (as measured by CLG statistics on COMAH sites) and an unusually high proportion of elderly people. SWFA Response As shown in the chart, SWFA’s performance using the above criteria is in line with expected performance. As pointed out in our response in 2007, however, we feel that there are more meaningfully comparisons which could be conducted using the Fire Service Emergency Cover (FSEC) model which has been produced at great expense by Government to identify levels of risk from fire across fire and rescue services (FRSs). CLG have also recently published a report entitled ‘Analysis of fire and rescue service performance and outcomes with reference to population socio-demographics’ (Fire Research Series 9/2008). The report details the findings of research which utilises both IMD and census data to identify that dwelling fire risk varies greatly according to socio-demographic factors. It is proposed that the outcomes of this research could be used to provide a more accurate benchmarking tool of risk against expenditure.

4
Overall Value for Money Fire authority council tax precept versus public satisfaction
The chart compares the council tax precepts of each FRA to the level of public satisfaction reported in BVPI 3 to reflect the actual value for money of the service to the local community. Since CLG funding is largely risk-based the residual cost recovered in council tax can be viewed as a proxy for cost per head adjusted for the level of fire risk. Thus, in some respects it may be a more accurate indicator of relative cost than BVPI 150. The Public may be prepared to pay more for a higher standard of service and there is a triennial satisfaction survey conducted by Opinion Research Services, which provides an indication of the perceived standard of service provided. This chart excludes county FRAs where there is no precept requirement. Each FRA has placed in a quadrant to aid comparison. SWFA Response This chart replaces that used in the 2007 VfM tool which used solely the fire authority council tax precept as a benchmark. Unfortunately, this comparison repeats the mistakes of last year in its assertion that CLG funding is largely risk-based. As such, it is necessary to repeat again that this is not the case and to repeat our comments of 2007 in evidence. It is strongly refuted that council tax precept levels in any way provide a more accurate indicator of relative costs than BVPI 150. In their White Paper published in 2003 entitled ‘Our Fire and Rescue Service,’ Government themselves very clearly recognised (pp.13-14) that resources were not always allocated on the basis of need. Changes to the Formula Spending Share (FSS) since 2006/07 have gone some way towards addressing this by, amongst other things, doing away with funding on the basis of the old national standards of fire cover, by recognising the increasing role of community fire safety work and by introducing a measure of funding based upon the level of property and societal risk in an area. More importantly, however, the distribution of funding based upon risk is currently far from being achieved due to the effect of flooring. As clearly described within SWFA’s Medium Term Financial Plan 2008/09 to 2011/12 (pp.30-31), even at the end of the current three year settlement (2012) SWFA will still have a shortfall in its funding from central government of £366,000 due to flooring. Thus, it can be demonstrated very clearly that CLG funding is not as yet ‘largely risk based’ and that this has a large detriment to council taxpayers in Shropshire as shown in the chart above.

5
Overall Value for Money Data is currently unavailable for the chart illustrating Efficiency savings as a proportion of expenditure. (Note: the following refers to the chart used in the 2007 VfM tool) The chart expresses the sum of the last 3 years Gershon efficiency savings declared in backward-looking efficiency statements as a percentage of total expenditure. Some FRAs have implemented integrated risk management plans (IRMPs) that have delivered savings in excess of 10% of their budgets, usually through switching resources from response to prevention and providing the speed of response remains adequate this is a good indication of improved value for money. However, it can be difficult for a rural authority with few whole-time appliances to make the level of savings achieved in more urban areas. SWFA Response In the absence of an up to date chart within the VfM tool it is difficult to comment upon SWFA achievements. It can be confirmed, however, that SWFA achieved their disaggregated share of the national fire service target for efficiencies i.e., £930,000 (5.67%) between 2004/05 and 2007/08. Additionally, it is pleasing to note that the Audit Commission have recognised that rural authorities with few wholetime appliances will find it more difficult to achieve savings than their counterparts in more urban areas. This was also recognised within the very first Fire and Rescue Service National Framework 2004-05 which stated that “the Government also recognised that the costs and savings of modernisation could fall unevenly across fire and rescue authorities.” This imbalance has, unfortunately, never been quantified and was not even referred to in the 2006-08 or 2008-11 versions of the National Framework.

6
Overall Value for Money Increase in Cost Per Head
This shows to what extent cost pressures are being controlled by measuring the change in BVPI 150 (cost per head of population) from 2006/07 to 2007/08. Some FRAs are making large efficiency savings but the money is being re-invested so their total costs are continuing to rise above inflation. Where this is the case, questions need to be asked about what service improvements can be linked to the investment. It will be insufficient to describe extra inputs such as new staff appointed without showing the value that these staff have added in terms of tangible outcomes. SWFA Response This is a new chart for 2008 within the VfM tool. The major investments made by SWFA continue to be into the Retained Service which has seen an increase in budget since 2006 of over £1 million per annum, i.e., over 5% of total budget. A summary of just some of the tangible outcomes achieved from this investment are as follows: Recruitment: RDS establishment increased by 31 Ffs (10%) during 2007
Year 2005 2006 2007 Number of RDS recruits 19 16 39 Number of RDS leavers 19 15 8 Establishment of RDS Firefighters 297 297 328
RDS Availability: Increased from 94% to almost 99% (only 6 hours now lost per day across 28 appliances)
Apr May June July Aug Sept Oct Nov Dec Jan Feb Mar
2007/08 97.1% 97.3% 97.4% 97.3% 96.1% 97.1% 97.9% 98.1% 98.2% 98.8%
98.7% 98.8%
2006/07 95.7% 94.3% 93.9% 94.7% 94.4% 96.5% 96.0% 96.5% 97.0% 97.0% 97.2% 97.1% Community Fire Safety: Vast improvements made in rural areas of Shropshire (confirmed by BVPIs) Year Home Safety Visits by RDS Staff Detectors Fitted by RDS Staff 2005/06 13,000 4,233 2006/07 28,389 12,025
In conclusion, focus and investment by Members of SWFA in their Retained Service has resulted in a much improved service to the public; particularly in rural areas. It has also demonstrated that this most cost effective means of providing fire cover remains fully viable!

7
Community Fire Safety Value for Money Proportion of spending on community safety
Some FRAs have embraced the modernisation agenda more fully than others switching a significant proportion of resources from response to prevention. This chart illustrates the level of community safety expenditure relative to total spending. The chart has to be viewed with two qualifications in mind: • FRAs have adopted different means of re-allocating community safety work on
stations from firefighting to community safety, although local auditors will have ensured that the approaches taken are reasonable when undertaking final accounts work in the summer of 2008; and
• rural FRAs are likely to spend a lower proportion on community safety than urban
ones because they will contain a large number of retained stations where fire-fighting staff are on call and only available for preventative work a few hours a week.
SWFA Response This is a further new addition to the VfM tool for 2008 and, whilst it could perhaps be argued that the extent to which FRAs have embraced the modernisation agenda is best measured by outcomes rather than expenditure, it is clear that SWFAs position is not out of line with other FRAs. This is particularly so in view of SWFAs large reliance upon Retained firefighters within most parts of Shropshire.

8
Community Fire Safety Value for Money Impact of fire prevention activity
This chart in this section assesses the impact of fire prevention by comparing CFS expenditure per head with the reduction in primary fires over the past 3 years. This gives an indication of whether or not the large sums that most FRAs have re-directed in CFS in recent years have been properly targeted to maximise impact. Nationally, there have been significant falls in incident levels but this chart answers the question 'at what cost?' The data is presented in quadrant format. SWFA Response The format or comment of this chart has not been revised from that used in 2007; the response of SWFA therefore remains the same also. There appear to be two major difficulties with the information portrayed in this chart. Firstly, the period over which the reduction in primary fires is measured appears to be very limited considering that this has been reported on as a BVPI since 2001/02. Secondly, it is clear from the chart that the expenditure figures used are inaccurate. With regard to the reporting against primary fires, the fact that the full 7 years of reporting is not used penalises SWFA strongly. Using CLG published BVPI data Shropshire’s performance is as shown below: Year BV 142(ii) No. of
primary fires per 10,000 population
% reduction on previous year
Cumulative reduction from 2001/02
Cumulative reduction from 2004/05
2001/02 36.2 2002/03 32.6 9.9% 9.9% 2003/04 28.7 12.0% 20.7% 2004/05 26.5 7.7% 26.8% 2005/06 24.9 6% 31.2% 6% 2006/07 25.0 -0.4% 30.9% 5.7% 2007/08 23.3 6.8% 35.6% 12.1% Thus, it can be seen that SWFAs early commitment to CFS means that the greatest part of its achievement to date in reducing primary fires was achieved in the period prior to that used in the chart above. With regard to expenditure on CFS, it is extremely unlikely that a spread of £19 (Northumberland) to £12,132 (Tyne and Wear) is accurate or realistic. The figures used are also very clearly not expenditure per head (£s). Variations in reporting and the unverified nature of the CIPFA statistics clearly continues to present problems for worthwhile benchmarking.

9
Community Fire Safety Value for Money Accidental dwelling fires
The chart in this section concentrates specifically upon the reduction in accidental dwelling fires. This will help assess whether the FRA has a suitably balanced strategy that has achieved impact in reducing accidental as well as deliberate fires. The data is presented in quadrant format. SWFA Response Once again the format and supporting comment with this chart have not been revised from the 2007 version and the response of SWFA therefore also remains very similar. As with the previous chart, the timescales for measuring improvement and the clear errors within the expenditure information raise serious issues of validity with this comparison. CLG published data demonstrates the following reductions in dwelling fires in Shropshire: Year BV 142(iii) No. of
accidental fires in dwellings per 10,000 dwellings
% reduction on previous year
Cumulative reduction from 2001/02
Cumulative reduction from 2004/05
2001/02 17.9 2002/03 15.3 14.5% 14.5% 2003/04 14.9 2.6% 16.8% 2004/05 15.0 -0.7% 16.2% 2005/06 14.4 4.0% 19.6% 4% 2006/07 13.1 9% 26.8% 12.7% 2007/08 12.1 7.6% 32.4% 19.3% This demonstrates clearly that the use of 2004/05 as the starting point for measuring reductions in accidental dwelling fires will penalise SWFA and other FRAs who commenced CFS activities many years before this date. This is further demonstrated by the Audit Commission’s Performance Information Profile tool which shows that (after adjustment for deprivation) SWFA have been in the highest quartile of performance for each of the last two years. As with the previous chart analysing the reduction in primary fires against CFS expenditure, the validity of the expenditure statistics is extremely questionable.
10
Community Fire Safety Value for Money Home fire risk assessments and the change in accidental dwelling fires
The chart in this section compares the reduction in accidental dwelling fires with the percentage of households in which home fire risk assessments have been carried out to assess the impact of HFRAs in particular. This is because HFRAs generally represent the most resource-intensive aspect of CFS work and it is important that they are targeted at high-risk properties rather than concentrated in areas where access is easiest. The line of best fit illustrates the correlation. SWFA Response Once again, the use of a restricted time period for measuring the reduction in accidental dwelling fires means that the benchmarking results achieved are similarly limited. As long ago as 2002, Professor Sir George Bain recognised, in his ‘Independent Review of the Fire Service,’ that some fire authorities had made an earlier start to modernisation than others, when he stated “we have found clear evidence of fire authorities promoting change and innovation against the obstacles of unhelpful legislation …… Individual Chief Officers have achieved improvements on the ground without the support they deserve.” It is unfortunate that the value for money profile tool once again fails to recognise this fact, and thus provides a somewhat inaccurate picture of improvement. It is, never-the-less, pleasing to note that SWFA have achieved HFRAs in over 30% of dwellings within Shropshire and this undoubtedly plays a large part in the outcome described earlier of continuing upper quartile performance in the levels of dwelling fires within Shropshire.

11
Community Fire Safety Value for Money Smoke alarm installations and the change in deaths and injuries
The chart in this section compares the reduction in deaths and injuries over the last 3 years with the number of smoke alarms installed. A working smoke detector will usually allow a resident to prevent a fire developing and escape unharmed. Thus, we would expect the more smoke detectors are installed, the fewer the number of deaths and injuries. However, the number of deaths and injuries is thankfully very low so a few incidents can distort the figures. Thus, the line of best fit shows a weak correlation. SWFA Response This chart replaces that used within the 2007 VfM tool which compared smoke alarm installations with changes in the number of primary fires. As such it provides a much more useful comparison but the limitations with regard to low numbers needs to be carefully noted. As with the charts relating to primary and dwelling fires described earlier, it is once again unfortunate that improvements are measured over only a limited timescale therefore penalising those FRAs who made an early start on modernisation.

12
Community Fire Safety Value for Money Community fire safety expenditure and the change in road traffic accidents
The chart in this section compares community fire safety (CFS) expenditure per head with the change in those killed or seriously injured in road traffic accidents, reflecting the fact that some FRAs deal with many more road traffic accidents (RTAs) than primary fires. The incident levels are collected at local authority level through BVPIs 99a and 99b. The chart shows the position within each constituent authority for BVPI 99a to help the FRA assess whether its partnerships are working better in one area than another. There is a national target for a 40% reduction RTAs from the 1996/98 baseline by 2010. This chart doesn't purport to show this change but rather shows the change that might be attributed to the work of the fire services in partnership with others. SWFA Response This chart and the associated comments are unchanged form 2007 and the comments of SWFA are therefore also very similar to those previously raised. Once again it is very difficult to find any useful information that can be drawn from this chart. The major questions appear to be: How many FRAs actually include expenditure on Road Traffic Collisions (RTCs) attendance or reduction within their CFS expenditure? This is certainly not the case in Shropshire where a separate RTC reduction budget has been established to enable improved cost/benefit work to be undertaken. What are the true levels of expenditure? Clearly those shown in the chart are inaccurate. Do any FRAs really deal with more RTCs than primary fires? How does the chart purport to show “the change that might be attributed to the work of the fire services in partnership with others?”

13
Fire-fighting and Rescue Operations Value for Money Fire-fighting cost per head versus deaths and injuries
The first chart in this section shows that the majority of FRAs spending is still allocated to operational response and maps it using quadrant format to the summation of deaths and injuries per head in the last 3 years. Generally, high-spending services will have a greater degree of fire cover and thus faster response times to incidents. They may also have spent more on operational training. Thus, it is reasonable to expect overall casualty rates to be lower although there will be fluctuations from year to year. SWFA Response This is a new chart for 2008. It appears to totally ignore the realities surrounding modernisation which have recognised for many years that protecting the public and reducing deaths and injuries is much more associated with effective community fire safety and prevention work than response times and training levels. It is indeed clear that high expenditure is linked to faster response times, but any link between faster response times and reduced deaths and injuries has not been proven. This appears to be confirmed by Shropshire’s own performance in the above chart. The highest response standard in Shropshire is 10 minutes with the majority of the County covered within 20 minutes, yet the rate of deaths and injuries is shown as the 5th lowest in England. Conversely, the five FRAs shown in the chart to have the highest levels of deaths and injuries are all Metropolitan FRAs who generally have the very fastest of attendance times (normally in the region of 5 minutes). The expenditure per head within the chart is once again confusing and clearly inaccurate.

14
Fire-fighting and Rescue Operations Value for Money Operational appliances and the number of fire stations
The second chart in this section provides a general indication of whether or not the number of operational appliances is appropriate by relating them to the number of stations. The information could be used to assist reviews of fire cover in the IRMP and identify scope for sharing specialist appliances with neighbouring authorities for example. The line of best fit illustrates the correlation. SWFA Response This chart and the associated comments are unchanged form 2007 and the comments of SWFA are therefore also very similar to those previously raised. It is very difficult to find any value at all in this comparison. How it can be used in any way at all to assist a review of fire cover through IRMP is unclear, as is its use in identifying scope for sharing special appliances. Shropshire’s figure of 26 fire stations is inaccurate (it ignores the fact that several of our stations are both wholetime and retained). The figure of 45 appliances is also very misleading and can be used as a good example of why this comparison is actually meaningless. The figures could easily relate to 45 appliances all crewed by wholetime personnel, in which case the annual cost purely of providing these resources would be expected to be in the region of £45 million. Alternatively, the 45 appliances could be 25 retained appliances and 20 support vehicles such as Ford Rangers. In this case the crewing costs are reduced to well below £3million. In actuality Shropshire’s figure is made up of 5 wholetime appliances, 23 Retained, 2 permanently crewed specials and a number of other emergency vehicles which are cost effectively crewed by Retained personnel only when they are required. There are very many much more useful comparisons of fire stations and appliances which could be made; just a few are listed below: Population per appliance Population per wholetime appliance Population per retained appliance Population per station (wholetime and retained) Hectares per station Hectares per appliance (wholetime and retained) etc etc

15
Fire-fighting and Rescue Operations Value for Money Operational Capacity
The third chart in this section is designed to assess crewing levels through comparing operational firefighter and operational appliance numbers. Many FRAs have made significant savings by reducing their ridership factor (essentially an allowance for unproductive time) or by reducing crewing levels on two appliance stations to 4 and 4 (4 riders on each appliance rather than 4 on one and 5 on the other). The line of best fit shows the strong correlation between numbers of fire-fighters and appliances. SWFA Response This chart and the associated comments are unchanged form 2007 and the comments of SWFA are therefore also very similar to those previously raised. Once again the comparison provided by this chart and the supporting data is, unfortunately, meaningless. The fact that the number of operational appliances used includes such a wide range of different resources, crewed in so many different ways, means that there is virtually no link to the crewing levels and ridership factor, which the chart purports to be comparing. A brief examination of some of the 45 operational appliances shown for SWFA illustrates the point as follows: 5 wholetime pumping appliances crewed at all times 23 retained pumping appliances 2 aerial appliances, one of which is crewed at all times 1 heavy rescue tender crewed at all times 5 Ford Rangers crewed by retained when required e.g. New Dimension incidents 1 Incident Response Unit crewed by wholetime only when required 1 High Volume Pump crewed by retained only when required 1 Heavy Pumping Unit crewed by retained only when required 1 Mini pumping unit crewed by retained only when required 1 Environment unit crewed by retained only when required 1 Boat crewed by wholetime only when required 1 Boat towing vehicle crewed by wholetime only when required Once again there are many other comparisons which could have provided much more useful information e.g., population per wholetime (or retained) pumping appliance, hectares per wholetime (or retained) pumping appliance, balance between wholetime and retained firefighters etc, etc.

16
Support Services Value for Money Reallocated expenditure set against total expenditure
The cost-effectiveness of support services can be measured by the percentage of expenditure that management and support service expenditure represents. Many FRAs provide most of their support services in-house or through a lead authority and have not formally considered whether these arrangements offer value for money. Others have undertaken best value and service reviews, outsourced support services and collaborated with other FRAs to exploit economies of scale. The local auditor will have a view on the performance of support services and Use of Resources scores for financial reporting, financial management and internal control will also help indicate the effectiveness of some support services (e.g. accountancy, internal audit). Where the cost of support services is unexpectedly low or high the FRA should be asked to confirm that they have completed the RO forms used to construct CIPFA Statistics in accordance with the associated guidance. IPF found that this is a figure that is often calculated incorrectly and frequently results in queries during their validation processes. SWFA Response SWFA have been commended by auditors on a number of occasions for the level of outsourcing which has been achieved and this chart does not appear to present any difficulties for the Fire Authority.