11-3 Securitization and Screening Incentives Evidence from ...
47
Securitization and Screening Incentives: Evidence from Mortgage Processing Time ∗ Dong Beom Choi † Jung-Eun Kim ‡ Abstract We test whether lenders’ screening incentives weaken when faced with the possibility of loan sales. We adopt a new measure of lending standards, mortgage application pro- cessing time at the loan level, and use the collapse of the non-agency mortgage-backed securities issuance market as a natural experiment. The event significantly reduced liq- uidity for non-conforming loans, but had little impact on conforming loans. Following the collapse, lenders spent significantly more time screening applications for loans larger than the conforming loan limits than those below. The processing time gap widened more for banks with lower capital, greater involvement in the originate-to-distribute model, and larger assets. Keywords: incentive misalignment, lending standard, loan sale, securitization, infor- mation production ∗ We thank Allen Berger, Nina Boyarchenko, W. Scott Frame, Paul Goldsmith-Pinkham, Itay Goldstein, Kevin Lansing, Igor Livshits, Elena Loutskina, Vladimir Kotomin, Donald Morgan, Sun Young Park, Philip Strahan, and Rob Vigfusson, as well as audiences at the 2019 Chicago Financial Institutions Conference, Korean Securities Association, 2019 FIRS, and 2019 Federal Reserve Research Scrum for their helpful com- ments. Dong Beom Choi was employed at the Federal Reserve Bank of New York while much of this work was completed. The views expressed in this paper are those of the authors and are not necessarily reflective of the views at the Federal Reserve Bank of Richmond, or the Federal Reserve System. Any errors are our own. This draft: August 2019 † Seoul National University (e-mail: [email protected]; Tel: 82-2-880-6955) ‡ Federal Reserve Bank of Richmond (e-mail: [email protected]; Tel: 1-704-358-2444)
Transcript of 11-3 Securitization and Screening Incentives Evidence from ...

Securitization and Screening Incentives:
Evidence from Mortgage Processing Time∗
Dong Beom Choi† Jung-Eun Kim‡
Abstract
We test whether lenders’ screening incentives weaken when faced with the possibility ofloan sales. We adopt a new measure of lending standards, mortgage application pro-cessing time at the loan level, and use the collapse of the non-agency mortgage-backedsecurities issuance market as a natural experiment. The event significantly reduced liq-uidity for non-conforming loans, but had little impact on conforming loans. Followingthe collapse, lenders spent significantly more time screening applications for loans largerthan the conforming loan limits than those below. The processing time gap widenedmore for banks with lower capital, greater involvement in the originate-to-distributemodel, and larger assets.
Keywords: incentive misalignment, lending standard, loan sale, securitization, infor-mation production
∗We thank Allen Berger, Nina Boyarchenko, W. Scott Frame, Paul Goldsmith-Pinkham, Itay Goldstein,Kevin Lansing, Igor Livshits, Elena Loutskina, Vladimir Kotomin, Donald Morgan, Sun Young Park, PhilipStrahan, and Rob Vigfusson, as well as audiences at the 2019 Chicago Financial Institutions Conference,Korean Securities Association, 2019 FIRS, and 2019 Federal Reserve Research Scrum for their helpful com-ments. Dong Beom Choi was employed at the Federal Reserve Bank of New York while much of this workwas completed. The views expressed in this paper are those of the authors and are not necessarily reflectiveof the views at the Federal Reserve Bank of Richmond, or the Federal Reserve System. Any errors are ourown. This draft: August 2019
†Seoul National University (e-mail: [email protected]; Tel: 82-2-880-6955)‡Federal Reserve Bank of Richmond (e-mail: [email protected]; Tel: 1-704-358-2444)

1. Introduction
Do lenders screen borrowers less carefully when loans are to be sold in a secondary market?
This long-standing question dates back to Pennacchi (1988) and has attracted greater atten-
tion following the recent mortgage crisis. Modern banks shifted their business model from
originate-to-hold, where lenders originate loans with the intention of holding them on their
balance sheets, to originate-to-distribute (OTD), where lenders originate loans with the in-
tention of selling them to a third party. This transition was expedited by the securitization
booms, first led by Fannie Mae and Freddie Mac in the 1980s and 1990s, and then by pri-
vate securitizers in the 2000s. Academics, policymakers, and critics have widely argued that
banks’ dependence on the OTD model is responsible for the explosion of low-quality mortgage
originations prior to the Great Recession, since it promotes lenders’ moral hazard through
limited exposure to downside risks. However, empirical assessment of this claim is extremely
challenging because there is no credible measure of screening intensity and lenders’ adoption
of the OTD model is endogenous.1
In this study, we examine whether the availability of liquid secondary markets reduces
lenders’ incentive to collect and produce information (i.e., less thorough screening) at the
underwriting stage, using a novel micro-level measure of lenders’ screening efforts. Using the
confidential version of Home Mortgage Disclosure Act (HMDA) data, we calculate the number
of days lenders spent on each individual mortgage, tracking the time between the date of mort-
gage application and the date of origination approval. This loan-level application processing
time should reflect lenders’ information production process and thus lending standards, as
an approval decision should take longer if more information is collected or the application is
examined more thoroughly, all else being equal. Our new measure cleanly captures lenders’
actions at the underwriting stage, and is independent of any factors that accrue after loan
origination, such as changes in economic conditions or borrowers’ economic decisions. Hence,
1In their seminal and influential study, Keys et al. (2010) use a specific rule of thumb that creates adiscontinuity in the ease of securitization across an arbitrary credit score threshold (i.e., the 620 cutoff). Theythen examine loan performance around the threshold to infer changes in lending standards.
1

compared to ex-post measures such as loan performance, it allows us to more directly eval-
uate the magnitude of the incentive misalignment problem at the ex-ante screening stage.
It furthermore provides richer variation across loans than performance measures with binary
outcomes or the level of documentation that are analyzed in prior studies. Our study also
extends and complements the prior studies that mostly focus on riskier mortgages (e.g., sub-
prime or low documentation), suggesting that the incentive misalignment problem is more
prevalent.
Lender screening efforts can vary depending on certain loan features. For instance, orig-
inators may spend less effort screening an application if they can easily sell the loan. This
is because (i) they have fewer incentives to collect soft information that is hard to transfer
to potential buyers; and (ii) an incentive misalignment problem arises because of the lack of
“skin-in-the-game” (see, e.g., Pennacchi (1988), Gorton and Pennacchi (1995), Parlour and
Plantin (2008), and Ahnert and Kuncl (2019) for theoretical models). If this is the case, we
anticipate that lenders will spend less time processing applications for loans that are more
likely to be sold on the secondary market.
We examine lenders’ incentives in the prime mortgage market, whereas previous loan-
level studies mainly analyze the screening incentives within the subprime mortgage market
(see, e.g., Keys et al. (2010), Rajan et al. (2015)).2 To identify the causal effect, we exploit
the unique institutional features of this market segment. Conforming loans that meet the
government-sponsored enterprise (GSE) guideline can be bought and securitized by GSEs,
but non-conforming loans that do not meet the guideline can only be privately securitized.
For prime mortgages, a loan for an amount under the conforming loan limits (CLLs), called a
“non-jumbo” mortgage, can be acquired by GSEs and securitized as agency mortgage-backed
securities (MBSs); by contrast, a loan for an amount above the CLLs, called a “jumbo”
mortgage, is not eligible for GSE acquisition and can only be securitized privately as non-
2See Agarwal and Ho (2007), Mayer et al. (2009), and Keys et al. (2012) for a comparison between theprime and subprime markets.
2

agency MBSs.3
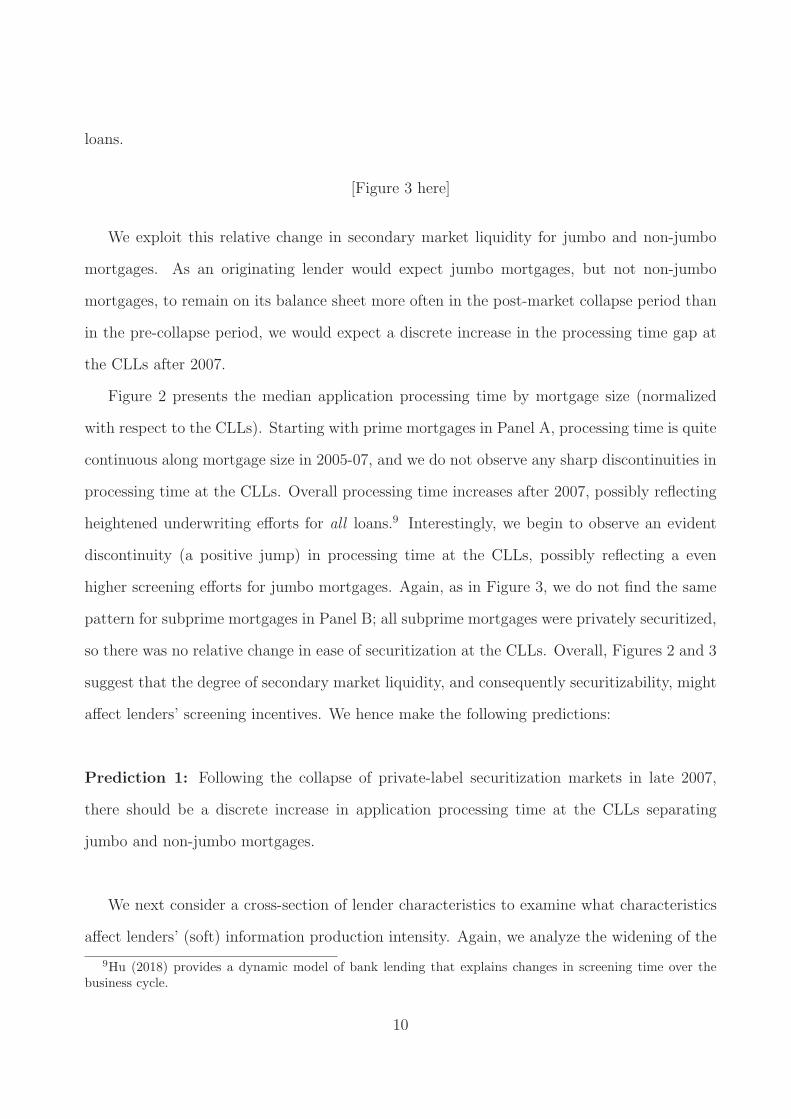
The collapse of private-label securitization in late 2007 affected secondary market liquidity—
and thus ease of securitization—in these two mortgage market segments differently. As seen
in Figure 1, non-agency MBS issuance practically ceased after 2008, but the crisis had little
impact on agency MBS issuance. Hence, secondary market liquidity for jumbo mortgages
subsequently dried up, while secondary market liquidity for non-jumbo mortgages was not
affected, as GSEs continued to purchase them.
[Figure 1 here]
The processing time for loan applications becomes a function of underlying loan character-
istics when it reflects originator lending standards. Riskier loans may require more thorough
screening and thus longer processing times. If larger loans are riskier for lenders, they will
screen applications for larger amounts more carefully. Thus, we can naturally expect pro-
cessing time to increase continuously in loan size, all else being equal. However, processing
time can change discontinuously at some loan characteristic threshold if screening incentives
change discretely at that threshold. If the ease of securitization affects screening incentives,
processing time should jump upward at the CLLs after the market collapse.
We first examine whether there is a discrete gap in application processing time at the CLL
thresholds and how this gap evolved as the relative liquidity of the two secondary markets
changed over time. Panel A of Figure 2 plots application processing time against mortgage
size bins by year from 2005 to 2009. Note that we do not observe an obvious discrepancy in
processing time around the CLLs until 2007; however, we find a significant increase in this gap
for 2008 and 2009, potentially reflecting the drying-up of secondary market liquidity for jumbo
mortgages. Interestingly, we do not observe such patterns for subprime mortgages (Panel B
of Figure 2): in this market segment, all loans needed to be securitized privately, regardless
of their size relative to the CLLs.
3See also, e.g., Loutskina and Strahan (2009), Kaufman (2014), Fuster and Vickery (2014), and Adelinoet al. (2014), which exploit this discontinuity.
3

[Figure 2 here]
We confirm this pattern by estimating the gap in loan-level processing time above and
below the CLLs for each year, using the universe of HMDA data from 2005 to 2009. We
include lender, county, and calendar-month fixed effects, which allows us to control for lender-
, local-, and macro/season-specific factors that affect the processing time of all loans. As a
result, we can compare the difference in screening time for applications above and below the
CLLs for a given lender in each local market in a given month. We find that lenders spent
extra time processing jumbo mortgages only after 2007 (about 20 days in 2008 and 10 days
in 2009), suggesting that the possibility of eventual loan sales affected lenders’ incentives of
soft information production.
However, this interpretation is subject to critical endogeneity concerns as borrowers are
not randomly distributed across the CLLs—they rather choose how much to borrow and tend
to bunch just below the CLLs (Kaufman (2014), Fuster and Vickery (2014), Adelino et al.
(2014), and DeFusco and Paciorek (2017)). Hence, rather than more information production
and thorough screening, longer processing time for jumbo mortgages after 2007 might simply
reflect riskier borrower characteristics such as higher loan-to-value (LTV) ratios (Kaufman
(2014)) or lower FICO scores (Fuster and Vickery (2014)) that we do not control for due
to data limitations. To address this concern, we examine whether this discrete widening in
processing time at the CLLs is larger for “treated” lenders.
We combine the HMDA data with the Federal Reserve’s quarterly Report of Condition and
Income (Call Report) data, allowing us to match processing time with bank characteristics.
We then define three sets of treated groups—banks with (i) lower capital, (ii) a higher tendency
to originate-to-distribute, and (iii) larger assets (i.e., non-“community banks”). First, thinly
capitalized banks have lower capacity and appetite for risk and would adopt tighter lending
standards for loans they intend to keep on their balance sheets. Second, banks that do not
typically distribute loans after originating them should not be affected as much by the changes
in secondary market liquidity. Finally, as smaller community banks tend to specialize in
4

collecting and analyzing soft information (Berger et al. (2005)), they would need less additional
time than larger banks when such information becomes necessary.
We examine whether the processing time gap at the CLLs widened more for these treated
banks after the market collapse in late 2007. Our main identification assumption of this triple-
difference regression is that the bias from borrower selection did not change disproportionately
between the treatment group and the control group post-treatment. Our panel regression
results confirm the hypothesized relationship between lenders’ screening incentives and loan
sales.
Our loan-level dataset allows us to include various fixed effects (e.g., lender identity, mort-
gage location, and calendar time) and implement a tight comparison of processing time be-
tween two types of loans. Since our focus is on the discrete change in processing time at
the CLLs, as a robustness check, we limit our sample to mortgages that are around (within
+/- 20% of) the CLLs and find similar results. We also conduct a placebo test based on the
“wrong” thresholds—80% of the actual CLLs—and use mortgages around (within +/- 20%
of) these thresholds. Here, we do not find any of the results that we previously found.
We last examine the (non-confidential) HMDA/McDash matched dataset to confirm that
the longer processing time we observe after 2007 indeed reflects tighter lending standards,
rather than distinct borrower characteristics caused by borrowers’ selection (higher risk loan
requiring more screening). Note that our empirical test cannot adequately control for bor-
rower risk characteristics because HMDA does not provide credit scores, LTV, or performance
history after origination at the loan level. As discussed previously, our estimates would be bi-
ased if jumbo mortgage borrowers after 2007 had significantly lower credit scores, higher LTV
ratios, or defaulted more than borrowers of non-jumbo mortgages. However, our examination
of the matched dataset does not support this selection argument.
This paper is related to the literature on loans sales and lender incentives. Pennacchi
(1988), Gorton and Pennacchi (1995), and Parlour and Plantin (2008) provide theoretical
5

models relating secondary market loan sales to lenders’ moral hazard. Following the recent
financial crisis, a number of empirical studies find that securitization distorted lender incen-
tives and contributed to the origination of low-quality mortgages. Keys et al. (2010) analyze
whether securitization reduces screening incentives using data on securitized subprime mort-
gage loans and their default rates, and Keys et al. (2009) study how regulations affect this
moral hazard. Purnanandam (2010) finds a stronger effect of securitization on low quality
mortgage originations for capital-constrained banks and OTD intensive banks. We confirm
his finding, which is based on bank-level information, by using loan-level data on lending
standards with the kink at the CLLs and a natural experiment. Rajan et al. (2015) argue
that securitization induces lenders to put more weight on hard information and less weight
on soft information. Relatedly, Piskorski et al. (2010) and Agarwal et al. (2011) analyze how
securitization affects loan renegotiation, and Loutskina and Strahan (2009) and Loutskina
(2011) study how it affects credit supply. Finally, Mian and Sufi (2009), Dell’Ariccia et al.
(2012), Nadauld and Sherlund (2013), and Jiang et al. (2014), among others, also study the
relationship between securitization and the subprime crisis.
This paper is also related to the literature on information production and lending. Stein
(2002) analyzes the role of organizational structures in information production when soft in-
formation cannot be credibly transmitted. Berger and Udell (2002) and Berger et al. (2005)
find that small banks are better able to collect and utilize soft information than big banks.
Petersen and Rajan (2002) and Agarwal and Hauswald (2010) analyze the relation between
physical distance and soft information acquisition. Loutskina and Strahan (2011) examine
the relation between geographic diversification and information collection. We adopt a novel
micro-level measure that captures the scale of information production and exploit a natu-
ral experiment, to test whether market liquidity or bank characteristics affect information
production.
Previous studies using HMDA data often adopt mortgage application approval decisions
(i.e., loan denial rates) as a measure of lending standards (see, e.g., Loutskina and Strahan
6

(2011), Dell’Ariccia et al. (2012), Dagher and Kazimov (2015)). One of the limitations of this
measure is that the application pools are not exogenous; an econometrician might observe
more frequent approvals when a lender receives only high-quality applications, even though
the lender actually tightened its lending standards. Furthermore, HMDA does not provide
critical borrower characteristics, such as FICO scores and LTV, that would alleviate this bias
in the unobservables. Our study attempts to address this concern by focusing on the processing
time only for approved applications, excluding any denied applications. If the processing time
for an approved application closely reflects the number of steps a loan officer would take
before making an approval decision, it should capture the underlying screening efforts and
information production, and be independent of the quality of the overall application pool.
However, processing time could also be affected by lenders’ operating capacity (Choi et al.
(2017), Fuster et al. (2017)). If this is the case, a specific application’s processing time is
affected by the pool of applications that the lender receives. We overcome this issue by
focusing only on the gap at the CLLs, exploiting a unique institutional feature of the prime
mortgage market while isolating any variation in processing time that affects all mortgages
with fixed effects. We further exploit cross-lender variations to better account for the possible
bias from the unobservables.
2. Research Design
We examine the impact of loan sales on lenders’ screening incentives using loan-level mortgage
processing time, which is the number of days between mortgage application and mortgage orig-
ination (i.e., the approval decision). Our underlying assumption is that this processing time
for an originated (i.e., approved) mortgage application reflects the lender’s screening efforts
and information production—the higher the underwriting efforts, the more soft information
is produced and the longer the approval process takes.4
4One of the most time consuming process is the back and forth between the borrower and the lender.The Wall Street Journal reports that lenders “required a borrower to mail things like W2s, pay stubs
7

If there were no secondary market for loan sales, all loans would be expected to remain
on lenders’ balance sheets. If this were the case, there would be no reason to observe a
discrete change in processing time along certain loan characteristics, such as loan size, LTV,
or loan-to-income (LTI) ratios; the processing time should be a continuous function of these
characteristics, unless there are fixed guidelines imposed by the lender’s management.
With a secondary market for loan sales, however, lenders’ underwriting efforts could dif-
fer for loans they intend to sell to a third party. Unlike hard information that is easily
verifiable, it is difficult to reliably transmit soft information to secondary market investors.
Thus, lenders might have fewer incentives to collect soft information if such efforts are not
appreciated (priced) by investors (Stein (2002), Rajan et al. (2010), Rajan et al. (2015)).5
Moreover, incentive distortion becomes more severe due to limited skin-in-the-game, partic-
ularly if lenders have fewer reputation concerns (e.g., if they sell loans to buyers with whom
they have no relationship), leading them to adopt less stringent lending standards (Pennacchi
(1988), Gorton and Pennacchi (1995), Parlour and Plantin (2008)). As a result, all else being
equal, processing times for loans to be sold should be shorter than those for loans to be kept
on lenders’ balance sheets.6
The recent growth in securitization significantly increased secondary market liquidity for
loan sales. Focusing on prime mortgages, one determinant of securitizability is loan size, as
ease of securitization differs across a size threshold called the CLLs.7 Loans for an amount
and tax returns to a loan officer and the loan officer had to manually inspect the paperwork, then letthe borrower know what was missing” (see https://www.wsj.com/articles/feeling-the-need-the-need-for-speed-11553618025?mod=hp major pos23). Another time consuming process is scheduling in-person appraisals.Underwriters also started to ask for much more detailed property appraisals after the Great Recession, requir-ing more photos or more details about the properties. Along with the appraisals taking a longer time, theincreased amount of overall information in applications would result in more time to process the collected in-formation. See https://www.washingtonpost.com/news/where-we-live/wp/2015/08/10/why-home-appraisals-take-so-long-and-what-you-can-do-about-it.
5Begley and Purnanandam (2016) find that this information friction can be alleviated through securitydesign, i.e., by having securitization deal sponsors retain the equity tranche at issuance.
6On the contrary, if buyers in the secondary market demand more stringent requirements than a lenderwould otherwise adopt (i.e., more hard information collection or documentation), it is also possible thatprocessing time becomes longer for loans to be sold than for those to be held on the balance sheet (Keys et al.(2012)).
7The Federal Housing Finance Agency (FHFA) publishes the CLLs annually. The CLLs have increasedover time, reflecting higher house prices. They used to be constant across the US but have begun reflecting
8

smaller than the CLLs, referred to as “non-jumbo” mortgages, can be sold to GSEs and
securitized as agency MBSs, while loans for an amount greater than the CLLs, referred to
as “jumbo” mortgages, cannot be acquired by GSEs and can only be securitized through
private institutions as non-agency MBSs. As these two types of mortgages are liquidated
in the different secondary markets, lenders may wish to produce different amount of soft
information for them, mostly generating hard information for conforming loans following the
GSE guidelines, but producing more soft information for jumbo loans. If this is the case, there
should be a discrete change in processing time at the CLLs as lenders adopt very different
screening standards. We first examine the time-series variation of this gap.
The collapse of private-label securitization markets in late 2007 provides a unique oppor-
tunity to test the existence of differential lending standards and their relationship to securi-
tizability; secondary market liquidity for loan sales practically dried up for jumbo mortgages,
while it was virtually unaffected for non-jumbo mortgages. Non-agency MBS issuances essen-
tially ceased during the Great Recession, but agency MBS issuances by GSEs did not change
drastically (Figure 1). Figure 3 presents the historical trends of mortgage securitization for
jumbo and non-jumbo mortgages separately. Focusing on prime mortgages, Panel A shows
the number of originated and securitized mortgages, and Panel B compares yearly securiti-
zation ratios, defined as the ratio of the total number of mortgages sold in the secondary
market8 to the total number of mortgages originated in that year. A noticeable trend is the
significant decrease in jumbo mortgage originations and securitization after 2007, a pattern
we do not observe for non-jumbo mortgages. Panel C presents the same ratios as in Panel
B for subprime mortgages, using the CLL to define the corresponding (artificial) jumbo and
non-jumbo subgroups within the subprime group. Here, neither the jumbo nor non-jumbo
group is eligible for GSE acquisition, and these subprime loans are securitizable only through
private institutions. Both ratios plunged after 2007, unlike what we saw in Panel B for prime
regional differences in house prices since 2008.8For each loan, a lender reports Code 0 under the “type of purchaser” if the loan is not sold in that calendar
year, or the buyer type (Codes 1 - 8) if it is sold.
9
loans.
[Figure 3 here]
We exploit this relative change in secondary market liquidity for jumbo and non-jumbo
mortgages. As an originating lender would expect jumbo mortgages, but not non-jumbo
mortgages, to remain on its balance sheet more often in the post-market collapse period than
in the pre-collapse period, we would expect a discrete increase in the processing time gap at
the CLLs after 2007.
Figure 2 presents the median application processing time by mortgage size (normalized
with respect to the CLLs). Starting with prime mortgages in Panel A, processing time is quite
continuous along mortgage size in 2005-07, and we do not observe any sharp discontinuities in
processing time at the CLLs. Overall processing time increases after 2007, possibly reflecting
heightened underwriting efforts for all loans.9 Interestingly, we begin to observe an evident
discontinuity (a positive jump) in processing time at the CLLs, possibly reflecting a even
higher screening efforts for jumbo mortgages. Again, as in Figure 3, we do not find the same
pattern for subprime mortgages in Panel B; all subprime mortgages were privately securitized,
so there was no relative change in ease of securitization at the CLLs. Overall, Figures 2 and 3
suggest that the degree of secondary market liquidity, and consequently securitizability, might
affect lenders’ screening incentives. We hence make the following predictions:
Prediction 1: Following the collapse of private-label securitization markets in late 2007,
there should be a discrete increase in application processing time at the CLLs separating
jumbo and non-jumbo mortgages.
We next consider a cross-section of lender characteristics to examine what characteristics
affect lenders’ (soft) information production intensity. Again, we analyze the widening of the
9Hu (2018) provides a dynamic model of bank lending that explains changes in screening time over thebusiness cycle.
10

processing time gap at the CLLs after 2007, but our focus here is examining how this divergence
varies across lenders. We limit our comparison to bank lenders who file Call Reports.
We first examine the effect of bank capitalization on this widening. We predict that banks
adopted similar lending standards for non-jumbo loans by, for instance, mechanically follow-
ing a GSE guideline. We also predict that banks with low capitalization adopted stricter
lending standards, particularly during the Great Recession, for loans they intended to hold on
their balance sheets; these banks should have a reduced risk appetite or risk-taking capacity
during the crisis. Hence, we predict that banks with low capitalization experienced a greater
widening in processing times at the CLL after 2007.
Prediction 2: The gap in processing time for jumbo and non-jumbo mortgages widened after
2007, widening even more among banks with low capital.
We next examine the impact of bank business models (i.e., differential levels of loan sales
activity across banks). For banks that are not typically active in the secondary market for
loans, the two types of mortgages should have few differences below and above the CLL, as
they intend to keep both types on their balance sheets. Hence, we expect less divergence in
the processing time gap between jumbo and non-jumbo mortgages after 2007 for these banks,
as changes in secondary market liquidity should matter less for them. However, for banks with
business models based on selling loans on the secondary market, changes in securitizability
should matter more. Thus, the gap in processing time between jumbo and non-jumbo mort-
gage applications should have widened more for these banks after 2007, while there should
not have been a significant widening in this gap for banks that tend to keep loans on their
balance sheets.
Prediction 3: The gap in processing times for jumbo and non-jumbo mortgages widened
after 2007, particularly among banks with an OTD-based business model.
11

Last, we examine the differential effect by bank size. One cause of the differential process-
ing time between loans to be held on the balance sheet and those to be sold in the secondary
market is soft information acquisition—lenders collect more soft information for the former
than the latter. After the market collapse in late 2007, all banks faced a drying-up of secondary
market liquidity for jumbo mortgages regardless of asset size. If this reduced liquidity had
affected lenders’ information production incentive, after 2007, all banks would have needed
to evaluate additional soft information when they originated jumbo mortgages. However,
this additional task should take less time for “community” banks for several reasons. First,
community banks might already possess more soft information about their local markets and
customers than larger banks, thus facing a lesser need to collect it from scratch. Second,
they might also be more specialized in analyzing soft information (Stein (2002), Berger and
Udell (2002), Berger et al. (2005)). Finally, big banks faced more regulatory scrutiny after
the crisis, which led them to tighten their lending standards even more than smaller banks.
As a result, large bank loan officers might have needed to spend even more time on screening
jumbo mortgage applications after 2007 as compared to small community bank loan officers,
before approving the applications.
Prediction 4: The gap in processing times for jumbo and non-jumbo mortgages widened
after 2007, widening more among large banks than small community banks.
3. Data
We use confidential HMDA loan application data from 2005 Q1 to 2009 Q4 to construct
loan-level data on lender application processing behavior. According to the Federal Financial
Institutions Examination Council (FFIEC) HMDA reporting guide, the confidential HMDA
data provides the exact loan application and decision dates (approved or denied), while the
12

publicly available HMDA data only reports the year of mortgage originations.10 Knowing
the exact dates of applications and approval decisions enables us to construct a loan-level
“Processing Time” variable that reflects lenders’ screening incentives and scale of information
production, defined by the difference between the two dates.11
We impose the following restrictions in constructing our loan sample from the HMDA to
make processing time more directly comparable across applications. First, we only include first
lien conventional mortgages (non-FHA, non-VA) for one- to four-family properties. Second, we
exclude subprime mortgages, as the treatment across different loan sizes only applies to prime
mortgages.12 Third, we only include approved loans and exclude denied applications because
the application review process might progress differently (e.g., using a different timeline) for
denials, and we also exclude loans that we observe to be “pre-approved.” Fourth, we focus
on home-purchase mortgages, excluding refinances.13 Last, we exclude observations with
Processing Time greater than the 99.9 percentile and restrict the sample to loans for amounts
between $100,000 and $1,000,000.
We construct two datasets. The first dataset includes all applications in the HMDA data,
subject to the restrictions above. This dataset covers both bank and non-bank lenders and
includes loan-level information on lender identity, processing time, mortgage location, origi-
nation month, loan size, and borrowers’ LTI ratio. The second dataset matches a 10 percent
random sample of the aforementioned loan-level data from the HDMA data with lender char-
acteristics from the Call Report using the origination quarter and the lender entity. Therefore,
10See https://www.ffiec.gov/hmda/pdf/2013guide.pdf, or https://www.federalreserve.gov/files/pia hmda.pdf.11Choi et al. (2017) and Fuster et al. (2017) use the same measure to capture lender operating capacity, and
Fuster et al. (2018) use it to capture origination efficiency. Note that we focus on within lender variation toisolate lending standards, while these papers analyze across lender variation.
12There is no data field in HMDA that explicitly distinguishes prime loans from subprime loans. However,there is a field (“rate spread”) that shows how much the interest spread of a loan exceeds the prevailing rate,but only if the spread is equal to or greater than certain thresholds. Hence, loans with this field populatedwith a positive value are regarded as higher risk, likely subprime loans, and thus are excluded in our estimationsample. We assume any non subprime loans to be prime loans. One limitation of this selection is that it maynot cleanly exclude Alt-A loans in the sample. Nevertheless, this limitation would bias our estimates in theopposite direction of our hypotheses. Our results are similar when we define subprime loans using the HUDsubprime lender list.
13See the end of Section 3 for more discussion on this selection.
13

we retain only bank lenders that file Call Reports in this sample. We combine subsidiaries
into a holding company, our unit of analysis, when applicable.14 Bank characteristics include
the banks’ Total Assets (natural logarithm), Liquid Asset Ratio (sum of cash, fed funds lend-
ing and reverse repos, and securities holdings divided by total assets), Loan to Deposit Ratio
(total loans divided by total deposits), RE Loan to Total Loan Ratio (real estate loans divided
by total loans), CI Loan to Total Loan Ratio (commercial and indistrial loans divided by total
loans), NPL ratio (non-performing loans divided by total loans), Tier 1 Capital Ratio (tier
1 capital amounts divided by risk-weighted assets), and Securitization Ratio.15 We exclude
bank-quarters where the change in total asset size exceeds 10 percent to account for mergers as
in Campello (2002). Independent variables are winsorized at the 0.5 percent and 99.5 percent
levels.
In Table 1, we report the summary statistics of the loan level sample and loan-bank
matched sample, which are used in the empirical analyses. Panel A shows the averages of
Processing Time measured in number of days, Loan Size in USD, and LTI ratio by origination
year, by Jumbo dummy, and by origination year and Jumbo dummy. Overall by origination
year, it is noteworthy that the average processing time lengthens in years following the crisis.
In general, between jumbo loans and non-jumbo loans, jumbo loan applications’ processing
time is longer than that of non-jumbo loan applications. Finally, if we look at the overall time
trend in loan processing time by Jumbo dummy, the increase in processing time for jumbo
loans after the crisis is much larger in magnitude than the increase for non-jumbo loans, from
54.70 days in 2007 to 74.91 days in 2008 and from 42.69 days in 2007 to 48.15 days in 2008,
respectively.
[Table 1 here]
14Specifically, we first merge the Call Report data with HMDA through bank RSSD IDs. We then aggregateall subsidiaries of a bank into a top holder. For banks that have the Call Report item RSSD9348 (RSSD ID ofthe top holder) populated, we aggregate the bank-level variables by RSSD9348. For banks that do not havethe RSSD9348 field populated, we use their Call Report data and interpret these as stand-alone commercialbanks.
15Securitization Ratio is calculated from the HMDA as the number of loans sold through the end of theyear divided by the number of loans originated in that year. This is a yearly variable because the data fieldindicating whether a loan is sold for securitization as of year-end is calculated on a yearly basis.
14

Panel B presents the loan characteristics and bank characteristics from the loan-bank
matched sample. Considering a banks’ financial condition might affect the behaviors of loan
application processing, we control for the various bank characteristics in the empirical analyses.
Panel C shows the pairwise correlations between the three bank dummy variables that
are used in the triple-difference empirical tests in Section 4.2: LowCapl equals 1 if the tier 1
capital ratio of lender l, as of 2007Q4, belongs to the lowest quartile and 0 otherwise; OTDl
equals 1 if lender l’s 2005-07 securitization ratio belongs to the top quartile and 0 otherwise;
LARGEl equals 1 if lender l’s total assets as of 2007Q4 are greater than $10 billion and 0
otherwise. This is to ensure that the three different subsamples of banks do not actually
consist of a very similar set of banks. As we can observe in the pairwise correlations table,
although the correlations are positive, they do not seem to be high, indicating that the three
bank dummy variables are identifying banks quite independently.
We distinguish home purchase mortgages and refinancing mortgages, and only use home
purchase mortgage applications. Our conjecture is that the processing time for home purchase
applications would better reflect underlying screening efforts while processing time for refi-
nancing applications would not be as informative. Home purchase mortgage originations more
often require collecting information from scratch, while more information should already be
available for refinancing applications, especially if the current mortgage was originated by the
same lender. Even when a refinancing application is screened by a different lender, if the new
lender assumes the original lender collected enough information during its initial origination
decision process, the record of loan approval and performance should give the lender a fair
amount of information. Hence, if refinancing origination decisions were more heavily based
on hard information (which includes the payment history conditioned on the previous ap-
proval decision) and require less acquisition of incremental soft information, we would expect
differing screening incentives to create a bigger gap in processing times for home purchase
mortgages as compared to refinances. In sum, we anticipate clearly observing the predicted
patterns discussed in Section 2 for home purchase mortgages, but these would be less obvi-
15

ous for refinance mortgages; we therefore focus on home purchase mortgages throughout our
empirical tests.
4. Empirical Results
4.1. Year by Year Regression
We first utilize the entire HMDA data, including both bank and non-bank lenders. While
HMDA lacks important loan-level information such as LTV ratios or interest rates, it still
allows us to control for loan size, location, borrower income, lender identity, and calendar time.
We include time, lender, and location fixed effects in our loan-level regression. Effectively, this
allows us to compare processing time across mortgages for the same lender within a county
in a given year, after isolating differential conditions across geographic markets and seasons.
For each year from 2005 to 2009, we estimate the following regression:
yiclm = αl + αc + αm + β ∗ Jumboiclm + γ ∗Xi + εiclm, (1)
where the dependent variable is processing time (days spent, i.e., Processing Time)16 for
mortgage i located in county c originated by lender l in the m-th month of that year. αl,
αc, αm are fixed effects for lender, county, and calendar-month. These fixed effects should
absorb lender-, local-, and macro/season-specific factors affecting the general processing time
of mortgage applications, such as economic conditions, general risk management, or operating
capacity.17 Jumboiclm takes a value of 1 if loan i’s size is greater than the CLLs and is
otherwise 0. Xi is a vector of loan-level controls including the log of Loan Size and LTI ratio.
16We prefer using Processing Time as the dependent variable because we can easily interpret the estimatesin this case (i.e., the number of additional days spent processing the loan). The results using concave functionsof Processing Time (i.e., the square root and logarithm of Processing Time) as the dependent variable areavailable upon request.
17All of our empirical findings in Section 4 are robust when we instead include lender-time fixed effects sothat we compare within-bank variation at any point in time.
16

We cluster standard errors by bank throughout the paper.18
Our coefficient of interest is β, which is estimated each year. It should capture the discrete
gap in processing time at the CLLs and its trend over time. Prediction 1 in Section 2 suggests
that this gap should widen as secondary market liquidity for jumbo mortgages dries up. The
estimation results are in Table 2.
[Table 2 here]
Our estimated β is negative (-3.9) and statistically significant at the 1% level in 2005; not
statistically significant in 2006 and 2007 but with an increasing point estimate over time (-0.4
and 3.6); and positive and significant for 2008 (19.6, statistically significant at the 5% level)
and 2009 (10.2, statistically significant at the 1% level). That is, we do not observe a discrete
increase in processing time at the CLLs when private-label securitization was still active, i.e.,
before its collapse in late 2007. If anything, we observe a discrete decrease in processing time
at the CLLs in 2005, possibly reflecting the relatively strict guidelines enforced by GSEs on
conforming loan originations (Keys et al. (2012)). This trend, however, reverses after 2007—
processing time increases by almost 20 (10) days in 2008 (2009) at the CLLs, which is consistent
with Prediction 1. Figure 4 summarizes this result, plotting the yearly estimated processing
time gap at the CLLs (i.e., β from Table 2) along with the 95% confidence intervals.19
[Figure 4 here]
4.2. Panel Regression with Lender Characteristics
We find in the previous section that the gap in processing time across the CLLs increased
significantly after 2007. Note, however, that this estimate could be biased because loans are
not randomly assigned across the CLLs. Borrowers rather “bunch” just below the CLLs,
18Our results are robust when we instead cluster standard errors by county.19Note that the sample used in this regression includes both bank and non-bank lenders. We obtain almost
the same estimation result when we only include bank lenders in the interest of consistency with the data usedin subsequent analyses, which matches the HMDA and Call Report data.
17

and the FICO scores and LTV change discontinuously at the threshold (Kaufman (2014),
Fuster and Vickery (2014), Adelino et al. (2014), and DeFusco and Paciorek (2017)), but
we are unable to control for these borrower risk characteristics. If this borrower sorting also
varies over time, one possibility is that the longer processing time for jumbo borrowers after
2007 might simply reflect lower credit scores or higher LTV of these borrowers, rather than
more screening efforts imposed on them. Hence, our setup is not suitable for a regression
discontinuity (RD) estimation.20
To address this borrower selection bias, we examine whether this discrete widening in
processing time at the CLLs is more pronounced for “treated” lenders after 2007 (Predictions
2, 3, and 4). We use the quarterly panel data that matches a 10 percent random sample
of HMDA loan-level data with lender characteristics from the Call Report. All lenders with
no available Call Reports (“non-bank”) are thus excluded. Balance sheet information from
the Call Reports provide cross-sectional variations in lender (i.e., bank) characteristics, which
helps us better identify the underlying mechanism acting on lenders’ screening incentives.
We begin by testing Prediction 2 focusing on bank capitalization and estimate the following
panel regression:
yiclt = αl + αc + αt + β1 ∗ Jumboiclt + β2 ∗ LowCapl ∗ Jumboiclt + β3 ∗ LowCapl ∗ Postt
+ β4 ∗ Jumboiclt ∗ Postt + β5 ∗ LowCapl ∗ Jumboiclt ∗ Postt + γ1 ∗Xi + γ2 ∗Xlt + εiclt, (2)
where the dependent variable is the loan-level Processing Time, as in Equation (1), for appli-
cation i in county c originated by lender l at time t. Xi is a matrix of loan characteristics
and Xlt is a matrix of bank controls. Postt is set to 1 for t from 2008Q1 and is 0 otherwise.21
LowCapl is set to 1 if Tier 1 Capital Ratio of lender l as of 2007Q4 belongs to the lowest
quartile and is 0 otherwise.
20Kaufman (2014) and Fuster and Vickery (2014) use appraisal values as an instrument to circumvent thisproblem.
21Our “pre-treatment” period ends at the end of 2007 because Securitization Ratio, later used to designateOTD banks, can only be defined at year-end. See Section 3.
18

We include lender, county, and time (year-quarter) fixed effects, as in the previous sec-
tion, to account for lender-, local market-, and time-specific factors that could affect overall
application processing time. Loan-level controls include the log of Loan Size and LTI ratio.
Bank controls include the log of Total Asset, Liquid Asset Ratio, Loan to Deposit Ratio, RE
Loan Ratio, CI Loan Ratio, NPL Ratio, Tier 1 Capital Ratio, and Securitization Ratio. Note
that the Securitization Ratio is defined yearly, as we only observe whether loans originated in
a given year are securitized by the end of that year. Therefore, we use banks’ Securitization
Ratio for the previous calendar year as a control for processing time in a given calendar year.
All other bank controls are lagged by one quarter. These various bank characteristics allow
us to control for differing loan processing capacity, different business models or specializa-
tions affecting loan processing, different levels of troubled loans in portfolios affecting loan
processing, and different capital and liquidity levels affecting loan processing.
The main coefficient of interest is β5, the coefficient on the triple-interaction term LowCapl∗Jumboiclt∗Postt. This coefficient captures the incremental widening following the market col-
lapse of the processing time gap at the CLLs for thinly capitalized banks compared to that of
better capitalized banks. Our main identification assumption of this triple-difference regres-
sion is that the possible bias from borrower selection did not change differentially between the
treatment and control groups post 2007.
Panel A of Figure 5 separately plots trends of the processing time difference (4-quarter
moving average for seasonality adjustment) between jumbo and non-jumbo mortgages for
banks with LowCapl = 1 and LowCapl = 0. The trends are largely parallel pre-treatment
(before 2007Q4), but they diverge afterwards, with the processing time gap between the two
mortgage types increasing mostly for the low capital banks.
[Figure 5 here]
Table 3 reports the regression results. Columns 1 and 5, without and with bank controls,
re-examine what we tested in Table 2 and analyze how the gap in processing time at the CLL
changed after 2007. Here, we find similar results—there was no significant gap in processing
19

time at the CLL before 2007 (the coefficient on Jumbo), but processing time increases by
about 8-9 days at the CLLs after 2007 (the coefficient on Jumbo ∗ Post), and is statistically
significant at the 1% level.
[Table 3 here]
We now examine how this change varies across banks. Columns 2 and 6 report the esti-
mation results of Equation (2), without and with bank controls, respectively. Note that the
estimates of β5 , the coefficient on the triple-interaction term, are positive and statistically
and economically significant in both columns (about 14 days, significant at the 1% level). In-
terestingly, the estimates of β4, the coefficient on Jumboiclt ∗Postt, are not significant. These
results suggest that lenders with limited capital spent more days processing jumbo mortgage
applications than non-jumbo applications after 2007, but this pattern was not typical for
lenders with adequate capital. This finding is consistent with Prediction 2.
We next test Prediction 3, examining if lenders’ involvement in loan sales (i.e., OTD)
activity affects this variation. As before, we estimate the following panel regression:
yiclt = αl + αc + αt + β1 ∗ Jumboiclt + β2 ∗OTDl ∗ Jumboiclt + β3 ∗OTDl ∗ Postt
+ β4 ∗ Jumboiclt ∗ Postt + β5 ∗OTDl ∗ Jumboiclt ∗ Postt + γ1 ∗Xi + γ2 ∗Xlt + εiclt, (3)
where OTDl = 1 if lender l’s 2005-07 securitization ratio22 belongs to the top quartile (“OTD
banks”). This variable captures lenders who were most active in loan sales during the pre-
treatment period of 2005-2007. Our hypothesis is that these lenders must have been more
affected by the drying-up of the private label securitization market in late 2007.
As in the previous exercise, Panel B of Figure 5 compares trends in the the processing time
difference between jumbo and non-jumbo mortgages, for banks with OTDl = 1 and OTDl = 0
separately. Again, the trends are largely parallel pre-treatment, but diverge afterwards, with
22This ratio is defined by the total number of loans originated and sold during 05-07 divided by the numberof loans originated during that period.
20

the processing time gap between the two mortgage types increasing more for banks heavily
engaged in OTD activity.
Columns 3 and 7 report the estimated results of Equation (3), without and with bank
controls, respectively. The estimates of β5, the coefficient on the triple interaction term, are
positive and significant in both columns (about 14-15 days, significant at the 1% level). The
estimates of β4, the coefficient on Jumboiclt ∗ Postt, are not significant. These results suggest
that the processing time gap at the CLLs after 2007 widened for lenders employing the OTD
business model, but lenders that tended to hold loans on their balance sheets typically did
not, a finding consistent with Prediction 3.
Note that β2, the coefficient on OTDl ∗ Jumboiclt, is positive and significant, suggesting
that these OTD banks had longer processing times for jumbo mortgage applications even
during the pre-treatment period of 2005-07. As we designated banks as OTD based on overall
loan sales activity, including both jumbo and non-jumbo mortgages, one possible explanation
is that the OTD banks include those that sold non-jumbo mortgages relatively more than
jumbo mortgages. If they tended to keep jumbo mortgages on their balance sheets more often
than non-jumbo mortgages even before the market collapse, and spent more time screening
jumbo mortgages, we could observe a positive β2.
Consequently, we create alternative definitions of OTD banks. Table 4 reports the estima-
tion results of Equation (3) based on these definitions. In Columns 1 and 2, we define OTD
banks based on their loan sales of jumbo mortgages only during the pre-treatment period. Now
β2, the coefficient on OTDl ∗Jumboiclt, is not statistically significant in both columns without
and with the bank controls, a finding consistent with the hypothesized change in screening
incentives; banks that actively sold jumbo mortgages pre-treatment did not spend extra days
processing jumbo mortgage applications when the secondary market was still liquid. However,
our estimates of β3 and β5 are similar to our previous results in Table 3, suggesting higher
screening efforts exerted by these banks on jumbo loans post-treatment. As a robustness
check, we alternatively define OTD banks based only on their 2007 loan sale activity, instead
21

of 2005-07. Again, we use both overall loan sales including both non-jumbo and jumbo mort-
gages (column 3 and 4), and jumbo loan sales only to define OTD banks (column 5 and 6).
The estimation results are similar to our previous findings.
[Table 4 here]
Finally, Prediction 4 hypothesizes that small community banks should see less of a change
after the market collapse. We test this prediction by estimating the following equation:
yiclt = αl + αc + αt + β1 ∗ Jumboiclt + β2 ∗ LARGEl ∗ Jumboiclt + β3 ∗ LARGEl ∗ Postt
+ β4 ∗ Jumboiclt ∗ Postt + β5 ∗ LARGEl ∗ Jumboiclt ∗ Postt + γ1 ∗Xi + γ2 ∗Xlt + εiclt, (4)
where LARGEl = 1 if lender l’s total assets as of 2007Q4 are greater than $10 billion, a
commonly used threshold for community banks, and is set to 0 otherwise.
Again, Panel C of Figure 5 compares trends in the processing time difference between
jumbo and non-jumbo mortgages, for banks with LARGEl = 1 (non-community banks) and
LARGEl = 0 (community banks) separately. During the pre-treatment period, the trends
are largely parallel. They diverge afterwards, with the processing time gap between the two
mortgage types increasing mostly for large, non-community banks.
Columns 4 and 8 of Table 3 report the estimation results of Equation (4) without and
with bank controls, respectively. The estimates of β5, the coefficient on the triple interaction
term, are positive and significant in both columns (about 11 days, significant at the 5%
level), while the estimate of β4, the coefficients on Jumboiclt ∗ Postt, are not significant.
This finding is consistent with Prediction 4—the collapse of the private securitization market
increased the incentives for soft information collection for jumbo mortgage applications, but
local community banks were less affected than larger non-community banks. As previously
discussed, this outcome could be because (i) community banks already possessed more soft
information or (ii) they could more efficiently collect and analyze such information if needed.
22

5. Robustness
In this section, we first examine several variations of the previous analysis as a robustness
check. We then examine borrower characteristics and loan performance using the HMDA-
McDash matched dataset, to verify whether longer processing time is associated with tighter
lending standards or underlying loan risks that we were unable to control for in our empirical
tests.
5.1. Limiting Loan Size
Note that we focus on a discrete change in processing time at the CLLs. While we excluded
mortgages that are too big (> $1, 000, 000) or too small (< $100, 000) from our sample, we
now limit loan sizes further and keep them closer to the CLLs. Specifically, we only keep
mortgages for amounts greater than 80% but less than 120% of the CLLs.23
Table 5 repeats the estimations in Table 3 based on this subsample. Overall, our findings
are robust. The coefficients of interest (i.e., that on Jumboiclt ∗ Postt in Columns 1 and 5,
and those on the triple-interaction terms) are still significant, both economically and statis-
tically. However, the magnitude of the estimates is smaller than the magnitudes in Table 3,
particularly for column 3 and 7 comparing banks with OTD = 1 and OTD = 0.
[Table 5 here]
5.2. Placebo Test
We now implement a placebo test and compare the results to those in Table 5. Specifically,
we only keep mortgages of amounts greater than 60% of the CLLs but less than the CLLs.
Note that all mortgages in this subsample are non-jumbo mortgages. We then assume placebo
CLLs equal to 80% of the actual CLLs and assign “jumbo” and “non-jumbo” mortgages based
23As the sample size shrinks significantly, we use the entire HMDA data instead of a 10 percent randomsample when matching with the Call Report.
23

on this artificial threshold. Hence, the “jumbo” mortgages in this specification are non-jumbo
mortgages in Table 5.
[Table 6 here]
Table 6 repeats the estimations in Table 5, but with these different data and definitions.
Here, none of the coefficients that we focus on—that on Jumboiclt ∗Postt in Columns 1 and 5
and those on the triple interaction terms—are significant, as predicted. The results in Table
5 and 6 support our hypothesis of a discrete change in lender incentives at the CLLs.
5.3. Polynomial Loan Size Controls
Our empirical analysis attempts to capture a discrete change in processing time at the CLL
after isolating any continuous size-dependent effect using loan size controls. To do so, we
included the log of loan size (log(LoanSize)) as a size control and limited our loan size range
from $100,000 to $1,000,000. However, the underlying data generating process could be a
more complicated function of loan size, and, as a result, the estimates we focus on could be
erroneously capturing such effects rather than a discrete change at the CLLs.
Although our robustness check in Section 5.1 mitigates this concern by limiting the loan
size range further, we now reestimate the main regressions with an additional polynomial
loan size control. To be specific, we include a third degree polynomial with log(LoanSize),
{log(LoanSize)}2, and {log(LoanSize)}3 as the size controls.
Tables 7 and 8 present the results of Tables 2 and 3, respectively, with these additional
controls. Note that the coefficients of interest are similar to those found before in terms of
both economic and statistical significance. If anything, the point estimates are larger, which
suggests better isolation of the discrete change at the CLLs after allowing richer variation in
the continuous size-dependent effect.
[Tables 7 and 8 here]
24

5.4. Tighter Lending Standards or Borrower Selection?
While we attribute the longer processing time for jumbo mortgages after 2007 to tighter
lending standards, an alternative possible explanation is that the screening for these loans
took longer because they were simply riskier loans. This concern is critical because borrowers
are not randomly distributed between jumbo and non-jumbo loans. We cannot directly control
for this possibility because HMDA lacks both ex-ante (e.g., LTV, credit score) and ex-post
risk characteristics (e.g., loan performance history). We thus exploited cross-lender variations
in the previous sections.
To further address this concern, we next examine borrower characteristics and loan per-
formances around the CLLs using the (non-confidential) HMDA-McDash matched dataset.
The McDash dataset is owned by Black Knight Financial Services and provides loan charac-
teristics, such as LTV, LTI, FICO score, and performance history at the loan level. Due to
the restriction of matching the dataset with lender financial information, we are unable to
extend our main dataset to conduct empirical tests with both lender and borrower character-
istics. Nevertheless, by showing loan characteristics and performance histories, we attempt to
indirectly support our empirical findings.
We select loans that are comparable to those in the sample used for empirical tests—
approved conventional prime mortgages for one to four-family properties for home purchases,
excluding pre-approved loans. We limit the loan size to be within +/- 20% of CLLs, which is
comparable to that used in Section 5.1. We then examine the loan characteristics around the
CLLs, comparing the pre-treatment vintages (2005 and 2006) and the post-treatment vintages
(2008 and 2009).
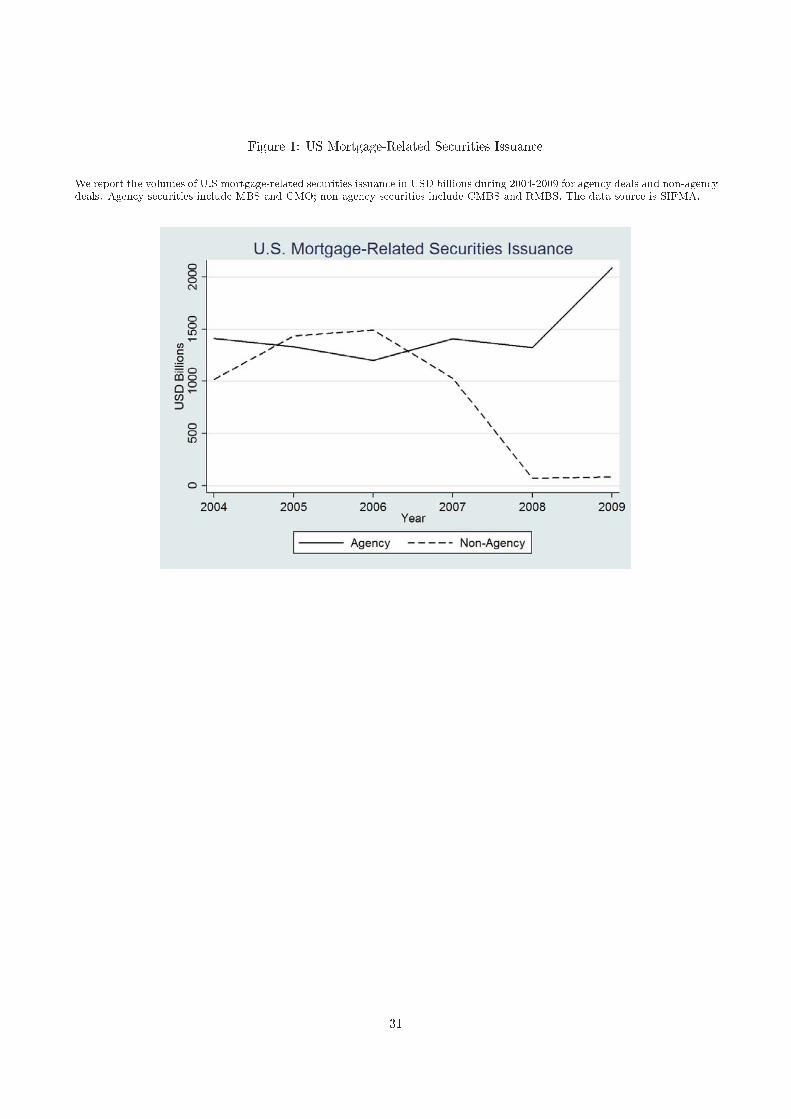
We first examine LTV, LTI, and FICO scores. Panel A of Figure 6 plots the average LTV
of the loans below and above the CLLs (non-jumbo and jumbo loans), by origination vintage.
The average LTV of non-jumbo and jumbo mortgages are not significantly different in 2005
and 2006, but the LTV for jumbo mortgages become significantly lower in 2008 and 2009,
indicating tighter lending standards applied to jumbo mortgage borrowers after 2007 rather
25

than higher borrower risk (i.e., higher LTV) for loans originated. We observe the same pattern
for the LTI (Panel B of Figure 6), although the difference is less stark than that of LTV. Panel
C of Figure 6 plots the average FICO scores. We observe that the average FICO scores goes
up for both non-jumbo and jumbo mortgages after 2007. However, it is not evident that
jumbo borrowers are significantly riskier during the post-treatment period than non-jumbo
borrowers, relative to the difference in the pre-treatment period.
[Figure 6 here]
We finally examine the ex-post performance of these loans. Panel D of Figure 6 plots the
cumulative default rate of loans by origination vintage for five years after origination. Overall,
the loan performance for non-jumbo and jumbo mortgages is roughly similar for the 2005, 2006,
and 2009 origination vintages. However, jumbo mortgages performed significantly better than
non-jumbo mortgages for the 2008 origination vintage, suggesting that jumbo mortgages might
have been particularly safer than non-jumbo mortgages.24 In sum, these analyses support our
interpretation of longer processing time for jumbo mortgages being driven by tighter lending
standards, rather than by riskier borrower characteristics.
6. Conclusion
This paper examines whether the possibility of eventual loan sales weakens lenders’ screening
incentives. Using the confidential version of HMDA, we calculate loan-level application pro-
cessing time for approved mortgages: the number of days between the mortgage application
date and the origination approval date. This processing time for each individual application
should reflect lenders’ screening efforts and scale of information production, as it should take
longer to make an origination decision if more information is collected or if the application is
examined more carefully, all else being equal. This measure provides information on screening
efforts at the ex-ante screening stage, whereas ex-post measures such as loan performance are
24Note that loan performance also depends on borrowers’ strategic decisions besides the actual risks.
26

also affected by ex-post economic conditions or borrower-side decisions. We also circumvent
the issue of an endogenous application pool, which affects the analysis of mortgage approval
decisions, by focusing only on approved mortgages and analyze within-bank variation at the
CLLs.
We analyze lenders’ incentives in the prime mortgage market, whereas previous loan-level
studies mainly analyze the screening incentives within the subprime mortgage market (e.g.,
Keys et al. (2010), Rajan et al. (2015)). Exploiting the unique institutional features of prime
mortgage markets and the collapse of the non-agency MBS issuance market in late 2007, we
examine whether lenders’ screening incentives vary depending on secondary market liquidity
for loan sales. The market collapse in 2007 significantly reduced secondary market liquidity for
jumbo mortgages, while it had little impact on non-jumbo mortgages. We find that following
the market collapse, lenders spent discretely more time screening and processing applications
for amounts greater than the CLLs than for amounts below. This processing time gap suggests
that lenders adopt different lending standards depending on the securitizability of the loans,
indicating incentive misalignment. We also find that this effect is more pronounced for banks
with low capital, greater dependence on an OTD model, and larger assets.
27

References
Adelino, M., A. Schoar, and F. Severino. 2014. Credit Supply and House Prices: Evidencefrom Mortgage Market Segmentation. Working paper.
Agarwal, S., G. Amromin, I. Ben-David, S. Chomsisengphet, and D. D. Evanoff. 2011. TheRole of Securitization in Mortgage Renegotiation. Journal of Financial Economics 102:559– 578.
Agarwal, S., and R. Hauswald. 2010. Distance and Private Information in Lending. Reviewof Financial Studies 23:2757–2788.
Agarwal, S., and C. T. Ho. 2007. Comparing the Prime and Subprime Mortgage Markets.Chicago Fed Letter .
Ahnert, T., and M. Kuncl. 2019. Loan Insurance, Market Liquidity, and Lending Standards.Working paper.
Begley, T. A., and A. Purnanandam. 2016. Design of Financial Securities: Empirical Evidencefrom Private-Label RMBS Deals. Review of Financial Studies 30:120–161.
Berger, A. N., N. H. Miller, M. A. Petersen, R. G. Rajan, and J. C. Stein. 2005. DoesFunction Follow Organizational Form? Evidence from the Lending Practices of Large andSmall Banks. Journal of Financial Economics 76:237 – 269.
Berger, A. N., and G. F. Udell. 2002. Small Business Credit Availability and RelationshipLending: The Importance of Bank Organisational Structure. Economic Journal 112:F32–53.
Campello, M. 2002. Internal Capital Markets in Financial Conglomerates: Evidence fromsmall Bank Responses to Monetary Policy. Journal of Finance 57(6):2773–2805.
Choi, D. B., H.-S. Choi, and J.-E. Kim. 2017. Clogged Intermediation: Were Home BuyersCrowded Out? Working Paper.
Dagher, J., and K. Kazimov. 2015. Banks Liability Structure and Mortgage Lending duringthe Financial Crisis. Journal of Financial Economics 116:565–582.
DeFusco, A. A., and A. Paciorek. 2017. The Interest Rate Elasticity of Mortgage Demand:Evidence from Bunching at the Conforming Loan Limit. American Economic Journal:Economic Policy 9:210–40.
Dell’Ariccia, G., D. Igan, and L. U. Laeven. 2012. Credit Booms and Lending Standards:Evidence from the Subprime Mortgage Market. Journal of Money, Credit and Banking44:367–384.
Fuster, A., S. H. Lo, and P. Willen. 2017. The Time-Varying Price of Financial Intermediationin the Mortgage Market. Working Paper.
28

Fuster, A., M. Plosser, P. Schnabl, and J. Vickery. 2018. The Role of Technology in MortgageLending. Working paper.
Fuster, A., and J. Vickery. 2014. Securitization and the Fixed-rate Mortgage. Review ofFinancial Studies 28:176–211.
Gorton, G. B., and G. G. Pennacchi. 1995. Banks and Loan Sales Marketing NonmarketableAssets. Journal of Monetary Economics 35:389–411.
Hu, Y. 2018. A Dynamic Theory of Bank Lending, Firm Entry, and Investment Fluctuations.Working paper.
Jiang, W., A. A. Nelson, and E. Vytlacil. 2014. Securitization and Loan Performance: Ex Anteand Ex Post Relations in the Mortgage Market. Review of Financial Studies 27:454–483.
Kaufman, A. 2014. The Influence of Fannie and Freddie on Mortgage Loan Terms. Real EstateEconomics 42:472–496.
Keys, B. J., T. Mukherjee, A. Seru, and V. Vig. 2009. Financial Regulation and Securitization:Evidence from Subprime Mortgage Loans. Journal of Monetary Economics 56:700–720.
Keys, B. J., T. Mukherjee, A. Seru, and V. Vig. 2010. Did Securitization Lead to LaxScreening? Evidence from Subprime Loans. Quarterly Journal of Economics 125:307–362.
Keys, B. J., A. Seru, and V. Vig. 2012. Lender Screening and the Role of Securitization: Ev-idence from Prime and Subprime Mortgage Markets. Review of Financial Studies 25:2071–2108.
Loutskina, E. 2011. The role of securitization in bank liquidity and funding management.Journal of Financial Economics 100:663–684.
Loutskina, E., and P. E. Strahan. 2009. Securitization and the Declining Impact of BankFinance on Loan Supply: Evidence from Mortgage Originations. Journal of Finance 64:861–889.
Loutskina, E., and P. E. Strahan. 2011. Informed and Uninformed Investment in Housing:The Downside of Diversification. Review of Financial Studies 24:1447–1480.
Mayer, C., K. Pence, and S. M. Sherlund. 2009. The Rise in Mortgage Defaults. Journal ofEconomic Perspectives 23:27–50.
Mian, A., and A. Sufi. 2009. The Consequences of Mortgage Credit Expansion: Evidencefrom the U.S. Mortgage Default Crisis. Quarterly Journal of Economics 124:1449–1496.
Nadauld, T. D., and S. M. Sherlund. 2013. The Impact of Securitization on the Expansion ofSubprime Credit. Journal of Financial Economics 107:454 – 476.
Parlour, C. A., and G. Plantin. 2008. Loan Sales and Relationship Banking. Journal ofFinance 63:1291–1314.
29

Pennacchi, G. G. 1988. Loan Sales and the Cost of Bank Capital. Journal of Finance 43:375–396.
Petersen, M. A., and R. G. Rajan. 2002. Does Distance Still Matter? The InformationRevolution in Small Business Lending. Journal of Finance 57:2533–2570.
Piskorski, T., A. Seru, and V. Vig. 2010. Securitization and Distressed Loan Renegotiation:Evidence from the Subprime Mortgage Crisis. Journal of Financial Economics 97:369 –397.
Purnanandam, A. 2010. Originate-to-Distribute Model and the Subprime Mortgage Crisis.Review of Financial Studies 24:1881–1915.
Rajan, U., A. Seru, and V. Vig. 2010. Statistical Default Models and Incentives. AmericanEconomic Review 100:506–10.
Rajan, U., A. Seru, and V. Vig. 2015. The Failure of Models that Predict Failure: Distance,Incentives, and Defaults. Journal of Financial Economics 115:237 – 260.
Stein, J. C. 2002. Information Production and Capital Allocation: Decentralized versus Hier-archical Firms. Journal of Finance 57:1891–1921.
30
������ �� ��� ��������� �� ����� ��� ��������
�� ������ ��� ����� � ��� ��������������� ��������� ������� �� ��� ������ ����� ��������� �� ������ ���� ��� ����������
����� ������ ��������� ����� !� ��� " #$ ���������� ��������� ����� " !� ��� % !�� &�� ���� ����� �� �'( ��
��

������ �� ���� ���� ���������� �����
�� ������ ���� ����� �� ��� �� ���� ����� � ������� ��� ��� �� �� ��� ���� ��� �� �� �� �������� ����� � ��� ��� ��� �� ��� ������ ��� ��� ����� ������ �� �� ��� ����� �� ��� �� ���� ������ �� �� ������� ��� ������� �� ��� ������ ��� �� � ���� � ��� ���� �� ������� ���� ���� ����� � ������� ��������� ���!��� " �!���!��� �� �� ������� ���� # ��� ���� �� ������� ������ ���� ����� � ������� ������ ��� ���!��� " �!���!��� �� �� ������� ����� �� ��� �� ������ ����� ��� ��� $$�$�� ��������� � ��� ���� �� ���������
����� �� ��� ��� � �
����� �� ������ ��� � �
��

������ �� �� ��������� ��� ������������� ������
�� ������ ��� ������ ��� ��� �� ��� ������ ��� ��� � �� ��������� ��� ���� � ������ ���������� ���� � � ����������� ���� ������� �� ��� ����� ���� ���� ������� �� ��! �"�#$ �� ���� ��������� ��% �"�#$ ���� ���� ������ ������ ��� &�"�� �' ��� ������ �� �������� ���� ���� � ������ ��������� (�� ���� "��(�� )*��'��� �� )*'���'�������� + � ������ ��� ������ ���� ���� ����� �� ����� �"�� �� ��� ����� ���� ���� ����� �"�� �� ������� ���� ������� ���� ������� ���� , � ��� ���� ��� ������ ���� " � ��� � "���� ���������' (��� ������ ��� ���� ������ �������-��� ��� ��.�� �� "� �� ��� ����� (�� ��� �� �������/����# .��� 012� ��� � ��� � �� � (��� ���������� �� �-�� (���� ������� �� (�� �� ���� ������� ���� ������� "� �������#' �� ��� ����� �����(���
����� �
����� �
����� �
��

������ �� ��� ���� �� ���������� ����
��� ����� ��� �� ���� ��� ����� �� � ���� ���� � ������������� �������� ���� �� �������� ����� �� ����� ��� ��� �������� ��� ��������� ���������� �� ��� ���� ��������� ������� �� ��� ���� �� �� ����� ��������� �� ����� !" ��� ��� ���� ��� #$%��������� ����� ��� �� ��� ��������� ����������� ��� �� ������ ������� �� ������� �� ����� �� ���� ������� ���� � ������������� ��� ���� � �� �� �������� ����� �� � �� �� ����� �� ��� ����������
��

������ �� �� �������� ���� ��������� ������� ���� ��� ������� ����� ���� �����
�� ������ ��� ������� � ���� ��������� ���� ������� ����� ����� ��� ��������� ����� ������ ��� ������ ���� ������ ������� ��� ������ ������ � ����� ���� � ����� � !� ����� �� ������� �� ��� ���������"# �� ��� � ��� $������ ����� ������� �� ��� ��������� %�� ���� ����� � �����# �� ��������� ��� ������� &����� � ���������' � () ����� ������� � ������������� ��������� ��� �������� � ������ � ��"� �� ���� $������ ��� ����� ��� �������� ���� ��� *���� + � ������,��-�� ��� ����,��-�� �����# *���� . � ������ /�0 ��� ����/�0 �����# ��� *���� - � ������ ,+123 ��� ����,+123�����
����� �
����� �
����� �
�
������ �� �� �������������� ������� ���� ��� �������
�� ������ ��� �������� �� �� ��������� �� ��� �� ���� �� ��������� ������ ����� ��� �� �������� ��� � ����� ������� �� ������ ��� ���������� ������ ���� �� ���!" �� ��� �� �������� ������ ����# �� ���$"% &��� ��� '()*+()� ����� ��� �� ���� ��� ���� ��� ��������� �� ��� ����� � �� ��� �������� �� � , �������� �������� ����� �������� ����� �� ����������� ��������� ���� ���� ����� � ����� � � �-����� ������������ ��� % �� ����� ��� ��� �.� �� �� �����/+� ��0 ��� ���� ������ � �.� ���� ���� ��� ����� ����� ��1���� ��2���� ����� �� ��� � ���� � ���� � ��������� ������ � �� � ���� %3% 4��� * ������ �56 �� ����� ��� �� �������� ��� �� ��� ��������� ������% 4��� 7 ������ �58 �� ����� ��� �� �������� ��� �� ��� ��������� ������% 4��� � ������ &8�9 �� ����� ��� �� ����������� �� ��� ��������� ������% 5��� � ���� �� ���� ������ ��� ��� ��� �������� �� �� ����� ��� ��� ��� ������ �������� �� �� �������� ��� ��� ��� � ��� ������ �� ��� ����% 4��� ) ��� ��� ��������� ������� ���� � ����-� :�� ���� ����� ��������� �� ��������� ������ �;������<"% * ��� � ��:�� �� �� � ������� �� ��� �������� ;(7*=>5*5<� ��� ()� � ���� ���� ��� ��� � ������ !�/ ��� ����?���� � ������ ���� � @A9� � ��������� ��?�������� �� ��������� ������%
����� �
����� �
��

������ �� �� �������������� ������� ���� ��� �������� ��������
����� �
����� �
��

����� �� ���� � � �� ���
�� ������ ��� ���� ���� �� �� �� ��� ���� ����� � ����� � ��� ��� ��������� ������ ����� � ����� �� �� ����� �� �� �������� �� �� �������� ��� �� ���� � �� ���� ��� ��� � ��� �� � ��� ������ �� ���� ��� ������ �� ����� �� ��� � �������� �� ������ ����� ��� � !� �� ��� ������� �� � � ��� � ������ ��������� ������ ���� ��� ���� " ���� �� ���� ����� ���#��� ������������ ��� ���� �� ������ �� ������� ��� $������ �� �%���� ���� � ��������� &� ��� �� ���� ����� �����#�� ����� ����%���� ����� ���� �� �����#� �� �� ���������#��� "����� �� ���� �� ����������� ��������� �%��� �� ��'������� (�������� �%���� �����#�� ��� � �� ��������� ��� ������ ���� ��� ))�)�� ������� �� ��� ���� ����� �� ��� ����� �� ����� ��� ������������ *+,,�,,, ��� *+�,,,�,,,� ��������� ��� � ��� ���� �� ���� ������� ���� ���� ��� �� ����� ��� ���� �����#�� ��� � �������� �� � ���� � � -$! ����� �� � ��� � �������� ���� ��� �� ���� �������� ����� �� � ������� ������ ����� � ������ � �� ������� � ���� �� �� � � ���� �� �� � � ���� ��� � ���� ��� � � ��� � � ���� ��� ��������� ���� � ���� ������ ������ ��� � ��� ��� � �� � . � ������ /� �� ����� ��� ���� ���� �� ��� ��#���� ����� ��� ���� � �� ���� ��0 �� ���� ������� �� � ��������� � ��� � ��� ��� � �� ����� ����� �� ����� ����� ��� �� �� � � ��� � ��� ��� � �� ���� ������ ����� �� ����� ������ �� �� �� ��� � ��� ��� � �� ����� �� ��� ����� �� ����� �� ����� ������ ��� � ��� � ��� ��� � �� ���������� �� ����� �� ����� ��������� � � ��� � � ��� � ��� ��� � �� � �� + ��� ��� ����� �� � ����� ����� ������� ��������� ���� � ��� � ��� ��� � �� ����� ���� ���� �������� �� ����� �� � ����� ����� �� �� ��� ����� 1������� ���� ������� #�� ����� ��� � ���� 2�� �� ,�34 ��� ))�34 ��#���� ������� �� ���� � � �� �� ����� #�� ���� � �� � #��� �� + � � ����5� � �� + ��� ��� ��� � � � ��� ����� .��� �� �� �� 6,,7 18���� ��� , ������ ��� �� � �� �� ����� #�� ���� � �� � #��� �� + � � ����5� ���� � 2�� �� ��� # �� � � ��� ��� .��� �� �� ��6,,3�6,,7 ��� , ������ ��� ��� � � �� �� ����� #�� ���� � �� � #��� �� + � � ����5� ����� ����� � 2� � ������ ���� *+, � �� ���� �� 6,,7 18 ���� ��� , ������ ���
����� �� ��� �����
��� �������� � ���� ������ ����
���� ��������� ��� ������� �� �� �� !� ��
�� � ���� � ������� ���"��� ��#"��� ���"���
�� � ��� �!!!�#� � �� � �� � ��
���! ��������� ��� ������� �� �� �� !� ��
�� � ���� � ������� ���"��� ���"��� ���"#��
�� � ��� ���!��� � �� � �� � ��
���� ��������� ��� ��#���! �� #� �� !� ��
�� � ���� � ��#���! ���"��� ���"��� ���"���
�� � ��� ����!#� � !� � �� � ��
���� ��������� ��� ��!���� �# �� �� !� ��
�� � ���� � ��!���� ��!"�!� ���"��� ��!"�!�
�� � ��� ����#�� � !� � �# � ��
���# ��������� ��� �!���� �� �� �! �! ��
�� � ���� � �!���� ���"��# ��!"��� ���"���
�� � ��� �����! � �# � �� � ��
$%�� �������� � ���� ������ ����
� ��������� ��� �#����� �! #� �� !� �!
�� � ���� � �#����� ���"��� �#�"��� #�"##�
�� � ��� ���!�#� � �� � �� � ��
� ��������� ��� ������ �� �� �� �# ��
�� � ���� � ������ �!�"!�� ���"��� ���"#��
�� � ��� !����� � #� � #� � ��
��

����� �� ���� � � �� ���� ��� ����
����� �� ��� ����� ����
���� ���� �������� � ���� ������ ����
���� � ��������� ��� ! "�#$ !"%�� &� $�% $
�� � ���� � ! "�#$ #'("& "!(��� $#($��
�� � ��� &�&�"& �%!' �%&' % !
��������� ��� &�$$&" ��%'# &� $'%�&
�� � ���� � &�$$&" � �(' # !"�(��� &#(!"�
�� � ��� & &��' &%�' &%�& %�!
���$ � ��������� ��� &��!#� !$%�$ �" $!%'
�� � ���� � &��!#� � �('&& #�(��� "�(!�
�� � ��� �!'� �%!! �%&� % &
��������� ��� ''''# �!%�$ �# "&%��
�� � ���� � ''''# �"#(&#� ��$(��� �#(''�
�� � ��� $# �$ �%#& �%#� % "
���' � ��������� ��� �!'"�' !�%$# �" �'%$
�� � ���� � �!'"�' � '('�# #$(��� ""("��
�� � ��� ���$!� �%�$ �%!$ % #
��������� ��� !��$# �!%'� &� "!%'�
�� � ���� � !��$# $��(�&� �'�(��� &�(��
�� � ��� &"��& �%#& �%#� %��
���" � ��������� ��� �"�"� !"% � &� �#%"
�� � ���� � �"�"� �!�(!#� � !(��� (# "
�� � ��� ����& �%$� �%!# %�!
��������� ��� &'��# '!%# &' %�&
�� � ���� � &'��# $'$(!'� $"#(��� !�( &$
�� � ��� &!#�! �%$" �%�' %&
���# � ��������� ��� "&"'�! � % � &$ ��%��
�� � ���� � "&"'�! �!&( �$ � �(��� $('�#
�� � ��� "��&�$ �%�# �%!� %��
��������� ��� �&� ' $!%# &" #�%�$
�� � ���� � �&� ' $'"( " '��(��� &$(#�#
�� � ��� �� "� �%�# �%!" %�!
����� )� ��� )��* �����
�������� � ���� ������ ����
�+�� ��,-�)�� ��������� ��� &&&#&! ��%&' &� $"%$"
�� � ���� � &&&#&! ��#(�$# � �(��� ��(" #
�� � ��� &&&#&! �%�& �%!& %��
)��. �+��,+� �� � ����� ���� ���&� $($#� !"$ $�( $�
������ ����� � ��� ���&� �%�&'! �%� "! �% &'
�� � ������� � ��� ���&� �%"#'! �%#�'� �% $'
�� �� � � ��� ���&� �%'$#$ �%'"�! �% &�"
�� �� � � ��� ���&� �%�"$$ �%�$"� �%�#&�
��� � ��� ���&� �%� " �%��$' �%� !&
���� � ��� � � ��� ���&� �% �!� �% �� �%�&'&
��������� ���� � ��� ���&� �%&#"� �%!��� �%&�!'
����� �� ����/�0� ���������0 1 )��* ����2 ��������0
���� � � ���!�
���� �
� �% �&"
���!� �%� '# �%�!'#
��

����� �� ���� ���� ��� �� ���� ��� ����� ���� ����� ������
�� ������ ��� ���� ������� �� ������ �� ������� �� � �� ��� �� ���� � ���� �� �� ��� �� ���� �� ������� �� �� ����������� �������� � �� � ��� ������� �������� �� ���������� !�������� �� ��� �� ��������� ��� ������� � �������� ��� ������� �� �� �� �� ���� �� �� ����� ��� � �� ���� "�� ������� ����� �� �� � ���� �� �� �� �� �
���� � ��� ���� ��� ��� �� �� � �� � #$! �� �� � ��%��% ����� �� �� �� ����� � � �� ���� �� �� � �� ����� � � �� � �� � � ���� ��� ��� ������� �� �� � ��� �� � ������ �� &��������� ��� ���� '�� ���� ������ ������ �������� ���� �� �� ������ ()������ �� ��� �� � ���� ��� � � �* �� �� �* ���� &�� ��� ������� �� �� ��� ����� �� ������ �%��� �� �� � ���������� $����� ������ �� �������� �� ����� +++� ++ �� + �� ��� �*� �* �� ��* ��� �� �� �� '����� ������� ���
��������� � � � �
����� ���� ���� ����� ����� ������� ������
������ � ������ ������ ����� �� ���
�������� !"� �#���#��� �#���#� � �#���#� �#���#�� ���#���
���$%���& ���� ���� ��� ���� ����
�!�" '!"��!(� )�� )�� )�� )�� )��
��"&�� *� )�� )�� )�� )�� )��
'+,) *� )�� )�� )�� )�� )��
-!"�. *� )�� )�� )�� )�� )��
��

����� �� ���� ���� �� �� ����� �� ����� ������� ����� ������
�� ������ ��� ��� ������� � ������ �� ������� � � �� ��� � ���� � ���� �� � ��� ������ ������� ������ �� � �� ����� � � ��� ����� ����� �� ��� �� ����� ���� ���� �� ��� ���� �� � ����� ��� ������� � ���� ��� � ��������!"� #������� $������ %�� ���� ��� ��������� ��� �������� ����� �� ��!�� &�� ������ ���� �� �� � ���� �� �� ��� �� � ���� � ��� ����� ���� ��� �� �� � '� ()$ �� �� � ������ ���� ��� �* �� ����� � � � ����� %�� ��� � ��� %��� �� � � �� � '� � � ���� ��� ��� ������ � �� � ��* �� � ������ ��� ���� � � � ����� %�� ��� � �� � %��� �� � � ��� �� �����%� ��� � � � ���� ����� +� ��� ���,* �� � ������ ��� ���� � � � � ����� %�� ��� � �� � %��� �� � � ����-� � �� � ��� �� ��� � � ��� ������ .���� � �� �� ���/ 01 ��* �� � ������ ��� �� � � � ����� %�� ��� � �� � %����� � � � ���-� ����� � '�� � ��� % �! � ��� ��� .��� � ��� � ��������/ �� � ������ ��� ����� � � � ����� %�� ���� �� � %��� �� � � � ���-� ���� ����� � '� � ����� ��� 2�� � � �� �� ���/ 01 ��* �� � ������ ��� 3�� ������ ������ � ������* ����� ����� � ���* �� � �� ������� � ���! �� �� � � ���! �� �� � � ���! "�� � ���! ��� # � ��� � � ���* ����������� ���� � ���� ���������� ��� ���� ��� ��* ���* ����! �� !����.������ ���� �� ��� ������ ��� ���� ������� �� ���� ����� � �� ������ ������ �� �� ����������� )������ ������ ��� �������� �! ���� 444* 44 �� 4 � ���� ��* �� �� ������� �� �� � � ����* ������� %�!�
��������� � �� � �� �� �� �� ��
����� �� �� �������� ���� ���� �������� ��� �������� ����� ��� ����� ��
��� �� ������ ������ ������ ����� ������ ������� ������
��������� ��� ���� ����� ���� ���� �������� ��� � ����� ������
������ ���� �� ���� �� ��� ��� ��� �� ������ ������� ���������
��� ������� ���� �� ������
����� �����
��� ����� ���� � ��
��� � ������
��� ����������� ������ �� ���
������ �����
��������� ��� ���� �������
������ �����
������� ���� ��
����� ������
������������� �� ���� �������
���� �����
���������� ������ ������
���� �����
�������� ����� ����
������ ������
�������������� ����� � ���
�� �� �� ���
�������� !"� #� ��#�� �#��� �#��� #�� ��#� � �#�� �#���
���$%���& ���� �� ���� ���� ���� ��� ���� ����
�!�" '!"��!(� )�� )�� )�� )�� )�� )�� )�� )��
��"* +� )�� )�� )�� )�� )�� )�� )�� )��
��"* '!"��!(� ,� ,� ,� ,� )�� )�� )�� )��
',-) +� )�� )�� )�� )�� )�� )�� )�� )��
). +� )�� )�� )�� )�� )�� )�� )�� )��
��
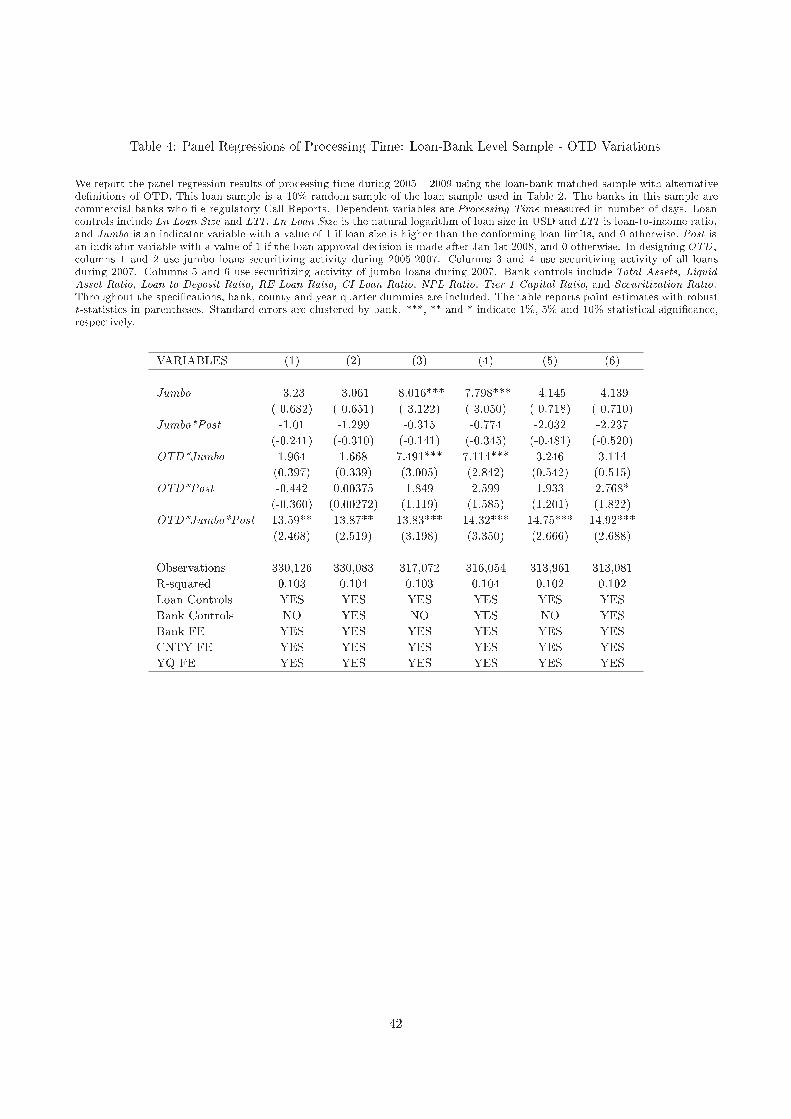
����� �� ���� ���� �� �� ����� �� ����� ������� ����� ������ � ��� ��������
�� ������ ��� ��� ������� � ������ �� ������� � � �� ��� � ���� � ���� �� � ��� ������ ������� ����� � �� ������ ����� � �� �� �� ! �� � �� ����� � � "�# ����� ����� �� ��� �� ����� ���� ���� �! ��� ���� �� � ����� ���������� � ���� ��� �� ��������$ %� &������! ������ ��� ���� ��� ��������� ��� �������� ����� �� ��$�! '�������� ���� �� �� � ���� �� �� ! �� �� � ���� � ��� ����� ���� ��� �� �� � (� )* �� �� � ������ ���� ��� �+�� ����� � � � ����� ��� ��� � �� � ���� �� " � �� � (� � � ���� ��� ��� ������ � �� � ��+ �� � ������ ��! ���� �� � ����� ��� ��� � �� � ���� �� " � ��� �� ������� ��� � � � ���� ����� ,� "�� ���-+ �� � ������ ��! . ��� � ���+����� " �� � ��� /���� ��� ����� � ( � ��� � �$ ��� � ��������0! %���� 1 �� 2 ��� ����� � ( � ��� � �$ �� � ������ � ���0! %���� � �� 3 ��� ����� � ( � ��� � �$ �� /���� ��� ��� � ���0! 4�� ������ ���� �� � ������� ����������� � ���� �� � �� ������� � ���� �� �� � � ���� �� �� � � ���� �� � ���� ��� ! � ��� � � ���+ �� ��������� ���� � ���!���������� ��� ���� ���� ��+ ���+ ����$ �� $����5������ ���� �� ��� �����! ��� ���� ������� �� � ��� ����� � �� ������������ �� �� ����������! *������ ������ ��� �������� �$ ���! 666+ 66 �� 6 � ���� "#+ �# �� "�# ���� �� �� � � �����+������� ��$!
��������� � �� � �� �� ��
����� � �� � ��� �������� ��������� ����� ��� �
������� ������ � ���� � ����� ������ ������
��������� ��� ����� ��� � ������ ���� � ���� �
������ ��� �� ����� ��� ��� ������ �������
�������� ���� ���� ������� ������ ���� ��
�� ��� �� �� ����� ������ ������ �����
������ ������ ���� �� ���� ����� �� ������
��� ��� �������� ��� ����� ���� �����
������������ ����� ����� �� ��� �� ���� ������� �������
������ ����� ���� � ��� ������ ������
�������� !"� �#�� �#�� �#��� �#��� #�� #��
���$%���& ��� ���� ��� ���� ���� ����
�!�" '!"��!(� )�� )�� )�� )�� )�� )��
��"* '!"��!(� +� )�� +� )�� +� )��
��"* ,� )�� )�� )�� )�� )�� )��
'+-) ,� )�� )�� )�� )�� )�� )��
). ,� )�� )�� )�� )�� )�� )��
��

����� �� ���� ���� �� �� ����� �� ����� ������� ����� ������ � ����� ���
�� ������ ��� ��� ������� � ������ �� ������� � � �� ��� � ���� � ���� �� � ��� ������ ������� ������ �� � �� ������� ����� ��� ����� � �� � � �� ��� ����� ���� !��" #$$% �� ��� ���� ���� &�" #$$% ���� ��� �� ����� ���� ���� �� ��� ���� �� � ����� ��� ������� � ���� ��� '� ��������� #� (������� )������ *�� ���� ��� ������������ �������� ����� �� ����� $�� ������ ���� �� �� � ���� �� �� � �� �� � ���� � ��� ����� ���� ��� �� ��� �� +,) �� �� � ������ ���� ��� �- �� ����� � � � ����� *�� ��� � �� � *��� �� ! � �� � �� � � ���� ��� ��������� � �� � ��- �� � ������ ��� ���� � � � ����� *�� ��� � �� � *��� �� ! � ��� �� �����*� ��� � � � ���� �����.� !�� ���&- �� � ������ ��� ���� � � � � ����� *�� ��� � �� � *��� �� ! � � ���/� � �� ! ��� �� ��� � � ��� ������0���� � �� �� ���1 23 ��- �� � ������ ��� �� � � � ����� *�� ��� � �� � *��� �� ! � � ���/� ����� � ��� � ��� * �� � ��� ��� 0��� � ��� � ��������1 �� � ������ ��� ����� � � � ����� *�� ��� � �� � *��� �� ! � � ���/� ���� ������ �� � ����� ��� 4!� � � �� �� ���1 23 ��- �� � ������ ��� 5�� ������ ���� �� � ������� �� ��! ����� � ���� �� �
�� ������� � ���� �� �� � � ���� �� �� � � ���� "�� � ���� ��� # � ��� � � ���� �� ��������� ���� � ���� ���������� ������� '��� ��- ���- ����� �� �����0������ ���� �� ��� ������ ��� ���� ������� �� � ��� ����� � �� ������ ������ �� �� ����������� ,������ ������ ��� �������� �� ���� 666- 66 �� 6 � ���� !"- �" �� !�" ���� �� �� � � '����- ������� *���
��������� � �� � �� �� �� �� ��
����� ��� ����� ������ ���� ���� ���� ������ �� �
�� � ������� ���� �� ������ ������ ������� ������ ������
��������� ������ ������� ����� �������� ���� �������� ����� ���������
������ ������ ������ ������� ���� ������ ������ �������
��� ������� � ��� �����
�� �� �����
��� ����� ����� �����
������� ����
��� ����������� �������� �������
��� � ��� �
��������� �� � �� �����
����� �����
������� ���� � ����
������ ��� ��
������������� ����� ������
��� ������
���������� � ����� �������
����� �� ���
�������� ����� �����
������� ������
�������������� �� ���� �������
��� �� ������
�������� !"� ���#��� ���#� � ���#�� ���#��� ���#� ���#��� ���#� ���#���
���$%���& ��� �� ��� ��� ��� ��� ��� ���
�!�" '!"��!(� )�� )�� )�� )�� )�� )�� )�� )��
��"* '!"��!(� +� +� +� +� )�� )�� )�� )��
��"* ,� )�� )�� )�� )�� )�� )�� )�� )��
'+-) ,� )�� )�� )�� )�� )�� )�� )�� )��
). ,� )�� )�� )�� )�� )�� )�� )�� )��
��

����� �� ���� ���� �� �� ����� �� ����� ������� ����� ������ � ����� ������� ���
�� ������ ��� ��� ������� � ������ �� ������� � � �� ��� � ���� � ���� �� � ��� ������ ������� ������ �� � �� ����� � � ������ ����� �� ���� � ����� ��� ����� ���� � ���� �� !! �� ��� ���� ���� � "�� �� !! �� #���� ��� �������� ����� � $�� ��� ���%� &�� !! �� �� ��� ����� ����� ��� ���� �� � ����� ��� ������� � ���� ��� '� ��������( � )������� *������ %�� ���� ��� ��������� ��� �������� ����� �� ��(�� !�� ������ ���� �� �� � ���� �� �� ��� �� � ���� � ��� ����� ���� ��� �� �� � $� +,* �� �� � ������ ���� ��� �- �� ����� � � � ����� %�� ��� � ��� %��� �� � � �� � $� � � ���� ��� ��� ������ � �� � ��- �� � ������ ��� ���� � � � ����� %�� ��� � �� � %��� �� � � ��� �� �����%� ��� � � � ���� ����� #� ��� ���&- �� � ������ ��� ���� � � � � ����� %�� ��� � �� � %��� �� � � ����.� � �� � ��� �� ��� � � ��� ������ /���� � �� �� ���0 12 ��- �� � ������ ��� �� � � � ����� %�� ��� � �� � %����� � � � ���.� ����� � $�� � ��� % �( � ��� ��� /��� � ��� � ��������0 �� � ������ ��� ����� � � � ����� %�� ���� �� � %��� �� � � � ���.� ���� ����� � $� � ����� ��� 3�� � � �� �� ���0 12 ��- �� � ������ ��� 4�� ������ ������ � ������� �� ��! ����� � ���� �� � �� ������� � ���� �� �� � � ���� �� �� � � ���� "�� � ���� ��� # � ��� � � ���� ����������� ���� � ���� ���������� ��� ���� '��� ��- ���- ����( �� (����/������ ���� �� ��� ������ ��� ���� ������� �� ���� ����� � �� ������ ������ �� �� ����������� ,������ ������ ��� �������� �( ���� 555- 55 �� 5 � ���� ��- �� �� ������� �� �� � � '����- ������� %�(�
��������� � �� � �� �� �� �� ��
����� ������� ����� ����� ������ ������ ������ ������ ������
� ��� ������� ������� ������� ��� ����� � ������� �������
��������� ����� ���� ����� ���� ����� �� ����� ����
����� � ��� ������� ����� ���� ����� ������ ������
��� ������� ���� �� ��������
������ ������
��� ����� �� � � ��
����� ������
��� ����������� ������ ������
���� �� �������
��������� �������� ��������
������ ������
������� ���� ����
������� �����
������������� ���� ���
� ��� � ���
���������� ������ ��� ���
����� ������
�������� ������ �� �
���� � �����
�������������� ������ �����
������ ��� �
�������� !"� � #��� ���#�� ���#�� ���#��� ���#��� ���#��� ���#�� ���#��
���$%���& ��� ���� �� ��� �� ���� �� ��
�!�" '!"��!(� )�� )�� )�� )�� )�� )�� )�� )��
��"* '!"��!(� +� +� +� +� )�� )�� )�� )��
��"* ,� )�� )�� )�� )�� )�� )�� )�� )��
'+-) ,� )�� )�� )�� )�� )�� )�� )�� )��
). ,� )�� )�� )�� )�� )�� )�� )�� )��
��

����� �� ���� ���� ��� �� ���� ��� ����� ���� ����� ������ � ��������� ��������� ��� �� �� ����
����
�� ������ ��� ���� ������� �� ������ �� ������� �� � �� ��� �� ���� � ���� �� �� ��� �� ����� ��� ��� � � ��� �� � �� ����� � �� �� ��� ����� � �� ��� � ����� �� �� ���� ����� ��������� � ��� �� ������� ���� ������� � ������ �� ����!�� ������� ����� �� ���� ���� �� ��� � �� ���� ���� � ��� ���� ��� ��� �� �� � "� � #$� �� ��� � ��%��% ������� �� �� ����� � � �� ���� � �� � �� �� �� & � �� � "� � � ���� ��� ��� ������� �� �� � ��� �� � ������ ������������� ��� ���� '�� ���� ������ ������ �� ������ ���� �� �� ������� ��� ��� ������� �� �� ��� ���� � �� �������%��� �� �� � ����������� $����� ������ �� �������� �� ������ (((� (( �� ( �� ��� &)� �) �� &�) ��� �� � � �� '������������ ���
��������� � � � �
����� ������ � �� ��� ���� ��������
������� ������ ����� ������ ������
�������� !"� �#���#��� �#���#� � �#���#� �#���#�� ���#���
���$%���& ���� ���� ��� ��� ����
�!�" '!"��!(� )�� )�� )�� )�� )��
��"&�� *� )�� )�� )�� )�� )��
'+,) *� )�� )�� )�� )�� )��
-!"�. *� )�� )�� )�� )�� )��
��

����� �� ���� ���� �� �� ����� �� ����� ������� ����� ������ � ������� ��������� ���� �� ��
���� ����
�� ������ ��� ��� ������� � ������ �� ������� � � �� ��� � ���� � ���� �� � ��� ������ ������� ������ ��� ���� �� ���� � � �� ��� ��� � � �� ��� ������� � �� ��� � ����� �� �� ���� ���� �� � �� ����� � � !�" ����� ����� �� ��� ������� ���� ���� � ��� ���� �� � ����� ��� ������� � ���� ��� #� ��������$ %� &������ '������ (�� ���� ���������� ���� �������� ����� �� ��$� )�� ������ ���� �� ���� ���� �� ��� �� ���� ���� � ��� ����� ���� ����� �� � *� +,' �� ��� � ������ ���� ��� �� �� ����� � � � ����� (�� ��� � �� � (��� �� ! � �� � *� � � ������� ��� ������ � �� � ��� �� � ������ �� ��� � � � ����� (�� ��� � �� � (��� �� ! � ��� �� �����(� ��� � � ����� ����� -� !�� ���.� �� � ������ �� ������ � � � ����� (�� ��� � �� � (��� �� ! � � ���/� � �� ! ��� �� ��� � � ��� ������ ����� � �� �� ���0 12 ��� �� � ������ �� ��� � � � ����� (�� ��� � �� � (��� �� ! � � ���/� ����� � *�� ���� ( �$ � ��� ��� ���� � ��� � ��������0 �� � ������ �� ����� � � � ����� (�� ��� � �� � (��� �� ! � � ���/� ��������� � *� � ����� ��� 3!� � � �� �� ���0 12 ��� �� � ������ �� 4�� ������ ���� ����� ������� �� ��! ����� ������
���� �� ������� ������ �� ���� ������ �� ���� ������ "� ������ ��� # ������� ������ �� ������������� ����� ������������� ���� #��� ��� ���� ����$ �� $����������� ���� �� ��� ����� ��� ���� ������� �� � ��� ����� � �� ������ ������ �� �� ���������� ,������ ������ ��� �������� �$ ��� 555� 55 �� 5 � ���� !"� �" �� !�" ���� �� �� � � #����� ������� (�$
��������� � �� � �� �� �� �� ��
����� ����� ������� ������� ������� ����� ������� ��� ���� ��� ���
���� � ��� �� ������� ������ ��� �� ������ ������� �����
��������� �������� ����� ����� ����� �� ����� ��� ������ ��� �
��� �� ���� �� ������� ����� ������ ������� ��� ��� ����
��� ������� ������� �������
����� �����
��� ����� �� � �
������ ���� �
��� ����������� ������ �������
������ ������
��������� ��� ���� ��� ��
������ ������
������� ����� � �
����� ��� ��
������������� ������� �������
����� �� ��
���������� ������ ���� �
��� � �����
�������� ���� ���
������ ������
�������������� ����� �����
������ ������
�������� !"� #� ��#�� �#��� �#��� #�� ��#� � �#�� �#���
���$%���& ���� ���� ���� ���� ���� ��� ���� ����
�!�" '!"��!(� )�� )�� )�� )�� )�� )�� )�� )��
��"* '!"��!(� +� +� +� +� )�� )�� )�� )��
��"* ,� )�� )�� )�� )�� )�� )�� )�� )��
'+-) ,� )�� )�� )�� )�� )�� )�� )�� )��
). ,� )�� )�� )�� )�� )�� )�� )�� )��
��