11 - 1© 2014 Pearson Education, Inc. Unit-5. 11 - 2© 2014 Pearson Education, Inc. Supply Chain...
146
11 - 1 © 2014 Pearson Education, Inc. Unit-5
-
Upload
alban-cannon -
Category
Documents
-
view
216 -
download
2
Transcript of 11 - 1© 2014 Pearson Education, Inc. Unit-5. 11 - 2© 2014 Pearson Education, Inc. Supply Chain...

11 - 1© 2014 Pearson Education, Inc.
Unit-5

11 - 2© 2014 Pearson Education, Inc.
Supply Chain Management

11 - 3© 2014 Pearson Education, Inc.
Outline► Global Company Profile:
Darden Restaurants
► The Supply Chain’s Strategic Importance
► Sourcing Issues: Make-or-Buy vs. Outsourcing
► Six Sourcing Strategies

11 - 4© 2014 Pearson Education, Inc.
Outline - Continued
► Supply Chain Risk► Managing the Integrated Supply
Chain► Building the Supply Base► Logistics Management► Distribution Management

11 - 5© 2014 Pearson Education, Inc.
Outline - Continued
► Ethics and Sustainable Supply Chain Management
► Measuring Supply Chain Performance

11 - 6© 2014 Pearson Education, Inc.
Learning ObjectivesWhen you complete this chapter you should be able to:
1. Explain the strategic importance of the supply chain
2. Identify six sourcing strategies
3. Explain issues and opportunities in the supply chain
4. Describe the steps in supplier selection

11 - 7© 2014 Pearson Education, Inc.
When you complete this chapter you should be able to:
Learning Objectives
5. Explain major issues in logistics management
6. Compute percent of assets committed to inventory and inventory turnover

11 - 8© 2014 Pearson Education, Inc.
Darden’s Supply Chain
► Largest publicly traded casual dining company in the world
► Serves over 400 million meals annually in more than 1,900 restaurants in the US and Canada
► Annual sales of flagship brands totals $6 billion
► Operations is the strategy© 2014 Pearson Education, Inc.

11 - 9© 2014 Pearson Education, Inc.
Darden’s Supply Chain
▶ Sources food from five continents and thousands of suppliers
▶ Four distinct supply chains
▶ Over $2 billion spent annually in supply chains
▶ Competitive advantage achieved through superior supply chain
© 2014 Pearson Education, Inc.

11 - 10© 2014 Pearson Education, Inc.
Supply-Chain Management
The objective of supply chain management is to coordinate
activities within the supply chain to maximize the supply chain’s
competitive advantage and benefits to the ultimate consumer

11 - 11© 2014 Pearson Education, Inc.
The Supply Chain’s Strategic Importance
▶The coordination of all supply chain activities, starting with raw materials and ending with a satisfied customer
▶Includes suppliers, manufacturers and/or service providers, distributors, wholesalers, retailers, and final customer

11 - 12© 2014 Pearson Education, Inc.
The Supply Chain’s Strategic Importance
▶Large portion of sales dollars spent on purchases
▶Supplier relationships increasingly integrated and long term▶Improve innovation, speed design, reduce
costs
▶Managing supplier relationships has added emphasis

11 - 13© 2014 Pearson Education, Inc.
Supply Chain Costs
TABLE 11.1
Supply Chain Costs as a Percentage of Sales
INDUSTRY % PURCHASED
Automobiles 67
Beverages 52
Chemical 62
Food 60
Lumber 61
Metals 65
Paper 55
Petroleum 79
Restaurants 35
Transportation 62

11 - 14© 2014 Pearson Education, Inc.
Supply Chain vs. Sales Strategy
Hau Lee Furniture
60% of sales $ in supply chainCurrent gross profit = $10,000Increase profits to $15,000 (50%)
CURRENT SITUATION
SUPPLY CHAIN STRATEGY
SALES STRATEGY
Sales $100,000 $100,000 $125,000
Cost of materials $60,000 (60%) $55,000 (55%) $75,000 (60%)
Production costs $20,000 (20%) $20,000 (20%) $25,000 (20%)
Fixed costs $10,000 (10%) $10,000 (10%) $10,000 (8%)
Profit $10,000 (10%) $15,000 (15%) $15,000 (12%)

11 - 15© 2014 Pearson Education, Inc.
A Supply Chain for BeerFigure 11.1

11 - 16© 2014 Pearson Education, Inc.
Supply Chain ManagementTABLE 11.2 How Corporate Strategy Impacts Supply Chain Decisions
LOW COST STRATEGY
RESPONSE STRATEGY
DIFFERENTIATION STRATEGY
Primary supplier selection criteria
• Cost • Capacity• Speed• Flexibility
• Product development skills• Willing to share information• Jointly and rapidly develop
products
Supply chain inventory
• Minimize inventory to hold down costs
• Use buffer stocks to ensure speedy supply
• Minimize inventory to avoid product obsolescence
Distribution network • Inexpensive transportation
• Sell through discount distributors/retailers
• Fast transportation• Provide premium
customer service
• Gather and communicate market research data
• Knowledgeable sales staff
Product design characteristics
• Maximize performance
• Minimize cost
• Low setup time• Rapid production
ramp-up
• Modular design to aid product differentiation

11 - 17© 2014 Pearson Education, Inc.
Sourcing Issues▶Make-or-buy vs. outsourcing
▶Choosing between obtaining products and services externally as opposed to producing them internally
▶Outsourcing▶Transfer traditional internal activities and
resources to outside vendors
▶Efficiency in specialization
▶Focus on core competencies

11 - 18© 2014 Pearson Education, Inc.
Six Sourcing Strategies
▶Many suppliers
▶Few suppliers
▶Vertical integration
▶Joint ventures
▶Keiretsu networks
▶Virtual companies

11 - 19© 2014 Pearson Education, Inc.
Many Suppliers
▶Commonly used for commodity products
▶Purchasing is typically based on price
▶Suppliers compete with one another
▶Supplier is responsible for technology, expertise, forecasting, cost, quality, and delivery

11 - 20© 2014 Pearson Education, Inc.
Few Suppliers
▶Buyer forms longer term relationships with fewer suppliers
▶Create value through economies of scale and learning curve improvements
▶Suppliers more willing to participate in JIT programs and contribute design and technological expertise
▶Cost of changing suppliers is huge
▶Trade secrets and other alliances

11 - 21© 2014 Pearson Education, Inc.
Vertical Integration
Figure 11.2
Raw material (suppliers) Tree Harvesting
Backward integration Chipmakers Pulpmaking
Current transformation Pepsi Apple International
Paper
Forward integration Bottling Retail stores End-User Paper Conversion
Finished goods (customers)
Vertical Integration Examples of Vertical Integration

11 - 22© 2014 Pearson Education, Inc.
Vertical Integration
▶Developing the ability to produce goods or service previously purchased
▶ Integration may be forward, towards the customer, or backward, towards suppliers
▶Can improve cost, quality, and inventory but requires capital, managerial skills, and demand
▶Risky in industries with rapid technological change

11 - 23© 2014 Pearson Education, Inc.
Joint Ventures
▶Formal collaboration▶Enhance skills
▶Secure supply
▶Reduce costs
▶Cooperation without diluting brand or conceding competitive advantage

11 - 24© 2014 Pearson Education, Inc.
Keiretsu Networks
▶A middle ground between few suppliers and vertical integration
▶Supplier becomes part of the company coalition
▶Often provide financial support for suppliers through ownership or loans
▶Members expect long-term relationships and provide technical expertise and stable deliveries
▶May extend through several levels of the supply chain

11 - 25© 2014 Pearson Education, Inc.
Virtual Companies
▶Rely on a variety of supplier relationships to provide services on demand
▶Fluid organizational boundaries that allow the creation of unique enterprises to meet changing market demands
▶Relationships may be short- or long-term
▶Exceptionally lean performance, low capital investment, flexibility, and speed

11 - 26© 2014 Pearson Education, Inc.
Supply Chain Risk
▶More reliance on supply chains means more risk
▶Fewer suppliers increase dependence
▶Compounded by globalization and logistical complexity
▶Vendor reliability and quality risks
▶Political and currency risks

11 - 27© 2014 Pearson Education, Inc.
Risk and Mitigation Tactics
▶Research and assess possible risks
▶Innovative planning
▶Reduce potential disruptions
▶Prepare responses for negative events
▶Flexible, secure supply chains
▶Diversified supplier base

11 - 28© 2014 Pearson Education, Inc.
Risk and Mitigation TacticsTABLE 11.3 Supply Chain Risks and Tactics
RISK RISK REDUCTION TACTICS EXAMPLE
Supplier failure to deliver
Use multiple suppliers; effective contracts with penalties; subcontractors on retainer; pre-planning
McDonald’s planned its supply chain 6 years before its opening in Russia. Every plant—bakery, meat, chicken, fish, and lettuce—is closely monitored to ensure strong links.
Supplier quality failure
Careful supplier selection, training, certification, and monitoring
Darden Restaurants has placed extensive controls, including third-party audits, on supplier processes and logistics to ensure constant monitoring and reduction of risk.

11 - 29© 2014 Pearson Education, Inc.
Risk and Mitigation TacticsTABLE 11.3 Supply Chain Risks and Tactics
RISK RISK REDUCTION TACTICS EXAMPLE
Logistics delays or damage
Multiple/redundant transportation modesand warehouses; secure packaging; effective contracts with penalties
Walmart, with its own trucking fleet and numerous distribution centers located throughout the U.S., finds alternative origins and delivery routes bypassing problem areas.
Distribution Careful selection, monitoring, and effective contracts with penalties
Toyota trains its dealers around the world, invoking principles of the Toyota Production System to help dealers improve customer service, used-car logistics, and body and paint operations.

11 - 30© 2014 Pearson Education, Inc.
Risk and Mitigation TacticsTABLE 11.3 Supply Chain Risks and Tactics
RISK RISK REDUCTION TACTICS EXAMPLE
Information loss or distortion
Redundant databases; secure IT systems; training of supply chain partners on the proper interpretations and uses of information
Boeing utilizes a state-of-the-art international communication system that transmits engineering, scheduling, and logistics data to Boeing facilities and suppliers worldwide.
Political Political risk insurance; cross-country diversification; franchising and licensing
Hard Rock Cafe reduces political risk by franchising and licensing, rather than owning, when the political and cultural barriers seem significant.

11 - 31© 2014 Pearson Education, Inc.
Risk and Mitigation TacticsTABLE 11.3 Supply Chain Risks and Tactics
RISK RISK REDUCTION TACTICS EXAMPLE
Economic Hedging to combat exchange rate risk; purchasing contracts that address price fluctuations
Honda and Nissan are moving more manufacturing out of Japan as the exchange rate for the yen makes Japanese-made autos more expensive.
Natural catastrophes
Insurance; alternate sourcing; cross-country diversification
Toyota, after its experience with fires, earthquakes, and tsunamis, now attempts to have at least two suppliers, each in a different geographical region, for each component.

11 - 32© 2014 Pearson Education, Inc.
Risk and Mitigation TacticsTABLE 11.3 Supply Chain Risks and Tactics
RISK RISK REDUCTION TACTICS EXAMPLE
Theft, vandalism, and terrorism
Insurance; patent protection; security measures including RFID and GPS; diversification
Domestic Port Radiation Initiative: The U.S. government has set up radiation portal monitors that scan nearly all imported containers for radiation.

11 - 33© 2014 Pearson Education, Inc.
Security and JIT
▶Shipments get misrouted, stolen, damaged, or excessively delayed
▶Technological innovations are improving security and inventory management▶Location, motion sensors, broken seals,
temperature
▶Tracking can help expedite shipments

11 - 34© 2014 Pearson Education, Inc.
Managing the Integrated Supply Chain
▶Issues▶Local optimization can magnify
fluctuations
▶Incentives push merchandise into the supply chain for sales that have not occurred
▶Large lots reduce shipping costs but increase inventory holding and do not reflect actual sales
Bullwhip effect occurs
when orders are
relayed through the
supply chain increasing
at each step

11 - 35© 2014 Pearson Education, Inc.
Managing the Integrated Supply Chain
▶Opportunities▶Accurate “pull” data, shared information
▶Lot size reduction, shipping, discounts, reduced ordering costs
▶Single stage control of replenishment▶Single supply chain member responsible for
ordering
▶Vendor managed inventory (VMI)

11 - 36© 2014 Pearson Education, Inc.
Managing the Integrated Supply Chain
▶Opportunities▶Collaborative planning, forecasting, and
replenishment (CPFR) through the supply chain
▶Blanket orders against which actual orders are released
▶Standardization

11 - 37© 2014 Pearson Education, Inc.
Managing the Integrated Supply Chain
▶Opportunities▶Postponement withholds modification as
long as possible
▶Electronic ordering and funds transfer speed transactions and reduce paperwork
▶Drop shipping and special packaging bypasses the seller and reduces costs

11 - 38© 2014 Pearson Education, Inc.
Building the Supply Base
▶Supplier evaluation▶Finding potential suppliers
▶Determine likelihood of their becoming good suppliers
▶Supplier certification1. Qualification
2. Education
3. Certification

11 - 39© 2014 Pearson Education, Inc.
Building the Supply Base
▶Supplier development▶Integrate the supplier into the system
▶Quality requirements
▶Product specifications
▶Schedules and delivery
▶Procurement policies
▶Training
▶Engineering and production help
▶Information transfer procedures
11 - 40© 2014 Pearson Education, Inc.
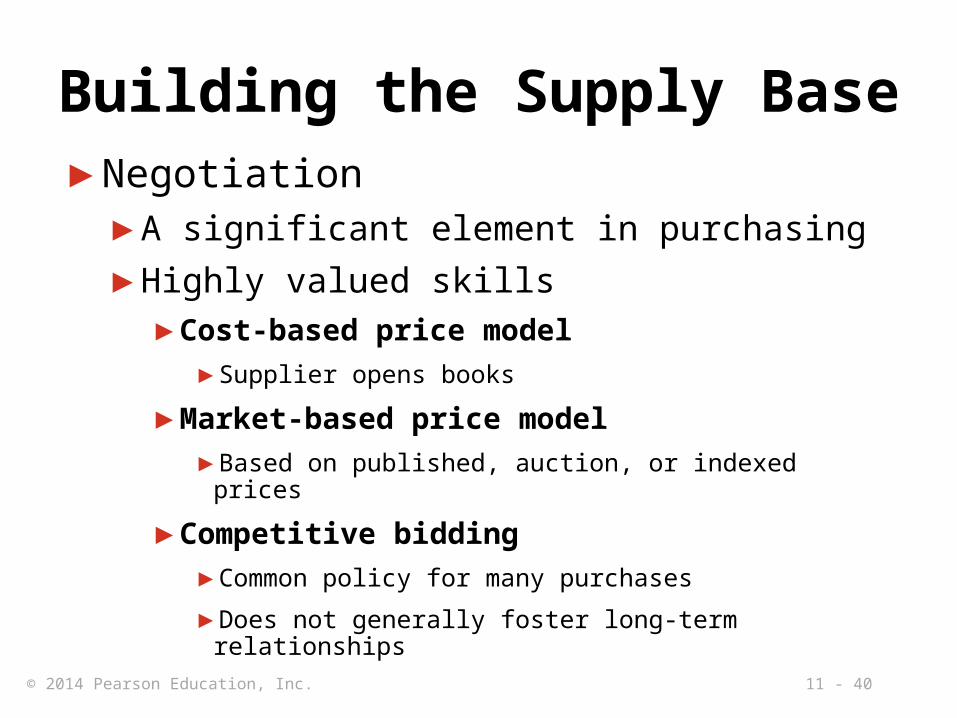
Building the Supply Base▶Negotiation
▶A significant element in purchasing
▶Highly valued skills▶Cost-based price model
▶Supplier opens books
▶Market-based price model
▶Based on published, auction, or indexed prices
▶Competitive bidding
▶Common policy for many purchases
▶Does not generally foster long-term relationships

11 - 41© 2014 Pearson Education, Inc.
Building the Supply Base▶Contracting
▶Share risks, benefits, create incentives
▶Centralized purchasing▶Leverage volume▶Develop specialized staff▶Develop supplier relationships▶Maintain professional control▶Devote resources to selection and negotiation▶Reduce duplication of tasks▶Promote standardization

11 - 42© 2014 Pearson Education, Inc.
Building the Supply Base
▶E-Procurement▶Speeds purchasing, reduces costs, integrates
supply chain
▶Online catalogs and exchanges▶Standard items or industry-specific web sites
▶Online auctions▶Low barriers to entry
▶Reverse auctions for buyers
▶Price not always the most important factor

11 - 43© 2014 Pearson Education, Inc.
Logistics Management
▶Objective is to obtain efficient operations through the integration of all material acquisition, movement, and storage activities
▶Is a frequent candidate for outsourcing
▶Allows competitive advantage to be gained through reduced costs and improved customer service

11 - 44© 2014 Pearson Education, Inc.
Shipping Systems
▶Trucking▶Moves the vast majority of manufactured
goods
▶Chief advantage is flexibility
▶Railroads▶Capable of carrying large loads
▶Little flexibility though containers and piggybacking have helped with this
11 - 45© 2014 Pearson Education, Inc.
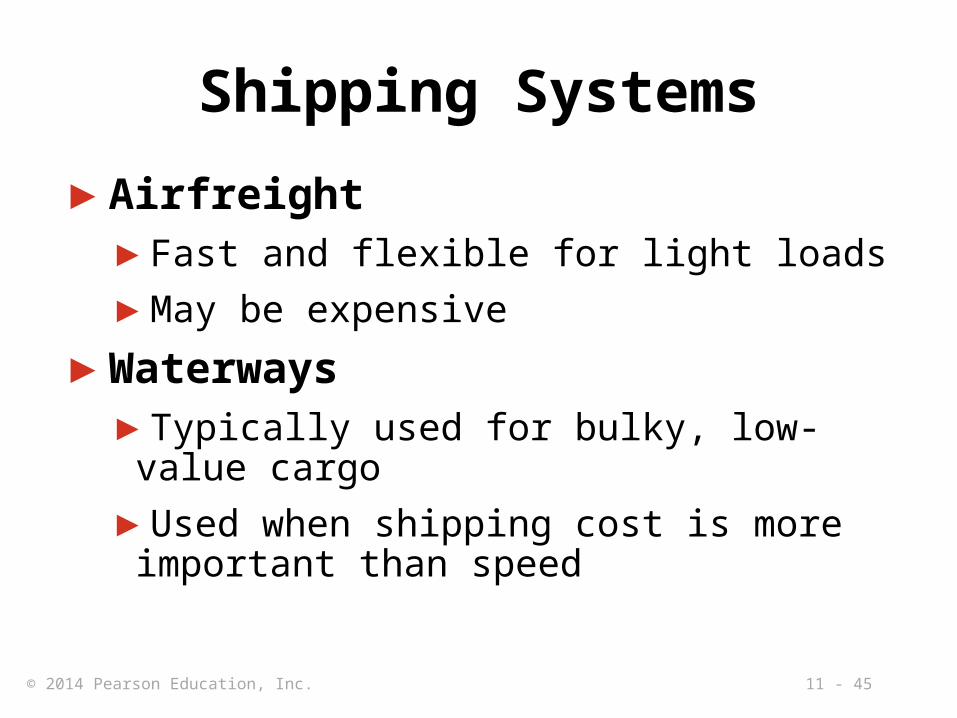
Shipping Systems
▶Airfreight▶Fast and flexible for light loads
▶May be expensive
▶Waterways▶Typically used for bulky, low-value cargo
▶Used when shipping cost is more important than speed

11 - 46© 2014 Pearson Education, Inc.
Shipping Systems
▶Pipelines▶Used for transporting oil, gas, and other
chemical products
▶Multimodal▶Combines shipping methods
▶Common, especially in international shipments
▶Aided by standardized containers

11 - 47© 2014 Pearson Education, Inc.
Cost and Speed of Shipments
▶Faster shipping is generally more expensive than slower shipping
▶Faster methods tend to involve smaller shipment sizes while slower methods involve very large shipment sizes

11 - 48© 2014 Pearson Education, Inc.
Warehousing
▶May be expensive, but alternatives may be more so
▶Fundamental purpose is to store goods
▶May provide other functions▶Consolidation
▶Break-bulk
▶Cross-docking
▶Channel assembly

11 - 49© 2014 Pearson Education, Inc.
Third-Party Logistics (3PL)
▶ Outsourcing logistics can reduce inventory, costs, and improve delivery reliability and speed
▶ Coordinate supplier inventory with delivery services
▶ May provide warehousing, assembly, testing, shipping, customs

11 - 50© 2014 Pearson Education, Inc.
Distribution Management▶The outbound flow of products
1. Rapid response
2. Product choice
3. Service
▶Increasing the number of facilities generally improves response time and customer satisfaction
▶Total costs are important

11 - 51© 2014 Pearson Education, Inc.
Distribution ManagementT
ime
Number of facilities
1 2 3 4 5
Response time
(a) Response Time
$
Number of facilities
1 2 3 4 5
Lowest cost
(b) Cost $
Total logistics cost
Facility costs
Inventory costs
Transportation costs
Figure 11.3

11 - 52© 2014 Pearson Education, Inc.
Distribution Management
Figure 11.3
$
Number of facilities
1 2 3 4 5
Revenue
(c) Cost, Revenue, and Profit
Total logistics costMax profit

11 - 53© 2014 Pearson Education, Inc.
Distribution Management
▶Facilities, packaging, and logistics
▶Selection and development of dealers or retailers
▶Downstream management as important as upstream management

11 - 54© 2014 Pearson Education, Inc.
Ethics and Sustainable Supply Chain Management
▶Personal ethics▶Critical to long term success of an
organization
▶Supply chains particularly susceptible
▶Ethics within the supply chain
▶Ethical behavior regarding the environment

11 - 55© 2014 Pearson Education, Inc.
Institute for Supply Management Principles and Standards
▶Promote and uphold responsibilities to one’s employer; positive supplier and customer relationships; sustainability and social responsibility; protection of confidential and proprietary information; applicable laws, regulations, and trade agreements; and development of professional competence
▶Avoid perceived impropriety; conflicts of interest; behaviors that negatively influence supply chain decisions; and improper reciprocal agreements

11 - 56© 2014 Pearson Education, Inc.
ISM Ethical Standards
1. PERCEIVED IMPROPRIETY. Prevent the intent and appearance of unethical or compromising conduct in relationships, actions and communications
2. CONFLICTS OF INTEREST. Ensure that any personal, business or other activity do not conflict with the lawful interests of your employer
3. ISSUES OF INFLUENCE. Avoid behaviors or actions that may negatively influence, or appear to influence, supply management decisions
11 - 57© 2014 Pearson Education, Inc.
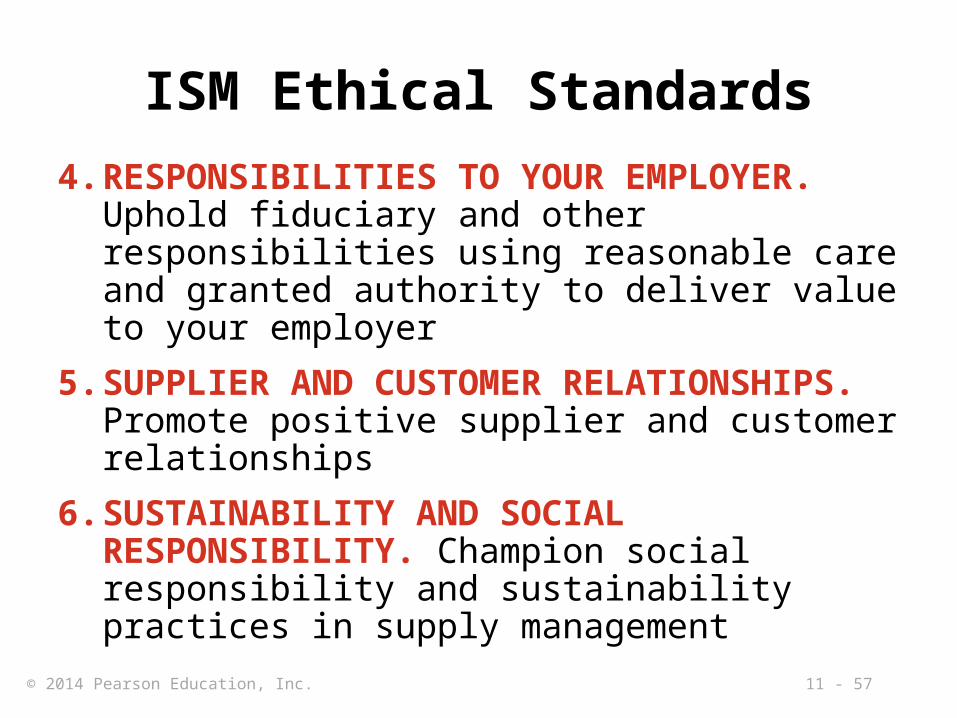
ISM Ethical Standards
4. RESPONSIBILITIES TO YOUR EMPLOYER. Uphold fiduciary and other responsibilities using reasonable care and granted authority to deliver value to your employer
5. SUPPLIER AND CUSTOMER RELATIONSHIPS. Promote positive supplier and customer relationships
6. SUSTAINABILITY AND SOCIAL RESPONSIBILITY. Champion social responsibility and sustainability practices in supply management

11 - 58© 2014 Pearson Education, Inc.
ISM Ethical Standards
7. CONFIDENTIAL AND PROPRIETARY INFORMATION. Protect confidential and proprietary information
8. RECIPROCITY. Avoid improper reciprocal agreements
9. APPLICABLE LAWS, REGULATIONS AND TRADE AGREEMENTS. Know and obey the letter and spirit of laws, regulations and trade agreements applicable to supply management

11 - 59© 2014 Pearson Education, Inc.
ISM Ethical Standards
10. PROFESSIONAL COMPETENCE. Develop skills, expand knowledge and conduct business that demonstrates competence and promotes the supply management profession

11 - 60© 2014 Pearson Education, Inc.
Establishing Sustainability in Supply Chains
▶Return or reverse logistics▶Sending returned products back up the supply
chain for resale, repair, reuse, remanufacture, recycling, or disposal
▶Closed-loop supply chain▶Proactive design of a supply chain that tries to
optimize all forward and reverse flows
▶Prepares for returns prior to product introduction

11 - 61© 2014 Pearson Education, Inc.
Establishing Sustainability in Supply Chains
TABLE 11.4 Management Challenges of Reverse Logistics
ISSUE FORWARD LOGISTICS REVERSE LOGISTICS
Forecasting Relatively straightforward More uncertain
Product quality Uniform Not uniform
Product packaging Uniform Often damaged
Pricing Relatively uniform Dependent on many factors
Speed Often very important Often not a priority
Distribution costs Easily visible Less directly visible
Inventory management Consistent Not consistent

11 - 62© 2014 Pearson Education, Inc.
Measuring Supply-Chain Performance
▶Assets committed to inventory
Percentage invested in
inventory= x 100
Total inventory investment
Total assets
► Home Depot had $11.4b inventory, total assets of $44.4b
Percentage invested in
inventory= x 100 = 25.7%
11.4
44.4

11 - 63© 2014 Pearson Education, Inc.
Measuring Supply-Chain Performance
TABLE 11.5
Inventory as Percentage of Total Assets (with examples of exceptional performance)
Manufacturer (Toyota 5%) 15%
Wholesale (Coca-Cola 2.9%) 34%
Restaurants (McDonald’s .05%) 2.9%
Retail (Home Depot 25.7%) 28%

11 - 64© 2014 Pearson Education, Inc.
Measuring Supply-Chain Performance
▶ Inventory turnover
Inventoryturnover =
Cost of goods sold
Inventory investment
► Inventory investment► Average of several periods► (beginning plus ending)/2► Ending inventory
11 - 65© 2014 Pearson Education, Inc.
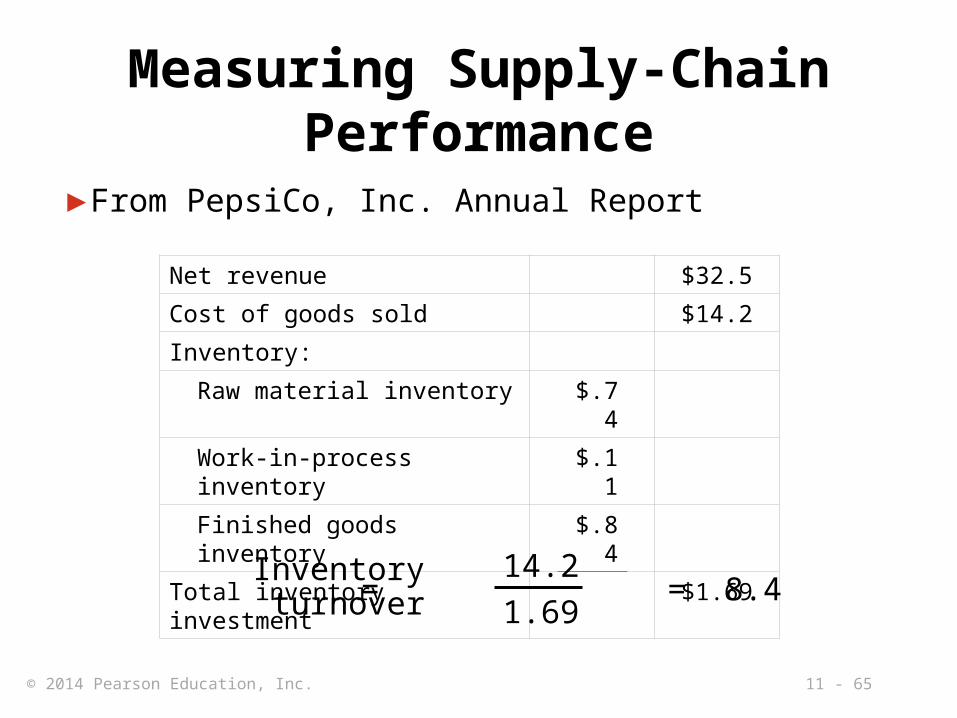
Measuring Supply-Chain Performance
▶ From PepsiCo, Inc. Annual Report
Net revenue $32.5
Cost of goods sold $14.2
Inventory:
Raw material inventory $.74
Work-in-process inventory $.11
Finished goods inventory $.84
Total inventory investment $1.69
Inventoryturnover = = 8.4
14.2
1.69

11 - 66© 2014 Pearson Education, Inc.
Measuring Supply-Chain Performance
TABLE 11.6 Examples of Annual Inventory Turnover
FOOD, BEVERAGE, RETAIL
Anheuser Busch 15
Coca-Cola 15
Home Depot 5
McDonald’s 112
MANUFACTURING
Dell Computer 90
Johnson controls 22
Toyota (overall) 13
Nissan (assembly) 150

11 - 67© 2014 Pearson Education, Inc.
Measuring Supply-Chain Performance
▶Weeks of supply
► For PepsiCo
Weeks of supply =
Inventory investment
Annual cost of goods sold
52 weeks
Inventory investment = $1.69bAverage weekly cost of goods sold = $14.2b / 52 = $.273b
Weeks of supply = 1.69 / .273 = 6.19 weeks

11 - 68© 2014 Pearson Education, Inc.
Benchmarking the Supply Chain
▶Comparison with benchmark firms
TABLE 11.7Supply Chain Metrics in the Consumer Packaged Goods Industry
TYPICAL FIRMS
BENCHMARK FIRMS
Order fill rate 71% 98%
Oder fulfillment lead time (days) 7 3
Cash-to-cash cycle time (days) 100 30
Inventory days of supply 50 20

11 - 69© 2014 Pearson Education, Inc.
The SCOR Model▶Processes, metrics and best practices
Plan: Demand/Supply planning and Management
Source: Identify, select, manage, and assess sources
Make: Manage production execution, testing and packaging
Deliver: Invoice, warehouse, transport and install
Return: Raw material Return: Finished goods
Figure 11.4

11 - 70© 2014 Pearson Education, Inc.
The SCOR ModelTABLE 11.8
SCOR Model Metrics to Help Firms Benchmark Performance Against the Industry
PERFORMANCE ATTRIBUTE SAMPLE METRIC CALCULATION
Supply chain reliability
Perfect order fulfillment (Total perfect orders) / (Total number of orders)
Supply chain responsiveness
Average order fulfillment cycle time
(Sum of actual cycle times for all orders delivered) / (Total number of orders delivered)
Supply chain agility Upside supply chain flexibility
Time required to achieve an unplanned 20% increase in delivered quantities
Supply chain costs Supply chain management costs
Cost to plan + Cost to source + Cost to deliver + Cost to return
Supply chain asset management
Cash-to-cash cycle time
Inventory days of supply + Days of receivables outstanding – Days of payables outstanding

11 - 71© 2014 Pearson Education, Inc.
Benchmarking the Supply Chain
▶Benchmarking useful
▶May not be adequate
▶Audits may be necessary▶Continuing communication, Understanding,
Trust, Performance, Corporate strategy
▶Foster a mutual belief that “we are in this together”

11 - 72© 2014 Pearson Education, Inc.
All rights reserved. No part of this publication may be reproduced, stored in a retrieval system, or transmitted, in any form or by any means, electronic, mechanical, photocopying, recording, or
otherwise, without the prior written permission of the publisher. Printed in the United States of America.

11 - 73© 2014 Pearson Education, Inc.

6 - 74© 2014 Pearson Education, Inc.
Managing Quality
PowerPoint presentation to accompany Heizer and Render Operations Management, Eleventh EditionPrinciples of Operations Management, Ninth Edition
PowerPoint slides by Jeff Heyl
66
© 2014 Pearson Education, Inc.

6 - 75© 2014 Pearson Education, Inc.
Outline► Global Company Profile:
Arnold Palmer Hospital
► Quality and Strategy► Defining Quality► Total Quality Management► Tools of TQM► The Role of Inspection► TQM in Services

6 - 76© 2014 Pearson Education, Inc.
Learning ObjectivesWhen you complete this chapter you should be able to:
1. Define quality and TQM
2. Describe the ISO international quality standards
3. Explain what Six Sigma is
4. Explain how benchmarking is used in TQM
5. Explain quality robust products and Taguchi concepts
6. Use the seven tools of TQM

6 - 77© 2014 Pearson Education, Inc.
Managing Quality Provides a Competitive Advantage
Arnold Palmer Hospital► Deliver over 12,000 babies annually
► Virtually every type of quality tool is employed► Continuous improvement
► Employee empowerment
► Benchmarking
► Just-in-time
► Quality tools© 2014 Pearson Education, Inc.

6 - 78© 2014 Pearson Education, Inc.
Quality and Strategy
► Managing quality supports differentiation, low cost, and response strategies
► Quality helps firms increase sales and reduce costs
► Building a quality organization is a demanding task

6 - 79© 2014 Pearson Education, Inc.
Two Ways Quality Improves Profitability
Improved Quality
Increased Profits
• Increased productivity
• Lower rework and scrap costs
• Lower warranty costs
Reduced Costs via
• Improved response
• Flexible pricing
• Improved reputation
Sales Gains via
Figure 6.1

6 - 80© 2014 Pearson Education, Inc.
The Flow of Activities
Organizational PracticesLeadership, Mission statement, Effective operating procedures, Staff support, TrainingYields: What is important and what is to be
accomplished
Quality PrinciplesCustomer focus, Continuous improvement, Benchmarking, Just-in-time, Tools of TQMYields: How to do what is important and to be
accomplished
Employee FulfillmentEmpowerment, Organizational commitmentYields: Employee attitudes that can accomplish
what is importantCustomer SatisfactionWinning orders, Repeat customersYields: An effective organization with
a competitive advantage
Figure 6.2

6 - 81© 2014 Pearson Education, Inc.
Defining Quality
An operations manager’s objective is to build a total quality
management system that identifies and satisfies customer needs

6 - 82© 2014 Pearson Education, Inc.
Defining Quality
The totality of features and characteristics of a product or service
that bears on its ability to satisfy stated or implied needs
American Society for Quality

6 - 83© 2014 Pearson Education, Inc.
Different Views
► User-based: better performance, more features
► Manufacturing-based: conformance to standards, making it right the first time
► Product-based: specific and measurable attributes of the product

6 - 84© 2014 Pearson Education, Inc.
Implications of Quality
1. Company reputation► Perception of new products
► Employment practices
► Supplier relations
2. Product liability► Reduce risk
3. Global implications► Improved ability to compete

6 - 85© 2014 Pearson Education, Inc.
Malcolm Baldrige National Quality Award
► Established in 1988 by the U.S. government
► Designed to promote TQM practices
► Recent winners include
Lockheed Martin Missiles and Fire Control, MESA Products Inc., North Mississippi Health Services, City of Irving, Concordia Publishing House, Henry Ford Health System, MEDRAD, Nestlé Purina PetCare Co., Montgomery County Public Schools

6 - 86© 2014 Pearson Education, Inc.
Baldrige CriteriaApplicants are evaluated on:
CATEGORIES POINTS
Leadership 120
Strategic Planning 85
Customer Focus 85
Measurement, Analysis, and Knowledge Management
90
Workforce Focus 85
Operations Focus 85
Results 450

6 - 87© 2014 Pearson Education, Inc.
ISO 9000 International Quality Standards
► International recognition► Encourages quality management
procedures, detailed documentation, work instructions, and recordkeeping
► 2009 revision emphasized sustained success
► Over one million certifications in 178 countries
► Critical for global business

6 - 88© 2014 Pearson Education, Inc.
ISO 9000 International Quality Standards
► Management principles► Top management leadership► Customer satisfaction► Continual improvement ► Involvement of people► Process analysis► Use of data-driven decision making► A systems approach to management► Mutually beneficial supplier relationships

6 - 89© 2014 Pearson Education, Inc.
Costs of Quality► Prevention costs - reducing the
potential for defects
► Appraisal costs - evaluating products, parts, and services
► Internal failure costs - producing defective parts or service before delivery
► External failure costs - defects discovered after delivery

6 - 90© 2014 Pearson Education, Inc.
External Failure
Internal Failure
Costs of Quality
Total Cost
Quality Improvement
Total Cost

6 - 91© 2014 Pearson Education, Inc.
Takumi
A Japanese character that symbolizes a broader dimension than quality, a deeper process than education, and a more perfect method than persistence

6 - 92© 2014 Pearson Education, Inc.
Leaders in Quality
TABLE 6.1 Leaders in the Field of Quality Management
LEADER PHILOSOPHY/CONTRIBUTION
W. Edwards Deming Deming insisted management accept responsibility for building good systems. The employee cannot produce products that on average exceed the quality of what the process is capable of producing. His 14 points for implementing quality improvement are presented in this chapter.
Joseph M. Juran A pioneer in teaching the Japanese how to improve quality, Juran believed strongly in top-management commitment, support, and involvement in the quality effort. He was also a believer in teams that continually seek to raise quality standards. Juran varies from Deming somewhat in focusing on the customer and defining quality as fitness for use, not necessarily the written specifications.

6 - 93© 2014 Pearson Education, Inc.
Leaders in Quality
TABLE 6.1 Leaders in the Field of Quality Management
LEADER PHILOSOPHY/CONTRIBUTION
Amarnd Feigenbaum His 1961 book Total Quality Control laid out 40 steps to quality improvement processes. He viewed quality not as a set of tools but as a total field that integrated the processes of a company. His work in how people learn from each other’s successes led to the field of cross-functional teamwork.
Philip B. Crosby Quality Is Free was Crosby’s attention-getting book published in 1979. Crosby believed that in the traditional trade-off between the cost of improving quality and the cost of poor quality, the cost of poor quality is understated. The cost of poor quality should include all of the things that are involved in not doing the job right the first time. Crosby coined the term zero defects and stated, “There is absolutely no reason for having errors or defects in any product or service.”

6 - 94© 2014 Pearson Education, Inc.
Ethics and Quality Management
► Operations managers must deliver healthy, safe, quality products and services
► Poor quality risks injuries, lawsuits, recalls, and regulation
► Ethical conduct must dictate response to problems
► All stakeholders much be considered

6 - 95© 2014 Pearson Education, Inc.
Total Quality Management
► Encompasses entire organization from supplier to customer
► Stresses a commitment by management to have a continuing companywide drive toward excellence in all aspects of products and services that are important to the customer

6 - 96© 2014 Pearson Education, Inc.
Deming’s Fourteen Points
TABLE 6.2 Deming’s 14 Points for Implementing Quality Improvement
1. Create consistency of purpose
2. Lead to promote change
3. Build quality into the product; stop depending on inspections to catch problems
4. Build long-term relationships based on performance instead of awarding business on price
5. Continuously improve product, quality, and service
6. Start training
7. Emphasize leadership

6 - 97© 2014 Pearson Education, Inc.
Deming’s Fourteen Points
TABLE 6.2 Deming’s 14 Points for Implementing Quality Improvement
8. Drive out fear
9. Break down barriers between departments
10. Stop haranguing workers
11. Support, help, and improve
12. Remove barriers to pride in work
13. Institute a vigorous program of education and self-improvement
14. Put everyone in the company to work on the transformation

6 - 98© 2014 Pearson Education, Inc.
Seven Concepts of TQM
1. Continuous improvement
2. Six Sigma
3. Employee empowerment
4. Benchmarking
5. Just-in-time (JIT)
6. Taguchi concepts
7. Knowledge of TQM tools
6 - 99© 2014 Pearson Education, Inc.
Continuous Improvement
► Never-ending process of continual improvement
► Covers people, equipment, materials, procedures
► Every operation can be improved

6 - 100© 2014 Pearson Education, Inc.
4. ActImplement the plan, document
2. DoTest the
plan
3. CheckIs the plan working?
1. PlanIdentify the pattern and make a plan
Shewhart’s PDCA Model
Figure 6.3

6 - 101© 2014 Pearson Education, Inc.
Continuous Improvement
► Kaizen describes the ongoing process of unending improvement
► TQM and zero defects also used to describe continuous improvement

6 - 102© 2014 Pearson Education, Inc.
Six Sigma► Two meanings
► Statistical definition of a process that is 99.9997% capable, 3.4 defects per million opportunities (DPMO)
► A program designed to reduce defects, lower costs, save time, and improve customer satisfaction
► A comprehensive system for achieving and sustaining business success

6 - 103© 2014 Pearson Education, Inc.
Six Sigma► Two meanings
► Statistical definition of a process that is 99.9997% capable, 3.4 defects per million opportunities (DPMO)
► A program designed to reduce defects, lower costs, save time, and improve customer satisfaction
► A comprehensive system for achieving and sustaining business success
Mean
Lower limits Upper limits
3.4 defects/million
±6
2,700 defects/million
±3
Figure 6.4

6 - 104© 2014 Pearson Education, Inc.
Six Sigma Program
► Originally developed by Motorola, adopted and enhanced by Honeywell and GE
► Highly structured approach to process improvement► A strategy► A discipline – DMAIC► A set of 7 tools 66

6 - 105© 2014 Pearson Education, Inc.
Six Sigma1. Defines the project’s purpose, scope, and outputs,
identifies the required process information keeping in mind the customer’s definition of quality
2. Measures the process and collects data
3. Analyzes the data ensuringrepeatability and reproducibility
4. Improves by modifying or redesigning existing processes and procedures
5. Controls the new process to make sure performance levels are maintained
DMAIC Approach

6 - 106© 2014 Pearson Education, Inc.
Implementing Six Sigma► Emphasize defects per million opportunities
as a standard metric
► Provide extensive training
► Focus on corporate sponsor support (Champions)
► Create qualified process improvement experts (Black Belts, Green Belts, etc.)
► Set stretch objectivesThis cannot be accomplished without a major commitment from top level
management

6 - 107© 2014 Pearson Education, Inc.
Employee Empowerment► Getting employees involved in product and
process improvements► 85% of quality problems are due
to process and material
► Techniques1) Build communication networks
that include employees
2) Develop open, supportive supervisors
3) Move responsibility to employees
4) Build a high-morale organization
5) Create formal team structures

6 - 108© 2014 Pearson Education, Inc.
Quality Circles
► Group of employees who meet regularly to solve problems
► Trained in planning, problem solving, and statistical methods
► Often led by a facilitator
► Very effective when done properly

6 - 109© 2014 Pearson Education, Inc.
BenchmarkingSelecting best practices to use as a standard for performance
1. Determine what to benchmark
2. Form a benchmark team
3. Identify benchmarking partners
4. Collect and analyze benchmarking information
5. Take action to match or exceed the benchmark
6 - 110© 2014 Pearson Education, Inc.
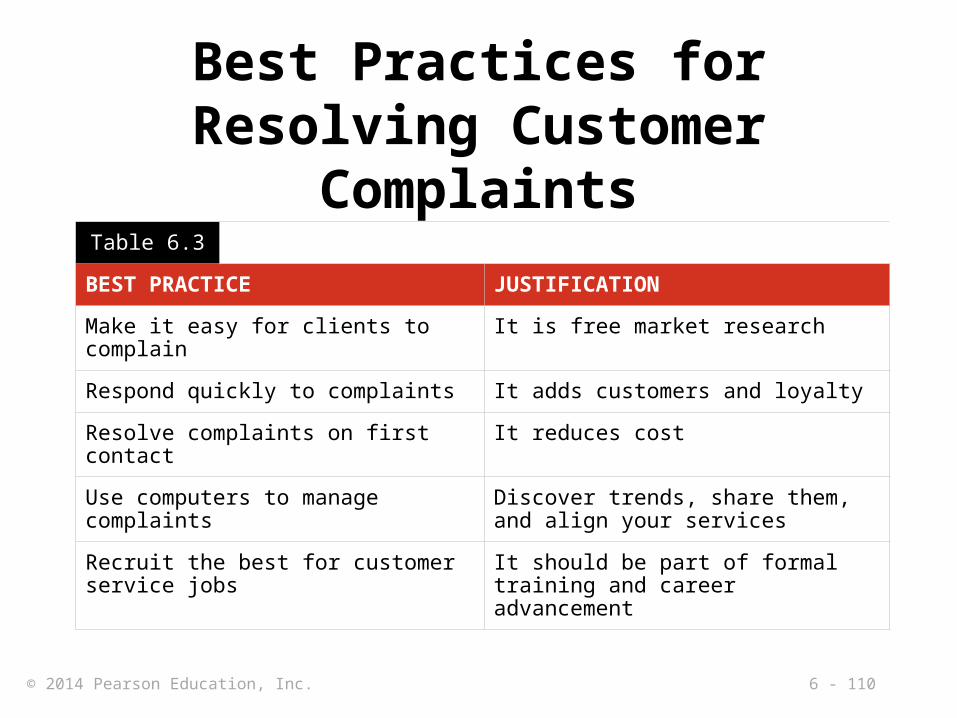
Best Practices for Resolving Customer Complaints
Table 6.3
BEST PRACTICE JUSTIFICATION
Make it easy for clients to complain It is free market research
Respond quickly to complaints It adds customers and loyalty
Resolve complaints on first contact It reduces cost
Use computers to manage complaints Discover trends, share them, and align your services
Recruit the best for customer service jobs
It should be part of formal training and career advancement

6 - 111© 2014 Pearson Education, Inc.
Internal Benchmarking
▶ When the organization is large enough
▶ Data more accessible
▶ Can and should be established in a variety of areas

6 - 112© 2014 Pearson Education, Inc.
Just-in-Time (JIT)
Relationship to quality:
► JIT cuts the cost of quality► JIT improves quality► Better quality means less
inventory and better, easier-to-employ JIT system

6 - 113© 2014 Pearson Education, Inc.
Just-in-Time (JIT)
► ‘Pull’ system of production scheduling including supply management
► Production only when signaled
► Allows reduced inventory levels► Inventory costs money and hides
process and material problems
► Encourages improved process and product quality
6 - 114© 2014 Pearson Education, Inc.
Taguchi Concepts► Engineering and experimental design
methods to improve product and process design
► Identify key component and process variables affecting product variation
► Taguchi Concepts► Quality robustness► Quality loss function► Target-oriented quality

6 - 115© 2014 Pearson Education, Inc.
Quality Robustness
► Ability to produce products uniformly in adverse manufacturing and environmental conditions
► Remove the effects of adverse conditions
► Small variations in materials and process do not destroy product quality

6 - 116© 2014 Pearson Education, Inc.
Quality Loss Function
► Shows that costs increase as the product moves away from what the customer wants
► Costs include customer dissatisfaction, warranty and service, internal scrap and repair, and costs to society
► Traditional conformance specifications are too simplistic
Target-
oriented
quality

6 - 117© 2014 Pearson Education, Inc.
Unacceptable
Poor
GoodBest
Fair
Quality Loss Function
High loss
Loss (to producing organization, customer, and society)
Low loss
Figure 6.5
L = D2C
whereL = loss to societyD2 = square of the distance from target valueC = cost of deviation
Frequency
Lower Target Upper
Specification
Target-oriented quality yields more product in the “best” category
Target-oriented quality brings product toward the target value
Conformance-oriented quality keeps products within 3 standard deviations

6 - 118© 2014 Pearson Education, Inc.
TQM Tools
► Tools for Generating Ideas► Check Sheet► Scatter Diagram► Cause-and-Effect Diagram
► Tools to Organize the Data► Pareto Chart► Flowchart (Process Diagram)

6 - 119© 2014 Pearson Education, Inc.
TQM Tools
► Tools for Identifying Problems► Histogram► Statistical Process Control Chart

6 - 120© 2014 Pearson Education, Inc.
Hour
Defect 1 2 3 4 5 6 7 8
A
B
C
Seven Tools of TQM
(a) Check Sheet: An organized method of recording data
Figure 6.6
/
/ /
/
/ /
/ //
/
/ /
/ / / /
/ /
/ /
/ //
// /
/ // /

6 - 121© 2014 Pearson Education, Inc.
Seven Tools of TQM
(b) Scatter Diagram: A graph of the value of one variable vs. another variable
Absenteeism
Pro
duct
ivity
Figure 6.6

6 - 122© 2014 Pearson Education, Inc.
Seven Tools of TQM
(c) Cause-and-Effect Diagram: A tool that identifies process elements (causes) that might effect an outcome
Figure 6.6
Cause
Materials Methods
Manpower Machinery
Effect

6 - 123© 2014 Pearson Education, Inc.
Seven Tools of TQM
(d) Pareto Chart: A graph to identify and plot problems or defects in descending order of frequency
Figure 6.6
Fre
que
ncy
Pe
rce
nt
A B C D E

6 - 124© 2014 Pearson Education, Inc.
Seven Tools of TQM
(e) Flowchart (Process Diagram): A chart that describes the steps in a process
Figure 6.6

6 - 125© 2014 Pearson Education, Inc.
Seven Tools of TQM
(f) Histogram: A distribution showing the frequency of occurrences of a variable
Figure 6.6
Distribution
Repair time (minutes)
Fre
que
ncy

6 - 126© 2014 Pearson Education, Inc.
Seven Tools of TQM
(g) Statistical Process Control Chart: A chart with time on the horizontal axis to plot values of a statistic
Figure 6.6
Upper control limit
Target value
Lower control limit
Time

6 - 127© 2014 Pearson Education, Inc.
Cause-and-Effect DiagramsMaterial
(ball)Method
(shooting process)
Machine(hoop &
backboard)
Manpower(shooter)
Missed free-throws
Figure 6.7
Rim alignment
Rim size
Backboard stability
Rim height
Follow-through
Hand position
Aiming point
Bend knees
Balance
Size of ball
Lopsidedness
Grain/Feel (grip)
Air pressure
Training
Conditioning Motivation
Concentration
Consistency

6 - 128© 2014 Pearson Education, Inc.
Pareto Charts
Number of occurrences
Room svc Check-in Pool hours Minibar Misc.72% 16% 5% 4% 3%
12
4 3 2
54
– 100
– 93– 88
– 72
70 –
60 –
50 –
40 –
30 –
20 –
10 –
0 –
Fre
quen
cy (
num
ber)
Causes and percent of the total
Cum
ulat
ive
perc
ent
Data for October

6 - 129© 2014 Pearson Education, Inc.
Flow ChartsMRI Flowchart
1. Physician schedules MRI2. Patient taken to MRI3. Patient signs in4. Patient is prepped5. Technician carries out MRI6. Technician inspects film
7. If unsatisfactory, repeat8. Patient taken back to room9. MRI read by radiologist10. MRI report transferred to
physician11. Patient and physician
discuss
11
10
20%
9
880%
1 2 3 4 5 6 7

6 - 130© 2014 Pearson Education, Inc.
Statistical Process Control (SPC)
► Uses statistics and control charts to tell when to take corrective action
► Drives process improvement► Four key steps
► Measure the process
► When a change is indicated, find the assignable cause
► Eliminate or incorporate the cause
► Restart the revised process

6 - 131© 2014 Pearson Education, Inc.
Control Charts
Upper control limit
Coach’s target value
Lower control limit
Game number
| | | | | | | | |
1 2 3 4 5 6 7 8 9
40%
20%
0%
Plot the percent of free throws missed
Figure 6.8

6 - 132© 2014 Pearson Education, Inc.
Inspection► Involves examining items to see if an
item is good or defective► Detect a defective product
► Does not correct deficiencies in process or product
► It is expensive
► Issues► When to inspect► Where in process to inspect

6 - 133© 2014 Pearson Education, Inc.
When and Where to Inspect
1. At the supplier’s plant while the supplier is producing
2. At your facility upon receipt of goods from your supplier
3. Before costly or irreversible processes
4. During the step-by-step production process
5. When production or service is complete
6. Before delivery to your customer
7. At the point of customer contact

6 - 134© 2014 Pearson Education, Inc.
Inspection► Many problems
► Worker fatigue► Measurement error► Process variability
► Cannot inspect quality into a product► Robust design, empowered
employees, and sound processes are better solutions
6 - 135© 2014 Pearson Education, Inc.
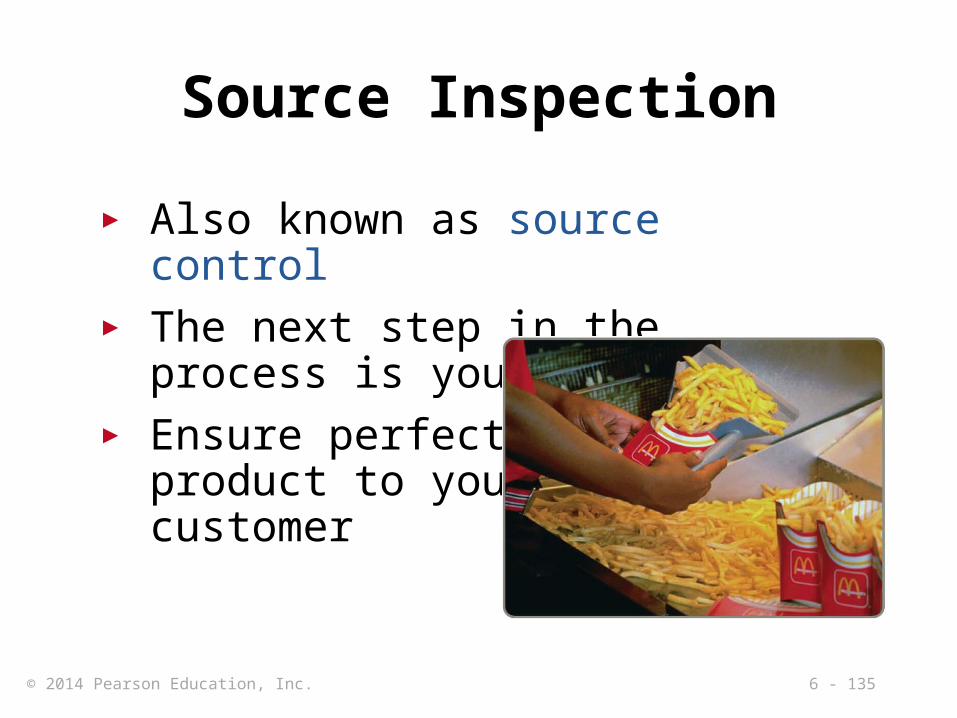
Source Inspection
► Also known as source control► The next step in the process is your
customer► Ensure perfect
product to your customer

6 - 136© 2014 Pearson Education, Inc.
Source Inspection
► Poka-yoke is the concept of foolproof devices or techniques designed to pass only acceptable product
► Checklists ensureconsistency and completeness

6 - 137© 2014 Pearson Education, Inc.
Service Industry InspectionTABLE 6.4 Examples of Inspection in Services
ORGANIZATION WHAT IS INSPECTED STANDARD
Jones Law Office Receptionist performance
Billing
Attorney
Phone answered by the second ring
Accurate, timely, and correct format
Promptness in returning calls
Hard Rock Hotel Reception desk
Doorman
Room
Minibar
Use customer’s name
Greet guest in less than 30 seconds
All lights working, spotless bathroom
Restocked and charges accurately posted to bill

6 - 138© 2014 Pearson Education, Inc.
Service Industry InspectionTABLE 6.4 Examples of Inspection in Services
ORGANIZATION WHAT IS INSPECTED STANDARD
Arnold Palmer Hospital Billing
Pharmacy
Lab
Nurses
Admissions
Accurate, timely, and correct format
Prescription accuracy, inventory accuracy
Audit for lab-test accuracy
Charts immediately updated
Data entered correctly and completely
Olive Garden Restaurant
Busboy
Busboy
Waiter
Serves water and bread within 1 minute
Clears all entrée items and crumbs prior to dessert
Knows and suggest specials, desserts

6 - 139© 2014 Pearson Education, Inc.
Service Industry InspectionTABLE 6.4 Examples of Inspection in Services
ORGANIZATION WHAT IS INSPECTED STANDARD
Nordstrom Department Store
Display areas
Stockrooms
Salesclerks
Attractive, well-organized, stocked, good lighting
Rotation of goods, organized, clean
Neat, courteous, very knowledgeable

6 - 140© 2014 Pearson Education, Inc.
Attributes Versus Variables► Attributes
► Items are either good or bad, acceptable or unacceptable
► Does not address degree of failure
► Variables► Measures dimensions such as weight,
speed, height, or strength
► Falls within an acceptable range
► Use different statistical techniques

6 - 141© 2014 Pearson Education, Inc.
TQM In Services
► Service quality is more difficult to measure than the quality of goods
► Service quality perceptions depend on 1) Intangible differences between
products
2) Intangible expectations customers have of those products

6 - 142© 2014 Pearson Education, Inc.
Service Quality
The Operations Manager must recognize:
► The tangible component of services is important
► The service process is important► The service is judged against the
customer’s expectations► Exceptions will occur

6 - 143© 2014 Pearson Education, Inc.
Service Specifications

6 - 144© 2014 Pearson Education, Inc.
Determinants of Service Quality
Table 6.5
Reliability involves consistency of performance and dependability
Responsiveness concerns the willingness or readiness of employees to provide service
Competence means possession of the required skills and knowledge to perform the service
Access involves approachability and ease of contact
Courtesy involves politeness, respect, consideration, and friendliness
Communication means keeping customers informed and listening to them
Credibility involves trustworthiness, believability, and honesty
Security is the freedom from danger, risk, or doubt
Understanding/knowing the customer involves making the effort to understand the customer’s needs
Tangibles include the physical evidence of the service

6 - 145© 2014 Pearson Education, Inc.
Service Recovery Strategy
► Managers should have a plan for when services fail
► Marriott’s LEARN routine► Listen► Empathize► Apologize► React► Notify

6 - 146© 2014 Pearson Education, Inc.
All rights reserved. No part of this publication may be reproduced, stored in a retrieval system, or transmitted, in any form or by any means, electronic, mechanical, photocopying, recording, or
otherwise, without the prior written permission of the publisher. Printed in the United States of America.