10K 03202007 rev - Citizens Bank · Since it was almost Georgia’s lunch hour she volunteered to...
86
McMinnville Corvallis Junction City Springfield Dallas Harrisburg Albany Philomath Charting the future Citizens Bankcorp Annual Report 2006 Since 1957
Transcript of 10K 03202007 rev - Citizens Bank · Since it was almost Georgia’s lunch hour she volunteered to...

McMinnville
Corvallis
Junction CitySpringfield
Dallas
Harrisburg
Albany
Philomath
To Our Shareholders
We feel very good about the progress we made during the year 2006 in our journey down the road of continuous improvement in Shareholder value. We were quite productive financially, earning $5.459 million net, after the payment of more than $2.941 million in taxes, a new profitability record for us. This level of profitability represents a Return on Average Assets of 1.60%, and a Return on Average Equity of 11.8%. This financial performance defines us as a high performance banking company when compared to our peers nationally. We increased the size of the Bank’s total asset base to $359 million, a 6% increase over the total for 12/31/05. And, we ended the year with total Shareholder Equity in the amount of $46.5 million, a 10% increase over the prior year end, after the payment of a record cash dividend in the amount of $.52 per share. While we acknowledge the importance of a high level of financial productivity, and a sustained increase in total assets, we feel that it is equally important to maintain our commitment to safety and soundness. The Bank’s loan and investment portfolios continue to be very sound, and our compliance with regulations is extraordinarily strong. Additionally, during the year, we spent a good deal of time in the planning process and in “strategic thinking”. This process helped us re-commit to the primary goals of strong financial performance, controlled growth, and a focus on our employee assets. We are certain that a continued high level of financial performance will result from a clear strategic vision, good risk management practices, and a healthy culture.
We made significant advances in technology and in our operating systems. These gains are not as discernible to our customers and the public as other financial measurements displayed in the Balance Sheet or Income Statement, but they are similarly important with regards to positioning the Bank for continued high performance. Early in the year we introduced check imaging to our customers. This system, which replaces paper checks with computer generated images, has been well received by our customers and our transition to this technology was done in an almost seamless manner.
Late in the year the Board of Directors approved the opening of a new branch office in West Eugene. Although we are still months away from opening this office, we have developed a business plan, identified the staff, and started working to develop business in that area. During 2006 we held Board of Directors meetings in each of the communities where we have a branch office. This was a good opportunity to hear from branch management, com-munity leaders, and customers about the challenges we face, and the opportunities they create in each area of the Bank. We extend a special thank you to all of our branch leaders, community leaders and customers, who made these visits very special for us.
Respectfully yours,
William HumphreysPresident and CEO
Citizens Bancorp
Citizens Bancorp Annual Report 2006
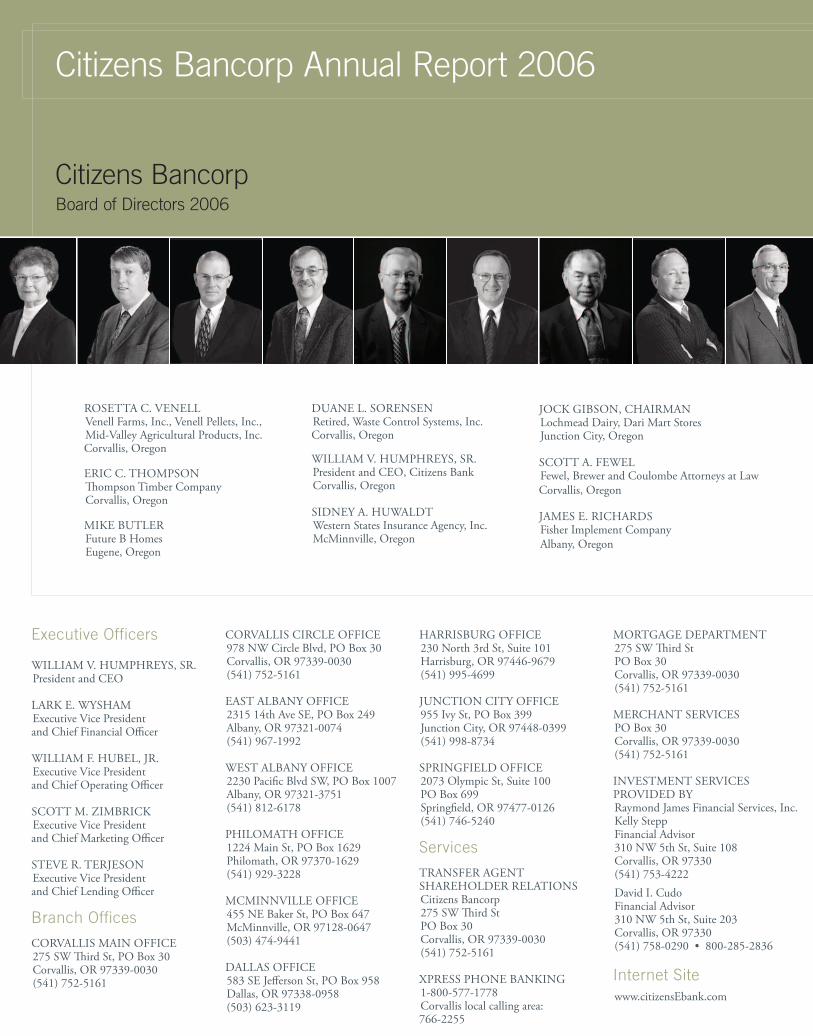
ROSEttA C. VEnELLVenell Farms, Inc., Venell Pellets, Inc., Mid-Valley Agricultural Products, Inc.Corvallis, Oregon
ERIC C. tHOMPSOnThompson timber Company Corvallis, Oregon
MIkE ButLERFuture B HomesEugene, Oregon
DuAnE L. SOREnSEnRetired, Waste Control Systems, Inc.Corvallis, Oregon
WILLIAM V. HuMPHREyS, SR.President and CEO, Citizens BankCorvallis, Oregon
SIDnEy A. HuWALDtWestern States Insurance Agency, Inc.McMinnville, Oregon
JOCk GIBSOn, CHAIRMAnLochmead Dairy, Dari Mart StoresJunction City, Oregon
SCOtt A. FEWELFewel, Brewer and Coulombe Attorneys at LawCorvallis, Oregon
JAMES E. RICHARDSFisher Implement CompanyAlbany, Oregon
Executive Officers
WILLIAM V. HuMPHREyS, SR.President and CEO
LARk E. WySHAMExecutive Vice President and Chief Financial Officer
WILLIAM F. HuBEL, JR.Executive Vice President and Chief Operating Officer
SCOtt M. ZIMBRICkExecutive Vice President and Chief Marketing Officer
StEVE R. tERJESOnExecutive Vice President and Chief Lending Officer
Branch Offices
CORVALLIS MAIn OFFICE275 SW Third St, PO Box 30Corvallis, OR 97339-0030(541) 752-5161
CORVALLIS CIRCLE OFFICE978 nW Circle Blvd, PO Box 30Corvallis, OR 97339-0030(541) 752-5161
EASt ALBAny OFFICE2315 14th Ave SE, PO Box 249Albany, OR 97321-0074(541) 967-1992
WESt ALBAny OFFICE2230 Pacific Blvd SW, PO Box 1007Albany, OR 97321-3751(541) 812-6178
PHILOMAtH OFFICE1224 Main St, PO Box 1629Philomath, OR 97370-1629(541) 929-3228
MCMInnVILLE OFFICE455 nE Baker St, PO Box 647McMinnville, OR 97128-0647(503) 474-9441
DALLAS OFFICE583 SE Jefferson St, PO Box 958Dallas, OR 97338-0958(503) 623-3119
HARRISBuRG OFFICE230 north 3rd St, Suite 101Harrisburg, OR 97446-9679(541) 995-4699
JunCtIOn CIty OFFICE955 Ivy St, PO Box 399Junction City, OR 97448-0399(541) 998-8734
SPRInGFIELD OFFICE2073 Olympic St, Suite 100PO Box 699Springfield, OR 97477-0126(541) 746-5240
Services
tRAnSFER AGEntSHAREHOLDER RELAtIOnSCitizens Bancorp275 SW Third StPO Box 30Corvallis, OR 97339-0030(541) 752-5161
XPRESS PHOnE BAnkInG1-800-577-1778Corvallis local calling area: 766-2255
MORtGAGE DEPARtMEnt275 SW Third StPO Box 30Corvallis, OR 97339-0030(541) 752-5161
MERCHAnt SERVICESPO Box 30Corvallis, OR 97339-0030(541) 752-5161
InVEStMEnt SERVICES PROVIDED ByRaymond James Financial Services, Inc.kelly SteppFinancial Advisor310 nW 5th St, Suite 108Corvallis, OR 97330(541) 753-4222David I. CudoFinancial Advisor310 nW 5th St, Suite 203Corvallis, OR 97330(541) 758-0290 • 800-285-2836
Internet Sitewww.citizensEbank.com
Jock GibsonChairman of the Board
Board of Directors 2006
“... we spent a good deal of time in the planning process and in ‘strategic thinking’.”
– Jock Gibson Chairman of the Board
– William Humphreys President and CEO
“... we feel that it is equally important to maintain our commitment to safety and soundness.”
Charting the futureCitizens Bankcorp Annual Report 2006
Since 1957
$250,000
$225,000
$200,000
$175,000
$150,000
Total LoansDollars in Thousands
Shareholder EquityDollars in Thousands
$45,000
$40,000
$35,000
$30,000
$25,000
$5,500
$5,000
$4,500
$4,000
$3,500
Net IncomeDollars in Thousands
‘02 ‘03 ‘04 ‘05 ‘06
$350,000
$300,000
$250,000
$200,000
$150,000
Total AssetsDollars in Thousands
$270,000
$260,000
$250,000
$240,000
$230,000
Total DepositsDollars in Thousands
Member FDICEqual Housing Lender
‘02 ‘03 ‘04 ‘05 ‘06 ‘02 ‘03 ‘04 ‘05 ‘06
‘02 ‘03 ‘04 ‘05 ‘06 ‘02 ‘03 ‘04 ‘05 ‘06
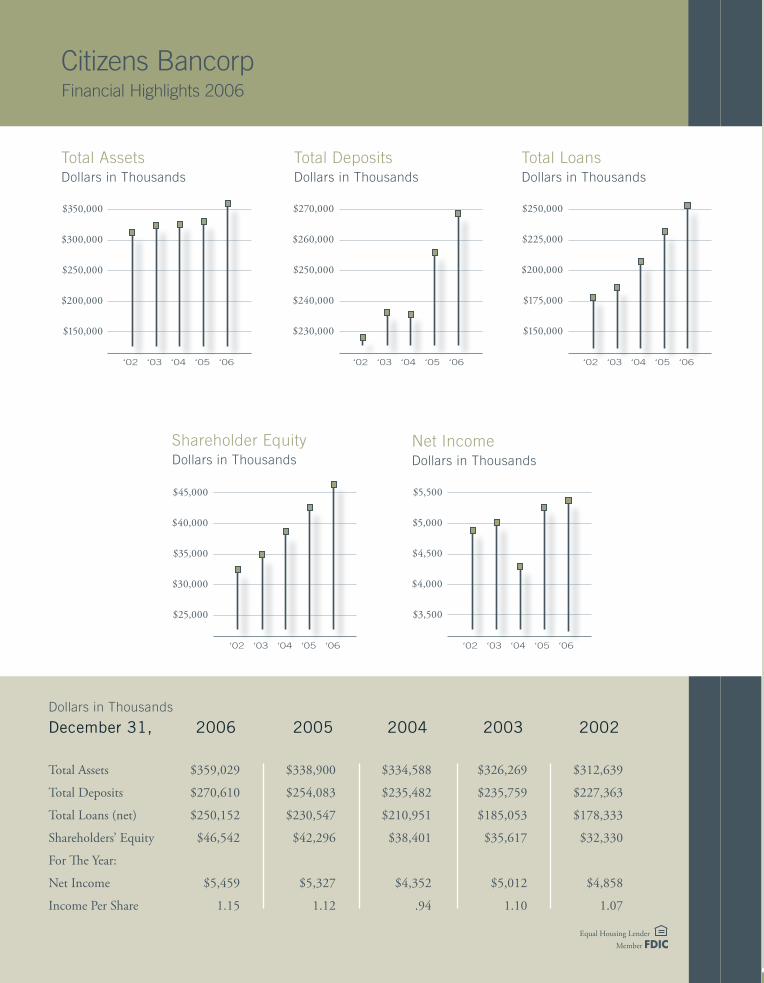
Citizens BancorpFinancial Highlights 2006
Dollars in Thousands
December 31, 2006 2005 2004 2003 2002
total Assets $359,029 $338,900 $334,588 $326,269 $312,639
total Deposits $270,610 $254,083 $235,482 $235,759 $227,363
total Loans (net) $250,152 $230,547 $210,951 $185,053 $178,333
Shareholders’ Equity $46,542 $42,296 $38,401 $35,617 $32,330
For The year:
net Income $5,459 $5,327 $4,352 $5,012 $4,858
Income Per Share 1.15 1.12 .94 1.10 1.07
2
3
4
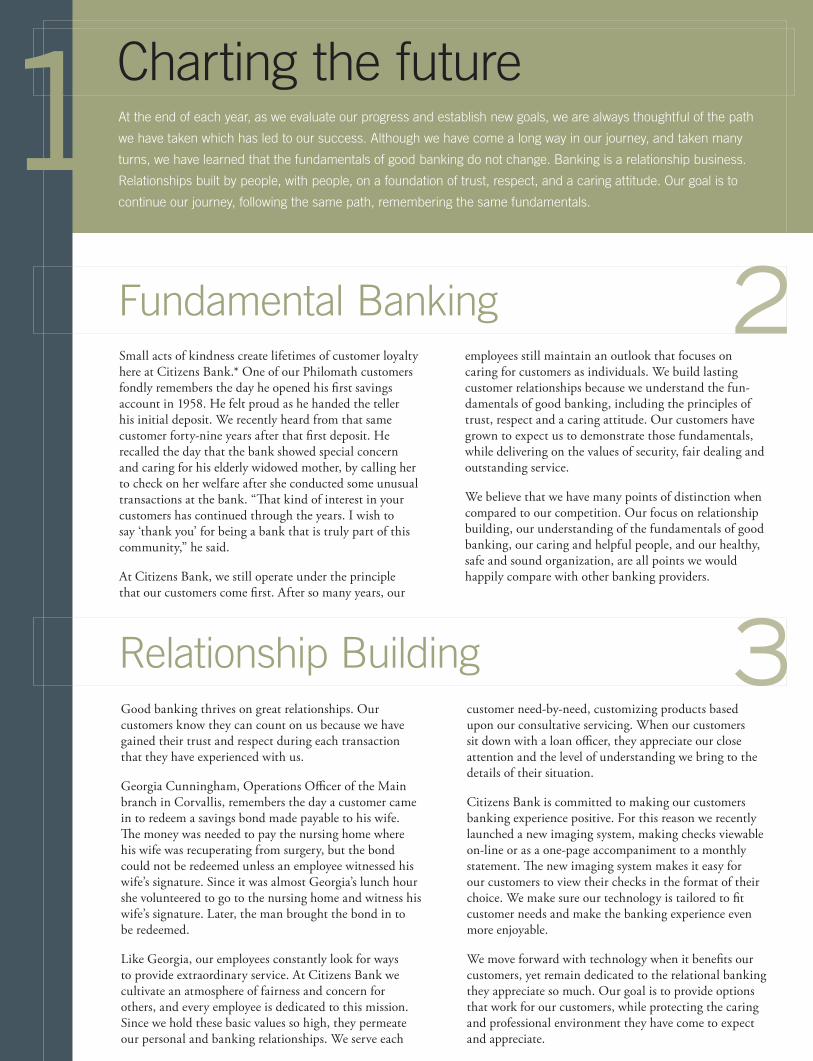
At the end of each year, as we evaluate our progress and establish new goals, we are always thoughtful of the path
we have taken which has led to our success. Although we have come a long way in our journey, and taken many
turns, we have learned that the fundamentals of good banking do not change. Banking is a relationship business.
Relationships built by people, with people, on a foundation of trust, respect, and a caring attitude. Our goal is to
continue our journey, following the same path, remembering the same fundamentals.
Small acts of kindness create lifetimes of customer loyalty here at Citizens Bank.* One of our Philomath customers fondly remembers the day he opened his first savings account in 1958. He felt proud as he handed the teller his initial deposit. We recently heard from that same customer forty-nine years after that first deposit. He recalled the day that the bank showed special concern and caring for his elderly widowed mother, by calling her to check on her welfare after she conducted some unusual transactions at the bank. “That kind of interest in your customers has continued through the years. I wish to say ‘thank you’ for being a bank that is truly part of this community,” he said.
At Citizens Bank, we still operate under the principle that our customers come first. After so many years, our
employees still maintain an outlook that focuses on caring for customers as individuals. We build lasting customer relationships because we understand the fun-damentals of good banking, including the principles of trust, respect and a caring attitude. Our customers have grown to expect us to demonstrate those fundamentals, while delivering on the values of security, fair dealing and outstanding service.
We believe that we have many points of distinction when compared to our competition. Our focus on relationship building, our understanding of the fundamentals of good banking, our caring and helpful people, and our healthy, safe and sound organization, are all points we would happily compare with other banking providers.
Good banking thrives on great relationships. Our customers know they can count on us because we have gained their trust and respect during each transaction that they have experienced with us.
Georgia Cunningham, Operations Officer of the Main branch in Corvallis, remembers the day a customer came in to redeem a savings bond made payable to his wife. The money was needed to pay the nursing home where his wife was recuperating from surgery, but the bond could not be redeemed unless an employee witnessed his wife’s signature. Since it was almost Georgia’s lunch hour she volunteered to go to the nursing home and witness his wife’s signature. Later, the man brought the bond in to be redeemed.
Like Georgia, our employees constantly look for ways to provide extraordinary service. At Citizens Bank we cultivate an atmosphere of fairness and concern for others, and every employee is dedicated to this mission. Since we hold these basic values so high, they permeate our personal and banking relationships. We serve each
customer need-by-need, customizing products based upon our consultative servicing. When our customers sit down with a loan officer, they appreciate our close attention and the level of understanding we bring to the details of their situation.
Citizens Bank is committed to making our customers banking experience positive. For this reason we recently launched a new imaging system, making checks viewable on-line or as a one-page accompaniment to a monthly statement. The new imaging system makes it easy for our customers to view their checks in the format of their choice. We make sure our technology is tailored to fit customer needs and make the banking experience even more enjoyable.
We move forward with technology when it benefits our customers, yet remain dedicated to the relational banking they appreciate so much. Our goal is to provide options that work for our customers, while protecting the caring and professional environment they have come to expect and appreciate.
As community members ourselves, we are locally focused and locally invested. We serve our communities each day by providing our employees the time and resources to get involved in local events and organizations. Our branch managers enjoy unique freedom in shaping the branch around the local commu-nity, and as local residents they are devoted to its welfare.
Our Southern Area branches have shown their local neighbors that no amount of community service is too much. At every level they are committed to investing locally: tellers, new account representatives, loan officers, and branch managers alike have given evenings and weekends to volunteer for charities and local events. Recently, our Junction City and Harrisburg branches joined forces one Saturday to build a house for Habitat for Humanity, leaving a legacy of hope for a family in need. Each week a Citizens Bank employee from another branch reads aloud in area schools as a volunteer for the SMART program, and every year a branch manager scrubs pots and pans for the annual Senior Citizens Thank You Dinner held in his community.
We have put no limits on our commitment to investing in our neighbors. Numerous local students have been sent to Oregon colleges through the efforts of our employees as they work with and support Rotary and 4-H. The future of our children is
important and their welfare a priority. That is why two employees from our Southern Area branches each donated a week to volunteer for the 2006 Festival of Trees; a week-long event in early December that raises money for a variety of health services and programs. Over the past 14 years, the Festival of Trees has raised more than $3.5 million to provide health care for children who would otherwise go without medical attention.
At Citizens Bank we encourage our employees to get involved in these local events and organizations. We are proud of our employees, who touch over 250 local organizations throughout the year, ranging from Chambers of Commerce to the Special Olympics of Benton County and the American Cancer Society. As local citizens, they are invested in the welfare of their city and their neighbors. Because we are a part of the community, we keep the benefit of local people and local businesses a priority as we make decisions. Their future is our future.
As we move forward into another year, we are aware that our past success is founded on the consistent fundamentals of good banking and on the relationships we build with people. Citizens Bank is committed to continuing this journey, follow-ing the same path, remembering the same fundamentals.
1
* A wholly owned subsidiary of Citizens Bancorp.
Fundamental Banking
Charting the future
Relationship Building
Local people making local contributions
McMinnvilleCorvallis
Junction CitySpringfield
Dallas
Harrisburg
Albany

2
3
4
At the end of each year, as we evaluate our progress and establish new goals, we are always thoughtful of the path
we have taken which has led to our success. Although we have come a long way in our journey, and taken many
turns, we have learned that the fundamentals of good banking do not change. Banking is a relationship business.
Relationships built by people, with people, on a foundation of trust, respect, and a caring attitude. Our goal is to
continue our journey, following the same path, remembering the same fundamentals.
Small acts of kindness create lifetimes of customer loyalty here at Citizens Bank.* One of our Philomath customers fondly remembers the day he opened his first savings account in 1958. He felt proud as he handed the teller his initial deposit. We recently heard from that same customer forty-nine years after that first deposit. He recalled the day that the bank showed special concern and caring for his elderly widowed mother, by calling her to check on her welfare after she conducted some unusual transactions at the bank. “That kind of interest in your customers has continued through the years. I wish to say ‘thank you’ for being a bank that is truly part of this community,” he said.
At Citizens Bank, we still operate under the principle that our customers come first. After so many years, our
employees still maintain an outlook that focuses on caring for customers as individuals. We build lasting customer relationships because we understand the fun-damentals of good banking, including the principles of trust, respect and a caring attitude. Our customers have grown to expect us to demonstrate those fundamentals, while delivering on the values of security, fair dealing and outstanding service.
We believe that we have many points of distinction when compared to our competition. Our focus on relationship building, our understanding of the fundamentals of good banking, our caring and helpful people, and our healthy, safe and sound organization, are all points we would happily compare with other banking providers.
Good banking thrives on great relationships. Our customers know they can count on us because we have gained their trust and respect during each transaction that they have experienced with us.
Georgia Cunningham, Operations Officer of the Main branch in Corvallis, remembers the day a customer came in to redeem a savings bond made payable to his wife. The money was needed to pay the nursing home where his wife was recuperating from surgery, but the bond could not be redeemed unless an employee witnessed his wife’s signature. Since it was almost Georgia’s lunch hour she volunteered to go to the nursing home and witness his wife’s signature. Later, the man brought the bond in to be redeemed.
Like Georgia, our employees constantly look for ways to provide extraordinary service. At Citizens Bank we cultivate an atmosphere of fairness and concern for others, and every employee is dedicated to this mission. Since we hold these basic values so high, they permeate our personal and banking relationships. We serve each
customer need-by-need, customizing products based upon our consultative servicing. When our customers sit down with a loan officer, they appreciate our close attention and the level of understanding we bring to the details of their situation.
Citizens Bank is committed to making our customers banking experience positive. For this reason we recently launched a new imaging system, making checks viewable on-line or as a one-page accompaniment to a monthly statement. The new imaging system makes it easy for our customers to view their checks in the format of their choice. We make sure our technology is tailored to fit customer needs and make the banking experience even more enjoyable.
We move forward with technology when it benefits our customers, yet remain dedicated to the relational banking they appreciate so much. Our goal is to provide options that work for our customers, while protecting the caring and professional environment they have come to expect and appreciate.
As community members ourselves, we are locally focused and locally invested. We serve our communities each day by providing our employees the time and resources to get involved in local events and organizations. Our branch managers enjoy unique freedom in shaping the branch around the local commu-nity, and as local residents they are devoted to its welfare.
Our Southern Area branches have shown their local neighbors that no amount of community service is too much. At every level they are committed to investing locally: tellers, new account representatives, loan officers, and branch managers alike have given evenings and weekends to volunteer for charities and local events. Recently, our Junction City and Harrisburg branches joined forces one Saturday to build a house for Habitat for Humanity, leaving a legacy of hope for a family in need. Each week a Citizens Bank employee from another branch reads aloud in area schools as a volunteer for the SMART program, and every year a branch manager scrubs pots and pans for the annual Senior Citizens Thank You Dinner held in his community.
We have put no limits on our commitment to investing in our neighbors. Numerous local students have been sent to Oregon colleges through the efforts of our employees as they work with and support Rotary and 4-H. The future of our children is
important and their welfare a priority. That is why two employees from our Southern Area branches each donated a week to volunteer for the 2006 Festival of Trees; a week-long event in early December that raises money for a variety of health services and programs. Over the past 14 years, the Festival of Trees has raised more than $3.5 million to provide health care for children who would otherwise go without medical attention.
At Citizens Bank we encourage our employees to get involved in these local events and organizations. We are proud of our employees, who touch over 250 local organizations throughout the year, ranging from Chambers of Commerce to the Special Olympics of Benton County and the American Cancer Society. As local citizens, they are invested in the welfare of their city and their neighbors. Because we are a part of the community, we keep the benefit of local people and local businesses a priority as we make decisions. Their future is our future.
As we move forward into another year, we are aware that our past success is founded on the consistent fundamentals of good banking and on the relationships we build with people. Citizens Bank is committed to continuing this journey, follow-ing the same path, remembering the same fundamentals.
1
* A wholly owned subsidiary of Citizens Bancorp.
Fundamental Banking
Charting the future
Relationship Building
Local people making local contributions
McMinnvilleCorvallis
Junction CitySpringfield
Dallas
Harrisburg
Albany

McMinnville
Corvallis
Junction CitySpringfield
Dallas
Harrisburg
Albany
Philomath
To Our Shareholders
We feel very good about the progress we made during the year 2006 in our journey down the road of continuous improvement in Shareholder value. We were quite productive financially, earning $5.459 million net, after the payment of more than $2.941 million in taxes, a new profitability record for us. This level of profitability represents a Return on Average Assets of 1.60%, and a Return on Average Equity of 11.8%. This financial performance defines us as a high performance banking company when compared to our peers nationally. We increased the size of the Bank’s total asset base to $359 million, a 6% increase over the total for 12/31/05. And, we ended the year with total Shareholder Equity in the amount of $46.5 million, a 10% increase over the prior year end, after the payment of a record cash dividend in the amount of $.52 per share. While we acknowledge the importance of a high level of financial productivity, and a sustained increase in total assets, we feel that it is equally important to maintain our commitment to safety and soundness. The Bank’s loan and investment portfolios continue to be very sound, and our compliance with regulations is extraordinarily strong. Additionally, during the year, we spent a good deal of time in the planning process and in “strategic thinking”. This process helped us re-commit to the primary goals of strong financial performance, controlled growth, and a focus on our employee assets. We are certain that a continued high level of financial performance will result from a clear strategic vision, good risk management practices, and a healthy culture.
We made significant advances in technology and in our operating systems. These gains are not as discernible to our customers and the public as other financial measurements displayed in the Balance Sheet or Income Statement, but they are similarly important with regards to positioning the Bank for continued high performance. Early in the year we introduced check imaging to our customers. This system, which replaces paper checks with computer generated images, has been well received by our customers and our transition to this technology was done in an almost seamless manner.
Late in the year the Board of Directors approved the opening of a new branch office in West Eugene. Although we are still months away from opening this office, we have developed a business plan, identified the staff, and started working to develop business in that area. During 2006 we held Board of Directors meetings in each of the communities where we have a branch office. This was a good opportunity to hear from branch management, com-munity leaders, and customers about the challenges we face, and the opportunities they create in each area of the Bank. We extend a special thank you to all of our branch leaders, community leaders and customers, who made these visits very special for us.
Respectfully yours,
William HumphreysPresident and CEO
Citizens Bancorp
Citizens Bancorp Annual Report 2006
ROSEttA C. VEnELLVenell Farms, Inc., Venell Pellets, Inc., Mid-Valley Agricultural Products, Inc.Corvallis, Oregon
ERIC C. tHOMPSOnThompson timber Company Corvallis, Oregon
MIkE ButLERFuture B HomesEugene, Oregon
DuAnE L. SOREnSEnRetired, Waste Control Systems, Inc.Corvallis, Oregon
WILLIAM V. HuMPHREyS, SR.President and CEO, Citizens BankCorvallis, Oregon
SIDnEy A. HuWALDtWestern States Insurance Agency, Inc.McMinnville, Oregon
JOCk GIBSOn, CHAIRMAnLochmead Dairy, Dari Mart StoresJunction City, Oregon
SCOtt A. FEWELFewel, Brewer and Coulombe Attorneys at LawCorvallis, Oregon
JAMES E. RICHARDSFisher Implement CompanyAlbany, Oregon
Executive Officers
WILLIAM V. HuMPHREyS, SR.President and CEO
LARk E. WySHAMExecutive Vice President and Chief Financial Officer
WILLIAM F. HuBEL, JR.Executive Vice President and Chief Operating Officer
SCOtt M. ZIMBRICkExecutive Vice President and Chief Marketing Officer
StEVE R. tERJESOnExecutive Vice President and Chief Lending Officer
Branch Offices
CORVALLIS MAIn OFFICE275 SW Third St, PO Box 30Corvallis, OR 97339-0030(541) 752-5161
CORVALLIS CIRCLE OFFICE978 nW Circle Blvd, PO Box 30Corvallis, OR 97339-0030(541) 752-5161
EASt ALBAny OFFICE2315 14th Ave SE, PO Box 249Albany, OR 97321-0074(541) 967-1992
WESt ALBAny OFFICE2230 Pacific Blvd SW, PO Box 1007Albany, OR 97321-3751(541) 812-6178
PHILOMAtH OFFICE1224 Main St, PO Box 1629Philomath, OR 97370-1629(541) 929-3228
MCMInnVILLE OFFICE455 nE Baker St, PO Box 647McMinnville, OR 97128-0647(503) 474-9441
DALLAS OFFICE583 SE Jefferson St, PO Box 958Dallas, OR 97338-0958(503) 623-3119
HARRISBuRG OFFICE230 north 3rd St, Suite 101Harrisburg, OR 97446-9679(541) 995-4699
JunCtIOn CIty OFFICE955 Ivy St, PO Box 399Junction City, OR 97448-0399(541) 998-8734
SPRInGFIELD OFFICE2073 Olympic St, Suite 100PO Box 699Springfield, OR 97477-0126(541) 746-5240
Services
tRAnSFER AGEntSHAREHOLDER RELAtIOnSCitizens Bancorp275 SW Third StPO Box 30Corvallis, OR 97339-0030(541) 752-5161
XPRESS PHOnE BAnkInG1-800-577-1778Corvallis local calling area: 766-2255
MORtGAGE DEPARtMEnt275 SW Third StPO Box 30Corvallis, OR 97339-0030(541) 752-5161
MERCHAnt SERVICESPO Box 30Corvallis, OR 97339-0030(541) 752-5161
InVEStMEnt SERVICES PROVIDED ByRaymond James Financial Services, Inc.kelly SteppFinancial Advisor310 nW 5th St, Suite 108Corvallis, OR 97330(541) 753-4222David I. CudoFinancial Advisor310 nW 5th St, Suite 203Corvallis, OR 97330(541) 758-0290 • 800-285-2836
Internet Sitewww.citizensEbank.com
Jock GibsonChairman of the Board
Board of Directors 2006
“... we spent a good deal of time in the planning process and in ‘strategic thinking’.”
– Jock Gibson Chairman of the Board
– William Humphreys President and CEO
“... we feel that it is equally important to maintain our commitment to safety and soundness.”
Charting the futureCitizens Bankcorp Annual Report 2006
Since 1957
$250,000
$225,000
$200,000
$175,000
$150,000
Total LoansDollars in Thousands
Shareholder EquityDollars in Thousands
$45,000
$40,000
$35,000
$30,000
$25,000
$5,500
$5,000
$4,500
$4,000
$3,500
Net IncomeDollars in Thousands
‘02 ‘03 ‘04 ‘05 ‘06
$350,000
$300,000
$250,000
$200,000
$150,000
Total AssetsDollars in Thousands
$270,000
$260,000
$250,000
$240,000
$230,000
Total DepositsDollars in Thousands
Member FDICEqual Housing Lender
‘02 ‘03 ‘04 ‘05 ‘06 ‘02 ‘03 ‘04 ‘05 ‘06
‘02 ‘03 ‘04 ‘05 ‘06 ‘02 ‘03 ‘04 ‘05 ‘06
Citizens BancorpFinancial Highlights 2006
Dollars in Thousands
December 31, 2006 2005 2004 2003 2002
total Assets $359,029 $338,900 $334,588 $326,269 $312,639
total Deposits $270,610 $254,083 $235,482 $235,759 $227,363
total Loans (net) $250,152 $230,547 $210,951 $185,053 $178,333
Shareholders’ Equity $46,542 $42,296 $38,401 $35,617 $32,330
For The year:
net Income $5,459 $5,327 $4,352 $5,012 $4,858
Income Per Share 1.15 1.12 .94 1.10 1.07

FORM 10-K
UNITED STATES
SECURITIES AND EXCHANGE COMMISSIONWashington, D.C. 20549
[X] ANNUAL REPORT PURSUANT TO SECTION 13 OR 15(d) OF THE SECURITIES EXCHANGE ACT OF 1934
For the fiscal year ended December 31, 2006
[ ] TRANSITIONAL REPORT PURSUANT TO SECTION 13 OR 15(d) OF THE SECURITIES EXCHANGE ACT OF 1934
For the transition period from ____ to ____
Commission File No. 000-23277
CITIZENS BANCORP/OR(Name of registrant in its charter)
91-1841688Oregon (I.R.S. Employer(State of incorporation) Identification No.)
275 Southwest Third StreetP. O. Box 30
Corvallis, Oregon 97339(Address of principal executive offices)
Registrant’s telephone number: (541) 752-5161
Securities registered under Section 12(b) of the Exchange Act: none
Securities registered under Section 12(g) of the Exchange Act: common stock, no par value
Indicate by check mark if the registrant is a well-known seasoned issuer as defined in Rule 405 of the Securities Act.Yes [ ] No [X]
Indicate by check mark if the registrant is not required to file reports to Section 13 or Section 15(d) of the Act.Yes [ ] No [X]
Indicate by check mark whether registrant has (1) filed all reports required to be filed by Section 13 or 15(d) of theSecurities Exchange Act of 1934 during the preceding 12 months (or for such shorter period that the registrant was required tofile such reports), and (2) has been subject to such filing requirements for the past 90 days. Yes [X] No [ ]
Indicate by check mark if disclosure of delinquent filers pursuant to Item 405 of Regulation S-K is not contained herein,and will not be contained to the best of registrant’s knowledge, in definitive proxy or information statements incorporated byreference in Part III of this Form 10-K or any amendment to this Form 10-K. [X].
Indicate by check mark whether the registrant is a large accelerated filer, an accelerated filer, or a non-accelerated filer, asdefined in Rule 12b-2 of the Act.
Large accelerated filer [ ] Accelerated filer [ ] Non-accelerated filer [X]
Indicate by check mark whether the registrant is a shell company (as defined by Rule 12b-2 of the Exchange Act).Yes [ ] No [X]
There is no active trading market for the Registrant’s common stock. The Registrant’s common stock is not listed onany exchange or quoted on Nasdaq. The aggregate market value of the voting common equity held by non-affiliates as of June30, 2006 (the last business day of the most recently completed second quarter) was $67,257,540, based on the last sale of$16.90 per share on June 30, 2006.
As of February 22, 2007 there were 4,810,490 shares of registrant’s common stock issued and outstanding, of which4,025,800 were held by non-affiliates.
DOCUMENTS INCORPORATED BY REFERENCE. Part III of this Form 10-K incorporates by reference portions ofthe definitive 2007 Annual Meeting Proxy Statement sent to the Company's shareholders in connection with its April 17, 2007Annual Meeting of Shareholders.

INDEXPAGE
DISCLOSURE REGARDING FORWARD LOOKING STATEMENTS 2
PART IITEM 1 – BUSINESS 2
ITEM 1A - RISK FACTORS 8
ITEM 1B - UNRESOLVED STAFF COMMENTS 9
ITEM 2 – PROPERTIES 9
ITEM 3 – LEGAL PROCEEDINGS 10
ITEM 4 – SUBMISSION OF MATTERS TO A VOTE OF SECURITY HOLDERS 10
PART IIITEM 5 – MARKET FOR REGISTRANT’S COMMON EQUITY, RELATED
SHAREHOLDER MATTERS, AND ISSUER PURCHASES OF EQUITYSECURITIES 11
ITEM 6 – SELECTED FINANCIAL DATA 14
ITEM 7 – MANAGEMENT’S DISCUSSION AND ANALYSIS OFFINANCIAL CONDITION AND RESULTS OF OPERATIONS 15
ITEM 7A – QUANTITATIVE AND QUALITATIVE DISCLOSURESABOUT MARKET RISK 29
ITEM 8 – FINANCIAL STATEMENTS AND SUPPLEMENTARY DATA 32
ITEM 9 – CHANGES IN AND DISAGREEMENTS WITH ACCOUNTANTS 66ON ACCOUNTING AND FINANCIAL DISCLOSURE
ITEM 9A – CONTROLS AND PROCEDURES 66
ITEM 9B - OTHER INFORMATION 66
PART IIIITEM 10 – DIRECTORS, EXECUTIVE OFFICERS AND CORPORATE GOVERNANCE 66
ITEM 11 – EXECUTIVE COMPENSATION 67
ITEM 12 – SECURITY OWNERSHIP OF CERTAIN BENEFICIAL OWNERS ANDMANAGEMENT,AND RELATED SHAREHOLDER MATTERS 67
ITEM 13 – CERTAIN RELATIONSHIPS AND RELATED TRANSACTIONS AND DIRECTOR INDEPENDENCE 67
ITEM 14 – PRINCIPALACCOUNTANT FEES AND SERVICES 67
PART IVITEM 15 – EXHIBITS AND FINANCIAL STATEMENT SCHEDULES 68
1
DISCLOSURE REGARDING FORWARD LOOKING STATEMENTS
In addition to historical information, this report contains certain “forward looking statements” within the meaning of the Private Securities LitigationReform Act of 1995. This statement is included for the purpose of availing the Company the protection of the safe harbor provisions of this Act. Theforward looking statements contained in this report are subject to factors, risks and uncertainties that may cause actual results to differ materiallyfrom those projected. Factors that might result in such material difference include, but are not limited to economic conditions, the regulatoryenvironment, rapidly changing technology, new legislation, competitive factors, the interest rate environment and the overall condition of the bankingindustry. Forward looking statements can be identified by such words as “estimate”, “believe”, “expect”, “intend”, “anticipate”, “should”, “may”, “will”,or other similar words or phrases. Although the Company believes that the expectations reflected in such forward looking statements arereasonable, it can give no assurances that such expectations will prove to have been correct. Readers are therefore cautioned not to place unduereliance on such forward looking statements, which reflect management’s analysis only as of the date of the statement. The Company does notintend to update these forward looking statements other than in its periodic filings under applicable security laws.
PART IITEM 1. BUSINESS
General
Citizens Bancorp (the “Company” or “Bancorp”), an Oregon corporation and financial bank holding company, was formed in 1996 for the purpose ofbecoming the holding company of Citizens Bank (the “Bank”). The Company is headquartered in Corvallis, Oregon. Its principal business activitiesare conducted through its full-service, commercial bank subsidiary, Citizens Bank. The Company has no current plan to engage in any of thefinancial activities permissible for a financial holding company under Gramm-Leach-Bliley Financial Services Modernization Act.
The Company operates through a two-tiered corporate structure. At the holding company level the affairs of the Company are overseen by a Boardof Directors elected by the shareholders of the Company at the annual meeting of shareholders. The business of the Bank is overseen by a Board ofDirectors elected by the Company, the sole owner of the Bank. As of the date of this Form 10-K the respective members of the Board of Directors ofthe Company and the Board of Directors of the Bank were identical.
The Company is authorized to issue up to 10,000,000 shares of common stock, no par value. The Company operates a Dividend ReinvestmentPlan, under which 466,598 shares have been issued as of December 31, 2006. As of December 31, 2006 there were a total of 4,733,644 shares ofCompany common stock issued and outstanding. Citizens Bank is the registered transfer agent for the Company’s common stock.
Citizens Bank was chartered October 1, 1957 by the State of Oregon as a commercial bank. Beginning with a single office in Corvallis, CitizensBank has since expanded to an additional nine locations in the five counties of Benton, Linn, Lane, Yamhill, and Polk. Branches are located in thecommunities of Corvallis, Philomath, Albany, Junction City, McMinnville, Harrisburg, Dallas, and Springfield.
The Company’s culture focuses on the tenets of collaborative leadership, branch autonomy, assertive business development, a positive workingenvironment, a commitment to the community, outstanding customer service, and relationship banking. Management believes that a healthycorporate culture together with a progressive management style will result in constantly improved shareholder value.
The Company’s primary goal is to improve shareholder value through increased earnings while maintaining a high level of safety and soundness.The Company is committed to independence and long-term performance strategies. As a result of its corporate culture, the Company continues toshow good performance as evidenced by the five-year history of growth in the following selected areas:
(Thousands) 2006 2005 2004 2003 2002
Net Income $5,459 $5,327 $4,352 $5,012 $4,858
Return on Average Equity 11.78% 12.90% 11.23% 14.06% 15.32%
Return on Average Assets 1.60% 1.58% 1.32% 1.59% 1.64%
Average Equity to Average Assets 13.61% 12.26% 11.58% 11.32% 10.73%
Dividend Payout Ratio 45.22% 44.64% 48.94% 41.82% 38.32%
Total Loans (net) $250,152 $230,547 $210,951 $185,053 $178,333
Total Deposits $270,610 $254,083 $235,482 $235,759 $227,363
Total Assets $359,029 $338,900 $334,588 $326,269 $312,639
Total Equity $46,524 $42,296 $38,401 $35,617 $32,330
The long-term benefit to the Company of its cultural and management style is controlled growth and development of the Bank over time.Management believes the Bank’s risk levels have been reduced because of the Bank’s expertise in loan, investment, operational, human resource,and technology management.
2
The Company’s primary market focus is to provide commercial bank services to businesses, professionals, and individuals. The Companyemphasizes the development of meaningful customer relationships and a high level of service. Its employees are well-trained banking professionalswho are committed to these objectives.
The Bank offers deposit accounts, safe-deposit boxes, consumer loans, commercial loans, agricultural loans, and commercial and residential realestate loans. Commercial loans include operating lines of credit, equipment and real estate financing, capital needs, and other traditional financingproducts.
The Bank has a growing emphasis in financing farm operations, equipment, and property. The Bank has also emphasized loans to professionalswith its professional line of credit products.
The Bank’s loan portfolio has some concentrations in real estate secured loans, primarily commercial properties.
Deposit products include regular and “package” checking accounts, savings accounts, certificates of deposit, money market accounts, and IRAaccounts. The Bank offers health savings accounts to customers with high deductible medical plans. The Bank has found this deposit product to bebeneficial to the Bank and to the customer. In addition, the Bank actively markets its repurchase agreement product to corporate customers. TheBank offers a check card, check guarantee card, ATM card as well as a MasterCard and VISA card as part of its retail banking services. The Bankoperates a small residential mortgage loan origination department that originates loans and sells them into the secondary market. The Bank offersextended banking hours in selected locations as well as Saturday banking. ATM machines are also available at 10 locations offering 24-hourtransaction services, including cash withdrawals, deposits, account transfers, and balance inquiries. The Bank also offers its customers a 24-hourautomated telephone service that offers account transfers and balance inquiries.
The Bank offers an on-line banking product. The on-line banking product offers services to both individuals and business account customers.Business customers have a comprehensive cash management option. All online users have the availability of the “bill payment” feature. The Bankexpects to continually enhance its on-line banking product while maintaining its quality “people to people” customer service. The Bank’s on-linebanking can be reached at www.CitizensEBank.com.
Employees
At December 31, 2006 the Bank had 127 full-time equivalent employees. The Bank values its employees. They are actively engaged individuallyand as a team in contributing to the Bank’s realization of its culture and mission. None of the employees of the Bank are subject to a collectivebargaining agreement. A number of benefit programs are available to eligible employees including group medical insurance plans, paid time off,group life insurance, and a 401(K) plan.
Competition
At December 31, 2006, the Bank was among the top 10 largest commercial banks headquartered in the State of Oregon as measured by the Stateof Oregon’s Division of Finance and Corporate Securities. The Bank competes for business with other commercial banks as well as savings andloan associations, credit unions, mortgage companies, insurance companies, investment banks, securities brokerages and other non-bank financialservice providers. Banking in the State of Oregon is substantially dominated by several very large banking institutions whose headquarters are notin Oregon. They include Wells Fargo Bank, US Bank, Key Bank, Washington Mutual Bank, and Bank of America. Together these largeorganizations hold a majority of the deposit and loan balances held by banks in the State of Oregon. The Bank attempts to offset some of theadvantages of these larger competitors through superior relationship building with the customer, better service, quicker response to the customer’sneeds, and local decision-making. We rely on the fact that many businesses and individuals within small Oregon communities want to see theirmoney stay within the local economy, rather than see it used to fund loans in distant places.
2006 Activities
On January 13, 2006 the Bank completed the purchase of land, building, and equipment in Springfield, Oregon for approximately $1.3 million. Thebuilding is currently occupied by another financial institution which is leasing the building from the Bank for two years. At the end of the lease thecurrent occupant will vacate the building. The Bank plans to move its Springfield branch from its current location, which it leases, to the new locationin Springfield. The exact timing of the move has not been determined.
On July 1, 2006 the Bank implemented its check image product and outsourced its proof and capture system to Fiserve in Portland, Oregon. TheBank anticipates the expense related to the cost of these systems will be offset by the savings in personnel, equipment, postage and the shorteningof clearing times for deposits. The Bank still offers its customers choices in how they wish to receive their bank statements; full truncation of checks,printed check images, or the return of their original checks. Customers can view check images through online banking or request a copy of animaged check at any branch location.
3

The Company conducted a strategic planning initiative in September 2006. The initiative began with a survey of all lending officers, operationsofficers, branch managers, and executive officers to obtain their insights and suggestions for the future strategic goals of the Company. The board ofdirectors discussed their future vision for the Company and reviewed the survey from the management team. The board of directors then set threevital goals for the Company: 1) grow the Bank’s assets, 2) continue to generate a return to the shareholders at or above peer performance, 3)increase its commitment to the human resources of the Company. These goals are being communicated to the Company’s employees by the CEO.Action plans to implement strategies to attain these goals are being developed throughout the Company.
On October 17, 2006 the board of directors of the Bank approved management’s proposal of a new branch to be located in west Eugene, Oregon.The exact location of the branch is yet to be determined. The Bank is working with a realtor to locate property along highway 99W. A manager for thebranch has been identified and will begin to call on prospective customers in 2007. Management anticipates opening the branch in the third or fourthquarter of 2007.
On December 19, 2006, the Company declared a cash dividend of $.52 per share to shareholders of record on December 29, 2006, payable January10, 2007. The higher dividend of $.52 per share as compared to $.50 in 2005 and $.46 in 2004, reflects the Company’s strong performance for theperiod ending December 31, 2006.
SUPERVISION AND REGULATION
General
The following discussion describes elements of the extensive regulatory framework applicable to the Company and the Bank. This regulatoryframework is primarily designed for the protection of depositors, federal deposit insurance funds, and the banking system as a whole, rather thanspecifically for the protection of shareholders. Due to the breadth of this regulatory framework, our costs of compliance continue to increase in orderto monitor and satisfy these requirements.
To the extent that this section describes statutory and regulatory provisions, it is qualified in its entirety by reference to those provisions. Thesestatutes and regulations, as well as related policies, are subject to change by Congress, state legislatures and federal and state regulators. Changesin statutes, regulations or regulatory policies applicable to us, including interpretation or implementation thereof, could have a material effect on ourbusiness or operations.
Federal Bank Holding Company Regulation
General. As a financial bank holding company, the Company is subject to the Bank Holding Company Act of 1956, as amended (“BHCA”), whichplaces the Company under the supervision of the Federal Reserve. In general, the BHCA limits the business of bank holding companies to owning orcontrolling banks and engaging in other activities closely related to banking. The Company must file reports with and provide the Federal Reservesuch additional information as it may require.
Holding Company Bank Ownership. The BHCA requires every bank holding company to obtain the prior approval of the Federal Reserve before (i)acquiring, directly or indirectly, ownership or control of any voting shares of another bank or bank holding company if, after such acquisition, it wouldown or control more than 5% of such shares; (ii) acquiring all or substantially all of the assets of another bank or bank holding company; or (iii)merging or consolidating with another bank holding company.
Holding Company Control of Nonbanks. With some exceptions, the BHCA also prohibits a bank holding company from acquiring or retaining direct orindirect ownership or control of more than 5% of the voting shares of any company which is not a bank or bank holding company, or from engagingdirectly or indirectly in activities other than those of banking, managing or controlling banks, or providing services for its subsidiaries. The principalexceptions to these prohibitions involve certain non-bank activities that, by statute or by Federal Reserve regulation or order, have been identified asactivities closely related to the business of banking or of managing or controlling banks.
Transactions with Affiliates. Subsidiary banks of a bank holding company are subject to restrictions imposed by the Federal Reserve Act onextensions of credit to the holding company or its subsidiaries, on investments in their securities and on the use of their securities as collateral forloans to any borrower. These regulations and restrictions may limit the Company’s ability to obtain funds from the Bank for its cash needs, includingfunds for payment of dividends, interest and operational expenses.
Tying Arrangements. We are prohibited from engaging in certain tie-in arrangements in connection with any extension of credit, sale or lease ofproperty or furnishing of services. For example, with certain exceptions, neither the Company nor its subsidiaries may condition an extension ofcredit to a customer on either (i) a requirement that the customer obtain additional services provided by us; or (ii) an agreement by the customer torefrain from obtaining other services from a competitor.
4

Support of Subsidiary Banks. Under Federal Reserve policy, the Company is expected to act as a source of financial and managerial strength to theBank. This means that the Company is required to commit, as necessary, resources to support the Bank. Any capital loans a bank holding companymakes to its subsidiary banks are subordinate to deposits and to certain other indebtedness of those subsidiary banks.
State Law Restrictions. As an Oregon corporation, the Company is subject to certain limitations and restrictions under applicable Oregon corporatelaw. For example, state law restrictions in Oregon include limitations and restrictions relating to indemnification of directors, distributions toshareholders, transactions involving directors, officers or interested shareholders, maintenance of books, records and minutes, and observance ofcertain corporate formalities.
Federal and State Regulation of Citizens Bank
General. The Bank is an Oregon commercial bank with deposits insured by the FDIC. As a result, the Bank is subject to supervision and regulationby the Oregon Department of Consumer and Business Services and the FDIC. These agencies have the authority to prohibit banks from engaging inwhat they believe constitute unsafe or unsound banking practices.
Community Reinvestment. The Community Reinvestment Act of 1977 requires that, in connection with examinations of financial institutions withintheir jurisdiction, the Federal Reserve or the FDIC evaluate the record of the financial institution in meeting the credit needs of its local communities,including low and moderate-income neighborhoods, consistent with the safe and sound operation of the institution. A bank’s community reinvestmentrecord is also considered by the applicable banking agencies in evaluating mergers, acquisitions and applications to open a branch or facility.
Insider Credit Transactions. Banks are also subject to certain restrictions imposed by the Federal Reserve Act on extensions of credit to executiveofficers, directors, principal shareholders or any related interests of such persons. Extensions of credit (i) must be made on substantially the sameterms, including interest rates and collateral, and follow credit underwriting procedures that are at least as stringent, as those prevailing at the timefor comparable transactions with persons not covered above and who are not employees; and (ii) must not involve more than the normal risk ofrepayment or present other unfavorable features. Banks are also subject to certain lending limits and restrictions on overdrafts to insiders. A violationof these restrictions may result in the assessment of substantial civil monetary penalties, the imposition of a cease and desist order, and otherregulatory sanctions.
Regulation of Management. Federal law (i) sets forth circumstances under which officers or directors of a bank may be removed by the institution'sfederal supervisory agency; (ii) places restraints on lending by a bank to its executive officers, directors, principal shareholders, and their relatedinterests; and (iii) prohibits management personnel of a bank from serving as a director or in other management positions of another financialinstitution whose assets exceed a specified amount or which has an office within a specified geographic area.
Safety and Soundness Standards. Federal law imposes certain non-capital safety and soundness standards upon banks. These standards coverinternal controls, information systems and internal audit systems, loan documentation, credit underwriting, interest rate exposure, asset growth,compensation, fees and benefits, such other operational and managerial standards as the agency determines to be appropriate, and standards forasset quality, earnings and stock valuation. An institution that fails to meet these standards must develop a plan acceptable to its regulators,specifying the steps that the institution will take to meet the standards. Failure to submit or implement such a plan may subject the institution toregulatory sanctions.
Interstate Banking And Branching
The Riegle-Neal Interstate Banking and Branching Efficiency Act of 1994 (“Interstate Act”) relaxed prior interstate branching restrictions under federallaw by permitting nationwide interstate banking and branching under certain circumstances. Generally, bank holding companies may purchase banksin any state, and states may not prohibit these purchases. Additionally, banks are permitted to merge with banks in other states, as long as the homestate of neither merging bank has opted out under the legislation. The Interstate Act requires regulators to consult with community organizationsbefore permitting an interstate institution to close a branch in a low-income area. Federal banking agency regulations prohibit banks from using theirinterstate branches primarily for deposit production and federal banking agencies have implemented a loan-to-deposit ratio screen to ensurecompliance with this prohibition.
Oregon has enacted “opting in” legislation in accordance with the Interstate Act provisions allowing banks to engage in interstate mergertransactions, subject to certain “aging” requirements. Oregon restricts an out-of-state bank from opening de novo branches. However, once an out-of-state bank has acquired a bank within Oregon, either through conversion, merger, or assumption of all or substantially all of the bank’s Oregondeposit liabilities, the out-of-state bank may open additional branches within Oregon.
5

Deposit Insurance
In February 2006, the President signed federal deposit insurance reform legislation. The legislation (i) required the FDIC to merge the BankInsurance Fund and the Savings Association Insurance Fund into a newly created Deposit Insurance Fund, which was completed in 2006; (ii)increases the amount of deposit insurance coverage for retirement accounts; (iii) allows for deposit insurance coverage on individual accounts to beindexed for inflation starting in 2010; (iv) provides the FDIC more flexibility in setting and imposing deposit insurance assessments; and (v) provideseligible institutions credits on future assessments.
The Bank’s deposits are currently insured to a maximum of $100,000 per depositor through the Deposit Insurance Fund. The Bank is required to paydeposit insurance premiums, which are assessed and paid regularly. The premium amount is based upon a risk classification system established bythe FDIC. Banks with higher levels of capital and a low degree of supervisory concern are assessed lower premiums than banks with lower levels ofcapital or a higher degree of supervisory concern.
Dividends
The principal source of the Company’s cash is from dividends received from the Bank, which are subject to government regulation and limitations.Regulatory authorities may prohibit banks and bank holding companies from paying dividends in a manner that would constitute an unsafe orunsound banking practice or would reduce the amount of its capital below that necessary to meet minimum applicable regulatory capitalrequirements. Oregon law also limits a bank’s ability to pay dividends that are greater than the bank’s retained earnings without approval of theOregon Department.
Capital Adequacy
Regulatory Capital Guidelines. Federal bank regulatory agencies use capital adequacy guidelines in the examination and regulation of bank holdingcompanies and banks. The guidelines are “risk-based,” meaning that they are designed to make capital requirements more sensitive to differences inrisk profiles among banks and bank holding companies.
Tier I and Tier II Capital. Under the guidelines, an institution’s capital is divided into two broad categories, Tier I capital and Tier II capital. Tier Icapital generally consists of common stockholders’ equity, surplus and undivided profits. Tier II capital generally consists of the allowance for loanlosses, hybrid capital instruments, and subordinated debt. The sum of Tier I capital and Tier II capital represents an institution’s total capital. Theguidelines require that at least 50% of an institution’s total capital consist of Tier I capital.
Risk-based Capital Ratios. The adequacy of an institution’s capital is gauged primarily with reference to the institution’s risk-weighted assets. Theguidelines assign risk weightings to an institution’s assets in an effort to quantify the relative risk of each asset and to determine the minimum capitalrequired to support that risk. An institution’s risk-weighted assets are then compared with its Tier I capital and total capital to arrive at a Tier I risk-based ratio and a total risk-based ratio, respectively. The guidelines provide that an institution must have a minimum Tier I risk-based ratio of 4%and a minimum total risk-based ratio of 8%.
Leverage Ratio. The guidelines also employ a leverage ratio, which is Tier I capital as a percentage of average total assets, less intangibles. Theprincipal objective of the leverage ratio is to constrain the maximum degree to which a bank holding company may leverage its equity capital base.The minimum leverage ratio is 3%; however, for all but the most highly rated bank holding companies and for bank holding companies seeking toexpand, regulators expect an additional cushion of at least 1% to 2%.
Prompt Corrective Action. Under the guidelines, an institution is assigned to one of five capital categories depending on its total risk-based capitalratio, Tier I risk-based capital ratio, and leverage ratio, together with certain subjective factors. The categories range from “well capitalized” to“critically undercapitalized.” Institutions that are “undercapitalized” or lower are subject to certain mandatory supervisory corrective actions.
In 2006, the federal banking agencies, including the FDIC and the Federal Reserve, provided notice of proposed rulemaking that would change theexisting risk-based capital framework by enhancing its risk sensitivity. Whether such revisions are implemented or what effect they might have on uscannot be predicted at this time, but we do not expect our operations to be significantly impacted.
Regulatory Oversight and Examination
The Federal Reserve conducts periodic inspections of bank holding companies, which are performed both onsite and offsite. The supervisoryobjectives of the inspection program are to ascertain whether the financial strength of the bank holding company is being maintained on an ongoingbasis and to determine the effects or consequences of transactions between a holding company or its non-banking subsidiaries and its subsidiarybanks. For holding companies under $10 billion in assets, the inspection type and frequency varies depending on asset size, complexity of theorganization, and the holding company’s rating at its last inspection.
6
Banks are subject to periodic examinations by their primary regulators. Bank examinations have evolved from reliance on transaction testing inassessing a bank’s condition to a risk-focused approach. These examinations are extensive and cover the entire breadth of operations of the bank.Generally, safety and soundness examinations occur on an 18-month cycle for banks under $500 million in total assets that are well capitalized andwithout regulatory issues, and 12-months otherwise. Examinations alternate between the federal and state bank regulatory agency or may occur ona combined schedule. The frequency of consumer compliance and CRA examinations is linked to the size of the institution and its compliance andCRA ratings at its most recent examinations. However, the examination authority of the Federal Reserve and the FDIC allows them to examinesupervised banks as frequently as deemed necessary based on the condition of the bank or as a result of certain triggering events.
Corporate Governance and Accounting Legislation
Sarbanes-Oxley Act of 2002. The Sarbanes-Oxley Act of 2002 (the “Act”) addresses, among other things, corporate governance, auditing andaccounting, enhanced and timely disclosure of corporate information, and penalties for non-compliance. Generally, the Act (i) requires chiefexecutive officers and chief financial officers to certify to the accuracy of periodic reports filed with the Securities and Exchange Commission (the“SEC”); (ii) imposes specific and enhanced corporate disclosure requirements; (iii) accelerates the time frame for reporting of insider transactionsand periodic disclosures by public companies; (iv) requires companies to adopt and disclose information about corporate governance practices,including whether or not they have adopted a code of ethics for senior financial officers and whether the audit committee includes at least one “auditcommittee financial expert;” and (v) requires the SEC, based on certain enumerated factors, to regularly and systematically review corporate filings.
To deter wrongdoing, the Act (i) subjects bonuses issued to top executives to disgorgement if a restatement of a company's financial statements wasdue to corporate misconduct; (ii) prohibits an officer or director misleading or coercing an auditor; (iii) prohibits insider trades during pension fund“blackout periods”; (iv) imposes new criminal penalties for fraud and other wrongful acts; and (v) extends the period during which certain securitiesfraud lawsuits can be brought against a company or its officers.
As a publicly reporting company, we are subject to the requirements of the Act and related rules and regulations issued by the SEC. After enactment,we updated our policies and procedures to comply with the Act’s requirements and have found that such compliance, including compliance withSection 404 of the Act relating to management control over financial reporting, has resulted in significant additional expense for the Company. Weanticipate that we will continue to incur such additional expense in our ongoing compliance.
Anti-terrorism Legislation
USA Patriot Act of 2001. The Uniting and Strengthening America by Providing Appropriate Tools Required to Intercept and Obstruct Terrorism Act of2001, intended to combat terrorism, was renewed with certain amendments in 2006 (the “Patriot Act”). In 2006, certain provisions of the Patriot Actwere made permanent and other sections were made subject to extended “sunset” provisions. The Patriot Act, in relevant part, (i) prohibits banksfrom providing correspondent accounts directly to foreign shell banks; (ii) imposes due diligence requirements on banks opening or holding accountsfor foreign financial institutions or wealthy foreign individuals; (iii) requires financial institutions to establish an anti-money-laundering complianceprogram; and (iv) eliminates civil liability for persons who file suspicious activity reports. The Act also includes provisions providing the governmentwith power to investigate terrorism, including expanded government access to bank account records. While the Patriot Act has had minimal affect onour record keeping and reporting expenses, we do not believe that the renewal and amendment will have a material adverse effect on our businessor operations.
Financial Services Modernization
Gramm-Leach-Bliley Act of 1999. The Gramm-Leach-Bliley Financial Services Modernization Act of 1999 brought about significant changes to thelaws affecting banks and bank holding companies. Generally, the Act (i) repeals the historical restrictions on preventing banks from affiliating withsecurities firms, (ii) provides a uniform framework for the activities of banks, savings institutions and their holding companies; (iii) broadens theactivities that may be conducted by national banks and banking subsidiaries of bank holding companies; (iv) provides an enhanced framework forprotecting the privacy of consumer information and requires notification to consumers of bank privacy policies; and (v) addresses a variety of otherlegal and regulatory issues affecting both day-to-day operations and long-term activities of financial institutions. Bank holding companies that qualifyand elect to become financial holding companies can engage in a wider variety of financial activities than permitted under previous law, particularlywith respect to insurance and securities underwriting activities.
Recent Legislation
Financial Services Regulator Relief Act of 2006. In October 2006, the President signed the Financial Services Regulatory Relief Act of 2006 into law(the “ Relief Act”). The Relief Act amends several existing banking laws and regulations, eliminates some unnecessary and overly burdensomeregulations of depository institutions, and clarifies several existing regulations. The Relief Act, among other things, (i) authorizes the Federal ReserveBoard to set reserve ratios; (ii) amends national banks regulations relating to shareholder voting and granting of dividends; (iii) amends severalprovisions relating to such issues as loans to insiders, regulatory applications, privacy notices, and golden parachute payments; and (iv) expands
7
and clarifies the enforcement authority of federal banking regulators. While it is too soon to predict the impact this legislation will have on us, we donot expect that our business, expenses, or operations will be significantly impacted.
Effects Of Government Monetary Policy
Our earnings and growth are affected not only by general economic conditions, but also by the fiscal and monetary policies of the federalgovernment, particularly the Federal Reserve. The Federal Reserve implements national monetary policy for such purposes as curbing inflation andcombating recession, but its open market operations in U.S. government securities, control of the discount rate applicable to borrowings from theFederal Reserve, and establishment of reserve requirements against certain deposits, influence the growth of bank loans, investments and deposits,and also affect interest rates charged on loans or paid on deposits. The nature and impact of future changes in monetary policies and their impact onus cannot be predicted with certainty.
Website Access to Reports
The Company makes available free of charge, all periodic and current reports as soon as reasonably practicable after such material is electronicallyfiled with, or furnished to the Securities and Exchange Commission (“SEC”). The Company’s website address is www.citizensEbank.com
ITEM 1A. RISK FACTORS
In addition to the other information contained in this report, the following risks may affect the Company. If any of these risks occurs, our business,financial condition or operating results could be adversely affected.
Management of Growth. Our financial performance and profitability will depend on our ability to manage recent and possible future growth. Althoughmanagement believes that it has substantially integrated the business and operations of growth, there can be no assurance that unfore-seen issuesrelating to growth will not adversely affect us. In addition, any future acquisitions and/or continued growth may present operating and other problemsthat could have an adverse effect on our business, financial condition and results of operations. Accordingly, there can be no assurance that we willbe able to execute our growth strategy or maintain the level of profitability that we have recently experienced.
Changes in Market Interest Rates. Our earnings are impacted by changing interest rates. Changes in interest rates impact the demand for newloans, the credit profile of existing loans, the rates received on loans and securities and rates paid on deposits and borrowings. The relationshipbetween the rates received on loans and securities and the rates paid on deposits and borrowings is known as interest rate spread. Given ourcurrent volume and mix of interest-bearing liabilities and interest-earning assets, our interest rate spread could be expected to increase during timesof rising interest rates and decrease during times of falling interest rates. With any further declines in interest rates, our ability to proportionatelydecrease the rates on our deposit sources may not be possible due to competitive pressures given our current exceptionally low cost of funds. Thismay result in a larger decrease in our interest rate spread. Although we believe our current level of interest rate sensitivity is reasonable, significantdecreases in interest rates may have an adverse effect on our business, financial condition and results of operations. Should interest rates increasein 2007, our interest rate spread could be expected to improve once loans with floors float off their floor and investments are redeployed into higheryielding securities.
Geographic Factors. Economic conditions in the communities we serve could adversely affect our operations. As a result of community bank focus,our results depend largely upon economic and business conditions in our service areas. A deterioration in economic and business conditions in ourmarket areas could have a material adverse impact on the quality of our loan portfolio, and the demand for our products and services, which in turnmay have a material adverse effect on our results of operations. Further, a downturn in the national economy might further exacerbate localeconomic conditions. The extent of the future impact of these events on economic and business conditions cannot be predicted.
Competition. Competition may adversely affect our performance. The financial services business in our market areas is highly competitive. It isbecoming increasingly competitive due to changes in regulation, technological advances, and the accelerating pace of consolidation among financialservices providers. We face competition both in attracting deposits and in making loans. We compete for loans principally through the interest ratesand loan fees we charge and the efficiency and quality of services we provide. Increasing levels of competition in the banking and financial servicesbusinesses may reduce our market share or cause the prices we charge for our services to fall. Our results may differ in future periods dependingupon the nature or level of competition.
Credit Risk. If a significant number of borrowers, guarantors and related parties fail to perform as required by the terms of their loans, we will sustainlosses. A significant source of risk arises from the possibility that losses will be sustained if a significant number of our borrowers, guarantors andrelated parties fail to perform in accordance with the terms of their loans. We have adopted underwriting and credit monitoring procedures and creditpolicies, including the establishment and review of the allowance for credit losses, that management believes are appropriate to minimize this risk byassessing the likelihood of nonperformance, tracking loan performance and diversifying our credit portfolio. These policies and procedures,however, may not prevent unexpected losses that could materially adversely affect our results of operations.
In fact, the Federal Deposit Insurance Corporation issued a pronouncement alerting banks to their concern about banks with a heavy concentrationof commercial real estate loans.
8

The Bank has credit risk exposure, including off-balance sheet credit risk exposure, as disclosed in Notes 4 and 10 to the consolidated financialstatements. The ultimate collectibility of a substantial portion of the loan portfolio is susceptible to changes in economic and market conditions in theregion. The Bank generally requires collateral on all real estate loans and typically maintains loan to value ratios of no greater than 70% to 80%.
The Bank has loan concentration in real estate, particularly in commercial real estate. These loans require additional evaluation, including, but notlimited to industry, geographic, and collateral analysis. Commercial real estate is further broken down to reflect owner occupied and non-owneroccupied properties. Any non-owner occupied category that is over 100% of Tier 1 capital is further analyzed as to the type of property being takenas collateral.
The contractual amounts of credit related financial instruments such as commitments to extend credit and letters of credit represent the amounts ofpotential accounting loss should the contract be fully drawn upon, the customer default, and the value of any existing collateral become worthless.Letters of credit were granted primarily to commercial borrowers.
Marketability of Common Stock There is no active market for our outstanding shares, and it is unlikely that an established market for our shares willdevelop in the near future. We presently do not intend to seek listing of the shares on any securities exchange, or quotation on the Nasdaqinterdealer quotation system. It is not known whether significant trading activity will take place for several years, if at all. Accordingly, our sharesshould be considered as a long-term investment.
ITEM 1B. UNRESOLVED STAFF COMMENTS
None.
ITEM 2. PROPERTIES
The principal properties of the Company and its subsidiary, Citizens Bank, are comprised of banking facilities owned or leased by the subsidiary.
The main office of the Bank is located in the heart of the business and retail center in Corvallis, Oregon. The building was constructed in 1977 andhas approximately 30,000 square feet of space on two levels above ground and a full basement. The second floor is occupied by the administrativesupport team, which includes the President/Chief Executive Officer, the Chief Financial Officer, the Chief Operating Officer, the Chief MarketingOfficer, the Chief Lending Officer, Administrative Assistants and the Loan Service Center.
The first floor serves as the main banking office for the Bank. It is occupied by a manager, a lending staff, an operations staff, tellers, marketingofficer, merchant services officer, new accounts staff, and mortgage department staff.
The basement is occupied by the Accounts Service Center. It includes a manager, two operations officers, proof and data processing staff, inventory,wire transfer, telephone, and courier staff. All of the Bank’s centralized functions, i.e., management, proof and data information, loan documentation,loan administration, cash services, mail services, accounting and human resources, occur in this building. The Bank owns this building.
The Bank operates ten (10) full service offices, of which six (6) are owned and four (4) are leased. These buildings range in size from 2,500 squarefeet to approximately 30,000 square feet. Their primary function and use is to provide banking service to the Bank’s customers. See the ContractualObligations table for a summary of our lease requirements. The following sets forth certain information regarding the Bank’s office facilities.
Main Office275 SW Third StreetCorvallis, Oregon
Junction City Office955 Ivy StreetJunction City, Oregon
East Albany Office (1)2315 14th Ave. SEAlbany, Oregon
Circle Office (2)978 NW Circle Blvd.Corvallis, Oregon
Philomath Office1224 Main StreetPhilomath, Oregon
West Albany Office (3)2230 Pacific Blvd. SEAlbany, Oregon
McMinnville Office455 NE Baker StreetMcMinnville, Oregon
Harrisburg Office (4)230 North 3rd StreetHarrisburg, Oregon
Dallas Office583 SE JeffersonDallas, Oregon
Springfield Office (5)2073 Olympic StreetSuite 100Springfield, Oregon
9

(1) Mennonite Home, satellite office of the East Albany Branch. This limited facility is open to the large retirement/assisted livingcenter for two hours Monday through Friday. Lease renewed on March 1, 2004 for a three-year term.
(2) Premises leased under an original lease agreement dated May 1, 1970 and a supplemental lease agreement dated August 16,1994. The lease expires January 31, 2020.
(3) Ground lease under ground lease agreement dated May 29, 1998. The lease expires in year 2048.(4) Premises leased under a lease agreement dated May 4, 2001. The lease was renewed on May 4, 2006, with the right to renew
for one additional period of five years.(5) Premises leased under a lease agreement dated June 1, 2003. The lease expires on May 31, 2008 with the right to renew for
two additional periods of three years each.
The Bank owns or leases all of the facilities described above. Management believes that the facilities are of sound construction, in good operatingcondition, are appropriately insured and are adequately equipped for carrying on the business of the Company.
Other Properties
The Bank owns two additional properties. One property is a commercial building on land adjacent to the Bank’s McMinnville, Oregon office. Thebuilding is being leased to a business on a ten year lease that commenced on January 1, 2003. The tenant has the option to renew the lease for twosuccessive terms of ten years each.
The second property was purchased on January 13, 2006 and is located in Springfield, Oregon on the same street as the Bank’s leased SpringfieldOffice. The building is currently being leased to another financial institution until January 2008. At the end of the lease term, the current tenant willvacate the property. The Bank plans to move its current Springfield Office to this building. The timing of the move has not been specificallydetermined.
Management believes that the facilities are of sound construction, in good operating condition and are appropriately insured.
ITEM 3. LEGAL PROCEEDINGS
As of the date of filing this Form 10K neither the Company nor its subsidiary were a party to any material legal proceedings. Further, management isnot aware of any threatened or pending lawsuits or other proceedings against the Company or its subsidiary which, if determined adversely, wouldhave a material effect on the business or financial position of either of them. The Company or the Bank may from time to time become a party tolitigation in the ordinary course of business, such as debt collection litigation or through an appearance as a creditor in a bankruptcy case.
ITEM 4. SUBMISSION OF MATTERS TO A VOTE OF SECURITY HOLDERS
During the fourth quarter of the year ended December 31, 2006, no matters were submitted to the Company’s security holders through thesolicitation of proxies or otherwise.
10
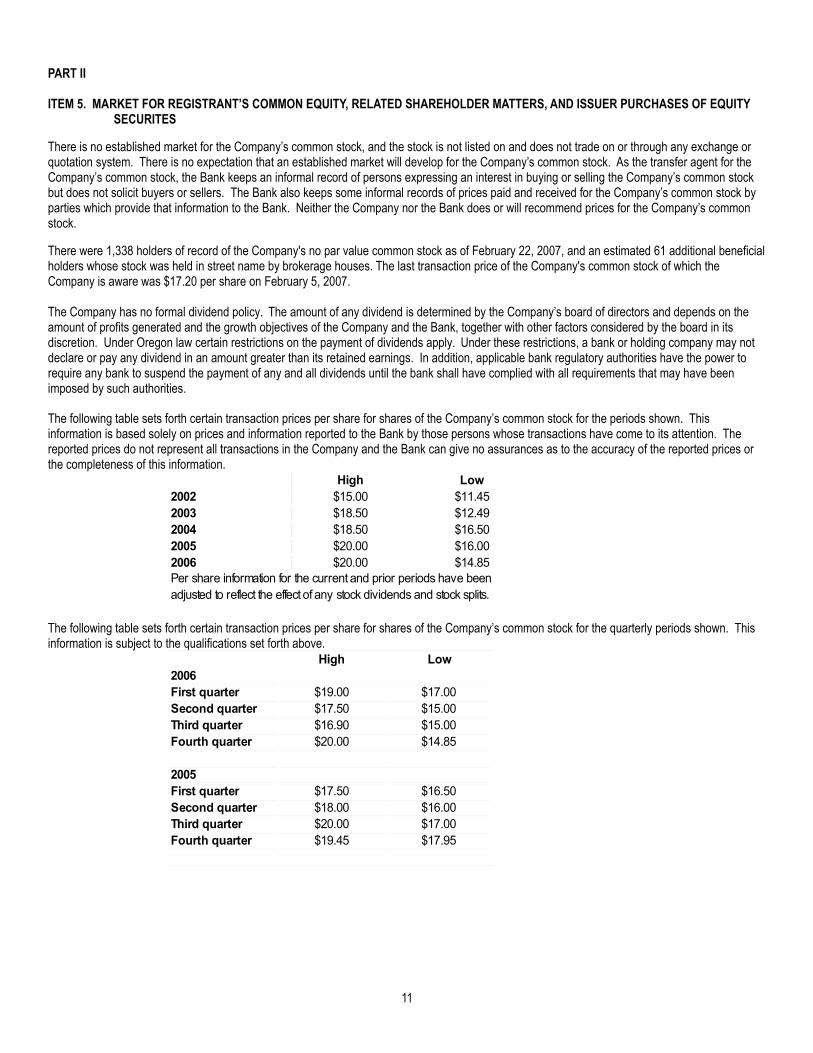
PART II
ITEM 5. MARKET FOR REGISTRANT’S COMMON EQUITY, RELATED SHAREHOLDER MATTERS, AND ISSUER PURCHASES OF EQUITYSECURITES
There is no established market for the Company’s common stock, and the stock is not listed on and does not trade on or through any exchange orquotation system. There is no expectation that an established market will develop for the Company’s common stock. As the transfer agent for theCompany’s common stock, the Bank keeps an informal record of persons expressing an interest in buying or selling the Company’s common stockbut does not solicit buyers or sellers. The Bank also keeps some informal records of prices paid and received for the Company’s common stock byparties which provide that information to the Bank. Neither the Company nor the Bank does or will recommend prices for the Company’s commonstock.
There were 1,338 holders of record of the Company's no par value common stock as of February 22, 2007, and an estimated 61 additional beneficialholders whose stock was held in street name by brokerage houses. The last transaction price of the Company's common stock of which theCompany is aware was $17.20 per share on February 5, 2007.
The Company has no formal dividend policy. The amount of any dividend is determined by the Company’s board of directors and depends on theamount of profits generated and the growth objectives of the Company and the Bank, together with other factors considered by the board in itsdiscretion. Under Oregon law certain restrictions on the payment of dividends apply. Under these restrictions, a bank or holding company may notdeclare or pay any dividend in an amount greater than its retained earnings. In addition, applicable bank regulatory authorities have the power torequire any bank to suspend the payment of any and all dividends until the bank shall have complied with all requirements that may have beenimposed by such authorities.
The following table sets forth certain transaction prices per share for shares of the Company’s common stock for the periods shown. Thisinformation is based solely on prices and information reported to the Bank by those persons whose transactions have come to its attention. Thereported prices do not represent all transactions in the Company and the Bank can give no assurances as to the accuracy of the reported prices orthe completeness of this information.
High Low
2002 $15.00 $11.45
2003 $18.50 $12.49
2004 $18.50 $16.50
2005 $20.00 $16.00
2006 $20.00 $14.85Per share information for the current and prior periods have been
adjusted to reflect the effect of any stock dividends and stock splits.
The following table sets forth certain transaction prices per share for shares of the Company’s common stock for the quarterly periods shown. Thisinformation is subject to the qualifications set forth above.
High Low
First quarter $19.00 $17.00
Second quarter $17.50 $15.00
Third quarter $16.90 $15.00
Fourth quarter $20.00 $14.85
First quarter $17.50 $16.50
Second quarter $18.00 $16.00
Third quarter $20.00 $17.00
Fourth quarter $19.45 $17.95
2006
2005
11

Five-year Stock Performance Graph
The following graph compares the yearly cumulative total return of Bancorp’s common stock during the five years ended December 31, 2006 with the(i) SNL S&P 500 (ii) SNL Bank Index and (iii) SNL Nasdaq Bank Index. This comparison assumes $100 was invested on December 31, 2001 inBancorp’s common stock and the comparison groups. All of these cumulative returns are computed assuming the reinvestment of dividends at thefrequency with which dividends were paid during the applicable years.
�������� �������
������ ������
����� �������� �������� �������� �������� �������� ��������
Citizens Bancorp 100.00 104.47 145.26 148.87 148.47 159.10
NASDAQComposite 100.00 68.76 103.67 113.16 115.57 127.58
SNL Bank Index 100.00 91.69 123.69 138.61 140.50 164.35
SNL NASDAQ Bank Index 100.00 102.85 132.76 152.16 147.52 165.62
����� ������ �����������
60
80
100
120
140
160
180
200
12/31/01 12/31/02 12/31/03 12/31/04 12/31/05 12/31/06
����������
Citizens Bancorp
NASDAQComposite
SNL Bank Index
SNL NASDAQBank Index
The stock performance data for Bancorp is based solely on prices reported to Bancorp for specific transactions between buyers and sellers whoinformed Bancorp of specific transactions. There was and is no established market for the common stock of Bancorp, and its common stock is notlisted on any exchange or other trading or quotation system. Stock performance data for Bancorp may not represent all transactions in the sharestraded for the periods in question, and no assurance can be given as to the accuracy of reported prices as the prices were not independentlyverified. The data is based on prices for actual sales transactions only, and excludes offers to buy or offers to sell.
12
����������������
�������������
����� 12/31/01 12/31/02 12/31/03 12/31/04 12/31/05 12/31/06
100.00 104.47 145.26 148.87 148.47 159.10
NASDAQ Composite 100.00 68.76 103.67 113.16 115.57 127.58
SNL Bank Index 100.00 91.69 123.69 138.61 140.50 164.35
SNL NASDAQ Bank Index 100.00 102.85 132.76 152.16 147.52 165.62
Source : SNL Financial LC, Charlottesville, VA (434) 977-1600
© 2007
Citizens Bancorp
www.snl.com
12/31/01 12/31/02 12/31/03 12/31/04 12/31/05 12/31/06
60
80
100
120
140
160
180
200
Total Return Performance
Citizens Bancorp NASDAQ Composite SNL Bank Index SNL NASDAQ BankIndex
Ind
ex
Va
lue
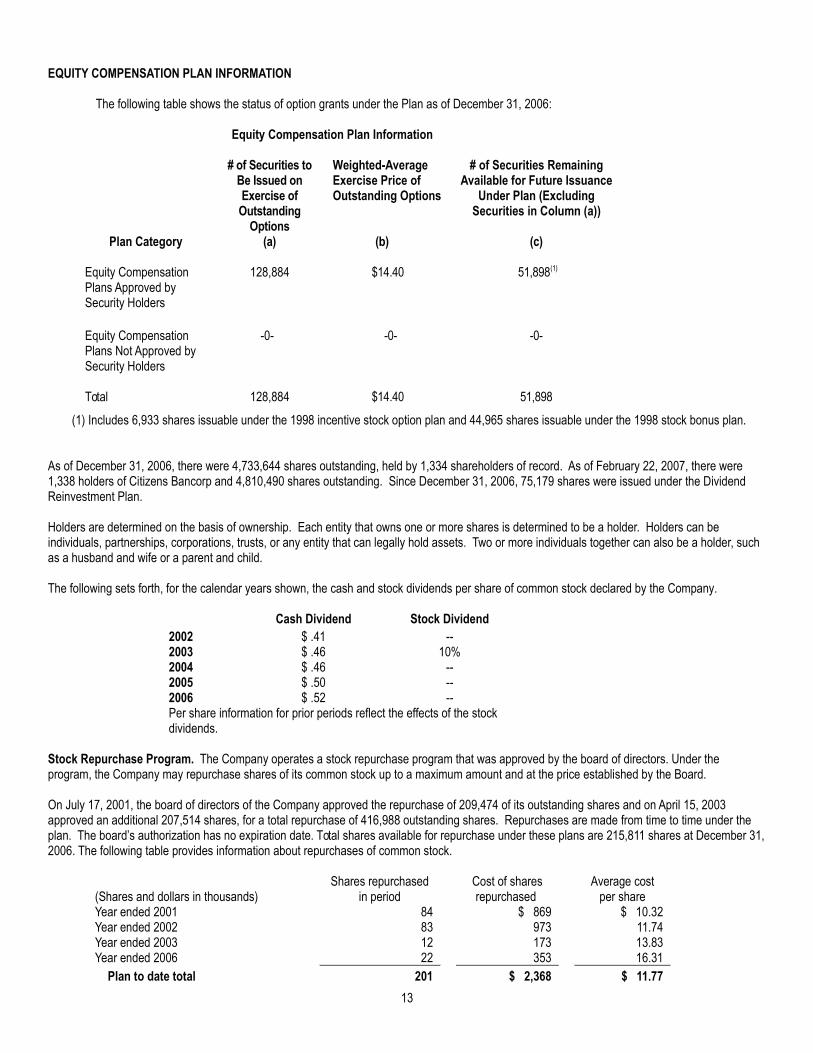
EQUITY COMPENSATION PLAN INFORMATION
The following table shows the status of option grants under the Plan as of December 31, 2006:
Equity Compensation Plan Information
Plan Category
# of Securities toBe Issued onExercise of
OutstandingOptions
(a)
Weighted-AverageExercise Price ofOutstanding Options
(b)
# of Securities RemainingAvailable for Future Issuance
Under Plan (ExcludingSecurities in Column (a))
(c)
Equity CompensationPlans Approved bySecurity Holders
128,884 $14.40 51,898(1)
Equity CompensationPlans Not Approved bySecurity Holders
-0- -0- -0-
Total 128,884 $14.40 51,898
(1) Includes 6,933 shares issuable under the 1998 incentive stock option plan and 44,965 shares issuable under the 1998 stock bonus plan.
As of December 31, 2006, there were 4,733,644 shares outstanding, held by 1,334 shareholders of record. As of February 22, 2007, there were1,338 holders of Citizens Bancorp and 4,810,490 shares outstanding. Since December 31, 2006, 75,179 shares were issued under the DividendReinvestment Plan.
Holders are determined on the basis of ownership. Each entity that owns one or more shares is determined to be a holder. Holders can beindividuals, partnerships, corporations, trusts, or any entity that can legally hold assets. Two or more individuals together can also be a holder, suchas a husband and wife or a parent and child.
The following sets forth, for the calendar years shown, the cash and stock dividends per share of common stock declared by the Company.
Cash Dividend Stock Dividend
2002 $ .41 --2003 $ .46 10%2004 $ .46 --2005 $ .50 --2006 $ .52 --Per share information for prior periods reflect the effects of the stockdividends.
Stock Repurchase Program. The Company operates a stock repurchase program that was approved by the board of directors. Under theprogram, the Company may repurchase shares of its common stock up to a maximum amount and at the price established by the Board.
On July 17, 2001, the board of directors of the Company approved the repurchase of 209,474 of its outstanding shares and on April 15, 2003approved an additional 207,514 shares, for a total repurchase of 416,988 outstanding shares. Repurchases are made from time to time under theplan. The board’s authorization has no expiration date. Total shares available for repurchase under these plans are 215,811 shares at December 31,2006. The following table provides information about repurchases of common stock.
(Shares and dollars in thousands)Shares repurchased
in periodCost of sharesrepurchased
Average costper share
Year ended 2001 84 $ 869 $ 10.32Year ended 2002 83 973 11.74Year ended 2003 12 173 13.83Year ended 2006 22 353 16.31
Plan to date total 201 $ 2,368 $ 11.77
13

ITEM 6. SELECTED FINANCIAL DATA
The following selected financial data should be read in conjunction with the Company’s consolidated financial statements and accompanying notespresented herein.
% increase
2006 2005 (decrease) 2004 2003 2002
2006 to 2005
EARNINGS
Total interest income $21,544 $18,468 16.66% $15,341 $16,312 $17,575
Total interest expense 5,088 3,017 68.64% 1,667 2,082 3,322
Net interest income 16,456 15,451 6.50% 13,674 14,230 14,253
Provision for credit losses 145 155 (6.45%) 142 270 624
Net interest income after provision for credit losses 16,311 15,296 6.64% 13,532 13,960 13,629
Total non-interest income 2,475 3,886 (36.31%) 4,428 4,113 3,773
Total non-interest expense 10,386 11,154 (6.89%) 11,199 10,203 9,793
Income before taxes 8,400 8,028 4.63% 6,761 7,870 7,609
Income taxes 2,941 2,701 8.89% 2,409 2,858 2,751
Net income $5,459 $5,327 2.48% $4,352 $5,012 $4,858
PER SHAREDATA (1)
Net income basic $1.15 $1.12 2.68% $0.94 $1.10 $1.07
Net income diluted 1.15 1.11 3.60% 0.94 1.09 1.07
Cash dividends 0.52 0.50 4.00% 0.46 0.46 0.41
Book value 9.83 9.06 8.50% 8.31 7.82 7.20
PERIOD END BALANCES
Total assets $359,029 $338,900 5.94% $334,588 $326,269 $312,639
Net loans 250,152 230,547 8.50% 210,951 185,053 178,333
Deposits 270,610 254,083 6.50% 235,482 235,759 227,363
Repurchase agreements 35,586 36,590 (2.74%) 55,446 50,907 48,059
Shareholders' equity 46,524 42,296 10.00% 38,401 35,617 32,330
PERFORMANCERATIOS
Return on Average Assets 1.60% 1.58% 1.32% 1.59% 1.64%
Return on Average Equity 11.78% 12.90% 11.23% 14.06% 15.32%
Dividend PayoutRatio 45.22% 44.64% 48.94% 41.82% 38.32%
Average Equity to Average Assets 13.61% 12.26% 11.75% 11.32% 10.73%
Efficiency Ratio (2) 53.89% 56.70% 60.88% 54.92% 53.63%
(1)����Per share amounts and the average number of shares outstanding have been restated for a stock dividend of 10% in 2003.
(2)����The efficiency ratio is computed by dividing total non-interest expenses by the total of net interest income and total non-interest income.
Net interest income used in the calculation includes tax equivalent adjustments (at the federal statutory rate of 34%) related to income on
securities and loans that are exempt fromfederal taxes.
(In thousands, except share data)
Year ended December 31,
14
ITEM 7. MANAGEMENT’S DISCUSSION AND ANALYSIS OF FINANCIAL CONDITION AND RESULTS OF OPERATIONS
The following discussion is intended to provide a more comprehensive review of the Company’s operating results and financial condition than can beobtained from reading the Consolidated Financial Statements alone. The discussion should be read in conjunction with the audited consolidatedfinancial statements and the notes thereto included as part of this Form 10-K.
Critical Accounting Policies and Estimates
Our financial statements are based on the selection and application of significant accounting policies which require management to make significantestimates and assumptions (see Note 1 to the consolidated financial statements). We believe that the following is one of the more critical judgmentareas in the application of our accounting policies that currently affect our financial condition and results of operations.
Allowance for Credit Losses. The allowance for credit losses is established through a provision for credit losses charged to operations. Theallowance for credit losses is a significant estimate and management and the Board of Directors regularly evaluate its adequacy by considering anumber of factors, including, among other things, current loan grades and delinquency trends, historical loss rates, changes in the composition of theloan portfolio, overall portfolio quality, industry concentrations, and current economic factors and the effect of those factors on a borrower’srepayment ability. The use of different estimates or assumptions could produce different provisions for credit losses. In addition, the allowance forcredit losses is also subject to regulatory supervision and examination.
Securities Available for Sale. Securities available for sale consist of debt securities that the Bank intends to hold for an indefinite period, but notnecessarily to maturity. Such securities may be sold to implement the Bank’s asset/liability management strategies and in response to changes ininterest rates and similar factors. Securities available for sale are reported at fair value. Unrealized gains and losses, net of the related deferred taxeffect, are reported as a net amount in a separate component of shareholders' equity entitled “accumulated other comprehensive income (loss).”Realized gains and losses on securities available for sale, determined using the specific identification method, are included in earnings. Amortizationof premiums and accretion of discounts are recognized in interest income over the period to maturity.
Income Taxes. Deferred tax assets and liabilities result from differences between the financial statement carrying amounts and the tax bases ofassets and liabilities, and are reflected at currently enacted income tax rates applicable to the period in which the deferred tax assets or liabilities areexpected to be realized or settled. Deferred tax assets are reduced by a valuation allowance when, in the opinion of management, it is more likelythan not that some portion or all of the deferred tax assets will not be realized. As changes in tax laws or rates are enacted, deferred tax assets andliabilities are adjusted through the provision for income taxes.
Stock-Based Compensation
At December 31, 2006, the Company had a qualified incentive stock option plan. Prior to January 1, 2006, we accounted for this plan under therecognition and measurement provisions of Accounting Principles Board Opinion No. 25, Accounting for Stock Issued to Employees and otherrelated interpretations as permitted by Statement of Financial Accounting Standards No.123, Accounting for Stock-Based Compensation (“StatementNo. 123”). No stock-based compensation cost related to our employees was recognized in the consolidated statements of earnings for any periodending prior to January 1, 2006, as all options granted to our employees had exercise prices equal to the market value of the underlying commonstock on the date of grant. Effective January 1, 2006, the Company adopted the fair value recognition provisions of Statement of FinancialAccounting Standards No. 123 (revised 2004), Share-Based Payment (“Statement No. 123R”), using the modified prospective transition method.Compensation cost recognized during 2006 included cost for all share-based payments granted prior to, but not yet vested as of December 31,2005, based on the grant date fair value estimated in accordance with the original provisions of Statement No. 123. Results for prior periods have notbeen restated. There were no stock options granted during the periods ended December 31, 2006 and 2005.
Under the fair value recognition provisions of Statement No. 123R, stock-based compensation cost is estimated at the grant date based on the fairvalue of the award and is recognized as expense over the requisite vesting period of the award. Consistent with the valuation method the Companyused for disclosure-only purposes under provisions of Statement No. 123, the Company will use the Black-Scholes option pricing model for anyfuture grants to estimate fair value under Statement No. 123R. The Black-Scholes model requires the use of employee exercise behavior data andthe use of a number of assumptions including volatility of the Company’s stock price, dividend yield, weighted average risk-free interest rate andweighted average expected life of the options. Compensation cost is recognized on a straight–line basis over the requisite vesting period.
Results of Operations for Years Ended December 31, 2006, 2005, and 2004.
Net Income. For the three years ended December 31, 2006, 2005, and 2004 the Company’s net income was $5.459 million, $5.327 million, and$4.352 million, respectively. 2006 net income increased $132 thousand or 2.5% as compared to 2005, which increased $975 thousand or 22.4%over 2004. The Company’s increased net income in 2006 resulted primarily from an increase in interest income on loans and investments.
The Company’s increase in loan interest income for the period ending December 31, 2006 was primarily the result of increased loan rates ascompared to the same period in 2005. Interest income on loans increased for the period ending on December 31, 2005 compared to the same
15

period in 2004 primarily as a result of volume increases in the loan portfolio. Loan totals increased $19.7 million or 8.5% for the period endingDecember 31, 2006 as compared to the same period in 2005 which increased $19.6 million or 9.1% over 2004.The average rate earned on loans for 2006, 2005, and 2004 was 7.7%, 7.2%, and 6.8%, respectively. Management believes that the customerrelationships developed by its experienced loan officers and increased market penetration contributed to the increase in loan volumes in 2006 and2005.
The 2006 increase in the investment portfolio income was due to higher rates on securities which offset the lower volume of securities as comparedto the same period in 2005. Maturing bonds were deployed to fund loan growth which produced higher returns.
The increase in average earning assets in 2006 is primarily reflected in increases in loan volumes. Average yields on earning assets for 2006, 2005,and 2004 were 7.0%, 6.1%, and 5.3%, respectively.
Interest Income. Interest income totaled $21.5 million for the year ended December 31, 2006, a 16.7% increase from the $18.5 million for 2005,which was a 20.4% decrease from the $15.3 million for 2004. The increase for the period ending December 31, 2006 as compared to the sameperiod in 2005 was primarily a result of increased rates on loans and securities. The increase in interest income for the period ending December 31,2005 as compared to the same period in 2004 was primarily due to volume increases in the loan portfolio. The increase in interest income onsecurities for the period ending December 31, 2006 as compared to 2005 was a result of the repricing of re-invested maturing securities into higheryielding bonds. The decrease of interest income on securities for the period ending December 31, 2005 compared to the same period in 2004 was aresult of decreased rates on securities.
Interest Expense. Interest expense for the year ended December 31, 2006 was $5.1 million, a 68.6% increase from the $3.0 million expense for2005, which was a 81.0% decrease over the $1.7 million expense for 2004. The increase in interest expense in 2006 resulted primarily from higherinterest rates paid on deposits as compared to the same period in 2005 and 2004. The Company increased the rates it paid on deposits in 2006 as aresult of increasing market rates. The Company has a very low cost of funds as compared to peer banks. The overall cost of funds, including non-interest bearing demand deposits, for the years ending 2006, 2005, and 2004 was 1.7%, 1.0%, and .7% respectively. Management believes itsrelationship style of banking and outstanding customer service contributes to its low funding cost.
Net Interest Income. Net interest income for the years 2006, 2005, and 2004 was $16.5 million, $15.5 million, and $13.7 million, respectively.Additionally, for the same periods beginning with 2006, net interest margins, on a tax equivalent basis, were 5.4%, 5.1%, and 4.7%, respectively. Netinterest income increased for the period ending December 31, 2006 as compared to the same period in 2005 primarily due to rate increases on loansand securities that exceeded the interest expense increase in deposits from both rate and volume increases. Net interest income increased for theperiod ending December 31, 2005 as compared to the same period in 2004 primarily due to volume increases on both loans and securities thatexceeded the interest expense increase in deposits from both rate and volume increases.
16
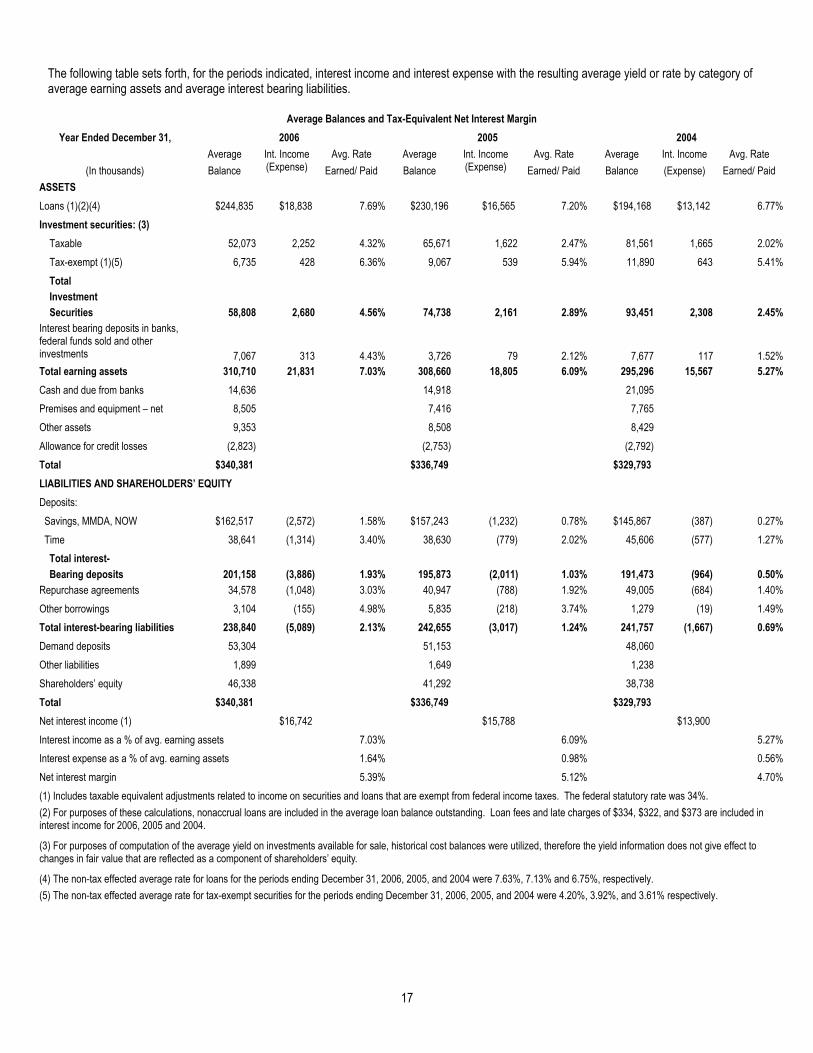
The following table sets forth, for the periods indicated, interest income and interest expense with the resulting average yield or rate by category ofaverage earning assets and average interest bearing liabilities.
Year Ended December 31,
Average Avg. Rate Average Avg. Rate Average Int. Income Avg. Rate
(In thousands) Balance Earned/ Paid Balance Earned/ Paid Balance (Expense) Earned/ Paid
Loans (1)(2)(4) $244,835 $18,838 7.69% $230,196 $16,565 7.20% $194,168 $13,142 6.77%
Taxable 52,073 2,252 4.32% 65,671 1,622 2.47% 81,561 1,665 2.02%
Tax-exempt (1)(5) 6,735 428 6.36% 9,067 539 5.94% 11,890 643 5.41%
Total
Investment
Securities 58,808 2,680 4.56% 74,738 2,161 2.89% 93,451 2,308 2.45%
Interest bearing deposits in banks,
federal funds sold and other
investments 7,067 313 4.43% 3,726 79 2.12% 7,677 117 1.52%
Total earning assets 310,710 21,831 7.03% 308,660 18,805 6.09% 295,296 15,567 5.27%
Cashanddue frombanks 14,636 14,918 21,095
Premises andequipment – net 8,505 7,416 7,765
Other assets 9,353 8,508 8,429
Allowance for credit losses (2,823) (2,753) (2,792)
Total $340,381 $336,749 $329,793
Savings, MMDA, NOW $162,517 (2,572) 1.58% $157,243 (1,232) 0.78% $145,867 (387) 0.27%
Time 38,641 (1,314) 3.40% 38,630 (779) 2.02% 45,606 (577) 1.27%
Total interest-
Bearing deposits 201,158 (3,886) 1.93% 195,873 (2,011) 1.03% 191,473 (964) 0.50%
Repurchase agreements 34,578 (1,048) 3.03% 40,947 (788) 1.92% 49,005 (684) 1.40%
Other borrowings 3,104 (155) 4.98% 5,835 (218) 3.74% 1,279 (19) 1.49%
Total interest-bearing liabilities 238,840 (5,089) 2.13% 242,655 (3,017) 1.24% 241,757 (1,667) 0.69%
Demanddeposits 53,304 51,153 48,060
Other liabilities 1,899 1,649 1,238
Shareholders’ equity 46,338 41,292 38,738
Total $340,381 $336,749 $329,793
Net interest income (1) $16,742 $15,788 $13,900
7.03% 6.09% 5.27%
1.64% 0.98% 0.56%
5.39% 5.12% 4.70%
(5) Thenon-tax effected average rate for tax-exempt securities for the periods endingDecember 31, 2006, 2005, and 2004were 4.20%, 3.92%, and3.61% respectively.
(1) Includes taxable equivalent adjustments related to incomeon securities and loans that are exempt from federal income taxes. The federal statutory ratewas 34%.
(2) For purposes of these calculations, nonaccrual loans are included in the average loan balance outstanding. Loan fees and late charges of $334, $322, and $373are included in interest
income for 2006, 2005and2004.
(3) For purposes of computation of the average yield on investments available for sale, historical cost balances were utilized, therefore the yield information does not give effect to
changes in fair value that are reflected as a component of shareholders’ equity.
(4) The non-tax effected average rate for loans for the periods endingDecember 31, 2006, 2005, and 2004were 7.63%, 7.13% and6.75%, respectively.
Net interestmargin
Interest incomeas a% of avg. earning assets
Interest expense as a% of avg. earning assets
LIABILITIES AND SHAREHOLDERS’ EQUITY
Deposits:
ASSETS
Investment securities: (3)
Int. Income
(Expense)
Int. Income
(Expense)
Average Balances and Tax-Equivalent Net Interest Margin
2006 2005 2004
17
Average Balances and Tax-Equivalent Net Interest Margin
Year Ended December 31, 2006 2005 2004
Average Avg. Rate Average Avg. Rate Average Int. Income Avg. Rate
(In thousands) Balance Earned/ Paid Balance Earned/ Paid Balance (Expense) Earned/ Paid
ASSETS
Loans (1)(2)(4) $244,835 $18,838 7.69% $230,196 $16,565 7.20% $194,168 $13,142 6.77%
Investment securities: (3)
Taxable 52,073 2,252 4.32% 65,671 1,622 2.47% 81,561 1,665 2.02%
Tax-exempt (1)(5) 6,735 428 6.36% 9,067 539 5.94% 11,890 643 5.41%
Total
Investment
Securities 58,808 2,680 4.56% 74,738 2,161 2.89% 93,451 2,308 2.45%
7,067 313 4.43% 3,726 79 2.12% 7,677 117 1.52%
Total earning assets 310,710 21,831 7.03% 308,660 18,805 6.09% 295,296 15,567 5.27%
Cash and due from banks 14,636 14,918 21,095
Premises and equipment – net 8,505 7,416 7,765
Other assets 9,353 8,508 8,429
Allowance for credit losses (2,823) (2,753) (2,792)
Total $340,381 $336,749 $329,793
LIABILITIES AND SHAREHOLDERS’ EQUITY
Deposits:
Savings, MMDA, NOW $162,517 (2,572) 1.58% $157,243 (1,232) 0.78% $145,867 (387) 0.27%
Time 38,641 (1,314) 3.40% 38,630 (779) 2.02% 45,606 (577) 1.27%
Total interest-
Bearing deposits 201,158 (3,886) 1.93% 195,873 (2,011) 1.03% 191,473 (964) 0.50%
Repurchase agreements 34,578 (1,048) 3.03% 40,947 (788) 1.92% 49,005 (684) 1.40%
Other borrowings 3,104 (155) 4.98% 5,835 (218) 3.74% 1,279 (19) 1.49%
Total interest-bearing liabilities 238,840 (5,089) 2.13% 242,655 (3,017) 1.24% 241,757 (1,667) 0.69%
Demand deposits 53,304 51,153 48,060
Other liabilities 1,899 1,649 1,238
Shareholders’ equity 46,338 41,292 38,738
Total $340,381 $336,749 $329,793
Net interest income (1) $16,742 $15,788 $13,900
Interest income as a % of avg. earning assets 7.03% 6.09% 5.27%
Interest expense as a % of avg. earning assets 1.64% 0.98% 0.56%
Net interest margin 5.39% 5.12% 4.70%
(1) Includes taxable equivalent adjustments related to income on securities and loans that are exempt from federal income taxes. The federal statutory rate was 34%.
(4) The non-tax effected average rate for loans for the periods ending December 31, 2006, 2005, and 2004 were 7.63%, 7.13% and 6.75%, respectively.
(5) The non-tax effected average rate for tax-exempt securities for the periods ending December 31, 2006, 2005, and 2004 were 4.20%, 3.92%, and 3.61% respectively.
Int. Income(Expense)
Int. Income(Expense)
Interest bearing deposits in banks,federal funds sold and otherinvestments
(2) For purposes of these calculations, nonaccrual loans are included in the average loan balance outstanding. Loan fees and late charges of $334, $322, and $373 are included ininterest income for 2006, 2005 and 2004.
(3) For purposes of computation of the average yield on investments available for sale, historical cost balances were utilized, therefore the yield information does not give effect tochanges in fair value that are reflected as a component of shareholders’ equity.

The following table sets forth, on a tax-equivalent basis, a summary of the changes in net interest income resulting from changes in volumes andrates. Changes not due solely to volume or rate changes are allocated to volume and rate in proportion to the relationship of the absolute dollaramounts of the change in each.
Average Average Net Average Average Net
(in thousands) Volume Rate Change Volume Rate Change
INTEREST INCOME
Loans $229 $2,044 $2,273 $2,672 $751 $3,423
Investment securities (392) 911 519 377 (524) (147)
Interest-bearing deposits in banks,
Federal funds sold, and other investments
(289) 523 234 (74) 36 (38)
Total interest income (452) 3,478 3,026 2,975 263 3,238
INTEREST EXPENSE
NOW, MMDA&Savings deposits 40 1,300 1,340 28 817 845
Time deposits - - 535 535 (99) 301 202
Repurchase agreements (138) 398 260 (125) 229 104
Other borrowings (224) 161 (63) 140 59 199
Total interest expense (322) 2,394 2,072 (56) 1,406 1,350
Changes in net
Interest income ($130) $1,084 $954 $3,031 ($1,143) $1,888
2006 versus 2005 2005 versus 2004
Increase (decrease)
Due to change in
Increase (decrease)
Due to change in
The following chart further reflects changes in average balances and rates from the year ended December 31, 2005 to the year ended December 31,2006.
Loans 6.36% Loans 6.92%
Investments (21.31%) Investments 57.61%
Fed funds sold and deposits in banks 89.67% Fed funds sold and deposits in banks 108.89%
Total Earning Assets 0.66% Total Earning Assets 15.33%
NOW, MMDA, Savings 3.35% NOW, MMDA, Savings 101.99%
Time 0.03% Time 68.63%
Repurchase Agreements (15.55%) Repurchase Agreements 57.49%
Other Borrowings (46.80%) Other Borrowings 33.66%
Total Int Bear Liabilities (1.57%) Total Int Bear Liabilities 71.37%
Increase (Decrease) In Average Balance: Increase (Decrease) In Average Rate:
The following chart further reflects changes in average balances and rates from the year ended December 31, 2004 to the year ended December 31,2005.
Loans 18.56% Loans 6.32%
Investments (20.02%) Investments 17.07%
Fed funds sold and deposits in banks (51.47%) Fed funds sold and deposits in banks 39.12%
Total Earning Assets 4.53% Total Earning Assets 15.57%
NOW, MMDA, Savings 7.80% NOW, MMDA, Savings 195.31%
Time (15.30%) Time 59.39%
Repurchase Agreements (16.44%) Repurchase Agreements 37.88%
Other Borrowings 356.22% Other Borrowings 151.50%
Total Int Bear Liabilities 0.37% Total Int Bear Liabilities 80.31%
Increase (Decrease) In Average Balance: Increase (Decrease) In Average Rate:
18
���������������� ����������������������������������� ����������������������������������� ����������������
������� ������� ��� ������� ������� ���
�������������� ������ ���� ������ ������ ���� ������
���������������
����� ���� ������ ������ ������ ���� ������
��������������������� ����� ��� ��� ��� ����� �����
����� ��� ��� ���� �� ����
��������������������� ����� ����� ����� ����� ��� �����
����������������
���������������������������� �� ����� ����� �� ��� ���
������������� ���� ��� ��� ���� ��� ���
���������������������� ����� ��� ��� ����� ��� ���
���������������� ����� ��� ���� ��� �� ���
���������������������� ����� ����� ����� ���� ����� �����
���������������
��������������� ������ ������ ���� ������ �������� ������
���������������� �������� �� ������ ������������ ����� ��� ����� �����������
��������������������������������������� ������������������������������������
����� ����� ����� �����
����������� �������� ����������� ������
������������������������������������ ������ ������������������������������������ �������
�������������������� ����� �������������������� ������
������������������ ����� ������������������ �������
���� ����� ���� ������
���������������������� �������� ���������������������� ������
���������������� �������� ���������������� ������
�������������������������� ������� �������������������������� ������
��������������������������������������� ������������������������������������
����� ������ ����� �����
����������� �������� ����������� ������
������������������������������������ �������� ������������������������������������ ������
�������������������� ����� �������������������� ������
������������������ ����� ������������������ �������
���� �������� ���� ������
���������������������� �������� ���������������������� ������
���������������� ������� ���������������� �������
�������������������������� ����� �������������������������� ������

Net Interest Income After Provision For Credit Losses. Net interest income after the provision for credit losses was $16.3 million at December31, 2006, $15.3 million at December 31, 2005, and $13.5 million at December 31, 2004. Total provision for credit losses for the three years endingDecember 31, 2006 was $145,000, $155,000, and $142,000, respectively. The Company decreased the 2006 provision for credit losses based onits analysis of probable losses in the loan portfolio derived from the loan grading system and the loss analysis of impaired loans in 2006. Charge-offsof $24,000, $202,000, and $117,000 were realized in 2006, 2005, and 2004, respectively. Recoveries were $4,000, $7,000, and $0 during the sameperiods. Historically, the Company’s loan charge-off levels have been very low compared to its peers. Management will continue to monitor andanalyze charge-off levels closely. Management’s assessment of the allowance for credit losses includes various factors such as delinquent and non-performing loans, historical analysis of credit loss experience, knowledge of the present and anticipated economic future of its market areas, andloan grades. Management believes the high quality of the loan portfolio reflects the Bank’s strong internal controls, excellent loan policy standards,experienced loan officers and conservative underwriting practices. Management believes the allowance for credit losses at December 31, 2006 of$2.9 million is adequate. The allowance for credit losses to total loans at December 31, 2006, 2005, and 2004 respectively was 1.14%, 1.18%, and1.31%.
Non-Interest Income. Non-interest income was $2.5 million for the year ended December 31, 2006, a 36.3% decrease from $3.9 million in 2005,which was 12.2% lower than the $4.4 million in 2004. The decrease in non-interest income for the period ending December 31, 2006 was dueprimarily to a decrease in service charge and Bankcard income compared to the same periods in 2005 and 2004. The decrease in service chargeincome was primarily a result of the increase in the earnings credit on business accounts and a decrease in overdraft fees on deposit accounts ascompared to the same periods in 2005 and 2004. As market rates have increased, the Company has increased the earnings credit rate which offsetsservice charges on its business account product. Bankcard income decreased for the period ending December 31, 2006 as compared to the sameperiods in 2005 and 2004 as the Company transferred its merchant bankcard servicing rights in 2005 to Western States Bankcard Association (whichsold to Texas Independent Bank in 2006). Additionally, non-interest income for the period ended December 31, 2006 was lower as compared to thesame periods in 2005 and 2004 as the Company had no gains on sales of assets in 2006 as compared to $92 thousand in 2005 and $291 thousandin 2004.
Non-Interest Expense. Non-interest expenses consist primarily of employee salaries and benefits, occupancy, data processing, Bankcard services,office supplies, professional services and other non-interest expenses.
Non-interest expense was $10.4 million for the year ended December 31, 2006, a decrease of 4.2% from $11.2 million in 2005, which was adecrease of .4% or $.45 million in 2004. The decreases for the periods ending December 31, 2006 as compared to the same periods in 2005 and2004 were a result of the decrease in Bankcard expense as the Company transferred its merchant bankcard services to an outside vendor in 2005.
At the end of 2006, the Company employed 127 full time equivalent employees compared to 131 at the end of 2005 and 137 at the end of 2004. Theincrease in salary and employee benefits for the period ending 2006 as compared to 2005 and 2004 are the result of routine adjustments inemployee salaries and benefits which was not offset by a lower number of full time equivalent employees in 2006 as compared to 2005 and 2004.
Income Taxes. Income tax expense for 2006 was $2.9 million or 35.0% of income before taxes, 2005 was $2.7 million or 33.6% of income beforetaxes, and 2004 was $2.4 million or 35.6% of income before taxes.
Asset/Liability Management. The Company uses an asset/liability modeling system called ALX to estimate the degree of interest rate risk andmarket risk inherent in its mix of interest earning assets and interest bearing liabilities. The Company’s strategy is to keep a position that is very closeto “balanced”. That is, the repricing of assets and liabilities would move much at the same rate. The Company’s profitability is dependent to a largeextent on net interest income. The Company is slightly asset sensitive, meaning that if rates rise the Company’s net interest margin will increase, andif rates decline the margin will decrease.
Liquidity and Sources of Funds. The Company’s primary sources of funds for liquidity purposes are customer deposits, maturities of investmentsecurities, sales of “available for sale” securities, loan repayments, short-term borrowings, advances on lines of credit from correspondent banks andfrom the Federal Home Loan Bank of Seattle, and the purchase of federal funds. The Company can anticipate the availability of funds fromscheduled loan repayments, maturities of securities and from borrowed funds. Customer deposits and unscheduled payments of loans areinfluenced by the interest rate environment, the condition of the economy, competition, and other factors.
Deposits are a primary source of funds. At December 31, 2006, total deposits were $270.6 million, $254.1 million at December 31, 2005 and $235.5million at December 31, 2004. The Company experienced a growth in demand deposits for the period ending December 31, 2006 of approximately$16.5 million or 6.5% as compared to the same period in 2005. Management believes the growth is a result of increasing penetration in its marketareas due to a strong corporate culture of relationship banking.
The Company has securities sold under agreements to repurchase (REPOs) at December 31, 2006, 2005, and 2004 of $35.6 million, $36.6 million,and $55.4 million, respectively. REPOs represent an agreement between the Bank and a customer to collateralize funds deposited by the customerin an interest bearing repurchase sweep account. The Bank secures the REPO account with Government Agency Securities. In consideration of thefunds deposited, the Bank transfers the security to the customer. The Bank agrees to repurchase the security on the next business day for the
19

amount of the deposit plus simple interest on that amount calculated for one day at the rate established for REPO accounts as set by the Bank forthat day. The funds provided by REPOs are considered borrowings, not deposits, and are not covered by FDIC insurance.
The following table is a summary of securities sold under repurchase agreement (REPO) for each of the last three years.
(Dollars in Thousands)2006 2005 2004
Securities sold under agreement to repurchase:Average interest rate
At year end 2.4% 2.1% 1.7%For the year 3.0% 1.9% 1.4%
Average amount outstanding during theyear $ 34,578 $ 40,947 $ 49,005Maximum amount outstanding at anymonth end $ 37,023 $ 56,015 $ 55,446Amount outstanding at year end $ 35,586 $ 36,590 $ 55,446
Management anticipates that the Company will rely primarily on deposit growth, maturities of investment securities, sales of “available for salesecurities,” and loan repayments to meet its liquidity needs. Borrowings can be used to provide liquidity for short-term needs but it is the practice ofthe Company to attempt to fund long-term loans and investments with core deposits and earnings, not short-term borrowings. A limited amount ofborrowings may be used on a long-term basis to fund lending activities and to match maturities or repricing intervals of assets.
The overall cost of funds, including non-interest demand deposits, was as follows for the years ended December 31:
COST OF FUNDS2006 2005 20041.7% 1.0% .7%
The average daily amount of deposits and rates paid on deposits is summarized for the periods indicated in the following table at December 31.
2006 2005 2004
(In Thousands) Amount $ Rate % Amount $ Rate % Amount $ Rate %DEPOSITSDemand $53,304 -- $51,153 -- $48,060 --Interest-bearingdemand
$36,357 .66% 36,683 .34% 36,565 .16%
Savings/MMDA $126,160 1.85% 120,560 .92% 109,302 .30%Time $38,641 3.40% 38,630 2.02% 45,606 1.27%Total $254,462 $247,026 $239,533
The following table indicates the amount of the Bank’s certificates of deposits with balances equal to or greater than $100,000 classified by timeremaining until maturity as of December 31, 2006.
Maturity Period Certificates of Deposit(In Thousands)
3 months or less $5,9753 months through 6 months 4,9606 months through 12 months 3,710Over 12 months 1,388TOTAL $16,033
20

Contractual Obligations
The following table sets forth the Company’s contractual obligations at December 31, 2006.
Less than 1 Year 1-3 Years 3-5 Years More than 5 Years
Operating Leases (1-6) $ 1,717 $ 140 $ 204 $ 152 $ 1,221
Certificates of Deposit $ 40,516 $ 34,323 $ 5,162 $ 1,031 --Short-term Borrowings $ 37,489 $ 37,489 -- -- --
Operating Leases
(1) Mennonite Home, satellite office of the East Albany Branch. This limited facility is open to the large retirement/assisted living center for twohours Monday through Friday. Lease renewed on March 1, 2004 for $396 per month. Lease is renewable every three years.
(2) Circle Branch building lease commenced August 16, 1994 and expires January 31, 2020. Current monthly lease is $3,196. Lease agreementhas annual rent adjusted based on the United States Bureau of Labor Statistics Consumer Price Index.
(3) West Albany Branch land lease dated May 29, 1998 for a term of fifty years. On each fifth annual anniversary date of the lease, rent is adjustedbased on any increase in the Consumer Price Index. At no time will the rent decrease from the initial stated rent of $1,850 per month. Currentmonthly lease in $2,092.
(4) Harrisburg Branch building lease commenced May 4, 2001 for a five-year term with the option to renew for two five-year terms. The lease wasrenewed for another 5 year term on May 4, 2006. The monthly lease is $1,050.
(5) Springfield Branch building lease dated June 1, 2003 for a term of five years, expiring May 31, 2008. Monthly lease is $3,730 per month.(6) Building leased for storage purposes. Lease commenced on February 1, 2004 and expires on July 31, 2010 with an option to renew for two
additional terms of five years. The rent will increase annually based upon the Consumer Price Index. The current monthly lease is $1,539.
Capital Resources. The Company is subject to various capital requirements administered by the federal banking agencies. Failure to meetminimum capital requirements can initiate certain mandatory and possibly additional discretionary actions by regulators that if undertaken, couldhave a direct material effect on the Company’s consolidated financial statements. Under capital adequacy guidelines that involve quantitativemeasures of the Company’s assets, and certain off-balance-sheet items as calculated under regulatory accounting practices, the Company’s capitalclassification is also subject to qualitative judgments by the regulators about components, risk weightings, and other factors.
As of December 31, 2006, the most recent notification from the Bank’s regulator, categorized the Bank as well-capitalized under the applicableregulations. Tobe categorized as “well capitalized”, the Company must maintain at least 10% total risk based capital, 6% Tier 1 risk based capitaland 5% Tier 1 leverage capital. There are no conditions or events since that notification that management believes have changed its category rating.
Shareholders’ equity increased to $46.5 million at December 31, 2006, from $42.3 million in 2005 and $38.4 million in 2004. The increase reflectsnet income of $5.5 million, other comprehensive income of $141 thousand, $1.1 million from the dividend reinvestment plan, $243 thousand in stockoptions exercised, $2 thousand in stock grants, $14 thousand for the tax benefit of disqualifying disposition of stock options, and $56 thousand fromstock based compensation recognized in earnings. These increases were primarily offset by a cash dividend declared of $2.5 million and stockrepurchases of $353 thousand. The Company’s average shareholders’ equity, as a percentage of average assets, was 13.6% for the year endedDecember 31, 2006, 12.3% for the year ended December 31, 2005, and 11.8% for the year ended December 31, 2004.
As interest rates change, the value of the Bank’s “available for sale” investment portfolio, which is reported at fair value, may be positively ornegatively impacted and therefore may cause an increase or a reduction in reported shareholders’ equity. Equity grew at 10.0% over the periodbetween December 31, 2005 and December 31, 2006, while assets grew by 5.9% over the same period.
At December 31, 2006, the Company had no material commitments for capital expenditures that would negatively impact the Company’s capitalposition.
21
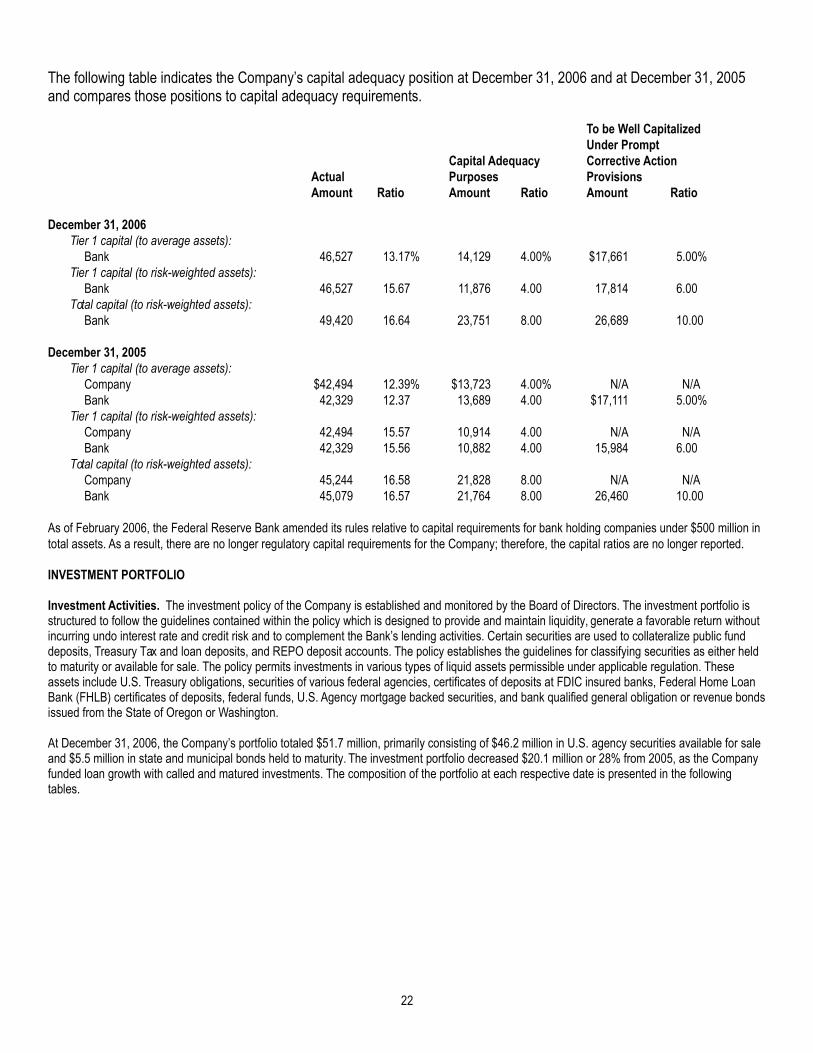
The following table indicates the Company’s capital adequacy position at December 31, 2006 and at December 31, 2005and compares those positions to capital adequacy requirements.
To be Well CapitalizedUnder Prompt
Capital Adequacy Corrective ActionActual Purposes ProvisionsAmount Ratio Amount Ratio Amount Ratio
December 31, 2006Tier 1 capital (to average assets):
Bank 46,527 13.17% 14,129 4.00% $17,661 5.00%Tier 1 capital (to risk-weighted assets):
Bank 46,527 15.67 11,876 4.00 17,814 6.00Total capital (to risk-weighted assets):
Bank 49,420 16.64 23,751 8.00 26,689 10.00
December 31, 2005Tier 1 capital (to average assets):
Company $42,494 12.39% $13,723 4.00% N/A N/ABank 42,329 12.37 13,689 4.00 $17,111 5.00%
Tier 1 capital (to risk-weighted assets):
Company 42,494 15.57 10,914 4.00 N/A N/ABank 42,329 15.56 10,882 4.00 15,984 6.00
Total capital (to risk-weighted assets):
Company 45,244 16.58 21,828 8.00 N/A N/ABank 45,079 16.57 21,764 8.00 26,460 10.00
As of February 2006, the Federal Reserve Bank amended its rules relative to capital requirements for bank holding companies under $500 million intotal assets. As a result, there are no longer regulatory capital requirements for the Company; therefore, the capital ratios are no longer reported.
INVESTMENT PORTFOLIO
Investment Activities. The investment policy of the Company is established and monitored by the Board of Directors. The investment portfolio isstructured to follow the guidelines contained within the policy which is designed to provide and maintain liquidity, generate a favorable return withoutincurring undo interest rate and credit risk and to complement the Bank’s lending activities. Certain securities are used to collateralize public funddeposits, Treasury Tax and loan deposits, and REPO deposit accounts. The policy establishes the guidelines for classifying securities as either heldto maturity or available for sale. The policy permits investments in various types of liquid assets permissible under applicable regulation. Theseassets include U.S. Treasury obligations, securities of various federal agencies, certificates of deposits at FDIC insured banks, Federal Home LoanBank (FHLB) certificates of deposits, federal funds, U.S. Agency mortgage backed securities, and bank qualified general obligation or revenue bondsissued from the State of Oregon or Washington.
At December 31, 2006, the Company’s portfolio totaled $51.7 million, primarily consisting of $46.2 million in U.S. agency securities available for saleand $5.5 million in state and municipal bonds held to maturity. The investment portfolio decreased $20.1 million or 28% from 2005, as the Companyfunded loan growth with called and matured investments. The composition of the portfolio at each respective date is presented in the followingtables.
22

At December 31,
2006 2005 2004
CarryingValue
Percent ofTotal
CarryingValue
Percent ofTotal
CarryingValue
Percent ofTotal
(Dollars in thousands)Held-to-Maturity:
State and municipal securities $ 5,462 10.57% $ 7,871 10.97% $ 9,956 12.31%
Available-for-Sale:
U.S. Government agency securities $ 46,204 89.43% $ 63,863 89.03% $ 70,947 87.69%Total Portfolio $ 51,666 100% $ 71,734 100% $ 80,903 100%
The following table sets forth the maturities and weighted average yields of the investment securities in the Company’s investment portfolio atDecember 31, 2006. The average yield shown for obligations of states and political subdivisions is not calculated on a tax-equivalent basis.
Less ThanOne Year
One toFive Years
Five toTen Years
OverTen Years
Amount Yield Amount Yield Amount Yield Amount Yield*(Dollars in thousands)
Held-to-Maturity:
State and municipal securities $ 1,172 4.16% $ 3,331 4.53% $ 959 4.30% -- --
Available-for-Sale:
U.S. Government agencysecurities $ 32,208 4.95% $ 10,817 4.61% $ 2,156 5.28% $ 1,023 5.46%
Total Portfolio $ 33,380 4.92% $ 14,148 4.73% $ 3,115 4.30% $ 1,023 5.46%*Yield information is computed using the effective yield on the security and does not give effect to changes in fair value that are reflected as acomponent of shareholders’ equity.
Lending and Credit Management. Interest on loans is the primary source of income for the Company. Net loans represented 69.7% of total assetsas of December 31, 2006 as compared to 68.1% at December 31, 2005. The Bank’s goal is to serve the credit needs of the communities in which itsoffices are located. The primary focus for lending is small-to-medium sized businesses, professionals, senior citizens, and individuals. The Bankoffers a broad base of loan products. A majority of the Bank’s loans are to customers located within the Bank’s service areas.
Although the risk of non-payment always exists, the type and level of risk changes with different types of loans. The primary source of repayment isthe income generated by a business or by an individual. Loan risk is mitigated by lending to borrowers with proven credit histories and demonstratedability to repay. Collateral provides an additional measure of security. The Bank manages risk in the loan portfolio through its loan policies,underwriting practices and continuing education for the lending professionals it employs.
Concentrations of credit are closely monitored to ensure an acceptable diversification of risk and to help insulate the portfolio from adverse economicconditions. Such factors as economic conditions, liquidity, future outlook and loan demand are considered.
Concentrations are reported quarterly to the board of directors.
Concentrations within the Bank’s loan portfolio (includes funded and unfunded) are defined as:� Loans grouped by a common type of collateral, or product line, in excess of 150% of Bank’s Tier 1 capital, or� Loans grouped by regulatory reporting definitions in excess of 150% of Bank’s Tier 1 capital, or� Loans grouped by industry code (currently SIC codes) in excess of 150% of Bank’s Tier 1 capital, or� Loans of a speculative nature in excess of 100% of Bank’s Tier 1 capital.
23
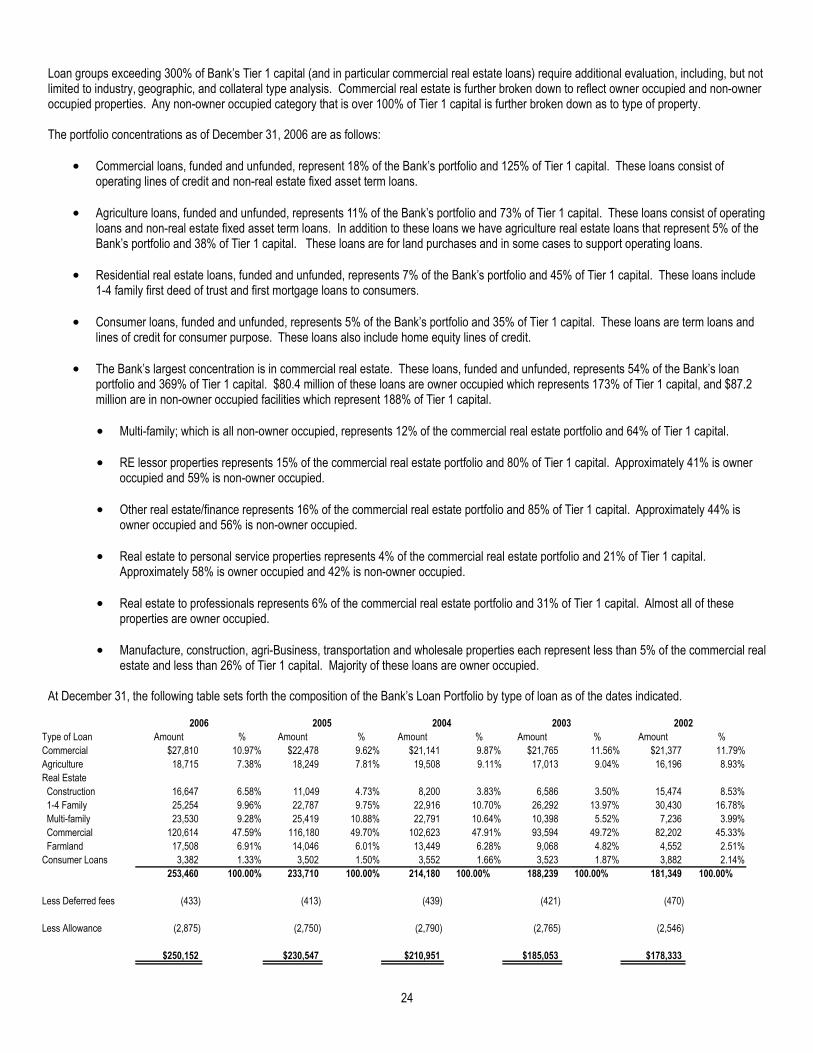
Loan groups exceeding 300% of Bank’s Tier 1 capital (and in particular commercial real estate loans) require additional evaluation, including, but notlimited to industry, geographic, and collateral type analysis. Commercial real estate is further broken down to reflect owner occupied and non-owneroccupied properties. Any non-owner occupied category that is over 100% of Tier 1 capital is further broken down as to type of property.
The portfolio concentrations as of December 31, 2006 are as follows:
� Commercial loans, funded and unfunded, represent 18% of the Bank’s portfolio and 125% of Tier 1 capital. These loans consist ofoperating lines of credit and non-real estate fixed asset term loans.
� Agriculture loans, funded and unfunded, represents 11% of the Bank’s portfolio and 73% of Tier 1 capital. These loans consist of operatingloans and non-real estate fixed asset term loans. In addition to these loans we have agriculture real estate loans that represent 5% of theBank’s portfolio and 38% of Tier 1 capital. These loans are for land purchases and in some cases to support operating loans.
� Residential real estate loans, funded and unfunded, represents 7% of the Bank’s portfolio and 45% of Tier 1 capital. These loans include1-4 family first deed of trust and first mortgage loans to consumers.
� Consumer loans, funded and unfunded, represents 5% of the Bank’s portfolio and 35% of Tier 1 capital. These loans are term loans andlines of credit for consumer purpose. These loans also include home equity lines of credit.
� The Bank’s largest concentration is in commercial real estate. These loans, funded and unfunded, represents 54% of the Bank’s loanportfolio and 369% of Tier 1 capital. $80.4 million of these loans are owner occupied which represents 173% of Tier 1 capital, and $87.2million are in non-owner occupied facilities which represent 188% of Tier 1 capital.
� Multi-family; which is all non-owner occupied, represents 12% of the commercial real estate portfolio and 64% of Tier 1 capital.
� RE lessor properties represents 15% of the commercial real estate portfolio and 80% of Tier 1 capital. Approximately 41% is owneroccupied and 59% is non-owner occupied.
� Other real estate/finance represents 16% of the commercial real estate portfolio and 85% of Tier 1 capital. Approximately 44% isowner occupied and 56% is non-owner occupied.
� Real estate to personal service properties represents 4% of the commercial real estate portfolio and 21% of Tier 1 capital.Approximately 58% is owner occupied and 42% is non-owner occupied.
� Real estate to professionals represents 6% of the commercial real estate portfolio and 31% of Tier 1 capital. Almost all of theseproperties are owner occupied.
� Manufacture, construction, agri-Business, transportation and wholesale properties each represent less than 5% of the commercial realestate and less than 26% of Tier 1 capital. Majority of these loans are owner occupied.
At December 31, the following table sets forth the composition of the Bank’s Loan Portfolio by type of loan as of the dates indicated.
24
TypeofLoan Amount % Amount % Amount % Amount % Amount %
Commercial 27,810$ 10.97% 22,478$ 9.62% 21,141$ 9.87% 21,765$ 11.56% 21,377$ 11.79%
Agriculture 18,715 7.38% 18,249 7.81% 19,508 9.11% 17,013 9.04% 16,196 8.93%
Real Estate
Construction 16,647 6.58% 11,049 4.73% 8,200 3.83% 6,586 3.50% 15,474 8.53%
1-4Family 25,254 9.96% 22,787 9.75% 22,916 10.70% 26,292 13.97% 30,430 16.78%
Multi-family 23,530 9.28% 25,419 10.88% 22,791 10.64% 10,398 5.52% 7,236 3.99%
Commercial 120,614 47.59% 116,180 49.70% 102,623 47.91% 93,594 49.72% 82,202 45.33%
Farmland 17,508 6.91% 14,046 6.01% 13,449 6.28% 9,068 4.82% 4,552 2.51%
Consumer Loans 3,382 1.33% 3,502 1.50% 3,552 1.66% 3,523 1.87% 3,882 2.14%
253,460 100.00% 233,710 100.00% 214,180 100.00% 188,239 100.00% 181,349 100.00%
LessDeferred fees (433) (413) (439) (421) (470)
LessAllowance (2,875) (2,750) (2,790) (2,765) (2,546)
250,152$ 230,547$ 210,951$ 185,053$ 178,333$
200220042006 2005 2003���� ���� ���� ���� ����
������������ ������ ��������� ������ ��������� ������ ������ ������ ������ ������ ������
���������� ��������� ������ ��������� ����� ��������� ����� ��������� ������ ��������� ������
����������� �������� ����� �������� ����� �������� ����� �������� ����� �������� �����
�����������
�������������� �������� ����� �������� ����� ������� ����� ������� ����� �������� �����
������������ �������� ����� �������� ����� �������� ������ �������� ������ �������� ������
�������������� �������� ����� �������� ������ �������� ������ �������� ����� ������� �����
������������ ��������� ������ ��������� ������ ��������� ������ �������� ������ �������� ������
���������� �������� ����� �������� ����� �������� ����� ������� ����� ������� �����
�������������� ������� ����� ������� ����� ������� ����� ������� ����� ������� �����
��������� ������� ��������� ������� ��������� ������� ��������� ������� ��������� �������
������������������ ������ ������ ������ ������ ������
�������������� �������� �������� �������� �������� ��������
���������� ���������� ���������� ���������� ����������
Interest income on loans is accrued daily on the principal balance outstanding. Generally, no interest is accrued on loans deemed to beuncollectible, or when the principal or interest payment becomes 90 days past due, unless the loan is well-secured and in the process of collection.At December 31, 2006 the Bank had two loans of approximately $187 thousand that was 90 days or more past due and still accruing interest.Management anticipates these loans to be current in early 2007.
The following table shows the contractual maturity of the Bank’s gross loans at December 31, 2006. Loans having no stated schedule of repaymentsand no stated maturity, demand loans, and overdrafts are reported as due in one year or less. Loan balances do not include undisbursed loanproceeds, deferred loan fees and discounts, and allowance for losses on loans. The table does not reflect any estimate of prepayments, whichsignificantly shorten the average life of all loans and may cause the Bank’s actual repayment experience to differ from that shown below.
The following table sets forth the dollar amount of all loans due one year or more after December 31, 2006, which have fixed interest rates and havefloating or adjustable interest rates.
Credit Loss Allowance and Provision. The allowance for credit losses has been established to absorb losses inherent in the loan portfolio and isbased on continuing quarterly assessments of the estimated probable losses. The Company uses several key factors for assessing theappropriateness of the allowance. The key factors used are:
� The use of formulas for calculating the allowance� Specific allowances for identified problem loans� Subjective calculations
Subjective calculations take into consideration such factors as:� Existing economic and business conditions effecting our market areas� Loan growth and concentrations� Credit quality trends� Recent loss experience� Specific industry conditions in particular segments of the portfolio� Interest rate environment� Duration of the current business cycle
25
After 1 year, After 5 years,
Within 1 year but before but before After 10 years Total
5 years 10 years
Commercial 9,087$ 14,574$ 2,413$ 1,736$ 27,810$
Agriculture 14,904 3,420 391 -- 18,715
Real Estate
Construction 6,265 5,603 -- 4,779 16,647
1-4Family 3,034 3,085 4,102 15,033 25,254
Multi-family -- 5,209 8,448 9,873 23,530
Commercial 5,739 5,106 33,124 76,645 120,614
Farmland 5,050 2,126 1,674 8,658 17,508
Consumer Loans 273 2,971 138 -- 3,382
TOTAL 44,352$ 42,094$ 50,290$ 116,724$ 253,460$
(In Thousands)
Floatingor
FixedRates AdjustableRates Total
Commercial 13,031$ 5,692$ 18,723$
Agriculture 2,327 1,484 3,811
Real Estate
Construction 248 10,134 10,382
1-4Family 11,218 11,002 22,220
Multi-family 8,850 14,680 23,530
Commercial 25,970 88,905 114,875
Farmland 1,635 10,823 12,458
Consumer Loans 587 2,522 3,109
TOTAL 63,866$ 145,242$ 209,108$
(InThousands)
������������� ��������������
������������� ���������� ���������� �������������� �����
������� ��������
��������������
���������� �������� ��������� �������� �������� ���������
����������� �������� ������� ����� ���� ��������
�����������
�������������� ������� ������� ���� ������� ��������
������������ ������� ������� ������� �������� ��������
�������������� ���� ������� ������� ������� ��������
������������ ������� ������� �������� �������� ���������
���������� ������� ������� ������� ������� ��������
�������������� ����� ������� ����� ���� �������
����� ��������� ��������� ��������� ���������� ����������
���������������������� ���������������� �����
������������������������ ��������� �������� �������������������� ������� ������� �������������������������������� ����� �������� �������������������� �������� �������� ���������������������� ������� �������� �������������������� �������� �������� ������������������� ������� �������� ���������������������� ����� ������� ������������ ��������� ���������� ����������

� Bank regulatory examination results� Internal and external loan examinations
The evaluation of each factor and the overall allowance is based on a continuing assessment of problem loans, historical loss experience, and otherfactors, including regulatory and economic. The Bank considers historical charge-off levels in addition to existing economic conditions and otherfactors when establishing the allowance for loan losses.
It is Bank policy that once each quarter, Bank management makes recommendations to the Board regarding the adequacy of the Bank’s allowancefor credit losses and any provision necessary to increase or decrease the allowance to the recommended level. Management’s recommendationsare based on an internal loan review process to determine specific potential loss factors on classified loans, risk factor of loan grades, historical lossfactors derived from actual net charge-off experience, trends in non-performing loans, and other potential risks in the loan portfolio such as industryconcentration, the local economy, and the volume of loans.
Management uses a loan grading system wherein loan officers assign a risk grade to each of their loans at inception and at intervals based onreceipt of financial information, renewal, or when there is an indication that a credit may have improved or weakened. The risk grades in the loanportfolio are used in determining a factor that is used in analyzing the adequacy of the allowance for credit losses.
The formula allowance is calculated by applying loss factors to outstanding loans, in each case based on the internal risk grade of those loans orgroups of loans. Changes in risk grades of both performing and nonperforming loans affect the amount of the calculated allowance. Loss factors arebased on the Bank’s historical loss experience and other pertinent data and may be adjusted for significant factors that, in management’s judgment,affect the collectability of the portfolio as of the evaluation date.
Specific allowances are established where management has identified significant conditions or circumstances related to a credit that managementbelieves indicate the probability that a loss may be incurred in an amount different from the amount calculated by the formula method. At December31, 2006, the Bank’s allowance for credit losses was $2.9 million, or 1.14% of total loans, and 177% of total non-performing assets, compared withan allowance for credit losses at December 31, 2005 of $2.8 million, or 1.18% of total loans, and 125% of non-performing assets. It is the opinion ofmanagement that the allowance for credit losses at December 31, 2006 of $2.9 million is adequate.
The Bank’s allowance incorporates the results of measuring impaired loans as provided in the Statement of Financial Accounting Standards (“SFAS”)No. 114, “Accounting by Creditors for Impairment of a Loan”, and SFAS No. 118, “Accounting by Creditors for Impairment of a Loan-IncomeRecognition and Disclosures”. These accounting standards prescribe the measurement, income recognition and guidelines concerning impairedloans.
During the Bank’s regular loan review procedures, a loan is considered to be impaired when it is probable that it will be unable to collect all amountsdue according to contractual terms of the loan agreement. A loan is usually not considered to be impaired during a period of minimal delay. Suchperiod is generally defined as less than 90 days past due. Impaired loans are measured based on the present value of expected future cash flows,discounted at the loan’s effective interest rate, or as a practical expedient, at the loan’s observable market price or the fair market value of collateral ifthe collateral is dependent. Impaired loans are currently measured at the lower of cost or fair value. Impaired loans are charged to the allowancewhen management believes, following collection efforts and collateral position, that the borrower’s financial condition is such that collection ofprincipal is not probable. Management continues to pursue collection after a loan is charged off until all possibilities for collection have beenexhausted. Impaired loans totaled $1,436,000, $2,073,000, and $6,190,000 at December 31, 2006, 2005 and 2004, respectively. (See Note 4 to theconsolidated financial statements for more information on impaired loans.)
The following table represents the composition of the allowance for credit loss at December 31:
% of Total % ofTotal % ofTotal
Amount Amount Amount Amount Amount
Commercial $315 11% $279 10% $275 10% $320 12% $299 12%
Agriculture 212 7% 227 8% 254 9% 250 9% 227 9%
Real Estate
Construction 189 7% 138 5% 108 4% 96 3% 217 9%
1-4 Family 286 10% 208 9% 236 11% 320 12% 325 13%
Multifamily 267 9% 235 11% 297 11% 153 5% 101 4%
Commercial 1,368 48% 1,446 50% 1338 48% 1,374 50% 1,158 45%
Farmland 199 7% 175 6% 174 6% 133 5% 64 2%
Consumer 39 1% 42 1% 108 1% 119 4% 155 6%
$2,875 100% $2,750 100% $2,790 100% $2,765 100% $2,546 100%
2004 2003 2002
% ofTotal
Loans
% ofTotal
Loans
2006 2005
26
���� ���� ���� ���� ����
������ ������ ������ ������ ������
���������� ���� ��� ���� ��� ���� ��� ���� ��� ���� ���
����������� ��� �� ��� �� ��� �� ��� �� ��� ��
�����������
������������ ��� �� ��� �� ��� �� �� �� ��� ��
���������� ��� ��� ��� �� ��� ��� ��� ��� ��� ���
����������� ��� �� ��� ��� ��� ��� ��� �� ��� ��
���������� ����� ��� ����� ��� ���� ��� ����� ��� ����� ���
�������� ��� �� ��� �� ��� �� ��� �� �� ��
�������� �� �� �� �� ��� �� ��� �� ��� ��
������ ���� ������ ���� ������ ���� ������ ���� ������ ����
� �� ����������
� �� ����������
� �� ����������
� �� ����������
� �� ����������

The following table represents information with respect to non-performing loans and other assets at December 31:
2006 2005 2004 2003 2002
Loans on non-accrual status $1,436 $2,073 $6,190 $2,164 $130
Accruing loans past due greater than 90 days 187 122 0 12 0
Total non-performing loans 1,623 2,195 6,190 2,176 130
Foreclosed real estate -- -- -- 476 --
Total non-performing assets $1,623 $2,195 $6,190 $2,652 $130
Allowance for credit losses $2,875 $2,750 $2,790 $2,765 $2,546
Allowance for credit losses/non-performing assets 177% 125% 45% 104% 1958%
Non-performing loans/total loans 0.64% 0.94% 2.90% 1.16% 0.07%
Non-performing assets/total assets 0.45% 0.65% 1.85% 0.81% 0.04%
The Company has a policy that places loans on nonaccrual status after they become 90 days past due unless the loan is well secured and in theprocess of collection. The Company may place loans that are not contractually past due or that are fully collateralized on nonaccrual status as amanagement tool to actively oversee specific loans. Loans on nonaccrual status at December 31, 2006 were approximately $1.4 million, $2.1 millionat December 31, 2005, and $6.2 million at December 31, 2004. For the year ending December 31, 2006, the gross income that would have beenincluded in loan interest income, was approximately $414 thousand had non-accrual loans been current in their original terms and outstandingthroughout the period. There was no interest on non-accrual loans included in income for the years ending 2006, 2005, and 2004.
Two agricultural loan relationships constitute $1.3 million of the $1.4 million in non-accrual status as of December 31, 2006. One of the agricultureloans, with a balance of about $292 thousand, is fully secured by real estate. The farm operation is going through a Chapter 12 bankruptcyprocedure. The Company is fully secured and does not expect a loss. The second agriculture relationship consists of two loans; one in the amount ofapproximately $625 thousand which is fully secured by agriculture real estate and the other loan is approximately $426 thousand has a 90% FarmService Agency (FSA) guarantee, but no other collateral support. The Company is exposed on the second loan in the amount of $42 thousand, butexpects to get paid in full over the next 18 to 24 months through normal farming operating cash flow. The remaining $93 thousand in non-accrual is aloan on a residential house that is adequately secured by real estate and a foreclosure sale has been set for April 30, 2007. The Company expectsno loss on this transaction.
The Company is not aware of any loans continuing to accrue interest at December 31, 2006 that represent or result from trends or uncertaintieswhich management reasonably expects will materially impact future operating results, liquidity, or capital resources. Material credits about whichmanagement is aware of any information that would raise serious doubts as to the ability of such borrowers to comply with the loan repayment terms,have been fully reserved in the allowance for credit losses.
Applicable regulations require that each bank review and classify its assets on a regular basis. In addition, in connection with examinations of banks,regulatory examiners have authority to identify problem assets and, if appropriate, require them to be classified. There are three classifications forproblem assets: substandard, doubtful and loss. Substandard assets have one or more defined weaknesses and are characterized by the distinctpossibility that the bank will sustain some loss if the deficiencies are not corrected. Doubtful assets have the weaknesses of substandard assets withthe additional characteristic that the weaknesses make collection or liquidation in full on the basis of currently existing facts, conditions and valuesquestionable, and there is a high possibility of loss. An asset classified as loss is considered uncollectible and of such little value that continuance asan asset of the bank is not warranted. When a bank classifies problem assets as either substandard or doubtful, it is required to establish generalallowances for credit losses in an amount deemed prudent by management. These allowances represent loss allowances which have beenestablished to recognize the inherent risk associated with lending activities and the risks associated with particular problem assets. When a bankclassifies problem assets as loss, it charges off the balance of the asset against the allowance for credit losses. Assets which do not currentlyexpose the bank to sufficient risk to warrant classification in one of the aforementioned categories but possess weaknesses are required to bedesignated as special mention. The Bank's determination as to the classification of its assets and the amount of its valuation allowances is subject toreview by the FDIC and the State Banking Division which can order the establishment of additional loss allowances.
27
���� ���� ���� ���� ����
��������������������������� ������ ������ ������ ������ ����
�������������������������������������������� ��� ��� � �� �
�������������������������� ����� ����� ����� ����� ���
���������������������� �� �� �� ��� ��
��������������������������� ������ ������ ������ ������ ����
��������������������������� ������ ������ ������ ������ ������
������������������������������������������������� ���� ���� ��� ���� �����
�������������������������������� ����� ����� ����� ����� �����
���������������������������������� ����� ����� ����� ����� �����

The aggregate amounts of the Bank's classified loans (as determined by the Bank), and of the Bank's allowances for credit losses at the datesindicated, were as follows at December 31:
2006 2005 2004 2003 2002
Loss $��� � �� -- $��� � �� -- $��� � �� -- $ ��� ��� -- $ ��� ��� --
Doubtful $��� � �� -- $��� � �� -- $��� � �� -- $ ��� ��� -- $ ��� ��� --
Substandard $2,234 $1,898 $2,003 $2,382 $2,133
Special mention $2,171 $3,238 $6,740 $6,990 $7,161
Total $4,405 $5,136 $8,743 $9,372 $9,294
Allowance for credit losses $2,875 $2,750 $2,790 $2,765 $2,546
(In thousands)
The Bank's classified assets decreased by $.8 million at December 31, 2006, primarily as a result of a $336 thousand increase in loans classified assubstandard and a $1.1 million decrease in loans classified as special mention.
Special Mention loans are loans that are currently protected, but have the potential to deteriorate to a Substandard rating. The borrower’s financialperformance many be inconsistent or below forecast, creating the possibility of liquidity problems and shrinking debt service coverage. The primarysource of repayment is still good but there is increasing reliance on collateral or guarantor support. Collectability of the loan is not yet in jeopardy, butthere is concern about the timeliness of repayment. Assets in this category are not adversely classified and currently do not expose the Bank tosufficient risk to warrant a substandard classification.
Substandard loans are unacceptable business or individual loans with the normal repayment in jeopardy. The loans are inadequately protected bythe current sound worth and paying capacity of the obligor or of the collateral pledged, if any. There are well defined weaknesses that jeopardize therepayment of the debt.
28
���� ���� ���� ���� ����
��������������
����
��������
����������� ������ ������ ������ ������ ������
��������������� ������ ������ ������ ������ ������
����� ������ ������ ������ ������ ������
��������������������������� ������ ������ ������ ������ ������
���� � �� �� ���� � �� �� ���� � �� �� � ��� ��� �� � ��� ��� ��
���� � �� �� ���� � �� �� ���� � �� �� � ��� ��� �� � ��� ��� ��

The following table summarizes transactions in the allowance for credit losses and details the charge-offs, recoveries, and net credit losses by loancategory for the last five years.
2006 2005 2004 2003 2002
Allowance At Beginning of Period: $2,750 $2,790 $2,765 $2,546 $2,146
Provision for Credit Losses 145 155 142 270 624
Commercial 0 94 39 15 105
Agriculture 0 0 0 0 0
Real Estate 0 0 0 0 0
Construction 0 0 0 0 0
1-4 Family 0 97 0 22 76
Multi-family 0 0 52 0 0
Commercial 0 0 0 0 0
Farmland 0 0 0 0 0
Other 0 0 0 0 0
Consumer 24 11 26 17 56
Total Charge-Offs: $24 $202 $117 $54 $237
Commercial 0 7 0 1 6
Agriculture 0 0 0 0 0
Real Estate 0 0 0 0 0
Construction 0 0 0 0 0
1-4 Family 0 0 0 0 6
Multi-family 0 0 0 0 0
Commercial 0 0 0 0 0
Farmland 0 0 0 0 0
Other 0 0 0 0 0
Consumer 4 0 0 2 1
Total Recoveries $4 $7 $0 $3 $13
Net Recoveries (Charge-Offs) <20> <195> <117> <51> <224>
Balance At
End Of Period $2,875 $2,750 $2,790 $2,765 $2,546
0.01% 0.08% 0.06% 0.03% 0.13%
CHARGE-OFFS:
RECOVERIES:
Ratio of Net Charge-Offs to Avg. Loans
Outstanding
(In Thousands)
ITEM 7A. QUANTITATIVE AND QUALITATIVE DISCLOSURES ABOUT MARKET RISK
Asset-Liability Management and Interest Rate Sensitivity
The Company’s results of operations are largely dependent on its ability to manage net interest income. The principal purpose of asset-liabilitymanagement is to manage the Bank’s sources and uses of funds under various interest rate and economic conditions in order to stabilize net incomeand minimize risk.
The Bank analyzes its interest rate risk by simulation modeling and by traditional interest rate gap analysis. The model analyzes the Bank’s currentposition and anticipated future results based on assumptions and estimations that management deems reasonable, although actual results may varysubstantially.
The main component of asset-liability management is the management of the Bank’s interest rate sensitivity and market risk. Interest-rate sensitivityis defined as the volatility in earnings resulting from changes in interest rates and/or the mismatch of repricing intervals between assets andliabilities. The Bank’s management attempts to manage its assets and liabilities to maximize earnings growth by minimizing the effects of changingmarket rates, asset and liability mix, and prepayment trends. This is a “balanced position” strategy which lessens the volatility in interest income.Management actively manages the relationship between its interest rate sensitive assets and interest rate sensitive liabilities.
If assets and liabilities do not mature or reprice simultaneously, and in equal amounts, a gap is present and exposure to interest rate risk exists. Aninterest rate sensitivity gap occurs when there is a different amount of rate sensitive assets than rate sensitive liabilities scheduled to reprice over thesame period of time. The gap is considered positive when rate sensitive assets exceed rate sensitive liabilities, and negative when rate sensitive
29
���� ���� ���� ���� ����
��������������
��������������������������������� ������ ������ ������ ������ ������
��������������������������� ��� ��� ��� ��� ���
���������������������� � �� �� �� ���
����������� � � � � �
����������� � � � � �
������������ � � � � �
���������� � �� � �� ��
������������ � � �� � �
���������� � � � � �
�������� � � � � �
����� � � � � �
�������� �� �� �� �� ��
������������������ ��� ���� ���� ��� ����
��������������������� � � � � �
����������� � � � � �
����������� � � � � �
������������ � � � � �
���������� � � � � �
������������ � � � � �
���������� � � � � �
�������� � � � � �
����� � � � � �
�������� � � � � �
���������������� �� �� �� �� ���
���������������������������� ���� ����� ����� ���� �����
�����������
������������� ������ ������ ������ ������ ������
����� ����� ����� ����� ���������� �� �������������� ������� ����������������

liabilities exceed rate sensitive assets. During a period of rising interest rates, a negative gap would generally tend to adversely impact net interestincome while a positive gap would generally tend to result in an increase in net interest income. During a period of declining interest rates, anegative gap would generally tend to result in increased net interest income, while a positive gap would generally tend to adversely affect net interestincome.
The following table sets forth the interest rate sensitivity of the Bank’s assets and liabilities over various contracted repricing periods and maturitiesas of December 31, 2006. Certain shortcomings are inherent in the traditional gap analysis presented in the table. For instance, although certainassets and liabilities may have similar repricing periods or maturities, historically they have been proven to react in different timings and degree tochanges in market interest rates. Additionally, loan repayments and early withdrawals of certificates of deposits could cause the interest sensitivitiesto vary from those which appear in the table. The following table is based on contracted loan repricing periods and maturities where as previous loantables in this document are based only on contracted maturities.
On a straight gap measurement of interest rate sensitivity, the Company is asset sensitive. Using the financial model with historical timings anddegree of market rate change affecting the components of the balance sheet, the Company is slightly asset sensitive. The Company will see littleeffect on its equity in either a rising or declining interest rate environment based on the balance sheet as of December 31, 2006. Managementstrives to maintain a balanced interest sensitivity position.
The Company sensitivity to gains or losses in future earnings due to hypothetical increases or decreases in the Fed Funds rate as measured by itsfinancial model are as follows.
30
DECEMBER 31, 2006 (In thousands)
90 days 1 year 6 years
Within to to to Over 15
90 days 12 months 5 years 15 years Years Total
INTEREST EARNING ASSETS
Interest Bearing Deposits and
Federal Funds Sold 21,049$ -- -- -- -- 21,049$
Loans 65,724 15,773 96,221 51,920 20,514 250,152
Investments 10,981 22,399 14,147 4,139 -- 51,666
TOTAL INTEREST EARNING ASSETS 97,754$ 38,172$ 110,368$ 56,059$ 20,514$ 322,867$
INTEREST BEARING LIABILITIES
Demand Deposits 58,514$ -- -- -- -- 58,514$
NOW, Savings &Money MarketDeposits 171,580 -- -- -- -- 171,580
Time Deposits 16,862 19,106 4,548 -- -- 40,516
REPO'S 35,587 -- -- -- -- 35,587
Other Borrowings 1,902 -- -- -- -- 1,902
TOTAL INTEREST BEARING LIABILITIES 284,445$ 19,106$ 4,548$ -$ -$ 308,099$
(186,691)$ 19,066$ 105,820$ 56,059$ 20,514$ 14,768$
CUMULATIVE INTEREST RATE
SENSITIVITY GAP (186,691)$ (167,625)$ (61,805)$ (5,746)$ 14,768$
CUMMULATIVE GAP AS A PERCENT OF -57.82% -51.92% -19.14% -1.78% 4.57%
TOTAL EARNING ASSETS
Net Interest
Change in Interest Rates Income
- 300 Basis points (1,537)$
- 200 Basis points (1,025)$
-100 Basis points (512)$
+300 Basis points 792$
+200 Basis points 528$
+100 Basis points 264$
������������������������������������� ������
������������������ � �������������������������� � ������������������������� � ����������������������� � ���������������������� � ���������������������� � �����
��������������������������������������� ������ �������
������ �� �� �� �������������� ��������� ������� �������� ����� �����
�����������������������
������������������������������������������������ � ������ �� �� �� �� ������
����� ������ ������ ������ ������ ������ ������������������ ������ ������ ������ ����� �� ������
����������������������������� � ������ � ������ � ������� � ������ � ������ � �������
����������������������������
��������������� � ������ �� �� �� �� ������������������������������������������ ������� �� �� �� �� �������������������� ������ ������ ����� �� �� ������������ ������ �� �� �� �� ���������������������� ����� �� �� �� �� �����
���������������������������������� � ������� � ������ � ����� � ��� � ��� � �������
� ���������� � ������ � ������� � ������ � ������ � ������������������������������
��������������� � ���������� � ���������� � ��������� � �������� � ������
������������������������������� ������� ������� ������� ������ �������������������������

At December 31, 2006, the Company was slightly asset sensitive, meaning that the Company’s net interest margin (“NIM”) may increase slightly ifrates rise and decrease if rates fall. In a rising rate environment, management anticipates that its deposit liability rates will increase at a slower ratedue to the company’s mix of deposits, high liquidity, and pricing strategies, which should result in an increase in NIM. For the year ending December31, 2006, the Company’s cost of funds was 1.7%.
31
Contents
Report of Independent Registered Public Accounting Firm..............................................33
Consolidated Financial Statements
Consolidated Balance Sheets.................................................................................................34
Consolidated Statements of Income........................................................................................35
Consolidated Statements of Shareholders’ Equity..............................................................36-37
Consolidated Statements of Cash Flows............................................................................38-39
Notes to Consolidated Financial Statements......................................................................40-65
Report of Independent Registered Public Accounting Firm
Board of DirectorsCitizens BancorpCorvallis, Oregon
We have audited the consolidated balance sheets of Citizens Bancorp and Subsidiary as of December 31, 2006 and 2005, and therelated consolidated statements of income, shareholders’ equity and cash flows for each of the three years in the period endedDecember 31, 2006. These financial statements are the responsibility of the Company's management. Our responsibility is to expressan opinion on these financial statements based on our audits.
We conducted our audits in accordance with the standards of the Public Company Accounting Oversight Board (United States). Thosestandards require that we plan and perform the audit to obtain reasonable assurance about whether the financial statements are free ofmaterial misstatement. An audit includes examining, on a test basis, evidence supporting the amounts and disclosures in the financialstatements. An audit also includes assessing the accounting principles used and significant estimates made by management, as wellas evaluating the overall financial statement presentation. We believe that our audits provide a reasonable basis for our opinion.
In our opinion, the consolidated financial statements referred to above present fairly, in all material respects, the financial position ofCitizens Bancorp and Subsidiary as of December 31, 2006 and 2005, and the results of their operations and their cash flows foreach of the three years in the period ended December 31, 2006, in conformity with U.S. generally accepted accounting principles.
As discussed in Note 1 to the financial statements, the Bank adopted the provisions of the Financial Accounting Standards Board’sStatement of Financial Accounting Standards No. 123 (revised 2004), Share-Based Payment, in fiscal year 2006.
Seattle, WashingtonMarch 19, 2007
33

Consolidated Balance Sheets
(Dollars in Thousands)
Citizens Bancorp and SubsidiaryDecember 31, 2006 and 2005
2006 2005
Assets
Cash and due from banks $17,227 $18,518
Interest bearing deposits in banks 11,709 166Federal funds sold 9,340 435
Securities available for sale 46,204 63,863
Securities held to maturity (fair value $5,542 and $8,012) 5,462 7,871
Federal Home Loan Bank stock, at cost 905 905
Loans held for sale 53 548
Loans 253,027 233,297
Allowance for credit losses 2,875 2,750
Net loans 250,152 230,547
Premises and equipment 8,439 7,455
Accrued interest receivable 2,112 1,852
Cash value of life insurance 4,416 4,257
Other assets 3,010 2,483
Total assets $359,029 $338,900
Liabilities and Shareholders’ Equity
Liabilities
Deposits:
Demand, non-interest bearing $58,514 $56,608
Savings and interest-bearing demand 171,580 159,678
Time 40,516 37,797
Total deposits 270,610 254,083
Short-term borrowings 37,489 38,468
Accrued interest payable 100 62
Other liabilities 4,306 3,991
Total liabilities 312,505 296,604
Commitments and Contingencies - - - -
Shareholders’ Equity
Common stock (no par value); authorized 10,000,000 shares;
issued and outstanding: 2006 4,733,644 shares; 2005 4,670,386 shares 30,027 28,938
Retained earnings 16,604 13,606
Accumulated other comprehensive income (loss) (107) (248)
Total shareholders’ equity 46,524 42,296
Total liabilities and shareholders’ equity $359,029 $338,900
See notes to consolidated financial statements.
34

Consolidated Statements of Income
(Dollars in Thousands, Except Per Share Amounts)
Citizens Bancorp and SubsidiaryYears Ended December 31, 2006, 2005 and 2004
2006 2005 2004
Interest and Dividend IncomeLoans $ 18,687 $ 16,411 $ 13,142Federal funds sold and deposits in banks 309 75 114Securities:Taxable 2,252 1,622 1,665Tax-exempt 282 356 417
Other 14 4 3Total interest and dividend income 21,544 18,468 15,341
Interest ExpenseDeposits 3,885 2,011 964Short-term borrowings 1,203 1,006 703Total interest expense 5,088 3,017 1,667
Net interest income 16,456 15,451 13,674
Provision for Credit Losses 145 155 142
Net interest income after provision for credit losses 16,311 15,296 13,532
Non-Interest IncomeService charges on deposit accounts 1,258 1,438 1,707Gains on sales of securities available for sale, net -- -- 24Earnings on life insurance policies 159 156 164BankCard income 455 1,715 1,719Mortgage department income 52 96 89Gain on sale of assets -- 92 291Other 551 389 434Total non-interest income 2,475 3,886 4,428
Non-Interest ExpenseSalaries and employee benefits 6,846 6,606 6,435Occupancy 838 803 854Furniture and equipment 567 590 609BankCard expense 77 1,332 1,378Other 2,058 1,823 1,923Total non-interest expense 10,386 11,154 11,199
Income before income taxes 8,400 8,028 6,761
Income Taxes 2,941 2,701 2,409
Net income $5,459 $5,327 $4,352
Earnings Per ShareBasic $1.15 $1.12 $0.94Diluted 1.15 1.11 0.94
See notes to consolidated financial statements.
35
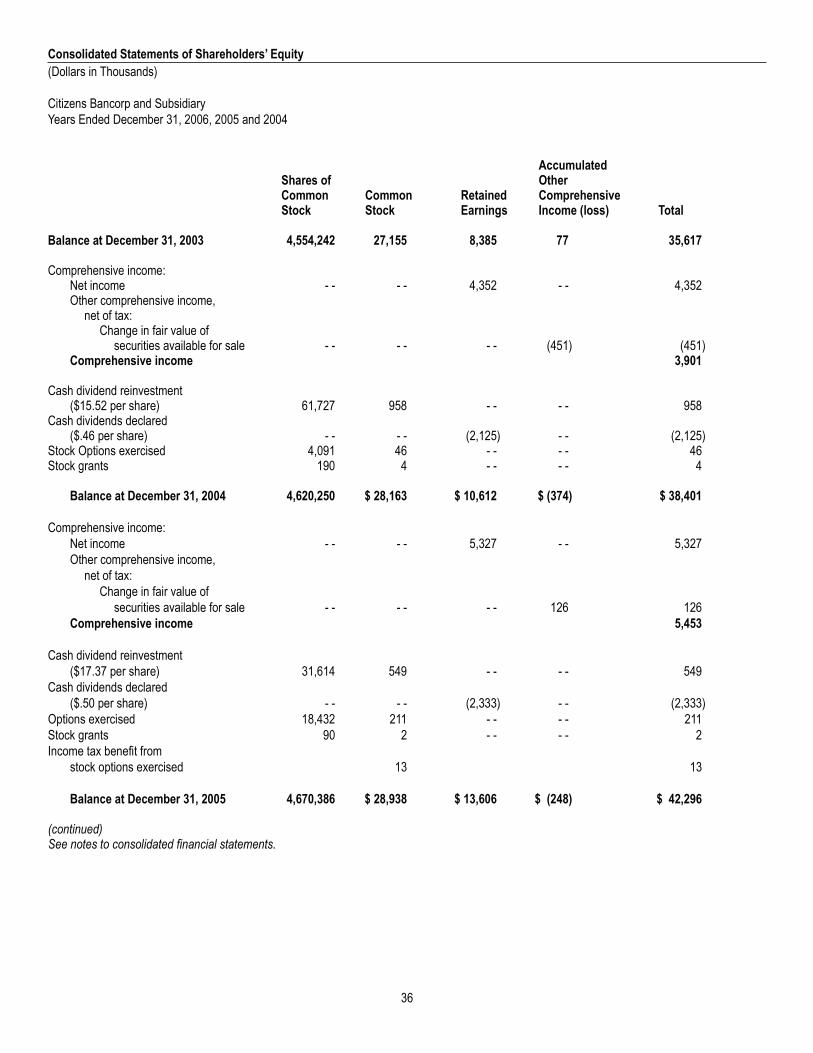
Consolidated Statements of Shareholders’ Equity
(Dollars in Thousands)
Citizens Bancorp and SubsidiaryYears Ended December 31, 2006, 2005 and 2004
AccumulatedShares of OtherCommon Common Retained ComprehensiveStock Stock Earnings Income (loss) Total
Balance at December 31, 2003 4,554,242 27,155 8,385 77 35,617
Comprehensive income:Net income - - - - 4,352 - - 4,352Other comprehensive income,
net of tax:Change in fair value of
securities available for sale - - - - - - (451) (451)Comprehensive income 3,901
Cash dividend reinvestment($15.52 per share) 61,727 958 - - - - 958
Cash dividends declared($.46 per share) - - - - (2,125) - - (2,125)
Stock Options exercised 4,091 46 - - - - 46Stock grants 190 4 - - - - 4
Balance at December 31, 2004 4,620,250 $ 28,163 $ 10,612 $ (374) $ 38,401
Comprehensive income:Net income - - - - 5,327 - - 5,327Other comprehensive income,
net of tax:Change in fair value of
securities available for sale - - - - - - 126 126Comprehensive income 5,453
Cash dividend reinvestment($17.37 per share) 31,614 549 - - - - 549
Cash dividends declared($.50 per share) - - - - (2,333) - - (2,333)
Options exercised 18,432 211 - - - - 211Stock grants 90 2 - - - - 2Income tax benefit from
stock options exercised 13 13
Balance at December 31, 2005 4,670,386 $ 28,938 $ 13,606 $ (248) $ 42,296
(continued)See notes to consolidated financial statements.
36

Consolidated Statements of Shareholders’ Equity
(concluded) (Dollars in Thousands)
Citizens Bancorp and SubsidiaryYears Ended December 31, 2006, 2005 and 2004
AccumulatedShares of OtherCommon Common Retained ComprehensiveStock Stock Earnings Income (loss) Total
Balance at December 31, 2005 4,670,386 $ 28,938 $ 13,606 $ (248) $ 42,296
Comprehensive income:Net income - - - - 5,459 - - 5,459Other comprehensive income,
net of tax:Change in fair value of
securities available for sale - - - - - - 141 141Comprehensive income 5,600
Cash dividend reinvestment($17.35 per share) 64,951 1,127 - - - - 1,127
Cash dividends declared($.52 per share) - - - - (2,461) - - (2,461)
Stock repurchased (21,640) (353) - - - - (353)Options exercised 19,827 243 - - - - 243Stock grants 120 2 - - - - 2Stock based compensation
recognized in earnings - - 56 - - - - 56Income tax benefit from
stock options exercised - - 14 - - - - 14
Balance at December 31, 2006 4,733,644 $ 30,027 $ 16,604 $ (107) $ 46,524
See notes to consolidated financial statements.
37

Consolidated Statements of Cash Flows
(Dollars in Thousands)
Citizens Bancorp and SubsidiaryYears Ended December 31, 2006, 2005 and 2004 2006 2005 2004
Cash Flows from Operating ActivitiesNet income $5,459 $5,327 $4,352Adjustments to reconcile net income to net cashprovided by operating activities:Provision for credit losses 145 155 142Depreciation and amortization 495 498 514Originations of loans held for sale (9,763) (11,971) (13,996)Proceeds of loans held for sale 10,347 11,533 14,120Gain on sales of loans (89) (110) (124)Deferred income tax (benefit) 289 45 100Gains on sales of assets and securities available for sale - - (92) (24)Gains on sales of foreclosed real estate - - - - 50Gain on sale of branch - - - - (291)Earnings on life insurance policies (159) (156) (164)Stock dividends received - - (2) (16)Net (accretion) amortization of bond premium and discount (648) 84 486(Increase) decrease in interest receivable (260) (31) 63Increase (decrease) in interest payable 38 28 (9)Stock based compensation expense 56 - - - -Other - net 24 551 301
Net cash provided by operating activities 5,934 5,859 5,504
Cash Flows from Investing ActivitiesNet (increase) decrease in federal funds sold (8,905) 5,352 (5,787)Net (increase) decrease in interest bearing deposits in banks (11,543) 6,827 (4,812)Activity in securities available for sale:Sales - - - - 30,846Maturities, prepayments and calls 55,500 35,451 46,900Purchases (36,978) (28,258) (69,735)
Activity in securities held to maturity:Maturities, prepayments and calls 2,425 2,100 2,420Purchases - - - - (452)
Purchase of Federal Home Loan Bank stock - - (292) (212)Redemption of Federal Home Loan Bank stock - - 14 - -Increase in loans made to customers, net of principal collections (19,762) (19,743) (25,634)
Purchases of premises and equipment (1,493) (436) (667)Proceeds from sales of premises and equipment - - 172 6Investment in state tax credits (715) (648) - -Net cash provided by (used in) investing activities (21,471) 539 (27,127)
Cash Flows from Financing ActivitiesNet increase in deposits 16,527 18,601 33Net increase (decrease) in short-term borrowings (979) (18,691) 5,444Exercise of stock options 243 211 46Cash dividends paid (1,206) (1,576) (1,137)Repurchase of common stock (353) - - - -Tax benefit from stock options exercised 14 13 - -Net cash provided by (used in) financing activities 14,246 (1,442) 4,386
Net increase (decrease) in cash and due from banks (1,291) 4,956 (17,237)
Cash and Due from BanksBeginning of year 18,518 13,562 30,799
End of year $17,227 $18,518 $13,562
(continued)See notes to consolidated financial statements.
38

Consolidated Statements of Cash Flows
(concluded) (Dollars in Thousands)
Citizens Bancorp and SubsidiaryYears Ended December 31, 2006, 2005 and 2004
2006 2005 2004
Supplemental Disclosures of Cash Flow Information
Interest paid $5,050 $2,989 $1,676
Income taxes paid 2,910 2,720 2,385
Supplemental Disclosures of Non-Cash Investing
and Financing Activities
Fair value adjustment of securities available for sale, net of tax $141 $126 ($451)
Dividend reinvestment 1,127 549 958
Financed sale of foreclosed real estate - - - - 394
Stock grants 2 2 4
See notes to consolidated financial statements.
39

Notes to Consolidated Financial Statements
Citizens Bancorp and SubsidiaryDecember 31, 2006 and 2005
Note 1 - Summary of Significant Accounting Policies
Principles of Consolidation
The consolidated financial statements include the accounts of Citizens Bancorp (the Company) and its wholly owned subsidiary, Citizens Bank (theBank). All significant intercompany transactions and balances have been eliminated.
Nature of Operations
The Company is a financial holding company which operates primarily through its subsidiary, the Bank. The Bank operates ten branches located inBenton, Lane, Polk, Yamhill and Linn Counties in western Oregon. The Bank provides loan and deposit services to customers who arepredominately small- and medium-sized businesses in western Oregon.
Interest Bearing Deposits in Banks
Interest bearing deposits in banks are invested on a daily basis and have next day availability.
Consolidated Financial Statement Presentation
The consolidated financial statements have been prepared in accordance with accounting principles generally accepted in the United States ofAmerica and practices within the banking industry. The preparation of consolidated financial statements requires management to make estimatesand assumptions that affect the reported amounts of assets and liabilities, and the disclosure of contingent assets and liabilities, as of the date of thebalance sheet, and the reported amounts of revenues and expenses during the reporting period. Actual results could differ significantly from thoseestimates. Material estimates that are particularly susceptible to significant change in the near term relate to the determination of the allowance forcredit losses and the valuation of deferred tax assets and foreclosed real estate.
Certain prior year amounts have been reclassified, with no change to shareholders’ equity or net income, to conform to the 2006 presentation. Alldollar amounts, except per share information, are stated in thousands.
Bank Owned Life Insurance
The Company has bank-owned life insurance policies (“BOLI”) on certain executives. The Company purchased single premium BOLI policies. Thepremiums are recorded at their cash surrender values. Changes in cash surrender are included in non-interest income.
Securities Available for Sale
Securities available for sale consist of debt securities that the Bank intends to hold for an indefinite period, but not necessarily to maturity. Suchsecurities may be sold to implement the Bank’s asset/liability management strategies and in response to changes in interest rates and similarfactors. Securities available for sale are reported at fair value. Unrealized gains and losses, net of the related deferred tax effect, are reported as anet amount in a separate component of shareholders' equity entitled “accumulated other comprehensive income (loss).” Realized gains and losseson securities available for sale, determined using the specific identification method, are included in earnings. Amortization of premiums andaccretion of discounts are recognized in interest income over the period to maturity.
Securities Held to Maturity
Debt securities for which the Bank has the positive intent and ability to hold to maturity are reported at cost, adjusted for amortization of premiumsand accretion of discounts, which are recognized in interest income over the period to maturity.
Declines in the fair value of individual securities available for sale and held to maturity below their cost that are other than temporary result in write-downs of the individual securities to their fair value. Such write-downs are included in earnings as realized losses.
Federal Home Loan Bank Stock
The Bank’s investment in Federal Home Loan Bank (“FHLB”) stock is carried at cost, which approximates fair value. As a member of the FHLBsystem, the Bank is required to maintain a minimum level of investment in FHLB stock. At December 31, 2006, the Bank met its minimum requiredinvestment. The Bank may request redemption at par value of any FHLB stock in excess of the minimum required investment; however, stockredemptions are at the discretion of the FHLB.
40
Notes to Consolidated Financial Statements
Citizens Bancorp and SubsidiaryDecember 31, 2006 and 2005
Note 1 - Summary of Significant Accounting Policies (continued)
Federal Home Loan Bank Stock (concluded)
The Bank, as a member of the FHLB, has entered into credit arrangements with the FHLB under which authorized borrowings are collateralized bythe Bank’s FHLB stock as well as loans or other instruments which may be pledged. At December 31, 2006 maximum available FHLB borrowingswere $31,104,000. At December 31, 2006 the Bank had no borrowings from the FHLB.
Advertising
Costs for advertising and marketing are expensed as incurred.
Loans Receivable
Loans receivable that management has the intent and ability to hold for the foreseeable future or until maturity or pay-off are reported at theiroutstanding principal balances adjusted for any charge-offs, the allowance for credit losses, and any deferred fees or costs on originated loans, andunamortized premiums or discounts on purchased loans. Loan fees and certain direct loan origination costs are deferred, and the net fee or cost isrecognized as an adjustment to interest income using the interest method.
(continued)
41

Notes to Consolidated Financial Statements
Citizens Bancorp and SubsidiaryDecember 31, 2006 and 2005
Note 1 - Summary of Significant Accounting Policies (continued)
Loans Receivable (concluded)
Because some loans may not be repaid in full, an allowance for credit losses is recorded. An allowance for credit losses is a valuation allowance forprobable incurred credit losses. The allowance for credit losses is increased by a provision for credit losses charged to expense and decreased bycharge-offs (net of recoveries). The allowance is based on ongoing, quarterly assessments of the probable and estimable losses inherent in the loanportfolio. The Company’s methodology for assessing the appropriateness of the allowance consists of several key elements, which include theformula allowance and specific allowances.
The formula portion of the general credit loss allowance is established by applying a loss percentage factor to the different loan types. Theallowances are provided based on Management’s continuing evaluation of the pertinent factors underlying the quality of the loan portfolio, includingchanges in the size and composition of the loan portfolio, actual loan loss experience, current economic conditions, geographic concentrations,seasoning of the loan portfolio, specific industry conditions, and the duration of the current business cycle. The recovery of the carrying value ofloans is susceptible to future market conditions beyond the Company’s control, which may result in losses or recoveries differing from thoseprovided. Specific allowances are established in cases where Management has identified significant conditions or circumstances related to a loanthat Management believes indicate the probability that a loss has been incurred. Impaired loans consist of loans receivable that are not expected tobe repaid in accordance with their contractual terms and are measured using the fair value of the collateral. Smaller balance loans are excluded fromthis analysis.
The ultimate recovery of all loans is susceptible to future market factors beyond the Company’s control. These factors may result in losses orrecoveries differing significantly from those provided in the consolidated financial statements. In addition, regulatory agencies, as an integral part oftheir examination process, periodically review the Company’s allowance for credit losses, and may require the Company to make additions to theallowance based on their judgment about information available to them at the time of their examinations.
Interest income on loans is accrued over the term of the loans based upon the principal outstanding. The accrual of interest on loans is discontinuedwhen, in management's opinion, the borrower may be unable to meet payments as they become due. When interest accrual is discontinued, allunpaid accrued interest is reversed. Interest income is subsequently recognized only to the extent that cash payments are received until, inmanagement's judgment, the borrower has the ability to make contractual interest and principal payments, in which case the loan is returned toaccrual status.
Mortgage Banking Activities
Mortgage loans originated and intended for sale in the secondary market are reported as loans held for sale and are carried at the lower of cost orestimated market value in the aggregate. Net unrealized losses are recognized in a valuation allowance by charges to income.
All loans held for sale are sold into the secondary market, with the servicing released; accordingly, the Company does not service any third-partyloans.
Foreclosed Real Estate
Real estate properties acquired through, or in lieu of, foreclosure are to be sold and are initially recorded at the lower of cost or fair value of theproperties less estimated costs of disposal. Any write-down to fair value at the time of transfer to foreclosed real estate is charged to the allowancefor credit losses. Properties are evaluated regularly to ensure that the recorded amounts are supported by their current fair values. Any subsequentreductions in carrying values are charged to income.
Transfers of Financial Assets
Transfers of financial assets are accounted for as sales when control over the assets has been surrendered. Control over transferred assets isdeemed to be surrendered when (1) the assets have been isolated from the Company, (2) the transferee obtains the right (free of conditions thatconstrain it from taking advantage of that right) to pledge or exchange the transferred assets, and (3) the Company does not maintain effectivecontrol over the transferred assets through an agreement to repurchase them before their maturity.
(continued)
42
Notes to Consolidated Financial Statements
Citizens Bancorp and SubsidiaryDecember 31, 2006 and 2005
Note 1 - Summary of Significant Accounting Policies (continued)
Premises and Equipment
Premises and equipment are stated at cost less accumulated depreciation, which is computed on the straight-line method over the estimated usefullives of the assets which range from three to thirty-nine years. Leasehold improvements are amortized over the term of the lease or the estimateduseful life of the improvement, whichever is less. Gains or losses on dispositions are reflected in earnings.
Assets are reviewed for impairment when events indicate that their carrying value may not be recoverable. If management determines impairmentexits, the assets are reduced with an offsetting charge to expense.
Income Taxes
Deferred tax assets and liabilities result from differences between the financial statement carrying amounts and the tax bases of assets andliabilities, and are reflected at currently enacted income tax rates applicable to the period in which the deferred tax assets or liabilities are expectedto be realized or settled. Deferred tax assets are reduced by a valuation allowance when, in the opinion of management, it is more likely than notthat some portion or all of the deferred tax assets will not be realized. As changes in tax laws or rates are enacted, deferred tax assets and liabilitiesare adjusted through the provision for income taxes.
Cash Equivalents and Cash Flows
For purposes of presentation in the consolidated statements of cash flows, cash and cash equivalents are defined as those amounts included in thebalance sheet caption “Cash and due from banks.” Cash flows from interest bearing deposits in banks, loans, deposits, and short-term borrowingsare reported net.
The Company maintains its cash in depository institution accounts which, at times, may exceed federally insured limits. The Company has notexperienced any losses in such accounts.
Fair Value of Financial Instruments
The following methods and assumptions were used by the Company in estimating the fair value of financial instruments disclosed in theseconsolidated financial statements:
Cash and Due From Banks, Interest Bearing Deposits in Banks and Federal Funds SoldThe carrying amounts of cash, interest bearing deposits in banks, and federal funds sold approximate their fair value.
Securities Available for Sale and Held to MaturityFair values for securities are based on quoted market prices.
Federal Home Loan Bank StockThe carrying value of Federal Home Loan Bank stock approximates its fair value.
LoansFor variable rate loans that reprice frequently and have no significant change in credit risk, fair values are based on carrying values. Fairvalues for fixed rate loans are estimated using discounted cash flow analyses, using interest rates currently being offered for loans withsimilar terms to borrowers of similar credit quality. Fair values for impaired loans are estimated using discounted cash flow analyses orunderlying collateral values, where applicable. Fair values of loans held for sale are based or their estimated market price.
Deposit LiabilitiesThe fair value of deposits with no stated maturity date is included at the amount payable on demand. Fair values for fixed rate certificatesof deposits are estimated using a discounted cash flow calculation based on interest rates currently offered on similar certificates.
(continued)
43

Notes to Consolidated Financial Statements
Citizens Bancorp and SubsidiaryDecember 31, 2006 and 2005
Note 1 - Summary of Significant Accounting Policies (continued)
Fair Value of Financial Instruments (concluded)
Short-Term BorrowingsThe carrying amounts of repurchase agreements and other short-term borrowings maturing within 90 days approximate their fair values.Fair values of other borrowings are estimated using discounted cash flow analyses based on the Company’s current incremental borrowingrates for similar types of borrowing arrangements.
Accrued InterestThe carrying amounts of accrued interest approximate their fair values.
Off-Balance-Sheet InstrumentsThe fair value of commitments to extend credit and standby letters of credit was estimated using the fees currently charged to enter intosimilar agreements, taking into account the remaining terms of the agreements and the present creditworthiness of the customers. Sincethe majority of the Company’s off-balance-sheet instruments consist of non-fee producing, variable-rate commitments, the Company hasdetermined they do not have a distinguishable fair value.
Earnings Per Share
Basic earnings per share exclude dilution and are computed by dividing net income by the weighted average number of common shares outstanding.Diluted earnings per share reflect the potential dilution that could occur if common shares were issued pursuant to the exercise of options under theCompany’s stock option plan. Stock options excluded from the calculation of diluted earnings per share because they are antidilutive, represented34,937 and 37,475 shares in 2006 and 2005, respectively. There were no shares excluded in 2004.
Stock-Based Compensation
In 1999, the Company adopted a qualified incentive stock option plan that allows for grants of incentive stock options to certain employees. The planauthorized a total of 181,460 shares for options. For each stock option grant, the Board of Directors determines and approves option exerciseprices, numbers of options granted, vesting periods and expiration dates. Cash was not used to settle any equity instruments previously granted. TheCompany issues shares from authorized but unissued shares upon the exercise of stock options. The Company does not currently expect torepurchase shares from any source to satisfy such obligations under its stock option plan.
On January 1, 2006, the Company adopted Financial Accounting Standards Board (“FASB”) Statement of Financial Accounting Standards (“SFAS”)No. 123 (Revised 2004) that requires the measurement and recognition of compensation expense for all stock-based payment awards made toemployees and directors.
SFAS No. 123(R) supersedes the Company’s previous accounting under the provisions of SFAS No. 123, Accounting for Stock-BasedCompensation. As permitted by SFAS No. 123, the Company measured compensation cost for options in accordance with Accounting PrinciplesBoard Opinion (APB) No. 25, “Accounting for Stock Issued to Employees” and related interpretations. Accordingly, no accounting recognition wasgiven to these prior stock options granted at fair market value until they were exercised. Upon exercise, net proceeds, including tax benefitsrealized, were credited to equity.
SFAS No. 123(R) requires companies to estimate the fair value of stock-based payment awards on the date of grant using an option-pricing model.The value of the portion of the award that is ultimately expected to vest is recognized as expense over the requisite service periods in the Company’sconsolidated statement of income. The Company has adopted the accelerated method for graded vested options which recognizes compensationexpense for each vesting tranche over its vesting period.
The Company uses the Black-Scholes option-pricing model to value stock options. The Black-Scholes model requires the use of employee exercisebehavior data and the use of a number of assumptions including volatility of the Company’s stock price, dividend yield, weighted average risk-freeinterest rate, and weighted average expected life of the options. There were no options granted during the periods ended December 31, 2006 and2005.
(continued)
44

Notes to Consolidated Financial Statements
Citizens Bancorp and SubsidiaryDecember 31, 2006 and 2005
Note 1 - Summary of Significant Accounting Policies (continued)
Stock-Based Compensation (concluded)
The Company adopted SFAS No. 123(R) using the modified prospective transition method, which requires adoption as of January 1, 2006, the firstday of the Company’s 2006 fiscal year. In accordance with the modified prospective transition method, the Company’s consolidated financialstatements for prior periods have not been restated to reflect, and do not include, the impact of SFAS No. 123(R). Stock-based compensationexpense recognized under SFAS No. 123(R) for the period ended December 31, 2006 totaled $56 thousand, no tax benefit was realized, and relatedto currently vesting employee stock options that were granted in prior years. At December 31, 2006, unrecognized stock-based compensationtotaled $26 thousand. These costs are expected to be recognized over a weighted average period of 14 months.
As required under SFAS 123(R), the reported net income and earnings per share for the periods ended December 31, 2005 and 2004 have beenpresented below to reflect the impact had the Company been required to recognize compensation cost based on the fair value at the grant date forstock options. The pro forma amounts are as follows.
(dollars in thousands except per share amounts) 2005 2004
Net income, as reported $ 5,327 $ 4,352Less total stock-based employee compensation
expense determined under fair value basedmethods for all qualifying awards (129) (183)
Pro forma net income $ 5,198 $ 4,169
Earnings per share:Basic – as reported $ 1.12 $ 0.94Basic – pro forma $ 1.10 $ 0.90Diluted – as reported $ 1.11 $ 0.94Diluted – pro forma $ 1.09 $ 0.90
The Company’s stock compensation plan is more fully described in Note 13.
New Accounting Pronouncements
In July 2006, the Financial Accounting Standards Board (“FASB”) issued FASB Interpretation No. 48 (“FIN 48”), “Accounting for Uncertainty inIncome Taxes – an Interpretation of FASB Statement No. 109”. FIN 48 prescribes a comprehensive model for how a company should recognize,measure, present and disclose in its financial statements uncertain tax positions that it has taken or expects to take on a tax return. FIN 48 iseffective beginning in the first quarter of fiscal year 2007. Management has determined that the provisions of FIN 48 will not materially impact theCompany’s result of operations or financial condition.
In September 2006, the FASB issued SFAS No. 157, “Fair Value Measurements”. This Statement defines fair value, establishes a framework formeasuring fair value, and expands disclosures about fair value measurements. It clarifies that fair value is the price that would be received to sell anasset or paid to transfer a liability in an orderly transaction between market participants in the market in which the reporting entity transacts. ThisStatement does not require any new fair value measurements, but rather, it provides enhanced guidance to other pronouncements that require orpermit assets or liabilities to be measured at fair value. This Statement is effective for fiscal years beginning after November 15, 2007, with earlieradoption permitted. The Company does not expect that the adoption of this Statement will have a material impact on its financial position, results ofoperation and cash flows.
45

Notes to Consolidated Financial Statements
Citizens Bancorp and SubsidiaryDecember 31, 2006 and 2005
Note 1 - Summary of Significant Accounting Policies (concluded)
New Accounting Pronouncements (concluded)
In September 2006, the Securities and Exchange Commission (SEC) announced “Staff Accounting Bulletin No. 108” (SAB 108). SAB 108 addresseshow to quantify financial statement errors that arose in prior periods for purposes of assessing their materiality in the current period. It requiresanalysis of misstatements using both an income statement (rollover) approach and a balance sheet (iron curtain) approach in assessing materiality.It clarifies that immaterial financial statement errors in a prior SEC filing can be corrected in subsequent filings without the need to amend the priorfiling. In addition, SAB 108 provides transitional relief for correcting errors that would have been considered immaterial before its issuance. SAB 108was effective for the year ended December 31, 2006. The adoption of SAB 108 did not have an impact on the Company’s accompanyingconsolidated financial statements.
In February 2007, the FASB issued SFAS No. 159, “The Fair Value Option for Financial Assets and Financial Liabilities”. SFAS No. 159 providesentities with an option to report certain financial assets and liabilities at fair value – with changes in fair value reported in earnings – and requiresadditional disclosures related to an entity’s election to use fair value reporting. It also requires entities to display the fair value of those assets andliabilities for which the entity has elected to use fair value on the face of the balance sheet. SFAS No. 159 is effective for fiscal years beginning afterNovember 15, 2007. The Company is currently evaluating the impact that SFAS No. 159 may have on its future consolidated financial statements.
In September 2006, the FASB ratified the consensuses reached by the Emerging Issues Task Force (the Task Force) on Issue No. 06-5 (EITF 06-5)Accounting for the Purchases of Life Insurance – Determining the Amount that Could be Realized in Accordance with FASB Technical Bulletin No.85-4 (FTB 85-4). FTB 85-4 indicates that the amount of the asset included in the balance sheet for life insurance contracts within its scope shouldbe "the amount that could be realized under the insurance contract as of the date of the statement of financial position." Questions arose in applyingthe guidance in FTB 85-4 related to whether "the amount that could be realized" should consider 1) any additional amounts included in thecontractual terms of the insurance policy other than the cash surrender value and 2) the contractual ability to surrender all of the individual-lifepolicies (or certificates in a group policy) at the same time. EITF 06-5 determined that "the amount that could be realized" should 1) consider anyadditional amounts included in the contractual terms of the policy and 2) assume the surrender of an individual-life by individual-life policy (orcertificate by certificate in a group policy). Any amount that is ultimately realized by the policy holder upon the assumed surrender of the final policy(or final certificate in a group policy) shall be included in the "amount that could be realized." An entity should apply the provisions of EITF 06-5through either a change in accounting principle through a cumulative-effect adjustment to retained earnings as of the beginning of the year ofadoption or a change in accounting principle through retrospective application to all prior periods. The provisions of EITF 06-5 are effective for fiscalyears beginning after December 15, 2007. Management has not yet completed its evaluation of the impact that EITF 06-5 may have on theCompany.
In September 2006, the FASB ratified the consensuses reached by the Task Force on Issue No. 06-4 (EITF 06-4) Accounting for DeferredCompensation and Postretirement Benefit Aspects of Endorsement Split-Dollar Life Insurance Arrangements. A question arose when an employerenters into an endorsement split-dollar life insurance arrangement related to whether the employer should recognize a liability for the future benefitsor premiums to be provided to the employee. EITF 06-4 indicates that an employer should recognize a liability for future benefits and that a liabilityfor the benefit obligation has not been settled through the purchase of an endorsement type policy.An entity should apply the provisions of EITF 06-4either through a change in accounting principle through a cumulative effect adjustment to retained earnings as of the beginning of the year ofadoption or a change in accounting principle through retrospective application to all prior periods. The provisions of EITF 06-4 are effective for fiscalyears beginning after December 15, 2007. Management has not yet completed its evaluation of the impact that EITF 06-4 may have on theCompany.
46

Notes to Consolidated Financial Statements
Citizens Bancorp and SubsidiaryDecember 31, 2006 and 2005
Note 2 - Restricted Assets
Federal Reserve Board regulations require that the Bank maintain reserves in the form of cash on hand and deposit balances with the FederalReserve Bank, based on percentage of deposits. The amounts of such balances for the years ended December 31, 2006 and 2005 wereapproximately $635 and $2,736, respectively.
Note 3 - Securities
Securities have been classified according to management’s intent. The amortized cost of securities and their approximate fair value were as follows:Gross Gross
Amortized Unrealized Unrealized FairCost Gains Losses Value
Securities Available for SaleDecember 31, 2006
U.S. Government and agency securities $46,379 $ 39 ($214) $46,204
December 31, 2005U.S. Government and agency securities $64,269 $ - - ($406) $63,863
Securities Held to MaturityDecember 31, 2006
State and municipal securities $5,462 $80 $ - - $5,542
December 31, 2005State and municipal securities $7,871 $146 ($5) $8,012
Unrealized losses and fair value, aggregated by investment category and length of time that individual securities have been in a continuousunrealized loss position, as of December 31, 2006 and 2005 are summarized as follows:
Less than 12 Months 12 Months or More Total
Fair Unrealized Fair Unrealized Fair Unrealized
Value Losses Value Losses Value Losses
December 31, 2006
Securities available for sale:
U.S. Government and agency securities 30,262$ (145)$ 8,930$ (69)$ 39,192$ (214)$
December 31, 2005
Securities held to maturity:
State and municipal securities -$ -$ 677$ (5)$ 677$ (5)$
Securities available for sale:
U.S. Government and agency securities 28,202$ (70)$ 35,661$ (336)$ 63,863$ (406)$
The Company has evaluated these securities and has determined that the decline in the value is temporary. The decline in value is not related to anycompany or industry specific event. Despite the unrealized loss position of these securities, management has concluded, as of December 31, 2006that these investments are not other-than-temporarily impaired. This assessment was based on the following factors: i) the length of time and theextent to which the market value has been less than cost; ii) the financial condition and near-term prospects of the issuer; iii) the intent and ability ofthe Company to retain its investment in a security for a period of time sufficient to allow for any anticipated recovery in market value; and iv) generalmarket conditions which reflect prospects for the economy as a whole, including interest rates and sector credit spreads.
(continued)
47
������������������� ����������������� �����
���� ���������� ���� ���������� ���� ����������
����� ������ ����� ������ ����� ������
�����������������
������������������������������
������������������������������������� � �������� � ������ � ������� � ����� � �������� � ������
�����������������
����������������������������
�������������������������������� � �� � �� � ����� � ���� � ����� � ����
������������������������������
������������������������������������� � �������� � ����� � �������� � ������ � �������� � ������

Notes to Consolidated Financial Statements
Citizens Bancorp and SubsidiaryDecember 31, 2006 and 2005
Note 3 – Securities (concluded)
The contractual maturities of securities held to maturity and available for sale at December 31, 2006 are as follows:
Held to Maturity Available for SaleAmortized Fair Amortized FairCost Value Cost Value
Due in one year or less $ 1,172 $ 1,175 $ 32,375 $ 32,208Due from one year to five years 3,331 3,382 10,834 10,817Due from five to ten years 959 985 2,138 2,156Due over ten years - - - - 1,032 1,023
Total $5,462 $5,542 $46,379 $46,204
Securities carried at approximately $46,048 at December 31, 2006 and $49,032 at December 31, 2005 were pledged to secure public deposits andrepurchase agreements, and for other purposes required or permitted by law.
Gross realized gains on sales of securities available for sale were $42 for the year ended December 31, 2004. There were no gross gains realizedfor the years ending December 31, 2006 and 2005. There were no gross losses realized in the years ending December 31, 2006 or 2005 and $18 ingross losses in 2004.
Note 4 - Loans
Loans at December 31 consist of the following:
2006 2005
Agriculture $18,715 $18,249
Commercial 27,810 22,478
Real estate:
Residential 1-4 family 25,254 22,787
Construction 16,647 11,049
Commercial 120,614 116,180
Farmland 17,508 14,046
Multi-family 23,530 25,419
Consumer 3,382 3,502
253,460 233,710
Less net deferred loan origination fees 433 413
Total loans $253,027 $233,297
(continued)
48
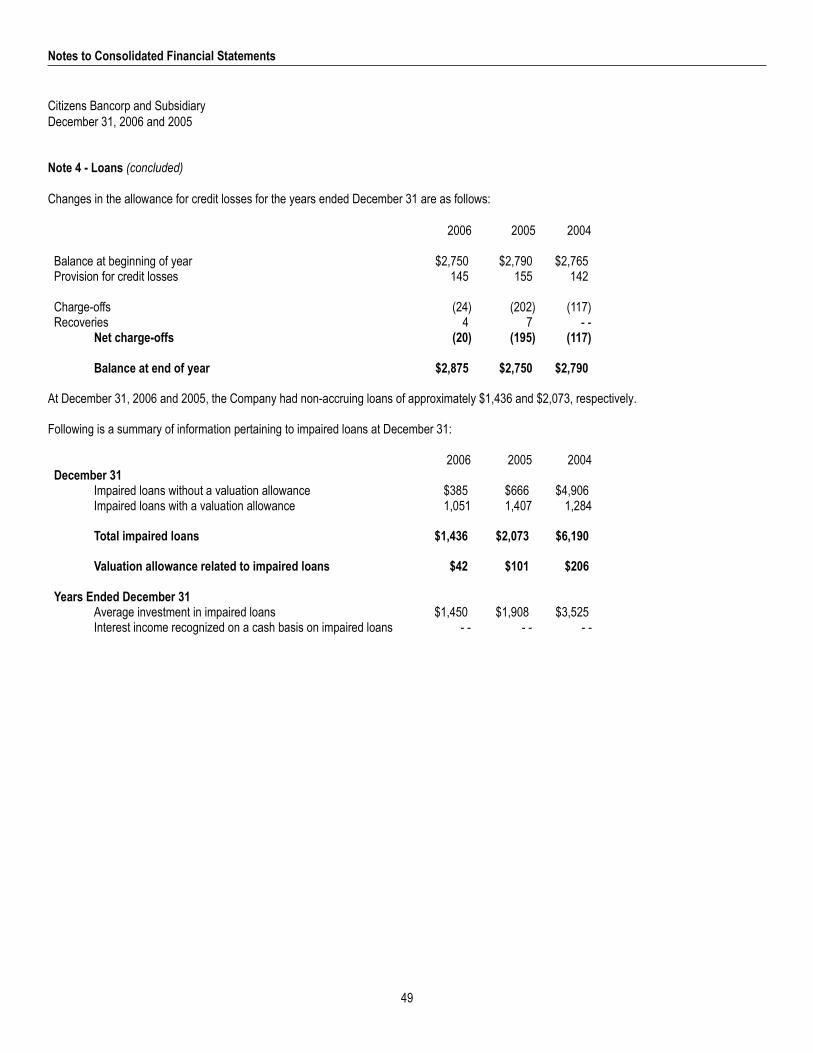
Notes to Consolidated Financial Statements
Citizens Bancorp and SubsidiaryDecember 31, 2006 and 2005
Note 4 - Loans (concluded)
Changes in the allowance for credit losses for the years ended December 31 are as follows:
2006 2005 2004
Balance at beginning of year $2,750 $2,790 $2,765Provision for credit losses 145 155 142
Charge-offs (24) (202) (117)Recoveries 4 7 - -
Net charge-offs (20) (195) (117)
Balance at end of year $2,875 $2,750 $2,790
At December 31, 2006 and 2005, the Company had non-accruing loans of approximately $1,436 and $2,073, respectively.
Following is a summary of information pertaining to impaired loans at December 31:
2006 2005 2004December 31
Impaired loans without a valuation allowance $385 $666 $4,906Impaired loans with a valuation allowance 1,051 1,407 1,284
Total impaired loans $1,436 $2,073 $6,190
Valuation allowance related to impaired loans $42 $101 $206
Years Ended December 31Average investment in impaired loans $1,450 $1,908 $3,525Interest income recognized on a cash basis on impaired loans - - - - - -
49
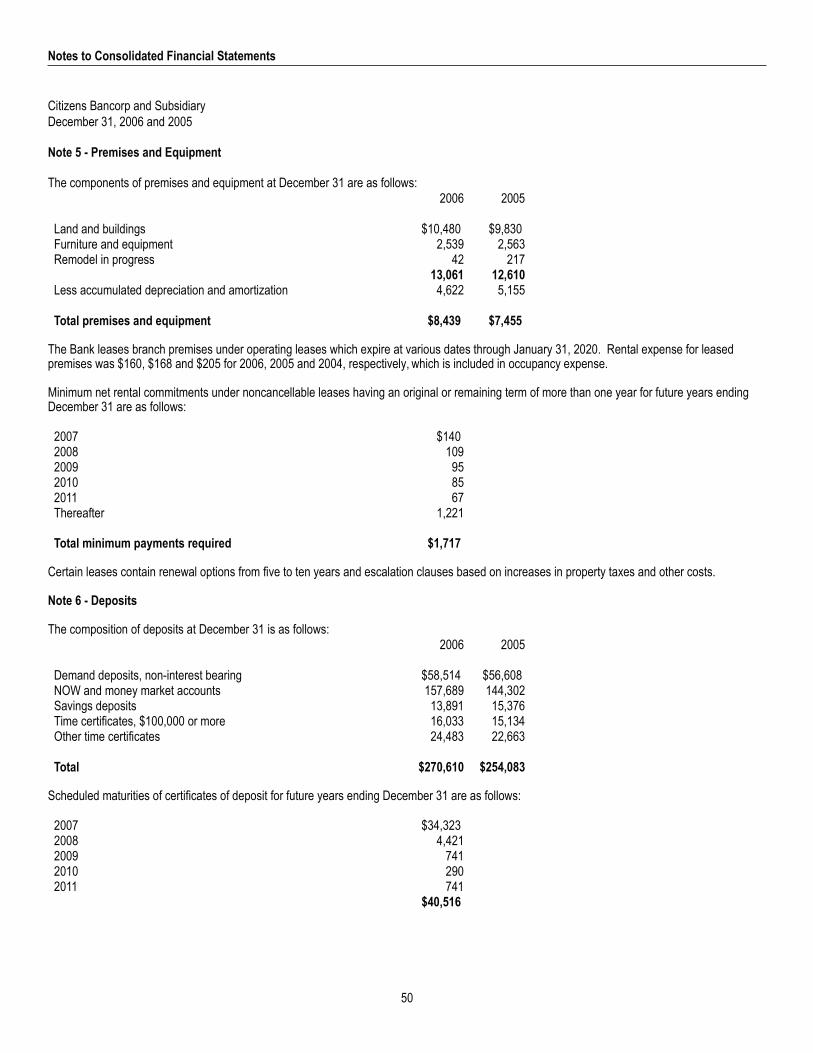
Notes to Consolidated Financial Statements
Citizens Bancorp and SubsidiaryDecember 31, 2006 and 2005
Note 5 - Premises and Equipment
The components of premises and equipment at December 31 are as follows:2006 2005
Land and buildings $10,480 $9,830Furniture and equipment 2,539 2,563Remodel in progress 42 217
13,061 12,610Less accumulated depreciation and amortization 4,622 5,155
Total premises and equipment $8,439 $7,455
The Bank leases branch premises under operating leases which expire at various dates through January 31, 2020. Rental expense for leasedpremises was $160, $168 and $205 for 2006, 2005 and 2004, respectively, which is included in occupancy expense.
Minimum net rental commitments under noncancellable leases having an original or remaining term of more than one year for future years endingDecember 31 are as follows:
2007 $1402008 1092009 952010 852011 67Thereafter 1,221
Total minimum payments required $1,717
Certain leases contain renewal options from five to ten years and escalation clauses based on increases in property taxes and other costs.
Note 6 - Deposits
The composition of deposits at December 31 is as follows:2006 2005
Demand deposits, non-interest bearing $58,514 $56,608NOW and money market accounts 157,689 144,302Savings deposits 13,891 15,376Time certificates, $100,000 or more 16,033 15,134Other time certificates 24,483 22,663
Total $270,610 $254,083
Scheduled maturities of certificates of deposit for future years ending December 31 are as follows:
2007 $34,3232008 4,4212009 7412010 2902011 741
$40,516
50

Notes to Consolidated Financial Statements
Citizens Bancorp and SubsidiaryDecember 31, 2006 and 2005
Note 7 - Short-Term Borrowings
Securities sold under agreements to repurchase, federal funds purchased, and treasury tax and loan deposits represent short-term borrowings withmaturities which do not exceed 90 days. The following is a summary of such short-term borrowings for the years ended December 31:
2006 2005 2004
Average balance during the year $37,682 $46,782 $50,284Average interest rate during the year 3.19% 2.15% 1.40%Maximum month-end balance during the year $45,509 $57,112 $57,159Balance at December 31:
Securities sold under agreements to repurchase $35,586 $36,590 $55,446Other $1,903 $1,878 $1,713
Weighted average interest rate at December 31 2.47% 1.92% 2.16%
Note 8 - Employee Benefits
The Bank’s 401(k) profit sharing plan covers substantially all employees who have completed one year or more of service. Contributions to the401(k) plan consist of employer contributions (up to a maximum of 15% of employee salaries), which are at the discretion of the Board of Directors.Total contributions by the Bank to this plan in 2006, 2005, and 2004 were $382, $435, and $385, respectively.
The Company has a discretionary bonus plan for all employees. The amount of the bonus paid is determined at the end of the year by the Board ofDirectors. The Company paid bonuses of $408, $370 and $302 for the years ended December 31, 2006, 2005 and 2004, respectively.
Note 9 - Income Taxes
Income taxes are comprised of the following for the years ended December 31:
2006 2005 2004Current:
Federal $2,522 $2,478 $1,860State 130 178 449
Deferred tax expense (benefit) 289 45 100
Total income taxes $2,941 $2,701 $2,409
(continued)
51

Notes to Consolidated Financial Statements
Citizens Bancorp and SubsidiaryDecember 31, 2006 and 2005
Note 9 - Income Taxes (concluded)
The following is a reconciliation between the statutory and the effective federal income tax rates for the years ended December 31:
2006 2005 2004Percent Percent Percent
of Pre-tax of Pre-tax of Pre-taxAmount Income Amount Income Amount Income
Income tax at statutory rates $2,940 35.0% $2,810 35.0% $2,366 35.0%Increase (decrease) resulting from:
Tax-exempt income (210) (2.5) (222) (2.8) (161) (2.3)State income taxes, net of tax effect 358 4.3 350 4.4 299 4.4Earnings on life insurance policies (62) (.7) (53) (.7) (56) (.8)Other (85) (1.0) (184) (2.3) (39) (.5)
Total income tax expense $2,941 35.1% $2,701 33.6% $2,409 35.8%
The tax effects of temporary differences that give rise to significant portions of deferred tax assets and liabilities at December 31 are:
2006 2005Deferred Tax Assets
Allowance for credit losses $1,064 $1,017Deferred compensation 422 322Oregon Tax Credits 816 510Other 163 135Unrealized loss on securities available for sale 68 158Total deferred tax assets 2,533 2,142
Deferred Tax LiabilitiesAccumulated depreciation (171) (161)Deferred income (185) (177)Other (177) (140)Total deferred tax liabilities (533) (478)
Net deferred tax assets $2,000 $1,664
In 2006 and 2005, the Company purchased Oregon state income tax credits in the amount of $981 and $867 for a cost of $715 and $648,respectively, of which $524 and$214 were used in 2006 and 2005 to reduce current state income tax payable.
Net deferred tax assets are included in other assets on the consolidated balance sheets.
52
Notes to Consolidated Financial Statements
Citizens Bancorp and SubsidiaryDecember 31, 2006 and 2005
Note 10 - Commitments and Contingencies
The Bank is party to financial instruments with off-balance-sheet risk in the normal course of business to meet the financing needs of its customers.These financial instruments include commitments to extend credit and standby letters of credit. These instruments involve, to varying degrees,elements of credit risk in excess of the amount recognized in the consolidated balance sheets.
The Bank’s exposure to credit loss in the event of nonperformance by the other party to the financial instrument for commitments to extend creditand standby letters of credit is represented by the contractual amount of those instruments. The Bank uses the same credit policies in makingcommitments and conditional obligations as it does for on-balance-sheet instruments. A summary of the Bank’s commitments at December 31 is asfollows:
2006 2005Commitments to extend credit:
Real estate secured $7,791 $9,489Other 59,775 49,064
Total commitments to extend credit $67,566 $58,553
Standby letters of credit $3,302 $3,472
Commitments to extend credit are agreements to lend to a customer as long as there is no violation of any condition established in the contract.Since many of the commitments are expected to expire without being drawn upon, the total commitment amounts do not necessarily represent futurecash requirements. The Bank’s experience has been that approximately 50% of loan commitments are drawn upon by customers. The Bankevaluates each customer’s creditworthiness on a case-by-case basis. The amount of collateral obtained, if deemed necessary by the Bank uponextension of credit, is based on management’s credit evaluation of the party. Collateral held varies, but may include accounts receivable, inventory,property and equipment, residential real estate, and income-producing commercial properties.
The Bank has a credit facility with the Federal Home Loan Bank of Seattle (FHLB) totaling 15% of assets. There were no borrowings outstanding atDecember 31, 2006 or 2005.
The Bank has agreements with commercial banks for lines of credit totaling $24,500, of which $12 were used at December 31, 2006. There were noborrowings used at December 31, 2005.
Standby letters of credit are conditional commitments issued by the Bank to guarantee the performance of a customer to a third party. Thoseguarantees are primarily issued to support public and private borrowing arrangements. The credit risk involved in issuing letters of credit isessentially the same as that involved in extending loan facilities to customers. Collateral held varies as specified above, and is required in instanceswhere the Bank deems necessary.
Because of the nature of its activities, the Company is subject to various pending and threatened legal actions which arise in the ordinary course ofbusiness. In the opinion of management, liabilities arising from these claims, if any, will not have a material effect on the financial position of theCompany.
53
Notes to Consolidated Financial Statements
Citizens Bancorp and SubsidiaryDecember 31, 2006 and 2005
Note 11 - Significant Concentrations of Credit Risk
Most of the Bank’s business activity is with customers located in the state of Oregon. Investments in state and municipal securities involvegovernmental entities primarily within the states of Oregon and Washington. Loans are generally limited, by state banking regulations, to 15% of theBank’s shareholder’s equity, excluding accumulated other comprehensive income (loss), for loans not fully secured by a first lien on real estate, and25% for loans fully secured by a first lien on real estate.
The Bank has credit risk exposure, including off-balance sheet credit risk exposure, as disclosed in Notes 4 and 10. The ultimate collectibility of asubstantial portion of the loan portfolio is susceptible to changes in economic and market conditions in the region. The Bank generally requirescollateral on all real estate loans and typically maintains loan to value ratios of no greater than 70% to 80%.
The Bank has a concentration in real estate loans, particularly in commercial real estate loans. These loans require additional evaluation, including,but not limited to industry, geographic, and collateral analysis. Commercial real estate is further broken down to reflect owner occupied and non-owner occupied properties. Any non-owner occupied category that is over 100% of tier 1 capital is further analyzed as to the type of property beingtaken as collateral.
The contractual amounts of credit related financial instruments such as commitments to extend credit and letters of credit represent the amounts ofpotential accounting loss should the contract be fully drawn upon, the customer default, and the value of any existing collateral become worthless.Letters of credit were granted primarily to commercial borrowers.
Note 12 - Cash Dividend Reinvestment Plan
In July 1997, the Company instituted a dividend reinvestment plan which allows for 50% or 100% of the cash dividends to be reinvested in shares ofCompany common stock based upon shareholder election. Under the plan, 1,732,500 shares are authorized for dividend reinvestment, of which466,598 shares have been issued through December 31, 2006.
Note 13 - Stock Based Compensation
Employee Stock Option Plan
In 1999, the Company adopted a qualified incentive stock option plan that allows for grants of incentive stock options to certain employees. The planauthorized a total of 181,460 shares for options. For each stock option grant, the Board of Directors determines and approves option exerciseprices, numbers of options granted, vesting periods and expiration dates. Cash was not used to settle any equity instruments previously granted. TheCompany issues shares from authorized but unissued shares upon the exercise of stock options. The Company does not currently expect torepurchase shares from any source to satisfy such obligations under its stock option plan.
On January 1, 2006, the Company adopted Financial Accounting Standards Board (“FASB”) Statement of Financial Accounting Standards (“SFAS”)No. 123 (Revised 2004) that requires the measurement and recognition of compensation expense for all stock-based payment awards made toemployees and directors.
SFAS No. 123(R) supersedes the Company’s previous accounting under the provisions of SFAS No. 123, Accounting for Stock-BasedCompensation. As permitted by SFAS No. 123, the Company measured compensation cost for options in accordance with Accounting PrinciplesBoard Opinion (APB) No. 25, “Accounting for Stock Issued to Employees” and related interpretations. Accordingly, no accounting recognition wasgiven to these prior stock options granted at fair market value until they were exercised. Upon exercise, net proceeds, including tax benefitsrealized, were credited to equity.
SFAS No. 123(R) requires companies to estimate the fair value of stock-based payment awards on the date of grant using an option-pricing model.The value of the portion of the award that is ultimately expected to vest is recognized as expense over the requisite service periods in the Company’sconsolidated statement of income. The Company has adopted the accelerated method for graded vested options which recognizes compensationexpense for each vesting tranche over its vesting period.
54
Notes to Consolidated Financial Statements
Citizens Bancorp and SubsidiaryDecember 31, 2006 and 2005
Note 13 - Stock Based Compensation (continued)
Employee Stock Option Plan (continued)
The Company uses the Black-Scholes option-pricing model to value stock options. The Black-Scholes model requires the use of employee exercisebehavior data and the use of a number of assumptions including volatility of the Company’s stock price, dividend yield, weighted average risk-freeinterest rate, and weighted average expected life of the options. There were no options granted during the periods ended December 31, 2006 and2005.
The Company adopted SFAS No. 123(R) using the modified prospective transition method, which requires adoption as of January 1, 2006, the firstday of the Company’s 2006 fiscal year. In accordance with the modified prospective transition method, the Company’s consolidated financialstatements for prior periods have not been restated to reflect, and do not include, the impact of SFAS No. 123(R). Stock-based compensationexpense recognized under SFAS No. 123(R) for the period ended December 31, 2006 totaled $55,938, no tax benefit was realized, and related tocurrently vesting employee stock options that were granted in prior years. At December 31, 2006, unrecognized stock-based compensation totaled$26,031. These costs are expected to be recognized over a weighted average period of 14 months.
The fair value of each option grant is estimated on the date of grant, based on the Black-Scholes option pricing model and using the followingweighted-average assumptions:
2004
Dividend yield 2.66%Expected life 10 yearsRisk-free interest rate 4.17%Expected volatility 24%
No options were granted in 2006 or 2005. The weighted average fair value of options granted during 2004 was $4.60.
(continued)
55

Notes to Consolidated Financial Statements
Citizens Bancorp and SubsidiaryDecember 31, 2006 and 2005
Note 13 - Stock Based Compensation (continued)
Employee Stock Option Plan (concluded)
A summary of the status of the Company’s stock option plan as of December 31, 2006 is presented below:
2006WeightedAverageExercise
Shares Price
Outstanding at beginning of year 151,651 $14.17Granted - - - -Forfeited (2,940) 16.66Exercised (19,827) 12.28
Outstanding at end of year 128,884 $14.40
Options exercisable at year-end 109,682 $13.88
The total fair value of vested shares for the years ended December 31, 2006, 2005 and 2004 was $437,000, $415,000 and $335,000 respectively.
The following summarizes information about stock options outstanding and exercisable at December 31, 2006:
Year ended Year ended
(Dollars in thousands, except share and per share data) December 31, 2006 December 31, 2005
Intrinsic value of options exercised in the period $ 105 $ 117
Stock options fully vested and expected to vest:
Number 116,473 137,047
Weighted avg. exercise price $ 14.40 $ 14.17
Aggregate intrinsic value $ 425 $ 518
Weighted avg. remaining term of options 6.2 years 7.0 years
Stock options vested and currently excercisable:
Number 109,682 108,300
Weighted avg. exercise price $ 13.88 $ 13.32
Aggregate intrinsic value $ 457 $ 501
Weighted avg. remaining term of options 5.9 years 6.5 years
56
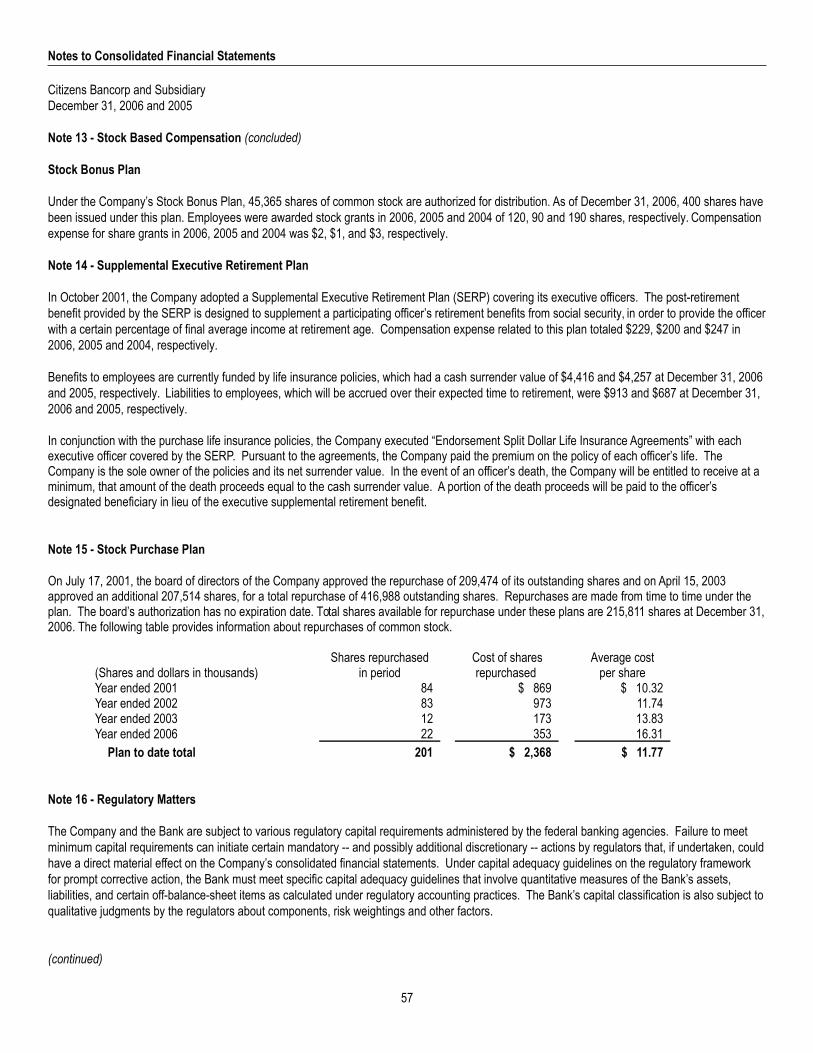
Notes to Consolidated Financial Statements
Citizens Bancorp and SubsidiaryDecember 31, 2006 and 2005
Note 13 - Stock Based Compensation (concluded)
Stock Bonus Plan
Under the Company’s Stock Bonus Plan, 45,365 shares of common stock are authorized for distribution. As of December 31, 2006, 400 shares havebeen issued under this plan. Employees were awarded stock grants in 2006, 2005 and 2004 of 120, 90 and 190 shares, respectively. Compensationexpense for share grants in 2006, 2005 and 2004 was $2, $1, and $3, respectively.
Note 14 - Supplemental Executive Retirement Plan
In October 2001, the Company adopted a Supplemental Executive Retirement Plan (SERP) covering its executive officers. The post-retirementbenefit provided by the SERP is designed to supplement a participating officer’s retirement benefits from social security, in order to provide the officerwith a certain percentage of final average income at retirement age. Compensation expense related to this plan totaled $229, $200 and $247 in2006, 2005 and 2004, respectively.
Benefits to employees are currently funded by life insurance policies, which had a cash surrender value of $4,416 and $4,257 at December 31, 2006and 2005, respectively. Liabilities to employees, which will be accrued over their expected time to retirement, were $913 and $687 at December 31,2006 and 2005, respectively.
In conjunction with the purchase life insurance policies, the Company executed “Endorsement Split Dollar Life Insurance Agreements” with eachexecutive officer covered by the SERP. Pursuant to the agreements, the Company paid the premium on the policy of each officer’s life. TheCompany is the sole owner of the policies and its net surrender value. In the event of an officer’s death, the Company will be entitled to receive at aminimum, that amount of the death proceeds equal to the cash surrender value. A portion of the death proceeds will be paid to the officer’sdesignated beneficiary in lieu of the executive supplemental retirement benefit.
Note 15 - Stock Purchase Plan
On July 17, 2001, the board of directors of the Company approved the repurchase of 209,474 of its outstanding shares and on April 15, 2003approved an additional 207,514 shares, for a total repurchase of 416,988 outstanding shares. Repurchases are made from time to time under theplan. The board’s authorization has no expiration date. Total shares available for repurchase under these plans are 215,811 shares at December 31,2006. The following table provides information about repurchases of common stock.
(Shares and dollars in thousands)Shares repurchased
in periodCost of sharesrepurchased
Average costper share
Year ended 2001 84 $ 869 $ 10.32Year ended 2002 83 973 11.74Year ended 2003 12 173 13.83Year ended 2006 22 353 16.31
Plan to date total 201 $ 2,368 $ 11.77
Note 16 - Regulatory Matters
The Company and the Bank are subject to various regulatory capital requirements administered by the federal banking agencies. Failure to meetminimum capital requirements can initiate certain mandatory -- and possibly additional discretionary -- actions by regulators that, if undertaken, couldhave a direct material effect on the Company’s consolidated financial statements. Under capital adequacy guidelines on the regulatory frameworkfor prompt corrective action, the Bank must meet specific capital adequacy guidelines that involve quantitative measures of the Bank’s assets,liabilities, and certain off-balance-sheet items as calculated under regulatory accounting practices. The Bank’s capital classification is also subject toqualitative judgments by the regulators about components, risk weightings and other factors.
(continued)
57

Notes to Consolidated Financial Statements
Citizens Bancorp and SubsidiaryDecember 31, 2006 and 2005
Note 16 - Regulatory Matters (concluded)
Quantitative measures established by regulation to ensure capital adequacy require the Company and the Bank to maintain minimum amounts andratios (set forth in the table below) of Tier 1 capital (as defined in the regulations) to total average assets (as defined), and minimum ratios of Tier 1and total capital (as defined) to risk-weighted assets (as defined). Management believes, as of December 31, 2006, that the Company and the Bankmeet all capital requirements to which they are subject.
As of December 31, 2006, the most recent notification from the Bank’s regulator categorized the Bank as well capitalized under the regulatoryframework for prompt corrective action. Tobe categorized as well capitalized, the Bank must maintain minimum total risk-based, Tier 1 risk-based,and Tier 1 leverage ratios as set forth in the table. There are no conditions or events since that notification that management believes have changedthe Bank’s category.
The Company's and the Bank’s actual capital amounts and ratios are also presented in the table:
To be WellCapitalizedUnder Prompt
Capital Adequacy Corrective ActionActual Purposes ProvisionsAmount Ratio Amount Ratio Amount Ratio
December 31, 2006Tier 1 capital (to average assets):Bank $46,527 13.17% $14,129 4.00% $17,661 5.00%
Tier 1 capital (to risk-weighted assets):Bank 46,527 15.67 11,876 4.00 17,814 6.00
Total capital (to risk-weighted assets):Bank 49,420 16.64 23,751 8.00 26,689 10.00
December 31, 2005Tier 1 capital (to average assets):Company $42,494 12.39% $13,723 4.00% N/A N/ABank 42,329 12.37 13,689 4.00 $17,111 5.00%
Tier 1 capital (to risk-weighted assets):Company 42,494 15.57 10,914 4.00 N/A N/ABank 42,329 15.56 10,882 4.00 15,984 6.00
Total capital (to risk-weighted assets):Company 45,244 16.58 21,828 8.00 N/A N/ABank 45,079 16.57 21,764 8.00 26,640 10.00
As of February 2006, the Federal Reserve Bank amended its rules relative to capital requirements for bank holding companies under $500 million intotal assets. As a result, there are no longer regulatory capital requirements for the Company; therefore, the capital ratios are no longer reported.
Restrictions on Retained Earnings
At December 31, 2006, there were no restrictions on the Company’s or the Bank’s retained earnings regarding payment of dividends.
58

Notes to Consolidated Financial Statements
Citizens Bancorp and SubsidiaryDecember 31, 2006 and 2005
Note 17 - Condensed Financial Information - Parent Company Only
Condensed Balance Sheets - December 31
2006 2005Assets
Cash $2,565 $2,548Investment in Bank 46,420 42,081
Total assets $48,985 $44,629
Liabilities and Shareholders’ Equity
LiabilitiesDividends payable $2,461 $2,333
Shareholders’ Equity 46,524 42,296
Total liabilities and shareholders’ equity $48,985 $44,629
Condensed Statements of Income - Years Ended December 312006 2005 2004
IncomeDividend income from Bank $2,461 $2,489 $2,329
ExpensesAmortization and other expense 180 165 143
Income before income tax benefit 2,281 2,324 2,186
Income Tax Benefit 69 60 54
Income before equity in undistributedincome of subsidiary 2,350 2,384 2,240
Equity in Undistributed Income of Subsidiary 3,109 2,943 2,112
Net income $5,459 $5,327 $4,352
(continued)
59

Notes to Consolidated Financial Statements
Citizens Bancorp and SubsidiaryDecember 31, 2006 and 2005
Note 17 - Condensed Financial Information - Parent Company Only (concluded)
Condensed Statements of Cash Flows - Years Ended December 31
2006 2005 2004
Cash Flows from Operating ActivitiesNet income $5,459 $5,327 $4,352Adjustments to reconcile net income to net cashprovided by operating activities:Equity in undistributed income of subsidiary (3,109) (2,943) (2,112)Other - net 58 2 4
Net cash provided by operating activities 2,408 2,386 2,244
Cash Flows from Investing ActivitiesInvestment in Bank (1,089) (775) (1,008)
Cash Flows from Financing ActivitiesCash dividends paid (1,206) (1,576) (1,137)Exercise of stock options 243 211 46Repurchase of common stock (353) - - - -Tax benefit from stock options exercised 14 13 - -Net cash used in financing activities (1,302) (1,352) (1,091)
Net increase in cash 17 259 145
CashBeginning of year 2,548 2,289 2,144
End of year $2,565 $2,548 $2,289
60

Notes to Consolidated Financial Statements
Citizens Bancorp and SubsidiaryDecember 31, 2006 and 2005
Note 18 - Fair Value of Financial Instruments
The estimated fair value of the Company’s financial instruments at December 31 were as follows:
2006 2005Carrying Fair Carrying FairAmount Value Amount Value
Financial AssetsCash and due from banks, interestbearing deposits in banks $28,936 $28,936 $18,684 $18,684
Federal funds sold 9,340 9,340 435 435Securities available for sale 46,204 46,204 63,863 63,863Securities held to maturity 5,462 5,542 7,871 8,012Federal Home Loan Bank stock 905 905 905 905Loans held for sale 53 53 548 548Loans receivable, net 250,152 255,016 230,547 233,044Accrued interest receivable 2,112 2,112 1,852 1,852
Financial LiabilitiesDeposits $270,610 $270,016 $254,083 $251,948Short-term borrowings 37,489 37,457 38,468 38,516Accrued interest payable 100 100 62 62
The Bank assumes interest rate risk (the risk that general interest rate levels will change) as a result of its normal operations. As a result, the fairvalues of the Bank’s financial instruments will change when interest rate levels change, and that change may either be favorable or unfavorable tothe Bank. Management attempts to match maturities of assets and liabilities to the extent believed necessary to minimize interest rate risk.However, borrowers with fixed rate obligations are less likely to prepay in a rising rate environment and more likely to prepay in a falling rateenvironment. Conversely, depositors who are receiving fixed rates are more likely to withdraw funds before maturity in a rising rate environment andless likely to do so in a falling rate environment. Management monitors rates and maturities of assets and liabilities, and attempts to minimizeinterest rate risk by adjusting terms of new loans and deposits, and by investing in securities with terms that mitigate the Bank’s overall interest raterisk.
61

Notes to Consolidated Financial Statements
Citizens Bancorp and SubsidiaryDecember 31, 2006 and 2005
Note 19 - Comprehensive Income
Net unrealized gains and losses are as follows for the years ended December 31:
Before-Tax Tax Net-of-TaxAmount Expense Amount
2006Unrealized holding gains arising during the year $231 $90 $141
2005Unrealized holding gains arising during the year $208 $82 $126
2004Unrealized holding losses arising during the year ($715) $279 ($436)Less reclassification adjustments for gains realizedin net income (24) 9 (15)
Net unrealized losses ($739) $288 ($451)
Note 20 - Earnings Per Share Disclosures
Following is information regarding the calculation of basic and diluted earnings per share for the years indicated.
Net Income Shares Per Share(Numerator) (Denominator) Amount
Year Ended December 31, 2006Basic earnings per share: $5,459 4,731,873 $1.15Effect of dilutive securities: - - 23,676 - -Diluted earnings per share: $5,459 4,755,549 $1.15
Year Ended December 31, 2005Basic earnings per share: $5,327 4,743,361 $1.12Effect of dilutive securities: - - 37,155 (0.01)Diluted earnings per share: $5,327 4,780,516 $1.11
Year Ended December 31, 2004Basic earnings per share: $4,352 4,616,799 $0.94Effect of dilutive securities: - - 36,034 - -Diluted earnings per share: $4,352 4,652,833 $0.94
62
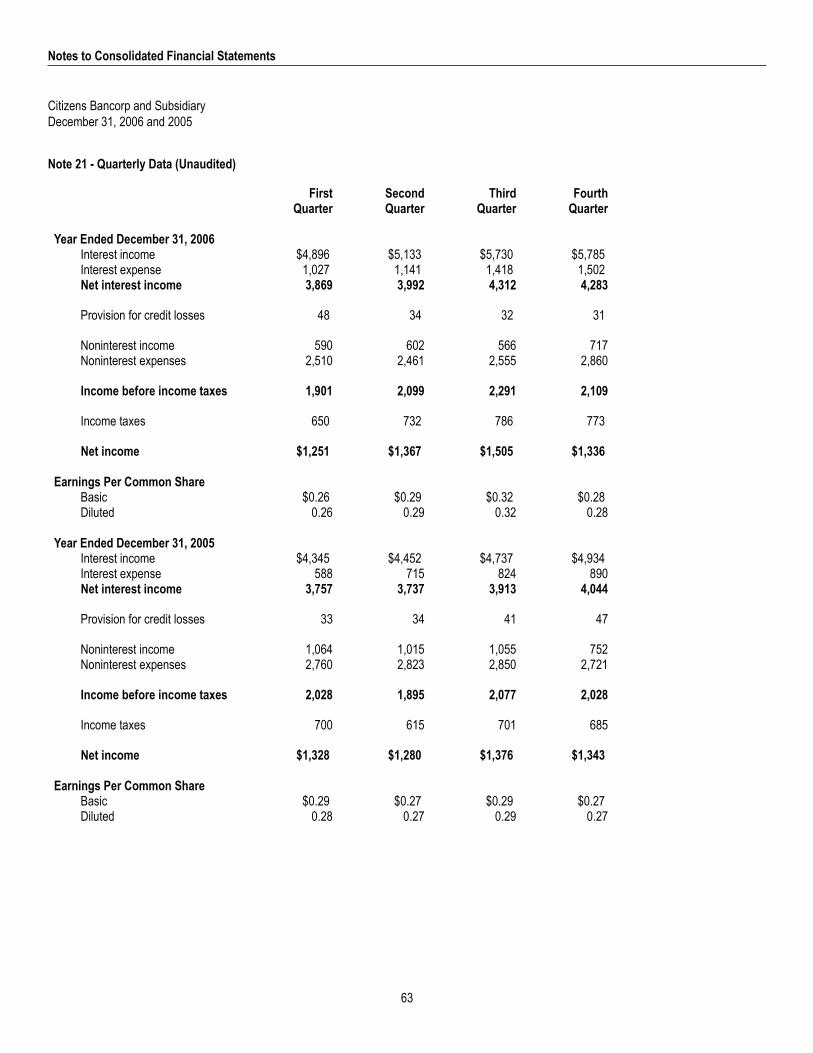
Notes to Consolidated Financial Statements
Citizens Bancorp and SubsidiaryDecember 31, 2006 and 2005
Note 21 - Quarterly Data (Unaudited)
First Second Third FourthQuarter Quarter Quarter Quarter
Year Ended December 31, 2006Interest income $4,896 $5,133 $5,730 $5,785Interest expense 1,027 1,141 1,418 1,502Net interest income 3,869 3,992 4,312 4,283
Provision for credit losses 48 34 32 31
Noninterest income 590 602 566 717Noninterest expenses 2,510 2,461 2,555 2,860
Income before income taxes 1,901 2,099 2,291 2,109
Income taxes 650 732 786 773
Net income $1,251 $1,367 $1,505 $1,336
Earnings Per Common ShareBasic $0.26 $0.29 $0.32 $0.28Diluted 0.26 0.29 0.32 0.28
Year Ended December 31, 2005Interest income $4,345 $4,452 $4,737 $4,934Interest expense 588 715 824 890Net interest income 3,757 3,737 3,913 4,044
Provision for credit losses 33 34 41 47
Noninterest income 1,064 1,015 1,055 752Noninterest expenses 2,760 2,823 2,850 2,721
Income before income taxes 2,028 1,895 2,077 2,028
Income taxes 700 615 701 685
Net income $1,328 $1,280 $1,376 $1,343
Earnings Per Common ShareBasic $0.29 $0.27 $0.29 $0.27Diluted 0.28 0.27 0.29 0.27
63
Notes to Consolidated Financial Statements
Citizens Bancorp and SubsidiaryDecember 31, 2006 and 2005
Note 22 – Transactions with Related Parties
Certain directors, their associates and key officers are customers of and have had banking transactions with the Bank. The Bank expects suchtransactions to continue in the future. All loans and commitments to lend included in such transactions were made in compliance with applicablelaws, on substantially the same terms, including interest rates and collateral, as those prevailing at the time for comparable transactions with otherpersons, and do not involve more than the normal risk of collectibility or present any unfavorable features. Loans outstanding to directors, theirassociates, and executive officers were as follows for the years ended December 31:
2006 2005
Balance at beginning of year 3,590 3,933Loans advanced 3,613 13,556Loans repaid 2,025 13,899
Balance at end of year 5,178 3,590
All related party loans were current as to principal and interest as of December 31, 2006 and 2005.
Note 23 – Operating Segments
The Company has operating segments which have been aggregated into three reporting segment as provided in SFAS No. 131 “Disclosure AboutSegments of an Enterprise and Related Information”.
Management has evaluated the Company’s overall operation and determined that its business consists of certain reportable segments for the peri-ods ending December 31, 2006, 2005, and 2004. Our operating segments are aggregated into reportable segments based primarily upon similareconomic characteristics, products, services, customers, and delivery methods. These segments are community banking operations, mortgage de-partment services, and treasury services. The following describes these segments:
Community Banking – The principal business activities of this segment are attracting deposits from the general public and originating com-mercial and real estate loans for small and medium size businesses in the Company’s branch market areas. This segment’s primarysources of revenue are interest income and fees earned in connection with loans and deposits. This segment’s principal expenses consistof interest paid on deposits, personnel, occupancy, and other general expenses.
Mortgage Department – The principal business activities of this segment are to originate, process, underwrite, fund and sell residential 1-4family real estate loans. A small portion of loans are retained (less than 5 percent of originations) in the department’s portfolio. This seg-ment’s primary sources of revenues are from interest from retained loans, loan fees, and servicing released premiums. This segment’s pri-mary expenses are personnel, occupancy, and other general expenses.
Treasury Services – The treasury function of the Company, although not considered a line of business, is responsible for the managementof the investment portfolio, data processing and holding company activities. This segment’s primary source of revenue is interest incomefrom the investment portfolio. This segment’s primary expenses are personnel expenses, data processing expense, the Company’s stateand federal income tax expense, and other general and administrative expenses.
The financial results of each segment are derived from the Company’s general ledger system. Selected financial information on the Com-pany’s segments is presented below for the periods ending December 31, 2006, 2005, and 2004.
(continued)
64
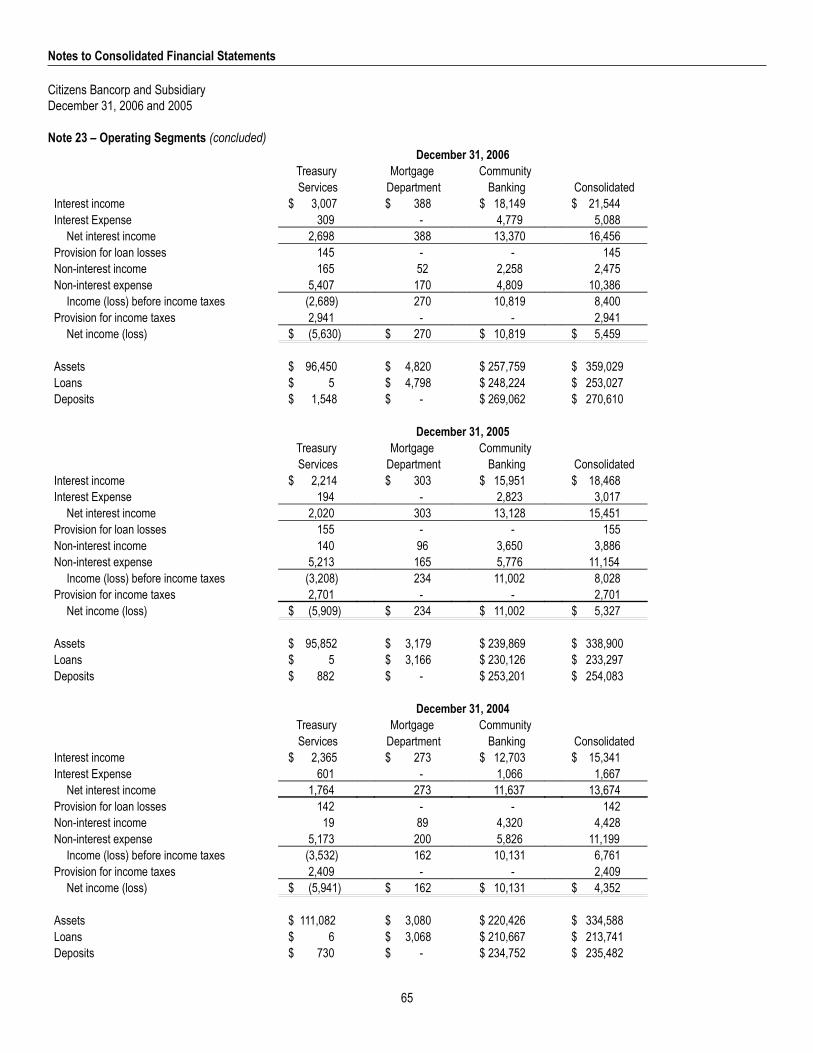
Notes to Consolidated Financial Statements
Citizens Bancorp and SubsidiaryDecember 31, 2006 and 2005
Note 23 – Operating Segments (concluded)
December 31, 2006
Treasury Mortgage Community
Services Department Banking Consolidated
Interest income $ 3,007 $ 388 $ 18,149 $ 21,544
Interest Expense 309 - 4,779 5,088
Net interest income 2,698 388 13,370 16,456
Provision for loan losses 145 - - 145
Non-interest income 165 52 2,258 2,475
Non-interest expense 5,407 170 4,809 10,386
Income (loss) before income taxes (2,689) 270 10,819 8,400
Provision for income taxes 2,941 - - 2,941
Net income (loss) $ (5,630) $ 270 $ 10,819 $ 5,459
Assets $ 96,450 $ 4,820 $ 257,759 $ 359,029
Loans $ 5 $ 4,798 $ 248,224 $ 253,027
Deposits $ 1,548 $ - $ 269,062 $ 270,610
December 31, 2005
Treasury Mortgage Community
Services Department Banking Consolidated
Interest income $ 2,214 $ 303 $ 15,951 $ 18,468
Interest Expense 194 - 2,823 3,017
Net interest income 2,020 303 13,128 15,451
Provision for loan losses 155 - - 155
Non-interest income 140 96 3,650 3,886
Non-interest expense 5,213 165 5,776 11,154
Income (loss) before income taxes (3,208) 234 11,002 8,028
Provision for income taxes 2,701 - - 2,701
Net income (loss) $ (5,909) $ 234 $ 11,002 $ 5,327
Assets $ 95,852 $ 3,179 $ 239,869 $ 338,900
Loans $ 5 $ 3,166 $ 230,126 $ 233,297
Deposits $ 882 $ - $ 253,201 $ 254,083
December 31, 2004
Treasury Mortgage Community
Services Department Banking Consolidated
Interest income $ 2,365 $ 273 $ 12,703 $ 15,341
Interest Expense 601 - 1,066 1,667
Net interest income 1,764 273 11,637 13,674
Provision for loan losses 142 - - 142
Non-interest income 19 89 4,320 4,428
Non-interest expense 5,173 200 5,826 11,199
Income (loss) before income taxes (3,532) 162 10,131 6,761
Provision for income taxes 2,409 - - 2,409
Net income (loss) $ (5,941) $ 162 $ 10,131 $ 4,352
Assets $ 111,082 $ 3,080 $ 220,426 $ 334,588
Loans $ 6 $ 3,068 $ 210,667 $ 213,741
Deposits $ 730 $ - $ 234,752 $ 235,482
65

ITEM 9. CHANGES IN AND DISAGREEMENTS WITH ACCOUNTANTS
None
ITEM 9A. CONTROLS AND PROCEDURES
Evaluation of Disclosure Controls and Procedures
As of the end of the period covered by this report, the Company carried out an evaluation, under the supervision and with the participation of theCompany's management, including the Company's Chief Executive Officer and the Company's Chief Financial Officer, of the effectiveness of thedesign and operation of the Company's disclosure controls and procedures (as defined in Rules 13a-15(e) and 15d-15(e) under the Securities andExchange Act of 1934, as amended). Based on this evaluation, the Company's Chief Executive Officer and Chief Financial Officer concluded thatthe Company's disclosure controls and procedures were effective in timely alerting them to material information relating to the Company required tobe included in the Company's periodic filings with the Securities and Exchange Commission. It should be noted that in designing and evaluating thedisclosure controls and procedures, management recognized that any controls and procedures, no matter how well designed and operated, canprovide only reasonable assurance of achieving the desired control objectives, and management necessarily was required to apply its judgment inevaluating the cost-benefit relationship of possible controls and procedures. The Company has designed its disclosure controls and procedures toreach a level of reasonable assurance of achieving desired control objectives and, based on the evaluation described above, the Company's ChiefExecutive Officer and Chief Financial Officer concluded that the Company's disclosure controls and procedures were effective at reaching that levelof reasonable assurance at the end of such period.
There was no change in the Company's internal control over financial reporting (as defined in Rules 13a-15(f) and 15d-15(f) under the Securities andExchange Act of 1934, as amended) during the Company's most recently completed fiscal quarter that has materially affected, or is reasonably likelyto materially affect, the Company's internal control over financial reporting.
ITEM 9B. OTHER INFORMATION
None
PART III
ITEM 10. DIRECTORS, EXECUTIVE OFFICERS AND CORPORATE GOVERNANCE
In response to this Item, the information set forth in the Company’s 2007 Annual Meeting Proxy Statement dated March 27, 2007 (“Proxy Statement”)under the headings “Information with Respect to Nominees and Other Directors,” and “Security Ownership of Certain Beneficial Owners andManagement” is incorporated herein by reference.
Information regarding “Compliance with Section 16(a) of the Exchange Act” is set forth under the section “Compliance with Section 16(a) FilingRequirements” of the Company’s Proxy Statement and is incorporated herein by reference. Information regarding the Company’s audit committeefinancial expert is set forth under the captions “Meetings and Committees of the Board of Directors” in the Proxy Statement is incorporated herein byreference.
Code of Ethics
The Company has adopted a code of ethics for all directors and executive officers including the Company’s president and chief executive officer, andthe chief financial officer. The Code of Ethics Policy is available on Citizens Bank’s website at www.citizensEbank.com. Shareholders may request afree copy of the Code of Ethics Policy from:
Citizens BancorpAttention: Shareholder RelationsPO Box 30Corvallis, OR 97339(541) 752-5161
66

ITEM 11. EXECUTIVE COMPENSATION
Information concerning executive and director compensation required by this item is set forth under the headings “Executive Compensation” and“Compensation of Directors” in the Proxy Statement and is incorporated herein by reference.
ITEM 12. SECURITY OWNERSHIP OF CERTAIN BENEFICIAL OWNERS, MANAGEMENT,AND RELATED SHAREHOLDER MATTERS
The information required by this item is set forth under the heading “Security Ownership of Certain Beneficial Owners and Management” in the ProxyStatement and is incorporated herein by reference.
ITEM 13. CERTAIN RELATIONSHIPS AND RELATED TRANSACTIONS AND DIRECTOR INDEPENDENCE
The information required by this item is set forth under the heading “Certain Relationships and Related Transactions” and “Corporate Governance” inthe Proxy Statement and is incorporated herein by reference.
ITEM 14. PRINCIPAL ACCOUNTANTS FEES AND SERVICES
The information concerning principal accountant fees and services is set forth under the heading “Independent Registered Public Accounting Firm” inthe Proxy Statement and is incorporated by reference.
67

PART IV
ITEM 15. EXHIBITS AND FINANCIAL STATEMENT SCHEDULES.
(a)(1) Financial Statements
The financial statements and related documents listed in the Index set forth in Item 8 of this report are filed as part of this report.
(a)(2) Financial Statement Schedules
All other schedules to the financial statements required by Regulation S-X are omitted because they are not applicable, not material, or because theinformation is included in the consolidated financial statements or related notes.
(a)(3) Exhibit Index
Exhibit No. Exhibit
3.1 Amended and Restated Articles of Incorporation (1)
3.2 Bylaws (2)
10.1 Incentive Stock Option Plan (1)
10.2 Stock Bonus Plan (1)
10.3 Dividend Reinvestment Plan (3)
10.4 Deferred Compensation Plan for William V. Humphreys, Sr. (3)
10.5 Executive Supplemental Compensation Agreement and Life Insurance Endorsement Method SplitDollar Plan Agreement for William V. Humphreys, Sr. (4)
10.6 Form of Executive Supplemental Compensation Agreement and Life Insurance EndorsementMethod Split Dollar Plan Agreement for William F.Hubel, Steve R. Terjeson, Lark E. Wysham andScott M. Zimbrick (5)
14 Code of Ethics (6)
21 Subsidiaries, Citizens Bank is the only subsidiary
23 Consent of McGladrey & Pullen PLLP
31.1 Certificate of Chief Executive Officer Pursuant to Section 302 of the Sarbanes-Oxley Act of 2002
31.2 Certificate of Chief Financial Officer Pursuant to Section 302 of the Sarbanes-Oxley Act of 2002
32.1 Chief Executive Officer Certification Pursuant to Section 906 of the Sarbanes-Oxley Act of 2002
32.2 Chief Financial Officer Certification Pursuant to Section 906 of the Sarbanes-Oxley Act of 2002
(1) Incorporated by reference to exhibit 3.1, 10.1 and 10.2 of the Company’s Annual Report on Form 10-K for the fiscal year December 31, 2004(2) Incorporated by reference to exhibit 3.2 of the Company’s Annual Report on Form 10-K for the fiscal year December 31, 2002(3) Incorporated by reference to exhibits 10.1 and 10.3 of the Company’s Annual Report on Form 10-K for the fiscal year December 31, 1997(4) Incorporated by reference to exhibit 10.5 of the Company’s Annual Report on Form 10-K for the fiscal year December 31, 2005(5) Incorporated by reference to exhibit 10.6 of the Company’s Annual Report on Form 10-K for the fiscal year December 31, 2005(6) Incorporated by reference to exhibit 14 of the Company’s Annual Report on Form 10-K for the fiscal year December 31, 2003
68

SIGNATURES
Pursuant to the requirements of Section 13 or 15(d) of the Securities Exchange Act of 1934, the registrant has duly caused this report to be signedon its behalf by the undersigned; thereunto duly authorized, on the 20th day of March, 2007.
CITIZENS BANCORP(Registrant)
By: /s/ William V. Humphreys, Sr.William V. Humphreys, Sr.President and Chief Executive Officer
Pursuant to the requirements of the Securities Exchange Act of 1934, this report has been signed below by the following persons on behalf of theregistrant and in the capacities indicated on the 20th day of March 2007.
PRINCIPAL EXECUTIVE OFFICER:
/s/ William V. Humphreys, Sr.William V. Humphreys, Sr., President & CEO
PRINCIPAL FINANCIAL AND ACCOUNTING OFFICER:
/s/ Lark E. WyshamLark E. Wysham, Executive Vice President & Chief Financial Officer
DIRECTORS:
/s/ Jock Gibson /s/ William V. Humphreys, Sr.Jock Gibson William V. Humphreys, Sr.
/s/ Rosetta C. Venell /s/ James E. RichardsRosetta C. Venell James E. Richards
/s/ Sidney A. Huwaldt /s/ Scott A. FewelSidney A. Huwaldt Scott A. Fewel
/s/ Duane L. Sorensen /s/ Eric C. ThompsonDuane L. Sorensen Eric C. Thompson
/s/ Michael E. ButlerMichael E. Butler
69

EXHIBIT 21
As of December 31, 2006 Citizens Bancorp’s only subsidiary was Citizens Bank, an Oregon corporation, which is wholly-owned by Citizens Bancorp.
70

EXHIBIT 23
CONSENT OF INDEPENDENT REGISTERED PUBLIC ACCOUNTING FIRM
We consent to the incorporation by reference in Registration Statement No. 333-81361 of Citizens Bancorp, Inc. on Form S-8 ofour report, dated March 19, 2007, appearing in this Annual Report on Form 10-K of Citizens Bancorp for the year endedDecember 31, 2006.
/s/ McGladrey & Pullen, LLP
Seattle, WashingtonMarch 19, 2007
71

EXHIBIT 31.1CERTIFICATION REQUIRED
BY RULES 13a-14(a) AND 15d-14(a) UNDER THESECURITIES AND EXCHANGE ACT OF 1934
I, William V. Humphreys, Sr., President and Chief Executive Officer of Citizens Bancorp (the "Company"), certify that:
1. I have reviewed this annual report on Form 10-K of the Company;
2. Based on my knowledge, this annual report does not contain any untrue statement of a material fact or omit to statea material fact necessary to make the statements made, in light of the circumstances under which such statements were made,not misleading with respect to the period covered by this annual report;
3. Based on my knowledge, the financial statements, and other financial information included in this annual report,fairly present in all material respects the financial condition, results of operations and cash flows of the Company as of, and for,the periods presented in this annual report;
4. The Company's other certifying officer and I are responsible for establishing and maintaining disclosure controls andprocedures (as defined in Exchange Act Rules 13a-15(e) and 15d-15(e)) for the Company and we have: a) designed suchdisclosure controls and procedures, or caused such disclosure controls and procedures to be designed under our supervision, toensure that material information relating to the Company, including any consolidated subsidiaries, is made known to us by otherswithin those entities, particularly during the period in which this annual report is being prepared; b) not applicable; c) evaluatedthe effectiveness of the Company's disclosure controls and procedures and presented in this report our conclusions about theeffectiveness of the disclosure controls and procedures, as of the end of the period covered by this report based on suchevaluation; and d) disclosed in this report any change in the Company’s internal control over financial reporting that occurredduring the Company’s most recent fiscal quarter (the registrant’s fourth fiscal quarter in the case of an annual report) that hasmaterially affected, or is reasonably likely to materially affect, the Company’s internal control over financial reporting;
5. The Company's other certifying officer and I have disclosed, based on our most recent evaluation of internal controlover financial reporting, to the Company's auditors and the audit committee of the Company's board of directors (or personsperforming the equivalent function): a) all significant deficiencies and material weaknesses in the design or operation of internalcontrol over financial reporting which are reasonably likely to adversely affect the Company’s ability to record, process,summarize and report financial information; and b) any fraud, whether or not material, that involves management or otheremployees who have a significant role in the Company's internal controls over financial reporting.
Date: March 20, 2007/s/ William V. Humphreys, Sr.William V. Humphreys, Sr.President and Chief Executive Officer
72
EXHIBIT 31.2CERTIFICATION REQUIRED
BY RULES 13a-14(a) AND 15d-14(a) UNDER THESECURITIES AND EXCHANGE ACT OF 1934
I, Lark E. Wysham, Executive Vice President and Chief Financial Officer of Citizens Bancorp (the "Company"), certify that:
1. I have reviewed this annual report on Form 10-K of the Company;
2. Based on my knowledge, this annual report does not contain any untrue statement of a material fact or omit to statea material fact necessary to make the statements made, in light of the circumstances under which such statements were made,not misleading with respect to the period covered by this annual report;
3. Based on my knowledge, the financial statements, and other financial information included in this annual report,fairly present in all material respects the financial condition, results of operations and cash flows of the Company as of, and for,the periods presented in this annual report;
4. The Company's other certifying officer and I are responsible for establishing and maintaining disclosure controls andprocedures (as defined in Exchange Act Rules 13a-15(e) and 15d-14(e)) for the Company and we have: a) designed suchdisclosure controls and procedures, or caused such disclosure controls and procedures to be designed under our supervision, toensure that material information relating to the Company, including any consolidated subsidiaries, is made known to us by otherswithin those entities, particularly during the period in which this annual report is being prepared; b) not applicable; c) evaluatedthe effectiveness of the Company's disclosure controls and procedures and presented in this report our conclusions about theeffectiveness of the disclosure controls and procedures, as of the end of the period covered by this report based on suchevaluation; and d) disclosed in this report any change in the Company’s internal control over financial reporting that occurredduring the Company’s most recent fiscal quarter (the registrant’s fourth fiscal quarter in the case of an annual report) that hasmaterially affected, or is reasonably likely to materially affect, the Company’s internal control over financial reporting;
5. The Company's other certifying officer and I have disclosed, based on our most recent evaluation of internal controlover financial reporting, to the Company's auditors and the audit committee of the Company's board of directors (or personsperforming the equivalent function): a) all significant deficiencies and material weaknesses in the design or operation of internalcontrol over financial reporting which are reasonably likely to adversely affect the Company’s ability to record, process,summarize and report financial information; and b) any fraud, whether or not material, that involves management or otheremployees who have a significant role in the Company's internal controls over financial reporting.
Date: March 20, 2007
/s/ Lark E. WyshamLark E. WyshamExecutive Vice President and Chief Financial Officer
73

EXHIBIT 32.1CERTIFICATION OF CHIEF EXECUTIVE OFFICER
CERTIFICATION PURSUANT TO 18 U.S.C. SECTION 1350, AS ADOPTEDPURSUANT TO SECTION 906 OF THE SARBANES-OXLEY ACT OF 2002
In connection with the Annual Report of Citizens Bancorp (the "Company") on Form 10-K for the period endingDecember 31, 2006, as filed with the Securities and Exchange Commission on the date hereof (the "Report"), the undersigned,William V. Humphreys, Sr., President and Chief Executive Officer of the Company, certify, pursuant to 18 U.S.C. Section 1350, asadopted pursuant to Section 906 of the Sarbanes-Oxley Act of 2002, that: (1) The Report fully complies with the requirements ofsection 13(a) or 15(d) of the Securities Exchange Act of 1934; and (2) The information contained in the Report fairly presents, inall material respects, the financial condition and result of operations of the Company.
/s/ William V. Humphreys, Sr._______________________________William V. Humphreys, Sr.President and Chief Executive OfficerMarch 20, 2007
74
EXHIBIT 32.2CERTIFICATION OF CHIEF FINANCIAL OFFICER
CERTIFICATION PURSUANT TO 18 U.S.C. SECTION 1350, AS ADOPTEDPURSUANT TO SECTION 906 OF THE SARBANES-OXLEY ACT OF 2002
In connection with the Annual Report of Citizens Bancorp (the "Company") on Form 10-K for the period endingDecember 31, 2006, as filed with the Securities and Exchange Commission on the date hereof (the "Report"), the undersigned,Lark E. Wysham, Chief Financial Officer of the Company, certify, pursuant to 18 U.S.C. Section 1350, as adopted pursuant toSection 906 of the Sarbanes-Oxley Act of 2002, that: (1) The Report fully complies with the requirements of section 13(a) or15(d) of the Securities Exchange Act of 1934; and (2) The information contained in the Report fairly presents, in all materialrespects, the financial condition and result of operations of the Company.
/s/ Lark E. Wysham_______________________________Lark E. WyshamChief Financial OfficerMarch 20, 2007
75

[THIS PAGE IS INTENTIONALLY LEFT BLANK]

[THIS PAGE IS INTENTIONALLY LEFT BLANK]

[THIS PAGE IS INTENTIONALLY LEFT BLANK]

[THIS PAGE IS INTENTIONALLY LEFT BLANK]