
10740603_786451778068578_954157789_n
27
INANCIAL PERFORMANCE ANALYSI OF
-
Upload
mehedee-shamim -
Category
Documents
-
view
82 -
download
1
Transcript of 10740603_786451778068578_954157789_n

FINANCIAL PERFORMANCE ANALYSIS OF

Introduction
• We know the name, British American Tobacco Group as the world’s second largest quoted tobacco group by global market share, with brands sold in more than 180 markets.
• British American Tobacco was established to trade outside both the UK and the USA, and grew from its roots in dozens of countries across Africa, Asia, Latin America and continental Europe.
• BAT is the only international tobacco group with a significant interest in tobacco leaf growing, working with thousands of farmers internationally.

Objectives
• Broad Objective: (To find out position of BAT financial performance Analysis)
• Specific Objective: (To find ratio analysis, values, identify analysis policy, different types of factors)

Methodology:
• Primary data: Annual Financial report of BAT
• Secondary data: web site of BAT, Google

Limitations
• Their official website also contains a limited amount of information required for making a report which could be covered by the information given in their annual report and through the primary sources of data. Therefore the information collected is limited and with the limited information
Company Overview
• British American Tobacco plc. (Informally BAT) is a British multinational tobacco company headquartered in London, United Kingdom.
• The company was formed in 1902, when the United Kingdom's Imperial Tobacco Company and the American Tobacco Company of the USA agreed to form a joint venture, the British-American Tobacco Company Ltd.

SWOT Analysis
• Strengths Effective communication Online growth Loyal customers Strong management team Strong brand equity Strong financial position PricingGrow tobacco leafs
Weaknesses Diseconomies to scale Low R&D No online presence Not diversified Ubiquitiouegory, products, services
Opportunities Acquisitions Financial markets (raise money through
debt, etc) Online Product and services expansion Takeovers
Threats Competition Cheaper technology External changes (government, politics, taxes,
etc.) Exchange rate fluctuations Maturing categories, products, or services Variety customers expectation in different
country/culture
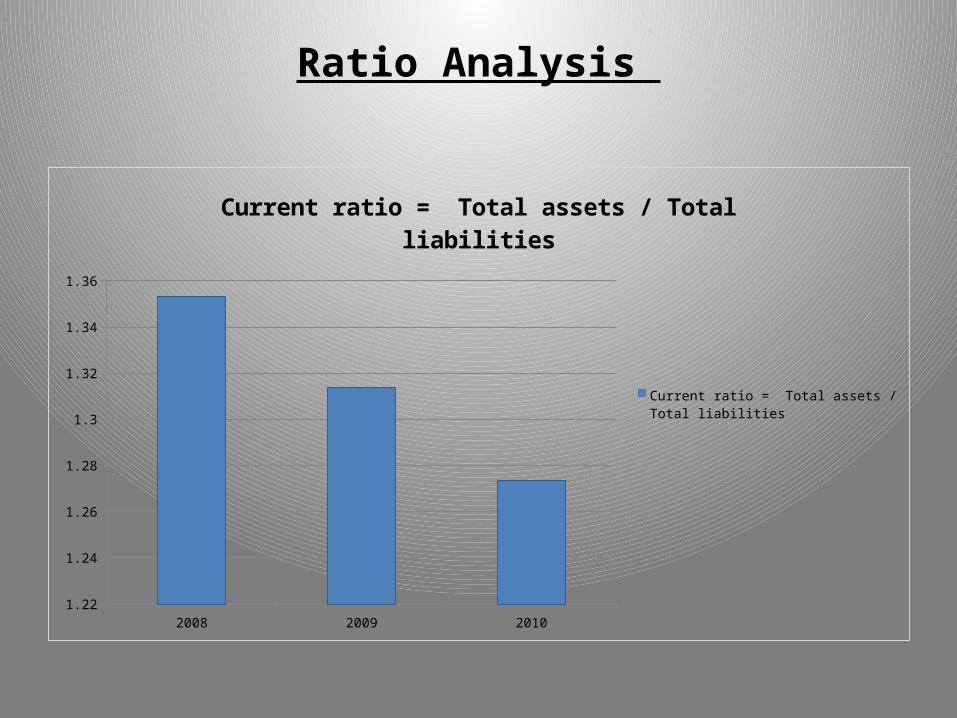
Ratio Analysis
2008 2009 20101.22
1.24
1.26
1.28
1.3
1.32
1.34
1.36
Current ratio = Total assets / Total liabilities
Current ratio = Total assets / Total liabilities

2008 2009 20100
0.1
0.2
0.3
0.4
0.5
0.6
0.7
0.8
0.9
Quick ratio = (Current ratio-Inventories)/ Current liabilities
Quick ratio = (Current ratio-Inventories)/ Current liabilities

2008 2009 20100
0.05
0.1
0.15
0.2
0.25
0.3
0.35
0.4
Cash ratio = (cash+Cash equivalents) / current liabilities
Cash ratio = (cash+Cash equivalents) / current liabilities

2008 2009 20102.95
3
3.05
3.1
3.15
3.2
3.25
3.3
3.35
Inventory Turnover Ratio = cost of good sold / Avg Inventory
Inventory Turnover Ratio = cost of good sold / Avg Inventory

2008 2009 20100
5
10
15
20
25
30
35
40
45
50
Accounts Receivable Ratio = Net credit Ratio / Avg A R
Accounts Receivable Ratio = Net credit Ratio / Avg A R
2008 2009 20100
5
10
15
20
25
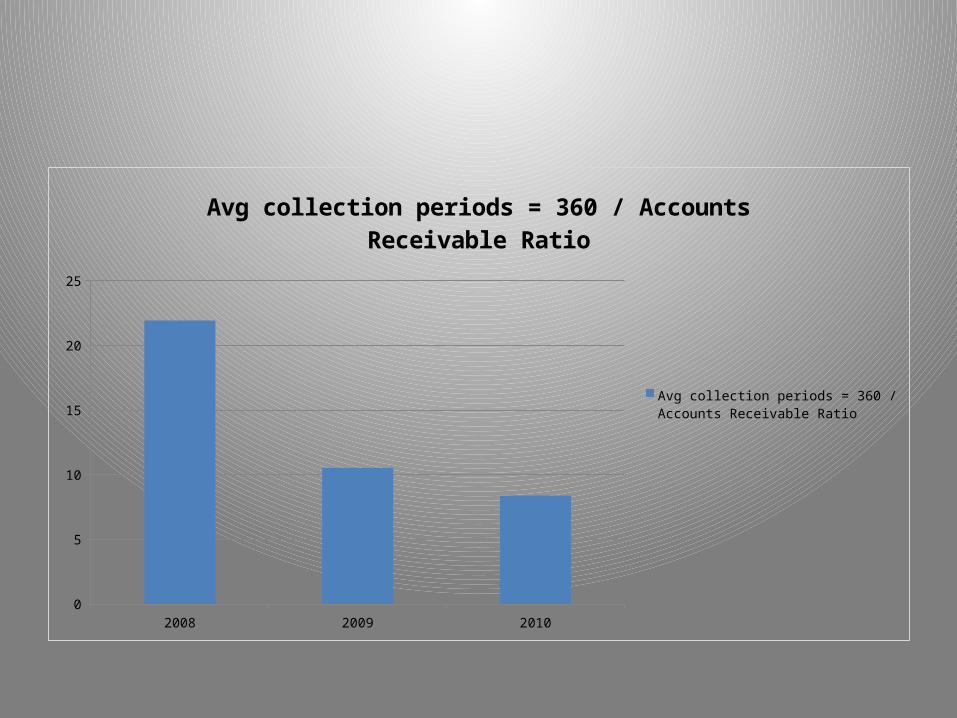
Avg collection periods = 360 / Accounts Receivable Ratio
Avg collection periods = 360 / Accounts Re-ceivable Ratio

2008 2009 20103.6
3.8
4
4.2
4.4
4.6
4.8
Fixed Asset Turnover Ratio = Net sales / Net fixed Assets
Fixed Asset Turnover Ratio = Net sales / Net fixed Assets

2008 2009 20101.3
1.35
1.4
1.45
1.5
1.55
1.6
Total Asset Turn Over = Net Sales / Net Fixed Assets
Total Asset Turn Over = Net Sales / Net Fixed Assets

2008 2009 20100.51
0.52
0.53
0.54
0.55
0.56
0.57
0.58
Dept To Asset Ratio = Total Liabilities/ Total assets
Dept To Asset Ratio = Total Liabilities/ Total assets
2008 2009 20100.105
0.11
0.115
0.12
0.125
0.13
0.135
0.14
0.145
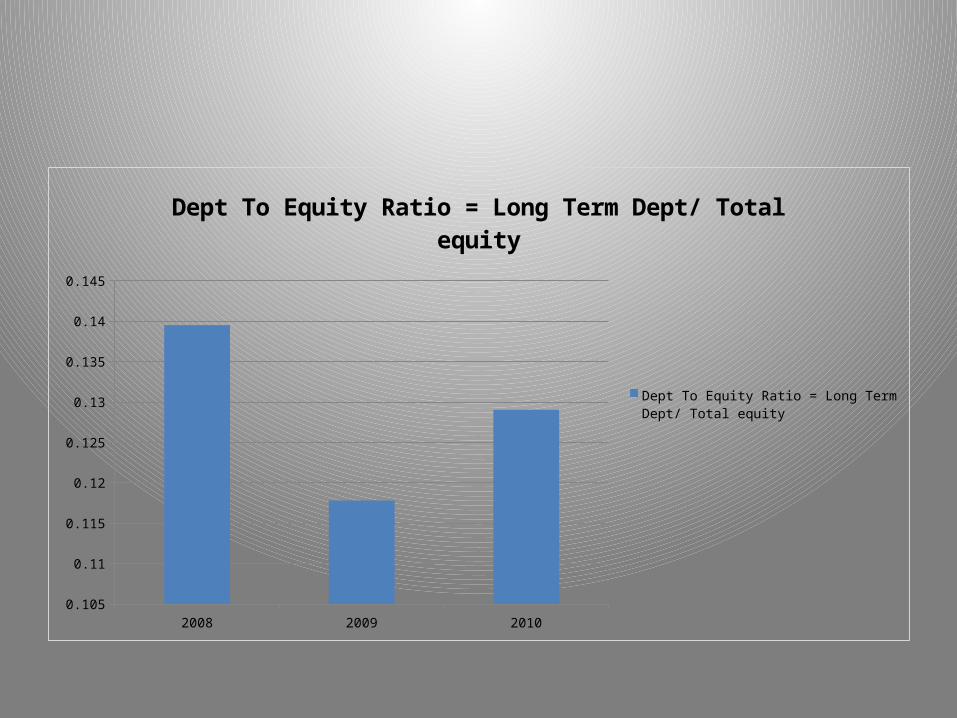
Dept To Equity Ratio = Long Term Dept/ Total equity
Dept To Equity Ratio = Long Term Dept/ Total equity

2008 2009 20100
10
20
30
40
50
60
Times Interest Earned = EBIT /Interest Expense
Times Interest Earned = EBIT /Interest Expense
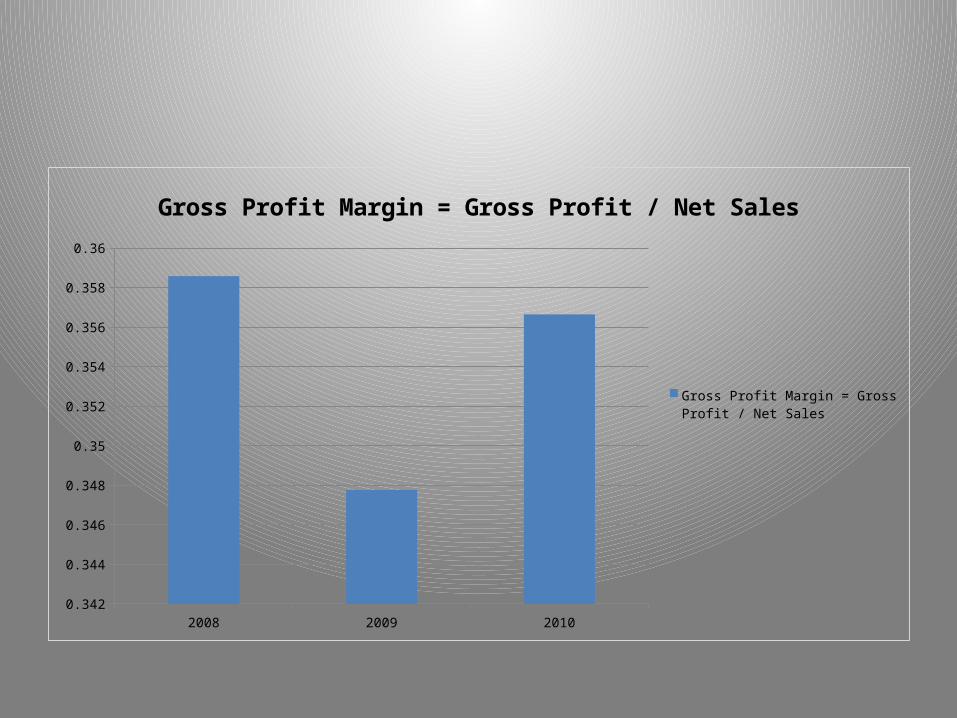
2008 2009 20100.342
0.344
0.346
0.348
0.35
0.352
0.354
0.356
0.358
0.36
Gross Profit Margin = Gross Profit / Net Sales
Gross Profit Margin = Gross Profit / Net Sales
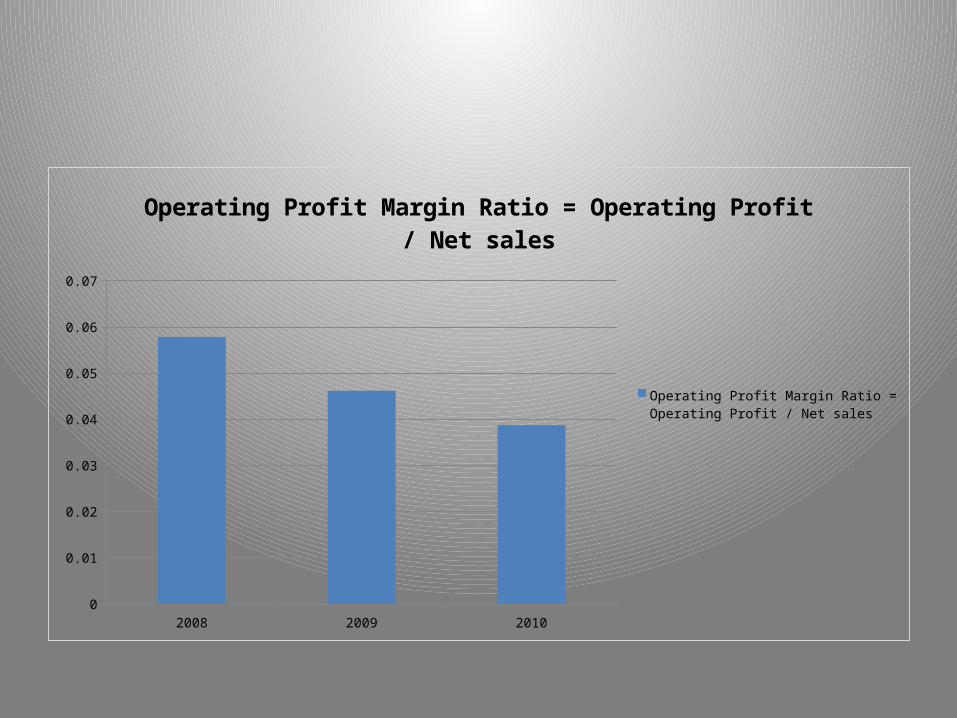
2008 2009 20100
0.01
0.02
0.03
0.04
0.05
0.06
0.07
Operating Profit Margin Ratio = Operating Profit / Net sales
Operating Profit Margin Ratio = Operating Profit / Net sales
2008 2009 20100
0.01
0.02
0.03
0.04
0.05
0.06
0.07
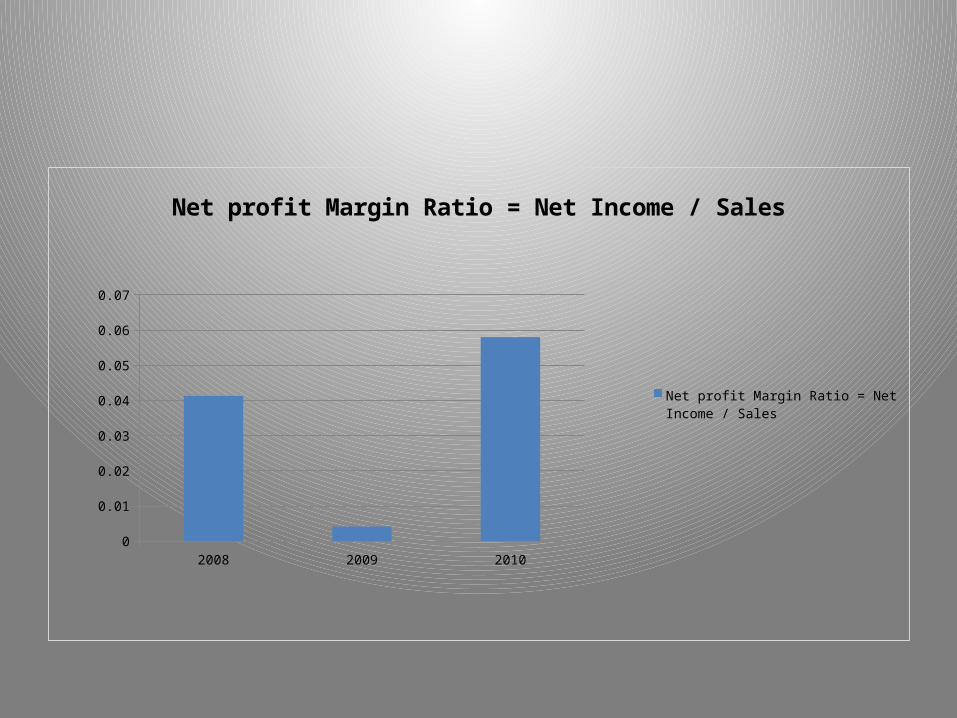
Net profit Margin Ratio = Net Income / Sales
Net profit Margin Ratio = Net Income / Sales

2008 2009 20100
0.01
0.02
0.03
0.04
0.05
0.06
0.07
0.08
0.09
0.1
ROA = Net Income / Total Assets
ROA = Net Income / Total Assets
2008 2009 20100
0.05
0.1
0.15
0.2
0.25
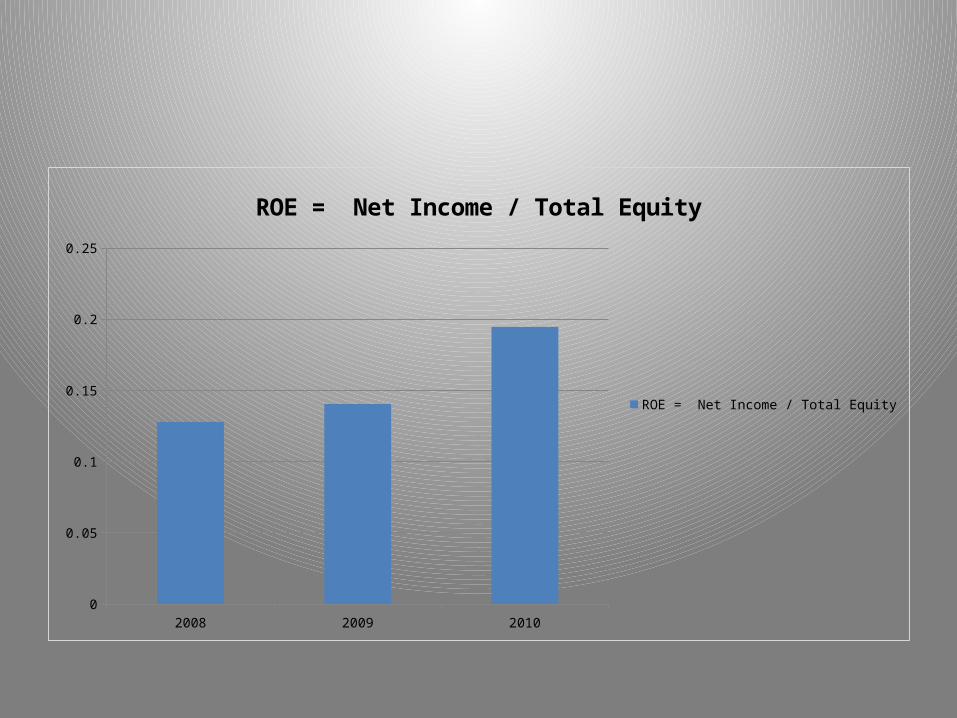
ROE = Net Income / Total Equity
ROE = Net Income / Total Equity
Project Analysis and Findings
• They have a strong position in the market.
• They have durable brand standing in share market.
• BAT is likely to generate free cash flows despite various expenses
like restructuring & dividend payments to the shareholders as it has sufficient internal liquidity, cash flow & access to capital markets.
• BAT was able to main asset utilization which was on par with the industry average.
• Growing profitability would benefit the companies’ debt protection metrics to a greater extent.
Conclusion
• British American Tobacco Group was formed at the turn of the 20th century with the objective of establishing a worldwide business.
• The 3 years financial data show a growing trend of the company.
• BAT registered a growth of 20%.British American Tobacco delivered promising results and sustainable growth while other companies struggled in the tough economic climate.


THANK YOU


