103/25/04 NGA Workshop Parameterization of Basin Response Based on 3D Simulations by PEER/SCEC 3D...
28
1 03/25/0 NGA Workshop Parameterization of Basin Response Based on 3D Simulations by PEER/SCEC 3D Ground Motion Project Team PI: Steven M. Day San Diego State University March 25, 2004
-
date post
20-Dec-2015 -
Category
Documents
-
view
213 -
download
0
Transcript of 103/25/04 NGA Workshop Parameterization of Basin Response Based on 3D Simulations by PEER/SCEC 3D...

1 03/25/04 NGA Workshop
Parameterization of Basin Response Based on 3D Simulations
byPEER/SCEC 3D Ground Motion Project Team
PI: Steven M. DaySan Diego State University
March 25, 2004

2 03/25/04 NGA Workshop
Simulations Completed
– 85 different earthquake simulations
• 10 faults from SCEC Community Fault Model
• 6 rupture scenarios for each (hypocenter and slip model variations)
• 10 cross-check simulations (1 per fault)
• 15 1D reference simulations
3 03/25/04 NGA Workshop
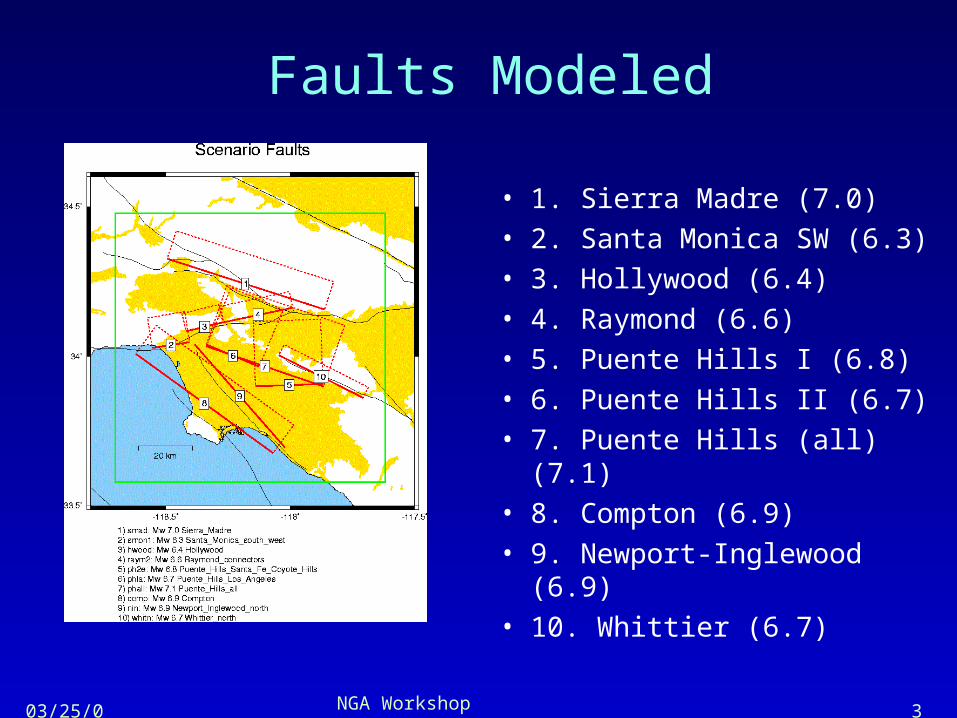
Faults Modeled
• 1. Sierra Madre (7.0)• 2. Santa Monica SW (6.3)• 3. Hollywood (6.4)• 4. Raymond (6.6)• 5. Puente Hills I (6.8)• 6. Puente Hills II (6.7)• 7. Puente Hills (all) (7.1)• 8. Compton (6.9)• 9. Newport-Inglewood (6.9)• 10. Whittier (6.7)

4 03/25/04 NGA Workshop
Six Rupture Scenarios Per Fault
• 2 hypocenters
– 1/4 fault-length from each end
– 7/10 fault-width down dip
• 3 slip models
– Constructed following Somerville (1999)
– Constant rupture velocity (2.8 km/s)
– Rise time scaled to empirical formula:
Log(Tr)=0.5(Mw+10.7) + log(2.9x10⁻⁹)

5 03/25/04 NGA Workshop
Coordination SchemeUCB -LLNL UCSB CMU URS (RG) URS (AP)
S. Madre F,R,S C
S. Mon. F,R C
HollyW F,R C
Raym F,R C
P.Hills6.8 F,R C
P.Hills6.7 F,R C
P.Hills7.1 F,R,R,S C
Comp F,R,S C
N-I N. R,S F C
Whit N. R F C
F = 6 3D scenariosC = single cross-check
R = 1D rock reference simulation
S = 1D basin-profile simulation

6 03/25/04 NGA Workshop
Output
• Full time histories
• 3 velocity components
• 1600 surface points per simulation
• Basin and rock sites sampled
• ~300,000 synthetic time histories and associated metadata in digital library

7 03/25/04 NGA Workshop
Cross-check (cont’d)
• Sierra Madre Scenario
• Compares FD and FE codes at 16 sites (N-S component):
– FD (UCB/LLNL) red– FE (CMU) green

8 03/25/04 NGA Workshop
Response Spectra Data Set
• synthetic Sa ordinates (2-10 second period range)
• source distances
• local basin depth measures (depths to 1.0, 1.5, 2.5, and 3.5 km/s isosurfaces)
• Sa files available on web

9 03/25/04 NGA Workshop
3D÷1D_rock Sa Ratios
Frequency (Hz)
ln(S
a R
atio
)F
requ
ency
(H
z)

10 03/25/04 NGA Workshop
Vertically Incident SH Response
ln(S
a R
atio
)F
requ
ency
(H
z)
Frequency (Hz)

11 03/25/04 NGA Workshop
Basin Depth Effect Curves

12 03/25/04 NGA Workshop
Curve Fits to Basin Depth Effect(Separately Optimized at Each Period)

13 03/25/04 NGA Workshop
Curve Fits to Basin Depth Effect(6-parameter model for Depth and Period Dependence)

14 03/25/04 NGA Workshop
Basin Effect Relative to 1-D Soil (2000 m Depth to Isosurface)
15 03/25/04 NGA Workshop
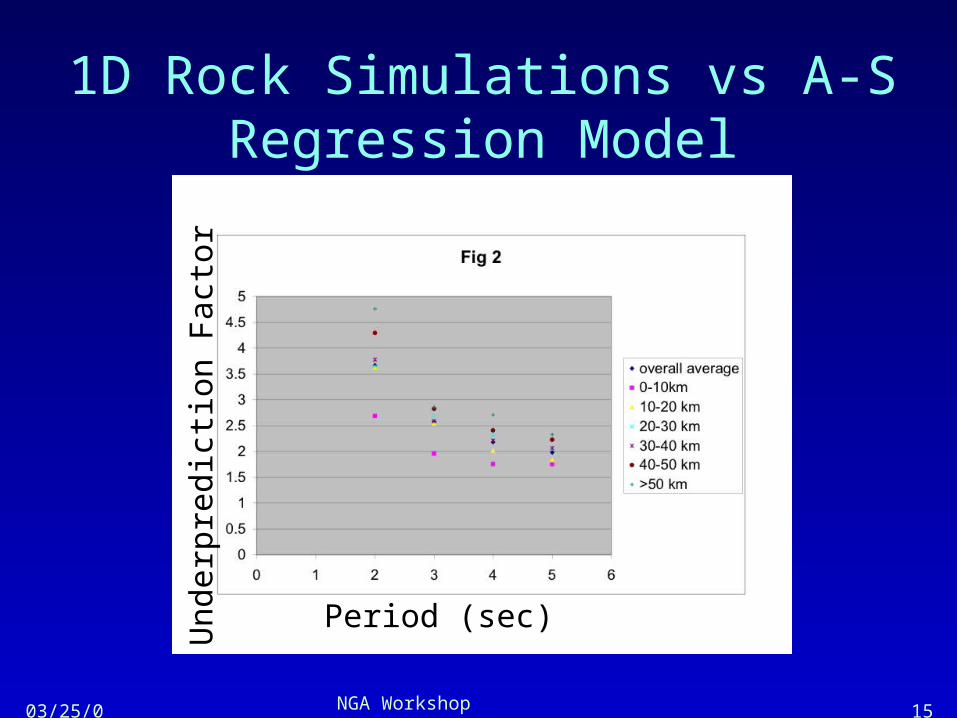
1D Rock Simulations vs A-S Regression Model
Period (sec)
Und
erpr
edic
tion
Fac
tor

16 03/25/04 NGA Workshop
Transfer Function from “Very Hard Rock” to Boore/Joyner “Generic Rock”

17 03/25/04 NGA Workshop

18 03/25/04 NGA Workshop
1.5 Km/s Isosurface Map
19 03/25/04 NGA Workshop
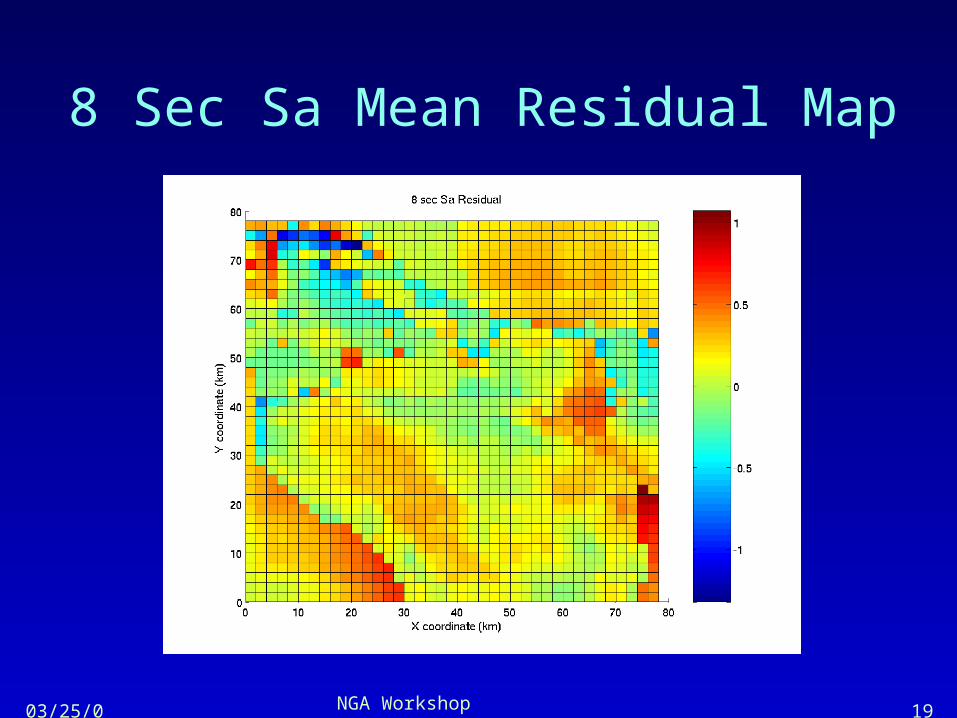
8 Sec Sa Mean Residual Map

20 03/25/04 NGA Workshop
5 Sec Sa Mean Residual Map

21 03/25/04 NGA Workshop
3 Sec Sa Mean Residual Map
22 03/25/04 NGA Workshop
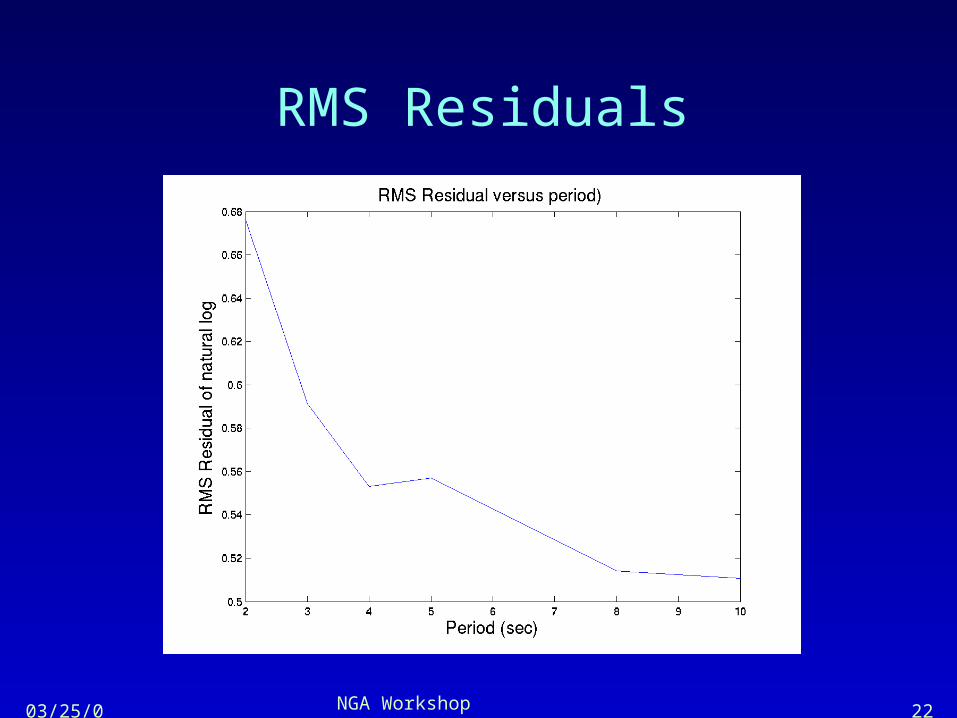
RMS Residuals
23 03/25/04 NGA Workshop
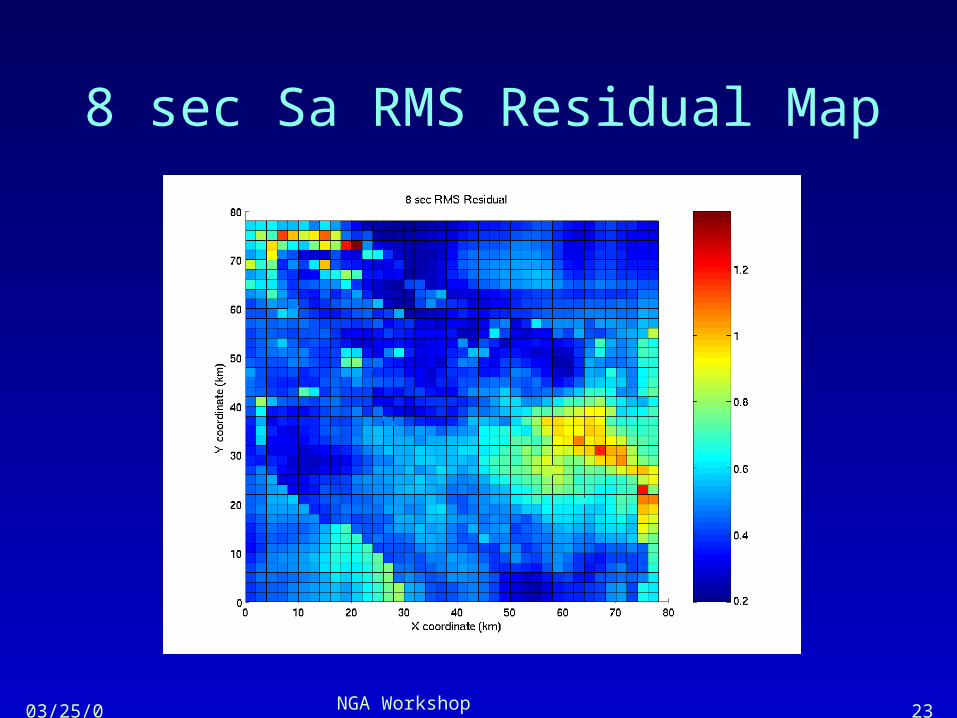
8 sec Sa RMS Residual Map

24 03/25/04 NGA Workshop
5 sec Sa RMS Residual Map

25 03/25/04 NGA Workshop
3 sec Sa RMS Residual Map

26 03/25/04 NGA Workshop
Summary• Source-averaged 3D effect is largely captured by basin depth
term (depth to 1.5 km/s isosurface)
• Mean and variance are period-dependent
• Results almost certainly double-count effects partially represented in “rock” regression equations
• With ~500 m depth sites (instead of 0 depth) taken as “rock” reference:– absolute amplitudes at long period (5 sec) come into agreement with
A-S rock regression (i.e., under-prediction eliminated)– Addition under-prediction at shorter periods probably partly a source
effect (which would be removed by our analysis of ratios)– Maximum basin effect reduced to ~2 (@ 2 sec) to ~3 (@ 10 sec)

27 03/25/04 NGA Workshop
Summary (cont’d)
• Little or no systematic basin-edge effect in source-averaged residuals
• Likewise, no clear basin-edge effect in source-averaged standard deviations
28 03/25/04 NGA Workshop
Directions for Additional Work
• Analysis of current synthetic data set for
– Basin-specific (e.g., L.A., San Fernando, San Gabriel) variations– Event-specific basin effects
• Simulations for additional regions (e.g., Santa Clara Valley? Imperial Valley? others) to examine transportability of results
• Push simulations to ~1 Hz