103-2012: CSI: Customer Segmentation Intelligence for...
13
1 Figure 1: Customer Segmentation Intelligence for Increasing Profits Paper 103-2012 CSI: Customer Segmentation Intelligence for Increasing Profits Darius Baer, Ph.D., SAS Institute Inc., Cary, NC ABSTRACT What will your customer do next? Customers behave differently; they are not all average. Can you simultaneously meet your customers’ needs and improve profitability? You can by communicating and providing better offers to customers based on their behavior and demographics. Segmentation gives you the ability to group customers in many ways: 1) Business rules; 2) Supervised clustering – decision trees, and so on; 3) Unsupervised clustering; 4) Creating segments based on quantile membership. Which one works? That depends on two factors: the business goal and customer attributes. Do you want to increase share of wallet, market share, customer satisfaction, or all three? This presentation covers roles played by business issues and available data, and which SAS ® segmentation technique is appropriate for particular situations. INTRODUCTION What will your customer do next? Customers behave differently – they are not all average. Because customers behave differently, one can use segmentation methods to group the customers by common needs and attributes. If you treat all your customers the same through offers and communication, you will only completely satisfy a small portion of purchasers, resulting in smaller profits. Segmenting your customers into groups based on the differences between groups as well as similarities within each group enables a more targeted customer relationship, resulting in higher profitability and customer satisfaction. Good marketing is defined as successfully meeting your customers’ needs and wants while driving profits for your own business. Customer Segmentation Intelligence (CSI) leads to better marketing as you best meet the needs of each customer segment. Understanding your customer grouping similarities enables you to interact better with offers and communications. This paper will define segmentation and explain its value. Four segmentation approaches will be presented with detailed explanations of how to implement and when to use each one. Note that this paper does not review the methods for writing SAS code, building decision trees, or applying clustering methods. That information can be obtained from various SAS tools and solutions as well as SAS ® Enterprise Miner™ documentation. Technical education on these topics is available from SAS Institute. However, included in this paper, you will find sections of code that might be useful in implementing some of the recommended segmentation strategies. WHY SEGMENTATION? Segmentation is the practice of categorizing or classifying items or subjects into identifiable groups that share similar features. Features can be based on demographics, purchase patterns, needs, want, and so on. Notice from the left group in Figure 1 that only the average customers inside the center dotted circle are happy. The company is treating all customers the same as if they were all average. However, that applies to only that small set in the center dotted region. The others are sad because their needs/wants are not being addressed. If you intelligently segment your customers into groups that can be treated differently and in accordance to their needs/wants, you should be able to make almost all customers happy as shown in the middle group. And, your profits should grow as your new and existing customers become more loyal and advocates for your brand, as in the group on the right. Customers Treated the Same Segmentation Intelligence $ $ Segmentation for Profitability $ $ $ $ $ $ $ $ $ $ $ $ $ $ $ Customer Intelligence SAS Global Forum 2012
Transcript of 103-2012: CSI: Customer Segmentation Intelligence for...

1
Figure 1: Customer Segmentation Intelligence for Increasing Profits
Paper 103-2012
CSI: Customer Segmentation Intelligence for Increasing Profits
Darius Baer, Ph.D., SAS Institute Inc., Cary, NC
ABSTRACT
What will your customer do next? Customers behave differently; they are not all average. Can you simultaneously meet your customers’ needs and improve profitability? You can by communicating and providing better offers to customers based on their behavior and demographics. Segmentation gives you the ability to group customers in many ways: 1) Business rules; 2) Supervised clustering – decision trees, and so on; 3) Unsupervised clustering; 4) Creating segments based on quantile membership. Which one works? That depends on two factors: the business goal and customer attributes. Do you want to increase share of wallet, market share, customer satisfaction, or all three? This presentation covers roles played by business issues and available data, and which SAS
® segmentation
technique is appropriate for particular situations.
INTRODUCTION
What will your customer do next? Customers behave differently – they are not all average. Because customers behave differently, one can use segmentation methods to group the customers by common needs and attributes. If you treat all your customers the same through offers and communication, you will only completely satisfy a small portion of purchasers, resulting in smaller profits. Segmenting your customers into groups based on the differences between groups as well as similarities within each group enables a more targeted customer relationship, resulting in higher profitability and customer satisfaction. Good marketing is defined as successfully meeting your customers’ needs and wants while driving profits for your own business. Customer Segmentation Intelligence (CSI) leads to better marketing as you best meet the needs of each customer segment. Understanding your customer grouping similarities enables you to interact better with offers and communications.
This paper will define segmentation and explain its value. Four segmentation approaches will be presented with detailed explanations of how to implement and when to use each one. Note that this paper does not review the methods for writing SAS code, building decision trees, or applying clustering methods. That information can be obtained from various SAS tools and solutions as well as SAS
® Enterprise Miner™ documentation. Technical
education on these topics is available from SAS Institute. However, included in this paper, you will find sections of code that might be useful in implementing some of the recommended segmentation strategies.
WHY SEGMENTATION?
Segmentation is the practice of categorizing or classifying items or subjects into identifiable groups that share similar features. Features can be based on demographics, purchase patterns, needs, want, and so on. Notice from the left group in Figure 1 that only the average customers inside the center dotted circle are happy. The company is treating all customers the same as if they were all average. However, that applies to only that small set in the center dotted region. The others are sad because their needs/wants are not being addressed. If you intelligently segment your customers into groups that can be treated differently and in accordance to their needs/wants, you should be able to make almost all customers happy as shown in the middle group. And, your profits should grow as your new and existing customers become more loyal and advocates for your brand, as in the group on the right.
Customers Treated the Same
Segmentation Intelligence
$
$
Segmentation for Profitability
$
$
$ $
$
$
$ $
$ $
$ $
$
$ $
Customer IntelligenceSAS Global Forum 2012

CSI: Customer Segmentation Intelligence for Increasing Profits, continued
2
How should you use your segmentation? There is no right answer. You must define your business goal prior to segmentation. Segmentation without a goal has no value. Do you want segments that have different product preferences? Are you looking for segments with different kinds of loyalty? Would you like to move customers from less profitable to more profitable segments? If you know the segment attributes, you can market appropriately.
You might want to treat the customers in each segment differently, or you might want to use the segments in further analysis. Using the created segments directly, you can build campaign, communication, and marketing mix strategies to precisely match the expectations of customers in the targeted segments. Because different attributes can drive customers to behave differently, one can also run additional predictive analytic models within each segment. For example, you can predict the likelihood of responding to an offer to buy a product. However, since you might want to sell different products to different segments, you would be better off building different propensity models for each segment. This usually increases the signal-to-noise ratio, or predictive accuracy, of each model compared to building one model for all customers.
There are two major ways to increase customer profit. The first is by increasing market share – you get more customers. The second is by increasing share of wallet – you get more money from each customer. In both cases, segmentation enables you to treat customers differently based on the segment that each prospect or customer belongs to. Because what drives one customer to buy might be different from other customers, segmentation enables you to increase profitability while positively addressing customer satisfaction.
This paper will review general methods of segmentation as well as the benefits of using each approach. Customer Relationship Management (CRM) infers by its name that you will do business with and communicate with your customers in a manner that best meets their needs. Of course, this will be done as efficiently as possible to enable maximum profits. This is the reason for applying Customer Segmentation Intelligence within your CRM process.
So, how many segments should you have? We segment in order to manage our marketing initiatives spanning millions of customers. Our intent of CRM is to provide individual relationships with each customer, optimizing his/her
satisfaction and ultimately optimizing the total customer profitability. You can’t design 1 million discrete campaign objectives. So we segment as a compromise between marketing to each customer individually and treating all customers the same. This enables a type of 1:1 marketing. As shown in Figure 2, you want to have enough segments to treat customers according to their needs/wants without the effort becoming unmanageable.
Segmentation can be executed using strictly business rules, applying statistical clustering, or some combination of the two. In this paper, we
will define the term segmentation as a process of grouping observations or customers. Clustering will then be defined as a subset of segmentation that uses a statistical approach that analyzes the data relationships.
There are two main business reasons for segmenting your customers. You might want to treat the customers in each segment differently, or you might want to use the segments in further analysis. For example, the different segments could be analyzed separately for propensity to respond to an offer to buy a product or service. Assuming that the drivers for responding are different, the models within each segment might account for a greater proportion of the variance than if you build a model over all customers.
There are four general methods to group or segment customers:
1. Business rules – this does not include the use of clustering.
2. Creating segments based on quantile membership. Although this does not use clustering, grouping is performed by assessing the univariate statistics of customer attributes.
3. Supervised clustering – decision trees and so on.
4. Unsupervised clustering.
Of the four methods, only the last, unsupervised clustering, is not directed by values of specific variables. The business rules method is directed by specific, predetermined values of the attributes used. The quantile membership method is also directed by specific values of the attributes used. However, the values are obtained from binning using descriptive statistics. Supervised clustering using decision trees is directed by the values of the target or dependent variable. Unsupervised clustering measures the similarity of the customers with one another to form the groups.
One Segment Everyone Together
Enough Segments –
Not too Many - ~ 5-20
Each Customer is a
Segment
Segmentation – How Many Segments? Manageability
Best Compromise Purity
Figure 2: How Many Segments?
Customer IntelligenceSAS Global Forum 2012

CSI: Customer Segmentation Intelligence for Increasing Profits, continued
3
Which works the best? That depends on two factors: the business goal and customer attributes. The business goal must drive which segmentation process will be used. However, that will depend on the customer attribute data that are available as well as the importance of the customer attributes in building the segmentation models. Unless you have a specific attribute or small set of attributes that you would like to use for segmentation, you would be better off using the unsupervised approach.
In the next sections following the general examples, you will read a synopsis of each approach with examples and advantages and disadvantages. This should enable you to make a more informed decision about which segmentation method will work best for you.
EXAMPLES OF SEGMENTATION IN INDUSTRY
The catalog company and bank examples are inspired by examples obtained from Randall Collica’s book, Customer Segmentation and Clustering using SAS
® Enterprise Miner™.
Consider the use of segmentation in a catalog company where you have 10 million customers. The product offering is so large that the catalog company cannot offer all of its product offerings to all 10 million customers, especially in a single catalog. As well, treating all customers the same by offering only 1 catalog is cost prohibitive because the catalog would have to appeal to all segments, and each customer would have to search the huge catalog to find the desired items. Therefore, the cataloger uses the customer data by segmenting the customers into groups based on their demographic and purchase pattern attributes. Each customer segment then is provided with a catalog designed specifically for that segment. A catalog for a teen segment would be very different from the one designed for middle-aged adults. This is not quite a one-to-one approach but a one-to-many approach where the many are similar to one another and can be treated the same. This approach is manageable and increases customers’ responsiveness to the catalog company.
Many on-line companies are now using segmentation to provide more individualized recommendations to their customers similar to what catalog companies have done. Based on information gathered from past purchases, customers are shown different items within a web page or even different web pages. Treating customers differently makes for a more enjoyable experience and a higher likelihood of purchase.
In another example, a retail bank desires to improve its revenue and hence its profitability by cross-selling and up-selling its portfolio of products and services. By segmenting the customers (using statistical clustering) according to their current use of the bank’s products and services, distinct patterns in the clusters appear. These include (1) middle-aged customers who have a checking and savings account with fairly healthy balances, (2) young customers who take advantage of more recent technological innovations, and (3) older customers who could use some retirement plans, and so on. Seeing these results, the bank might up-sell middle-aged customers with healthy balances to have multiple accounts. Younger customers would be encouraged to use online banking, which is more profitable. Older customers would be cross-sold retirement plans. This type of analysis leverages the specific business goals and the needs/wants of the customer base.
In the health care industry, it is important to understand the needs/wants of different groups to provide the desired benefits at the right cost. Some people want more preventive health care because they take better care of themselves. Other people want protection against catastrophic events, but are less concerned about regular health care. Some are willing to pay for everything. If the health care company segments the customers into meaningful groups, the results will be health care that better meets the needs/wants of the customers and higher profitability for the health care providers and administrators.
BUSINESS RULES
The simplest and most direct method of segmentation is the application of business rules. When we use business rules, we assign each customer to a group according to predetermined classes. This is in contrast to clustering where a statistical algorithm is used to determine the group according to measures of attribute similarity. Examples of applying business rules might include grouping based on demographics of age, gender, income, education attained, and so on. Grouping can also be done based on the interaction that a customer has with the company, such as types of merchandise or service purchased, amount of money spent, when, how, and where the purchase is made (Internet, brick-and-mortar store, phone), and so on. Recency (that is, when did customers last shop?), Frequency (that is, how often did customer shop?), and Monetary value (that is, how much did customers spend?) known collectively as RFM segmentations, are often a foundation method used to group customers. This can be done by applying rules for creating the groups (that is, customers having shopped within the past 2 months and shopped 20 times over the past year and spent an average of $50 or more per week are in a “Gold Segment”) or by using univariate statistics to create quantiles, which will enable grouping (that is, top 10% of customers on the basis of RFM are the “Gold Segment”). The latter is covered in the second approach.
It is easy to code business rule segmentation using SAS as shown in this example:
Customer IntelligenceSAS Global Forum 2012

CSI: Customer Segmentation Intelligence for Increasing Profits, continued
4
Data Groups;
Set customer_data;
If gender = ‘F’ and age < 25 then segment = ‘Younger_Female’;
Else if gender = ‘F’ and age < 55 then segment = ‘Middle_Female ’;
Else if gender = ‘F’ and age >= 55 then segment = ‘Older_Female ’;
Else if gender = ‘M’ and age < 25 then segment = ‘Younger_Male ’;
Else if gender = ‘M’ and age < 55 then segment = ‘Middle_Male ’;
Else if gender = ‘M’ and age >= 55 then segment = ‘Older_Male ’;
Run;
By creating segments this way, one can communicate differently with each group. However, the assumption is made that the differences between the groups are meaningful. This implies that the customers within each group will behave differently based on their group membership resulting in increased loyalty as well as increased customer acquisitions.
Business Rules Advantages:
Consistent with business goals
Easy to apply
Business Rules Disadvantages:
Might not reflect the reality of customer behavior
Some segments might not be significantly different from one another
QUANTILE MEMBERSHIP
Creating segments based on quantile membership uses attribute frequencies to determine segment membership. With business rules, the grouping definitions are predetermined. With the quantile approach, univariate data analysis determines the groupings. The quantile approach is often used to create groups using customer purchase behavior attributes such as Recency, Frequency, and Monetary (RFM). Recency is the length of time since the most recent purchase. Frequency is the number of purchases within a defined time period. Monetary value can be the amount of money spent per purchase or in some cases per customer within a time period. However, the latter example of calculating monetary segmentation will conflict with frequency. The time period chosen is a very important decision. You want to have a long enough time period to include all “active” customers. Yet, you want a short enough time period that the historical behavior provides a reasonable pattern of behavior going forward.
Using the RFM attributes to create segments, one can divide each metric into a number of quantiles. Experience has shown that dividing the metrics into quintiles (5 quantiles) provides the best amplification of signal without introducing too much noise into the segments. You could use just 3 groups for each metric. However, that might not provide sufficient discrimination among customers. Using 7 groups provides little additional understanding of the customer population while adding to what must be interpreted. Therefore, 5 quantiles (also known as quintiles) is recommended.
For example, suppose the time period chosen is 2 years with a reasonably active customer population. Using the following SAS code, one could easily determine the quintile boundaries for all 3 RFM metrics:
proc univariate data = outdata.customers;
var recency frequency monetary;
output out = outdata.customers_RFM
mean = recency_mean frequency_mean monetary_mean
median = recency_med frequency_med monetary_med
pctlpts = 0 20 40 60 80 100
pctlpre = recency_ frequency_ monetary_
pctlname = pct00 pct20 pct40 pct60 pct80 pct100;
run;
Suppose we had 1 million customers. After running the code, the quintiles for recency would have 200,000 customers each and might be divided as follows:
1) 0-14 days 2) 15-32 days 3) 33-77 days 4) 78-234 days 5) 235-730 days
One would also obtain quintiles for frequency and monetary. Suppose we assign the most valuable quintile for each metric the classification “A” and the least valuable an “E”. After combining all 3 RFM metrics, we would end up with 125 groups from AAA to EEE. With our 1 million customers, each of the 125 segments would have 8,000 customers.
Customer IntelligenceSAS Global Forum 2012

CSI: Customer Segmentation Intelligence for Increasing Profits, continued
5
From a marketing perspective, this might be difficult to manage as well as not cost-effective. You might decide, therefore, to reduce the number of groups by different methods.
Any customer with an A or a B (the top 2 quintiles) in all of the 3 RFM metrics might be considered to be a “very valuable” customer. From our 1 million sample, this would be 8 of the groups, or 64,000 top customers. You would want to let them know on a regular basis how much you appreciate them and even provide certain tokens of that appreciation. Customers with a D or E in all of the 3 RFM metrics might be considered to be a “low value” customer. You might want to spend very little if any resources on these customers. In fact, these customers might cost more to support than they bring in revenue. This would be another 64,000 customers. Other groups might include those that had good frequency (A or B), and good monetary (A or B), but the recency is poor (D or E) – you haven’t seen them for a while. You would want to create a promotion to bring them back. Once again, this would be another 64,000 customers. There will be groups that include good frequency and monetary, but low frequency. You could increase frequency by promoting increased visits to purchase. By following this approach you could collapse the number of groups to as little as 8-20, which would be much more manageable. Notice, though, that we started with 125 groups so as to better organize them into what works best from a marketing perspective. Had we chosen only 3 levels for each RFM metric, we would have been “stuck” with 27 groups that might not meet our marketing needs.
If we look at RFM with only frequency and monetary, Table 1 illustrates how from a marketing perspective we might group segments created with quintiles. Suppose these are our 1 million grocery shoppers nationwide and each
customer has an average spend per trip and number of visits over the last 6 months. We might choose to treat the 25 segments as just 3 groups:
Most Valuable – green colored
Average Value – yellow colored
Least Valuable – red colored
The use of RFM in marketing is to keep the strong bond with good customers and to improve the bond with customers who have weaknesses in one or more areas. However, if you think about the life cycle of a customer, you might want to keep those customers who have mediocre RFM values because in the long term they might prove to be more
valuable. Therefore, RFM does not answer marketing issues. It simply provides the segmented data with which to make better marketing decisions. RFM is not predictive; it is only descriptive. Of course, it assumes that past behavior is indicative of future behavior. However, if you change the interaction with the customer, the future behavior might change.
Quantile Membership Advantages:
Clearly reflects segments based on chosen metrics.
Easy to apply.
Quantile Membership Disadvantages:
Does not provide a mechanism to forecast behavior as a predictive model might.
Metrics for segmentation pre-chosen. Better segments might be obtained with a different set of attributes.
SUPERVISED CLUSTERING USING DECISION TREES
Segmentation using supervised clustering requires that one specify a target or dependent variable. You are predicting differences of the target variable based on the input or independent variables. This approach is in contrast to the previous 2 methods. If you wanted to determine which customers were likely to buy based on an offer, you would most likely give that offer to your most valuable customers. However, you would be imposing human bias in this process by taking an educated guess at which customers are most likely to buy. With the supervised clustering approach, you can predict the likelihood of customers responding to an offer based on previous purchase patterns and their demographics. Using the decision tree method with SAS Enterprise Miner, you would end up with different groups that would be leaves on the tree. Each group would have a probability of responding to the offer and would be different from the other groups based on the group’s attributes. It is important to recognize that the use of supervised clustering means that the segmentation is directed by each customer’s value of the target variable. This narrows the arena within which you can apply the results. You could not take the likelihood of responding to an offer and use that to understand customer differences for e-mail receiving preferences.
Spend / Trips 1-3 4-9 10-19 20-29 >30
<$10
$10-$24
$25-$49
$50-$99
>$99
Table 1: Monetary and Frequency Segments
Customer IntelligenceSAS Global Forum 2012

CSI: Customer Segmentation Intelligence for Increasing Profits, continued
6
Figure 3 is an example of a decision tree built with a binary target variable of bad loan, which means the customer is likely to default on his/her second mortgage. What we find when we observe the first two levels of the tree is that there are three end-leaf segments created based on two attributes:
DEBTINC – Debt to Income Ratio – higher values indicate greater indebtedness.
DELINQ – The number of mortgage payment delinquencies over the past three years – a non-zero value is bad.
Figure 3: Customer Bad Loan Decision Tree
We see that customers with a Debt to Income Ratio less than 45 are good loan risks – they have a likelihood of defaulting of 7%. Of the rest with a Debt to Income Ratio greater than 45, those who have also been seriously late in paying their first mortgage have an 83% likelihood of defaulting on their second mortgage. And, even those who do not have any delinquencies still have a 45% likelihood of default. With just these 3 segments, the mortgage company can make some very important loan approval decisions based on which segment a loan applicant falls into.
Although decision trees are not often thought of when performing segmentation, they can be useful both for:
Marketing purposes. The different segments can be marketed to differently.
Getting a better understanding of the different customer groups depending on the target variable, be it likelihood to churn or likelihood to respond to an offer or even likelihood to default on a loan.
Decision trees provide insight to enable your CRM efforts – treating customers according to their needs and desires.
Although the supervised clustering method is very powerful, it is appropriate only for situations where a target variable has been established and the business problem to be addressed is based on that target variable. Otherwise, you might do better to use the unsupervised approach. Even if you have a business problem that does use a target variable, you might still get better results by segmenting your customer population prior to building your predictive models because what drives customers in each segment to each target value could be different.
Supervised Clustering Advantages:
Consistent with a specific business goal
Can correlate the target with other customer attributes
Supervised Clustering Disadvantages:
Only reflects one aspect of customer behavior
Assumes that the drivers of the target will remain the same in the future
Customer IntelligenceSAS Global Forum 2012

CSI: Customer Segmentation Intelligence for Increasing Profits, continued
7
UNSUPERVISED CLUSTERING
Unsupervised clustering is defined by grouping customers according to similarity over a set of metrics. There is no a priori direction you should go. Of course, you do have to choose the metrics with which you will group your customers. As stated earlier, these metrics might be demographic and/or purchase behavior. The metrics often have different types (numeric, character) and scales (binary, ordinal, interval, and nominal). Many statistical clustering methods require the data used to be numeric and interval. If you have non-interval variables, you will have to convert those variables to interval using DATA step code or automated methods in SAS Enterprise Miner or other SAS solutions. Of course, binary variables can be converted easily by recoding one value to a 0 and the other to a 1. Ordinal variables must either be viewed as being interval in nature or nominal. Nominal variables can be converted to interval by treating each level of the variable as a binary variable. If there are a very large number of levels, this will likely cause problems in the clustering process. It is beyond the scope of this paper to address those issues. However, the author has discovered solutions which resolve those issues.
An example of using unsupervised clustering for segmentation is a grocery chain which would like to provide the best product assortment for its customers at each of its 4000 stores across the country. The grocer keeps data on the following purchase metrics:
Percent of customer spend that is house brand (versus name brand)
Percent of customer spend that is considered “high-end” (versus “middle” versus “low-end”)
Percent of customer spend that is “Organic” (versus Non-Organic)
Percent of customer spend that is Meat (This can be broken down further by Red meat, fish, poultry, etc.)
Percent of customer spend that is Dairy (This can be broken down further by milk, cheese, etc.)
Percent of customer spend that is Produce (This can be broken down further by fruit, vegetable, etc.)
Percent of customer spend that is Canned Grocery
Percent of customer spend that is Boxed Grocery
Percent of customer spend that is Ethnic (This can be broken down further by different ethnicities)
Percent of customer spend that is Miscellaneous
The metrics can be pooled by store. Those customers spending more will have a greater weight on the store metrics. An unsupervised clustering analysis can be run to produce 8-20 segments of store types. These segments might be the following:
Segment A – higher than average spend in High-end, Ethnic, Non-Organic, Produce
Segment B – higher than average spend in Low-end, Non-Ethnic, Boxed Grocery, Dairy
Segment C – higher than average spend in Middle, Non-Ethnic, Organic, Canned Grocery
Etc. through the other segments
These are just hypothetical results from the segmentation. However, they illustrate what the results might look like and provide an example of what the grocer can use for its CRM efforts and marketing. The grocer could decide to provide even more High-end products to the stores in segment A while focusing on more low-cost diary options for Segment B, etc. By acknowledging the differences among the segments, the grocer is likely to increase customer satisfaction which, in turn, will increase customer share of wallet and share of market, as well. This of course, positively impacts profitability.
So, how do we build these unsupervised clusters? First, we must have a way to measure the similarity among customers for each metric. A common method of measuring similarity is to use Euclidean distance. This measures the distance between 2 points in n-dimensional space. For two dimensions, the distance between a point at (3,1) and
(6,5) is found by use of the Pythagorean theorem such that . This equates to . We can quickly solve for the distance c to be 5. The beauty of using Euclidean distance is that it expands to any number of dimensions. Therefore, you can use any number of customer attributes for segmentation using this approach of unsupervised clustering.
The most common method of clustering that uses Euclidean distance is called k-means clustering. It uses the distances to group observations into k clusters where each observation belongs to the cluster with the nearest centroid. The centroids are calculated as the multi-dimensional set of the means of each attribute used for the clustering. SAS has provided a procedure called FASTCLUS that is very accurate and very fast to create clusters
Customer IntelligenceSAS Global Forum 2012

CSI: Customer Segmentation Intelligence for Increasing Profits, continued
8
using the k-means approach. Furthermore, PROC FASTCLUS has the flexibility to allow the user to specify either the number of clusters one desires or the minimum distance required between cluster centroids. This becomes very important from a marketing perspective because specifying the number of segments is often critical.
In marketing, as stated earlier, it is often useful to segment the customer population into groups for differential treatments that improve the profits of the company and lead to higher customer satisfaction. Traditional methods of segmentation including clustering have often resulted in multiple groups that are similar to one another and near the center of the total population of customers. In many cases, one notices a higher density of observations in the center of the values of the contributing attributes of the customers. What is wanted is to obtain a single cluster in the center of the population and the rest of the groups that are as distinct from one another as possible.
This paper will introduce two enhancements to the FASTCLUS procedure that are specific to segmentation using customer data. They are contained in what we call the “Doughnut Method for Cluster Formation”. It is commonly accepted when using the k-means approach to convert the values of the variables or customer attributes to Z-scores based on the mean and standard deviation of each independent variable. This Z-score conversion (called standardization) enables each independent variable or dimension to have more similar contributions to the cluster formations. However, there remain two potential problems. K-Means can lead to clusters with similar numbers of
observations. These clusters can also tend to gravitate toward the dimensional center of the population. These are issues because when managing customers groups, we might want to have smaller groups that are more valuable. We also will likely want to treat all “average” customers the same rather than having multiple sets of “average” customers that do not vary much from one another.
Figure 4 shows the positioning of the center clusters for a normal k-means clustering and for the Doughnut Method. Without using the Doughnut Method, there will usually be a number
of clusters sharing the center of the dimensional space. This is because there is a higher density of observations toward the center of the dimensional space. The Doughnut Method solves that conundrum by enforcing a single cluster at the center of the dimensional space. All other clusters will be appropriately positioned to cluster in other areas. Although the center cluster might have more observations than the other clusters, this is not an issue. In fact, the standard deviations of the dimensions for the center cluster will often be lower than that for the outside clusters.
The Doughnut Method also provides an improvement in the separation of clusters such that the ratio of between-cluster to within-cluster variation is increased. This illustrates what typically happens with clustering and what can be obtained using the Doughnut Method. Cluster sizes represent relative membership in each cluster in terms of number of observations. Note that in this example with 6 clusters, there are 3 clusters near the population center, leaving only 3 clusters to represent the rest of the population space. Using the Doughnut Method, a single cluster can represent the population center leaving 5 clusters to represent the rest of the population space. This method covers the population space better and provides a more accurate and useful representation.
From a marketing perspective, one might want to enable a treatment or communication with a cluster or segment. However, a customer could have values of the attributes that place that customer anywhere in the population space, including areas that are between two cluster means. To address that issue, it is recommended that the company use relative membership to different customers to decide on individual and segment treatments. For example, a customer might have 50% membership in cluster 2, 35% membership in cluster 3, and 15% membership in cluster 4, depending on how close that customer is to each of the cluster centers. When deciding on whom to provide a communication to, the marketer might decide that anyone who has a relative cluster membership above 35% for cluster 4 will get the communication for cluster 4. In this way, customers might get communications or treatments for multiple clusters. If a treatment were very expensive, on the other hand, the marketer might decide only to use those customers who have over 75% membership. These additional techniques provide an enhanced level of control from the clustering results.
The following lists the technical steps taken in the “Doughnut Method”. Sample SAS code is also provided:
1. The input metrics are converted to Z-scores through the use of the procedure STDIZE.
Figure 4: Comparison of k-means and Doughnut Method Clustering
k-means Method Clusters Doughnut Method Clusters
Center Center
Center Center
Customer IntelligenceSAS Global Forum 2012

CSI: Customer Segmentation Intelligence for Increasing Profits, continued
9
proc stdize data=sasdata.Seg_modeling_input
out= sasdata.Seg_modeling_std
OPREFIX SPREFIX=STD_; /* Keep the original variables */
var var_:;
freq tot_purchases; /* weight by total purchases */
run;
When standardizing your data, you will want to keep the original variables as well as have the standardized variables for use in clustering.
2. If certain metrics are considered to be more important than others in your clustering, you can weight them by multiplying the standardized values of that weight using a DATA step.
3. In preparation for use of the input data, one must assess the number of metrics to be used. If the number of metrics is large, one should use a statistical approach such as principal components (PROC PRINCOMP) to reduce the number of variables to be used in the k-means analysis.
proc princomp data = sasdata.Seg_modeling_std
out = sasdata.Seg_modeling_prcmp
outstat = sasdata.Seg_modeling_prstat
n=10 /* maximum of 10 principal components */
cov; /* cov used to force the weighting of the variables */
var STD_:; /* these are the standardized variables created previously */
run;
4. Obtaining distinctly separated clusters that have a single “average” cluster can be easily accomplished if, prior to the initial clustering step, we remove a subset of observations in the “center” of the population. By doing so, we have left a doughnut of observations that can be clustered. Intuitively, one can imagine that distinctly separate clusters would be created from that doughnut. This is the first step of the clustering process. So, we set up the distance that each customer is from the population mean. We also remove customers with only 1 purchase because they are probably not true customers.
data sasdata.Seg_modeling_prcmp_1
sasdata.Seg_modeling_EXCL; /* Exclude customers with only 1 purchase */
set sasdata.Seg_modeling_prcmp;
array pc{*} prin:;
drop i &drop_str.;
PC_ALL = 0;
DO I = 1 TO dim(pc);
PC_ALL = PC_ALL + (pc{I})**2;
END;
PC_ALL = sqrt(PC_ALL);
/** ONLY use those renters with more than 1 Purchases **/
IF rental_cnt_tot = 1 then output sasdata.Seg_modeling_EXCL;
else output sasdata.Seg_modeling_prcmp_1;
run;
Then, we sort by distance from largest to smallest and keep the first 60% which are the customers most distant from the population mean. It turns out from tests that the number to be held out can vary between 30 and 70% without changing the final outcome.
proc sort data = sasdata.Seg_modeling_prcmp_1;
by descending PC_ALL;
run;
/* Put the 60% of customers most distant from the population mean into the */
/* dataset to be clustered initially */
/* Put the other 40% in the avg dataset to be the hole of the doughnut and */
/* brought in later */
data sasdata.Seg_modeling_avg
sasdata.Seg_modeling_clus;
set sasdata.Seg_modeling_prcmp_1 nobs = num_obs;
if _n_ < num_obs * .6 then output sasdata.Seg_modeling_clus;
else output sasdata.Seg_modeling_avg;
run;
Customer IntelligenceSAS Global Forum 2012
CSI: Customer Segmentation Intelligence for Increasing Profits, continued
10
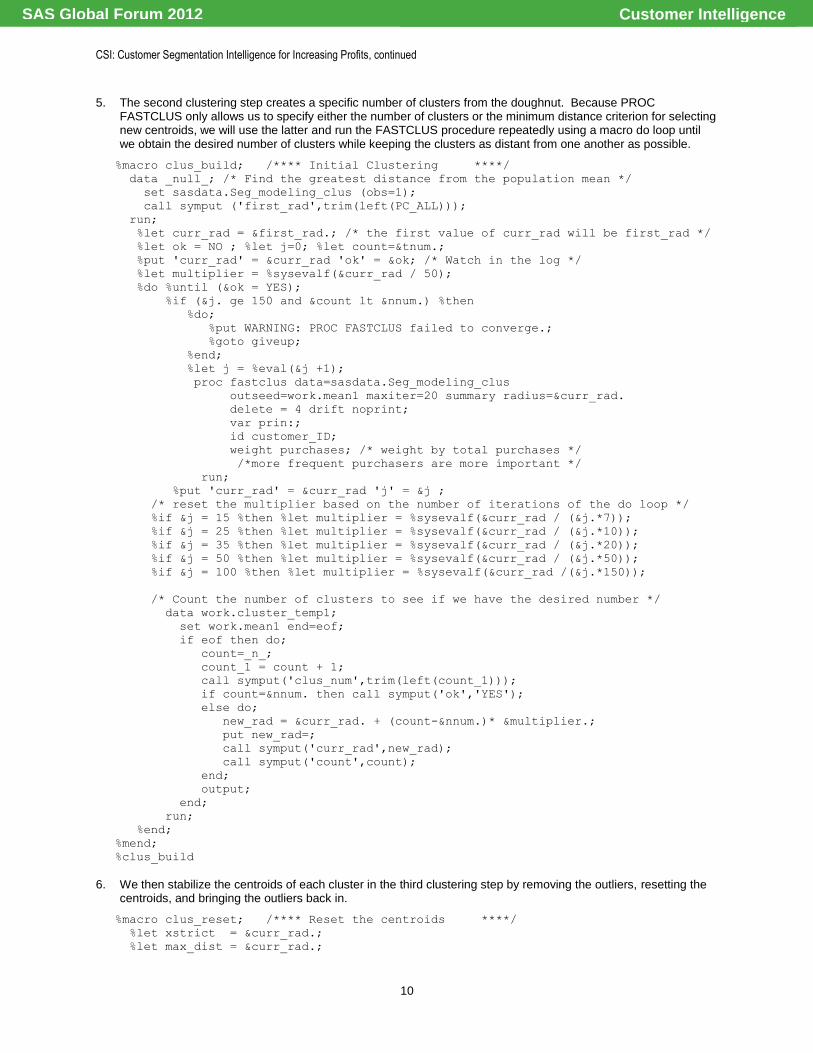
5. The second clustering step creates a specific number of clusters from the doughnut. Because PROC FASTCLUS only allows us to specify either the number of clusters or the minimum distance criterion for selecting new centroids, we will use the latter and run the FASTCLUS procedure repeatedly using a macro do loop until we obtain the desired number of clusters while keeping the clusters as distant from one another as possible.
%macro clus_build; /**** Initial Clustering ****/
data _null_; /* Find the greatest distance from the population mean */
set sasdata.Seg_modeling_clus (obs=1);
call symput ('first_rad',trim(left(PC_ALL)));
run;
%let curr_rad = &first_rad.; /* the first value of curr_rad will be first_rad */
%let ok = NO ; %let j=0; %let count=&tnum.;
%put 'curr_rad' = &curr_rad 'ok' = &ok; /* Watch in the log */
%let multiplier = %sysevalf(&curr_rad / 50);
%do %until (&ok = YES);
%if (&j. ge 150 and &count lt &nnum.) %then
%do;
%put WARNING: PROC FASTCLUS failed to converge.;
%goto giveup;
%end;
%let j = %eval(&j +1);
proc fastclus data=sasdata.Seg_modeling_clus
outseed=work.mean1 maxiter=20 summary radius=&curr_rad.
delete = 4 drift noprint;
var prin:;
id customer_ID;
weight purchases; /* weight by total purchases */
/*more frequent purchasers are more important */
run;
%put 'curr_rad' = &curr_rad 'j' = &j ;
/* reset the multiplier based on the number of iterations of the do loop */
%if &j = 15 %then %let multiplier = %sysevalf(&curr_rad / (&j.*7));
%if &j = 25 %then %let multiplier = %sysevalf(&curr_rad / (&j.*10));
%if &j = 35 %then %let multiplier = %sysevalf(&curr_rad / (&j.*20));
%if &j = 50 %then %let multiplier = %sysevalf(&curr_rad / (&j.*50));
%if &j = 100 %then %let multiplier = %sysevalf(&curr_rad /(&j.*150));
/* Count the number of clusters to see if we have the desired number */
data work.cluster_temp1;
set work.mean1 end=eof;
if eof then do;
count=_n_;
count_1 = count + 1;
call symput('clus_num',trim(left(count_1)));
if count=&nnum. then call symput('ok','YES');
else do;
new_rad = &curr_rad. + (count-&nnum.)* &multiplier.;
put new_rad=;
call symput('curr_rad',new_rad);
call symput('count',count);
end;
output;
end;
run;
%end;
%mend;
%clus_build
6. We then stabilize the centroids of each cluster in the third clustering step by removing the outliers, resetting the centroids, and bringing the outliers back in.
%macro clus_reset; /**** Reset the centroids ****/
%let xstrict = &curr_rad.;
%let max_dist = &curr_rad.;
Customer IntelligenceSAS Global Forum 2012

CSI: Customer Segmentation Intelligence for Increasing Profits, continued
11
%let ok = NO ;
%put 'max_dist' = &max_dist 'ok' = &ok;
%do %until (&ok = YES);
%put 'max_dist' = &max_dist 'ok' = &ok;
proc fastclus data=sasdata.Seg_modeling_clus seed=work.seed
maxc=20 least=2 strict=&max_dist out=work.out
outseed=sasdata.mean2
converge=0 maxiter=200 noprint;
var prin:;
id customer_ID;
weight purchases; /* weight by total purchases */
/*more frequent purchasers are more important */
run;
data work.cluster_temp;
set work.out end=eof;
if cluster<0 then outlier_count + 1;
tot_count+1;
if eof then do;
fraction = outlier_count/tot_count;
if fraction < .02 then max_dist = &max_dist - &XSTRICT/20;
else if fraction < .04 then max_dist = &max_dist - &XSTRICT/100;
else if fraction > .12 then max_dist = &max_dist + &XSTRICT/100;
else if fraction > .14 then max_dist = &max_dist + &XSTRICT/20;
if .04 <= fraction <= .12 THEN call symput('ok','YES');
call symput('max_dist',max_dist);
output;
end;
run;
%end;
%mend;
% clus_reset
/* Run PROC FASTCLUS one more time with zero iterations */
/* to assign outliers and tails to clusters. */
proc fastclus data=sasdata.Seg_modeling_clus
seed=sasdata.mean2 maxc=20 maxiter=0 outseed=sasdata.mean2x
out=sasdata.Seg_modeling_reset;
var prin:;
id customer_ID;
run;
7. The fourth clustering step is to include the observations excluded during the doughnut process. They are included as the “Average” or single central cluster.
/* set cluster number 1 as average cluster. increment all other clusters by 1 */
data sasdata.Seg_modeling_&smy._&tnum._&clus_num.;
set sasdata.Seg_modeling_&smy._&tnum._&clus_num.(in=a)
sasdata.Seg_modeling_avg(in=b);
if b then cluster = 1;
else cluster+1;
run;
8. Finally, each observation is given one last opportunity to move to its closest cluster as measured by the Euclidean distance between the observation and the cluster centroids.
/*** Add Average group to seed ***/
data sasdata.mean3;
set sasdata.mean2 end=eof;
ARRAY P_VARS {*} prin:;
cluster+1;
output;
drop i;
if eof then do;
CLUSTER=1;
Customer IntelligenceSAS Global Forum 2012

CSI: Customer Segmentation Intelligence for Increasing Profits, continued
12
do i = 1 to dim(P_VARS);
P_VARS{i} = 0;
end;
output;
end;
run;
/**** Let each obs move to the cluster it is closest to ****/
proc fastclus data=sasdata.Seg_modeling_reset
seed=sasdata.mean3 maxc=20 maxiter=0 outseed = sasdata.mean4
out=sasdata.Seg_modeling_clus_done
outstat=work.Sm3_clus_stat;
var prin:;
id customer_ID;
run;
The Doughnut Method is generalizable and has been shown to be easily and successfully integrated into a wide arena of analytic and business applications. The results from applying unsupervised segmentation or using the Doughnut Method can be used directly for marketing or communicating with customers differently by segment. The results can also be used to build different predictive models from each segment, such as likelihood to churn or respond to an offer. Experience has shown that clustering prior to predictive modeling provides better models than building a single model for the whole customer population.
Unsupervised Clustering Advantages:
Enables the greatest view of the customers
Provides a general set of segments that can be used for marketing
Provides a general set of segments that can be used as input to predictive models
Unsupervised Clustering Disadvantages:
May be difficult to decide what actions to take with each segment
Requires a good understanding of clustering methodologies
CONCLUSION
Segmentation enables you to treat your customers relevantly according to their characteristics. In this way, you can satisfy all your customers by meeting your customers’ needs and wants, and also use the most appropriate methods in marketing to them more effectively. .So, which segmentation should you use? Determine what you want to accomplish and use that to decide on the method. If you have certain business rules to adhere to, the business rule segmentation should be used. If you want to adhere to an RFM approach or some other metrics that lend themselves to the use of quantiles, then that will be your approach. If you have a known target, you can use that for segmentation. The last approach, unsupervised segmentation with k-means clustering, is easily the most flexible and powerful approach requiring the fewest assumptions about your customer population.
No matter the method you use, segmentation has no business value unless you have a well-defined goal. The segmentation that you perform must reflect that goal in order for you to be able to use the results. So, you can and should try more than one method to assess the “goodness” of different approaches in your environment. You can even combine different methods if the situation warrants. The author strongly encourages the use of segmentation prior to building predictive models. You might want to compare results from building predictive models within clusters to the predictive model over the whole population. You might also want to use the cluster membership as an additional input variable to your predictive model. No matter the segmentation method employed, by using CSI, you will be able to simultaneously meet your customer’s needs and improve profitability.
REFERENCES
Collica, Randall S. 2011. Customer Segmentation and Clustering using SAS® Enterprise Miner™ Second Edition.
Cary, NC: SAS Institute, Inc.
RECOMMENDED READING
Customer Segmentation and Clustering using SAS® Enterprise Miner™ Second Edition
Customer IntelligenceSAS Global Forum 2012

CSI: Customer Segmentation Intelligence for Increasing Profits, continued
13
CONTACT INFORMATION
Your comments and questions are valued and encouraged. Contact the author at:
Name: Darius Baer Enterprise: SAS Institute, Inc. Address: 420 Edison Place City, State ZIP: Superior, CO 80027 Work Phone: 303-494-3014 Cell Phone: (303) 204-7015 E-mail: [email protected] Web: www.sas.com
SAS and all other SAS Institute Inc. product or service names are registered trademarks or trademarks of SAS Institute Inc. in the USA and other countries. ® indicates USA registration.
Other brand and product names are trademarks of their respective companies.
Customer IntelligenceSAS Global Forum 2012