10/2/2015 tumor and normal-tissue responses p. 1 of 68 Illinois Institute of Technology Physics 561...
68
03/22/2 2 tumor and normal-tissue responses p. 1 of 68 Illinois Institute of Technology Physics 561 Radiation Biophysics Lecture 8: Fractionation; Carcinogenesis Andrew Howard 26 June 2014
-
Upload
russell-wood -
Category
Documents
-
view
214 -
download
0
Transcript of 10/2/2015 tumor and normal-tissue responses p. 1 of 68 Illinois Institute of Technology Physics 561...

04/19/23 tumor and normal-tissue responses p. 1 of 68
Illinois Institute of Technology
Physics 561
Radiation Biophysics
Lecture 8:Fractionation; Carcinogenesis
Andrew Howard26 June 2014

04/19/23 tumor and normal-tissue responses p. 2 of 68
Plans For This Class Dose fractionation
– Logic behind it– Mathematical models– Treatment regimens
Radiation Carcinogenesis– Animal studies– Cell-culture studies– Etiology of cancer– Dose-response relationships– Mutagenesis

04/19/23 tumor and normal-tissue responses p. 3 of 68
And now for something mostly different
We’ll move away from nonstochastic late effects to a discussion of treatment modalities for tumors.
Here we’re focusing on the fact that tumors are somewhat DNA repair-deficient and therefore respond differently to ionizing radiation than healthy tissues do
We’ll look, in particular, at dose fractionation as a component of treatment planning for cancer

04/19/23 tumor and normal-tissue responses p. 4 of 68
Fractionation Radiotherapy can’t wait for research:
people need answers now Even in the 1930’s and 40’s it was recognized
that there was an advantage in treating tumors to fractionate the dose, i.e. if the total dose you wanted to deliver was 5 Gy, you got a better therapeutic ratio if you delivered it in several small doses rather than all at once.
We’ll now explore some quantitative models of the relationship between damage and fractionation

04/19/23 tumor and normal-tissue responses p. 5 of 68
Power Law and Timing
Witte:measured dose D required to reach the threshold for skin erythema as a function of dose rate or number of fractions n:
Power law:lnD = a + blnn, i.e.D = ea+blnn = ea eblnn = ea elnnb
D = Qnb, where Q = ea.

04/19/23 tumor and normal-tissue responses p. 6 of 68
Power-law treatments, continued Strandqvist: total time
of treatment T:D = UT1-p; 1-p for skin was about 0.2.
Cohen: 1-p is tissue specific (0.30 normal, 0.22 for carcinomas); this enables radiotherapy!
Strandqvist modelU=2 Gy1-p = 0.2

04/19/23 tumor and normal-tissue responses p. 7 of 68
Normalized Standard Dose Ellis: tolerance dose D for
normal tissue is related to the number of fractions N and the overall treatment time in days, T:
D = T0.11N0.24
The value of is called the Normalized Standard Dose or NSD; it can be determined separately for each tissue and each treatment modality.
# of treatments

04/19/23 tumor and normal-tissue responses p. 8 of 68
What are we really doing here?
This is curve-fitting in its most unapologetic form.
As far as I know there is no attempt to attach physical meanings to the exponent (1-p) in the Strandqvist model.
Nor is there a reason to think there’s anything physically significant about the 0.11 and 0.24 exponents in the Ellis formulation

04/19/23 tumor and normal-tissue responses p. 9 of 68
Time of treatment and number of fractions
Clearly time and number of fractions are (anti-)correlated variables
BUT this approach can be helpful in treatment planning, at least within the range of conditions for which the formulas are valid.

04/19/23 tumor and normal-tissue responses p. 10 of 68
Can we do better than this?
Explicit accounting for damage in terms of repairability:
– Sublethal– Potentially lethal– Nonrepairable
Model suggests that the limiting slope of lnS vs D as you fractionate a lot is determined by the single-hit (nonrepairable) mechanism

04/19/23 tumor and normal-tissue responses p. 11 of 68
Effect of FractionationFig. 11.3: Repair capability;
limiting slope determined by fraction sizes < W
Sur
vivi
ng fr
actio
n
W X Y Radiation Dose
Limiting slope forfraction sizes < W orlow dose rates
Effective slope,fraction size X
Effective slope,fraction size Y
Limiting slopefor largedose fraction
0.1
0.01
0.001

04/19/23 tumor and normal-tissue responses p. 12 of 68
Douglas & Fowler
Used mouse-foot skin reaction to fractionated doses: ≤ 64 fractions , constant overall time
For an isoeffect, the following equation held: n( + 2) = where n = # of fractions, = dose per fractionnote: I’m using where Alpen uses D, to reduce potential confusion with the overall dose.

04/19/23 tumor and normal-tissue responses p. 13 of 68
Douglas-Fowler Assumptions
Repair occurs after single doses Biological outcome depends on surviving
fraction of critical clonogenic cells Every equal fraction will have same
biological effect

04/19/23 tumor and normal-tissue responses p. 14 of 68
Survival fraction,Douglas&Fowler formulation
lnS = n(Fe/a) Note that a is not . For an appropriate choice of a, Fe = 1/(n)
Single-dose cell survival is S = exp[(Fe/a) So we do an isoeffect plot of Fe vs. :
Fe = b + c

04/19/23 tumor and normal-tissue responses p. 15 of 68
Douglas & Fowler Survival Fraction, Continued
Thus lnS = n(b/a + c2/a) cf. Standard LQ model, assuming constant
effect per fraction: lnS = -n() Defining E = -lnS, E/(n) = +
1/(n) = /E + /E plot vs Fe = 1/(n to get /E, /E. In practical situations we may not be able to
measure E directly

04/19/23 tumor and normal-tissue responses p. 16 of 68
Fig. 11.4: finding /E, /E
/E = intercept = 1.75 Gy-1
/E = slope = 27 Gy-2
= ratio = 0.0648 Gy
1/to
tal D
ose
, Gy-1
Dose per fraction, Gy0
2
4
6
0.05 0.10 0.15

04/19/23 tumor and normal-tissue responses p. 17 of 68
Applicability We don’t have to be using an LQ model to work
with the Douglas-Fowler formulation; we just need a nonzero slope of lnS vs. D at low dose.
Thus MTSH doesn’t work:With MTSH, S= 1 - (1 - exp(-D/D0))n
For n > 1,dS/dD = -n(1-exp(-D/D0))n-1 at D = 0, dS/dD = -n(1-e0)n-1= -n(0)n-1 = 0.
For n = 1, S = exp(-D/D0)dS/dD = (-1/D0)exp(-D/D0)at D = 0, dS/dD = (-1/D0)e-0 = -1/D0 ≠ 0.

04/19/23 tumor and normal-tissue responses p. 18 of 68
Withers extension of Fe model
Define flexure dose as the dose per fraction below which no further protection is provided by interfraction repair.
It turns out the flexure dose is a multiple of (units are correct: is in Gy)
04/19/23 tumor and normal-tissue responses p. 19 of 68
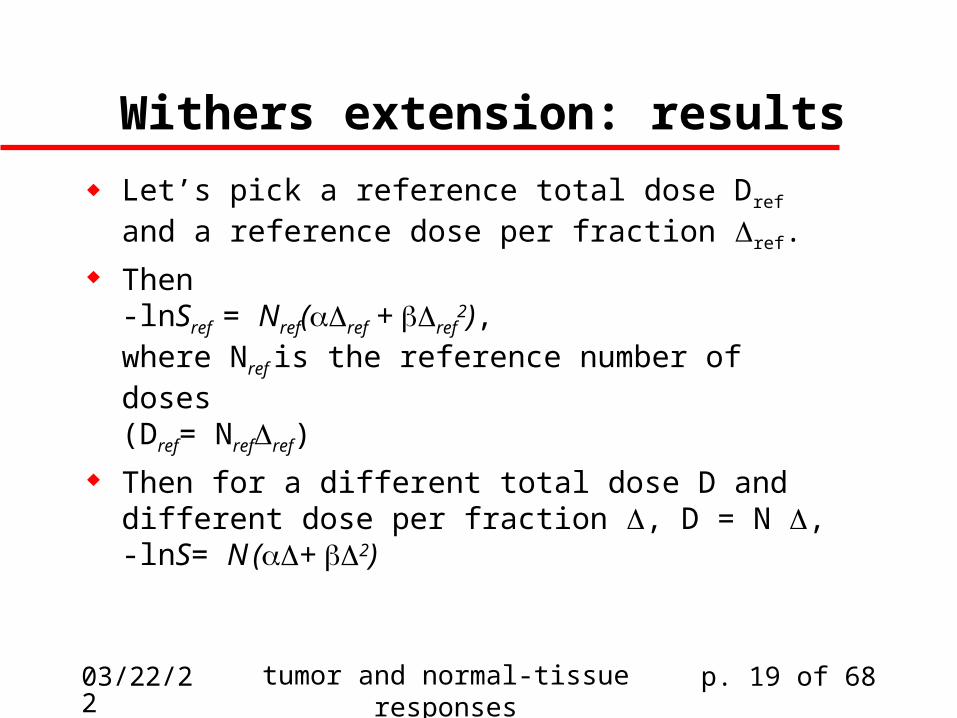
Withers extension: results
Let’s pick a reference total dose Dref and a reference dose per fraction ref.
Then-lnSref = Nref(ref + ref
2),where Nref is the reference number of doses(Dref= Nrefref)
Then for a different total dose D and different dose per fraction , D = N ,-lnS= N (+ 2)

04/19/23 tumor and normal-tissue responses p. 20 of 68
Withers result In order for the reference regimen to have the same
effect as the test regimen, S = Sref, or -lnS = -lnSref
ThereforeNref(ref + ref
2) = N( + 2), i.e. Nrefref + Nrefref
2 = N + 2
But Nrefref = Dref and N = D, so Nrefref
2 = Drefref and N2 = D Thus Dref(ref) = D()
D/Dref = (ref)/ () = ( + ref)/()

04/19/23 tumor and normal-tissue responses p. 21 of 68
Withers plot (fig. 11.5)Comparison of three different Isoeffect curves,
depending on (with ref = 2 Gy):
Yellow: α/β=10 GyRed:α/β=3.33 GyBlue: α/β=1.66Gy

04/19/23 tumor and normal-tissue responses p. 22 of 68
Homework for later in July
[This is a variation on problem 1 of chapter 11 in the book. I don't understand the wording of Alpen's problem, so I made up my own version]
Suppose that the Ellis power law equation (11.2) is valid in a particular tissue. A typical tumor dosing regimen consists of twenty treatments over four weeks using weekdays only, i.e. 26 days from the first Monday through the last Friday. Thus if the total dose delivered is 60 Gy, we deliver 3 Gy in each of the 20 treatments.

04/19/23 tumor and normal-tissue responses p. 23 of 68
Homework for later in July, continued
(a) Assuming NSD=17Gy, calculate the tolerance dose associated with this regimen. Will we be able to deliver this treatment regimen without damage to the normal tissue?

04/19/23 tumor and normal-tissue responses p. 24 of 68
Homework, concluded
(b) If we wish to shorten the treatment time to three weeks (19 days from the first Monday to the last Friday) we will have to deliver larger doses per day, e.g. 60/19 = 3.16 Gy/day if we include weekends. If we allow more than one dose delivery per day we can reduce the dose delivered in each treatment back to lower levels, though (1.052 Gy/treatment). Calculate the number of doses we will have to deliver over the 19-day period if we wish to ensure that the full 60 Gy will be tolerated. Determine the dose per treatment.

Reminder about schedules
I will be out of the country from Wednesday 2 July through Wednesday 9 July, so there will be no class on Thursday 3 July or Tuesday 8 July.
I will do a makeup class on Monday 30 June from 10:00am to 12:50pm in Stuart 107
I will do another makeup class on Friday 11 July from 9:00am to 11:50am in Stuart 213
If the students who normally attend the live section cannot attend one or both of those makeups, they are welcome to view the videos instead.
04/19/23 tumor and normal-tissue responses p. 25 of 68

04/19/23 tumor and normal-tissue responses p. 26 of 68
Stochastic Effects
These are defined as effects for which the percentage of the population affected by the exposure is dependent on dose
BUT the severity of the [medical] condition in an individual is independent of dose.
04/19/23 tumor and normal-tissue responses p. 27 of 68
Does cancer really work that way? Not entirely Fry (1976):
– Harderian gland tumors seldom invasive after low doses of low LET radiation
– More invasivity and metastasis after higher doses of low LET radiation
Ullrich & Storer (1979):maybe there’s a threshold dose

Is there a threshold at the population level?
04/19/23 tumor and normal-tissue responses p. 28 of 68
Radiation-induced cancer
incidence: Cases per 105 people
Dose to population
Measured data
No threshold
Threshold model

04/19/23 tumor and normal-tissue responses p. 29 of 68
Traditional View of Population Dose-Response Relationships
Notion is that there’s a nonzero slope at D=0, rather than a threshold:
Pro
babi
lity
of C
ance
r In
cide
nce
Dose
Background IncidenceNonzero slope at D=0

04/19/23 tumor and normal-tissue responses p. 30 of 68
Radiation Carcinogenesis in Animals Earliest tool in understanding radiation-induced
cancer Consider mice with leukemia brought on by ionizing
radiation (fig. 12.1):
Inci
den
ce(%
of p
op
ula
tion)
Dose, Gray
1 2 3 4
Raw incidence
Corrected for mortality50

04/19/23 tumor and normal-tissue responses p. 31 of 68
The Background Problem
(made-up data): Error bars make it impossible to
figure out which line is correct
Inci
denc
e, %
Dose, Gray
1
2
3
0.2 0.4 0.6

04/19/23 tumor and normal-tissue responses p. 32 of 68
In fact, it’s worse!
Substantial error in the dose values too in many cases!
Inci
denc
e, %
Dose, Gray
1
2
3
0.2 0.4 0.6

04/19/23 tumor and normal-tissue responses p. 33 of 68
Extrapolation to low dose The only reliable experimental
measurements are made at doses much higher than the levels for which we want to set regulatory limits. Therefore we extrapolate, somehow:
Exc
ess
Inci
denc
e,%
of
popu
latio
n
Dose, Gray
2 4 6

04/19/23 tumor and normal-tissue responses p. 34 of 68
Differential Sensitivity
Some individuals within a population are more susceptible than others
– To tumors– To other conditions
Why?– Defective DNA repair mechanisms– Problems in cell signaling– Lifestyle agents
(smoking, drinking, lack of exercise)– Genetic differences among individuals

04/19/23 tumor and normal-tissue responses p. 35 of 68
How does differential sensitivity affect dose-response relationships?
Dose
Tu
mo
r in
cid
ence
Response in normal population
Responsesin sensitive populations
Additive
Supra-additive

04/19/23 tumor and normal-tissue responses p. 36 of 68
Differential Exposure
Mean dose = 1 Gy Maximum dose = 10 Gy Minimum dose = 0 Gy Mode of dose distribution =
1.2 Gy
Fra
ctio
n r
ece
ivin
g g
iven
dos
e
Dose, Gy0 1

04/19/23 tumor and normal-tissue responses p. 37 of 68
Upton’s Summary of the Animal Data
Neoplasms of almost any type can be induced by irradiation of a suitable animal in a suitable way.
Not every type of neoplasm is increased in frequency by irradiation of animals of one strain.
Carcinogenic effects are interconnected through a variety of mechanisms.
Some mechanisms involve direct effects on the tumor-forming cells; others don’t.
High-LET radiation produces dose-dependent rather than dose-rate-dependent effects

04/19/23 tumor and normal-tissue responses p. 38 of 68
Upton, continued Development of tumors is multicausal and multistage;
effects of radiation may be modified by other agents. Low to intermediate doses produce no tumors unless
promoted by other agents. At high doses the effect is suppressed by sterilization
of potentially transformed cells; this causes saturation. Time distribution of appearance of tumors varies with
type of tumor, genetics and age, conditions of irradiation.
Dose-response curves vary significantly.

04/19/23 tumor and normal-tissue responses p. 39 of 68
Events from transformationto mutated cells (fig. 12.2)
Many factors influence events up through malignancy
Radiation event:dose, dose rate, quality
Mutagenic eventsin cell
Killing orsterilizingof the cell
Nonproliferating
Oncogenes &Tumor Suppressor
Genes
Cells with oncogenic mutations RepairViral
Activation
Repair

04/19/23 tumor and normal-tissue responses p. 40 of 68
Mutations through Malignancy Additional influences seen
Cells with oncogenic mutations
HormonesCell Cycle State
Proliferative stimuliOther mutations,
radiation,and/or chemicals
Malignancy withfull autonomy of growth
Neoplasia
Clonal selectionAltered immune state
Mitosis

04/19/23 tumor and normal-tissue responses p. 41 of 68
Tumors: Definitions
Tumor: abnormal, de-differentiated cellular proliferation
– Benign: small mass reaches a certain size and then stops growing
– Malignant: those capable of uncontrolled growth & metastasis
Cancer: a malignant tumor Carcinogen: a chemical or physical agent
that increases the likelihood of cancer

04/19/23 tumor and normal-tissue responses p. 42 of 68
Cancer: Prevalence and Significance
550,000 cancer deaths per year in the US 20-40% caused by environmental and workplace
agents Others caused by smoking, diet, and natural causes Teasing apart these statistics is tricky:
– Probability of any individual getting cancer under a particular set of circumstances is small
– Multistage model makes multiple causes likely

04/19/23 tumor and normal-tissue responses p. 43 of 68
Inci
den
ce,
% o
f po
pul
atio
n
1.5 3.5 4.7
20
40
60
Observed
Adjusted for
Intercurrent mortality
Fig.12.1: myeloid leukemia in mice
Tumors and Radiation Stochastic late effects (cf. earlier in this lecture)
– Are these effects truly stochastic?– Even with cancer, there exists some dose-response effects in
the individual
Dose, Gy

04/19/23 tumor and normal-tissue responses p. 44 of 68
Tumors and Radiation (Cont’d) Is there a threshold?
– Probably not (but is this a red herring?)– Not at the population level
Serious Inquiry: the ED01 experiment Brown & Hoel, Fundamental & Applied Toxicology 3: 458 (1983)
More about this in a few slides.
Po
pula
ti on
re
spo
nse
Dose

04/19/23 tumor and normal-tissue responses p. 45 of 68
Upton’s rules (remember?) Irradiation can produce almost any kind of neoplasm if we do it
right Not every type of neoplasm has its incidence increased by
irradiation of animals of any one species or strain Carcinogenic effects depend on a variety of mechanisms Some effects are direct, some are indirect Incidence rises more steeply with dose for high-LET radiation
than for low-LET radiation Irradiation interacts with other causative agents Promotion may depend on other agents

04/19/23 tumor and normal-tissue responses p. 46 of 68
How do Cancers Begin?: The Clonal Theory
In general, mutational events in a single cell are sufficient to begin the process of tumorigenesis
Often several mutations must arise in order for cancer to be a likely outcome
Generally the mutation must be in one of the 50 or so genes that control cell replication and differentiation
The mutagenic events are never enough to guarantee development of cancer(but that still leaves open the possibility that radiation could cause cancer all by itself, if it can act as a promoter too …)
Mutations must be followed by promotional events, which stimulate uncontrolled cell division

Events from transformationto mutated cells (fig. 12.2)
Many factors influence events up through malignancy
Radiation event:dose, dose rate, quality
Mutagenic eventsin cell
Killing orsterilizingof the cell
Nonproliferating
Oncogenes &Tumor Suppressor
Genes
Cells with oncogenic mutations RepairViral
Activation
Repair
04/19/23 tumor and normal-tissue responses p. 47 of 68

Mutations through Malignancy Additional influences seen
Cells with oncogenic mutations
HormonesCell Cycle State
Proliferative stimuliOther mutations,
radiation,and/or chemicals
Malignancy withfull autonomy of growth
Neoplasia
Clonal selectionAltered immune state
Mitosis
04/19/23 tumor and normal-tissue responses p. 48 of 68

Modifying Factors
Immune system
Hormonal effects
Oncogenes
Oncogenic viruses
Environmental factors
04/19/23 tumor and normal-tissue responses p. 49 of 68

How Cancers Develop: The Multistage Theory
Initiation– DNA damage– e.g. Intercalators
Promotion– Generally not mutational– Involves changes in control systems, e.g. arachidonic acid
cascade– Tumors are present and capable of metastasis but
haven’t necessarily metastisized Progression
– Development of metastatic tumors
04/19/23 tumor and normal-tissue responses p. 50 of 68

Potentiation of Effect of Radiation by Smoking
Inquiry into lung-cancer incidence among uranium miners and nearby office workers. Smokers and nonsmokers were surveyed.
04/19/23 tumor and normal-tissue responses p. 51 of 68

How do we study radiation-induced carcinogenesis?
Induction and progress of cancer in experimental animals
Transformation of cells grown in tissue culture Human epidemiological studies
– Accidental exposures:Radium-dial workers, Chernobyl victims,foot fluoroscopes
– Medicinal exposures– Atomic bomb victims
04/19/23 tumor and normal-tissue responses p. 52 of 68

What Constitutes a Cancer?
Morphological change Cell immortality (escape from apoptosis) Tumorigenicity, i.e. spread of
undifferentiated cells
04/19/23 tumor and normal-tissue responses p. 53 of 68

Oncogenes Genes that are activated or show enhanced
expression in tumors Limited data showing connection between
human radiation-induced tumors and activation of oncogenes
04/19/23 tumor and normal-tissue responses p. 54 of 68

ED01 study
We mentioned this a bit earlier Study run by scientists at the National
Institute of Environmental Health Sciences in Research Triangle Park, North Carolina
BALB-C mice analyzed for liver tumors Test compound was 2-acetylaminofluorene,
a known carcinogen in rodents:
04/19/23 tumor and normal-tissue responses p. 55 of 68

ED01 study, continued
24000 mice in various exposure groups Endpoints and elements of study:
– Time to tumor incidence– Dose “fractionation” (but this is a chemical)
Sophisticated statistical analyses:– Initial analyses around 1981– Re-analysis a few years later
Compared various dose-response models
04/19/23 tumor and normal-tissue responses p. 56 of 68

ED01 quantitation
Analyze tumor incidence according toP(t,d) = 1 - exp(-F(t,d)), wheret = time and d = dose.
P, the tumor incidence fraction, behaves like1-S in our survival curve studies
Some analyses suggest that 2-AAF is primarily a promotor, not an initiator
– So it isn’t a great model for what radiation does…– But it still illustrates the importance of careful statistics!
04/19/23 tumor and normal-tissue responses p. 57 of 68

Experimental Systems for Studying Rad-induced Tumors
We need these because we can’t deliberately do high-dose experiments on humans!
CHO cells– Chinese Hamster Ovary– Good for looking at early effects--Initiation– Difficult to model the promotional events.– Transformation results in loss of contact inhibition
Mouse embryo fibroblasts– Immortalized– Still display contact inhibition
04/19/23 tumor and normal-tissue responses p. 58 of 68

CHO Cells (Continued) Key assay: resistance to contact inhibition
radiationor chemicals
No radiationor chemicals
04/19/23 tumor and normal-tissue responses p. 59 of 68

Mouse Embryo Cells:
Experiment: growing total confluence Lose contact inhibition? Can induce tumors in syngeneic animals
Limitation in both systems:– Fibroblasts (mesenchymals)– Most human tumors are epithelial
04/19/23 tumor and normal-tissue responses p. 60 of 68

Mutagenesis
Many chemicals, as well as radiation, can be shown to cause mutations.
It is therefore logical to test for mutagenicity as a first-stage inquiry into the likelihood that a compound or a radiation treatment might be carcinogenic
Standard mutagenic test:The Ames test (developed by Bruce Ames), in which Salmonella cells are exposed to a chemical and mutation rates in the cells are measured.
04/19/23 tumor and normal-tissue responses p. 61 of 68

Is an Ames Test a Good Substitute for These Complex Systems?
No! 1,8-dinitropyrene is the
most mutagenic substance known in the Ames test; yet it is only weakly tumorigenic in rats.
04/19/23 tumor and normal-tissue responses p. 62 of 68

Why might we care about dinitropyrene?
Most mutagenic substance known in Salmonella strain TA98: 72900 revertants/nanomole
Nitroarenes like this one were found to be present in used toner, i.e., combustion waste from Xerox toner
When this appeared, Xerox chemists reformulated their toner to drastically reduce the nitroarene content in the used toner.
Mermelstein (1981) Mutation Research 89:187-196. Löfroth et al(1980) Science 209:1037-1039 and
Mermelstein et al (1980) Science 209:1039-1043. So: all’s well that ends well!
04/19/23 tumor and normal-tissue responses p. 63 of 68

This is also a story about enzyme induction
Nitroarenes like dinitropyrene and other polynuclear aromatic hydrocarbons, (e.g. benzo(a)pyrene) are known to be inducers of enzyme activities
Some of these enzyme activities actually activate toxicants rather than detoxifying them
Most of the activity of these enzymes will detoxify; But if 1% makes things worse, we want to understand that
1% activation So we found that pretreatment with these compounds
could induce subsequent binding of other compounds to mouse DNA:Howard et al (1986), Biochem. Pharm. 35: 2129-2134.
04/19/23 tumor and normal-tissue responses p. 64 of 68

Animal Cell-Line Cancer Studies How similar are these rodent cell systems
(CHO, mouse) to human cells? Answer: Human cells:
– Are more resistant to spontaneous immortalization
– Tend to give more nearly log-linear responses to dose
– Radical scavengers and cold don’t protect as much:That suggests that direct mechanisms prevail in humans and indirect mechanisms are more important in rodents
04/19/23 tumor and normal-tissue responses p. 65 of 68

More on humans vs. rodents
High-LET studies indicate that repair is less effective in humans than in humans
Is the timescale a factor in that? Humans live a lot longer than rodents.
Promotion can be studied in animal cells, along with initiation
04/19/23 tumor and normal-tissue responses p. 66 of 68

Radiation Carcinogenesisin Human Populations
Occupational: radiologists, miners, dial painters Medical exposures:
– Ankylosing spondylitis– Nonmalignant disease in pelvis and breast– Multiple fluoroscopies to chest (e.g. in TB patients)– Infants & children with enlarged thymus and ringworm– Children exposed in utero to diagnostic X-rays
Nuclear accidents and weapon detonations Environmental background (see last chapter)
04/19/23 tumor and normal-tissue responses p. 67 of 68

Dose-Incidence in Cancer Studies We seek a relationship relating post-exposure
incidence ID to dose D and normal incidence In Model might be:
– Linear: ID = In + 1D
– Quadratic: ID = In + 2D2
– LQ: ID = In + 1D + 2D2
Corrected for loss of clonogenic potential: ID = (In + 1D + 2D2)exp(-1D+2D2)
04/19/23 tumor and normal-tissue responses p. 68 of 68