10.2 Emission and control of greenhouse gases 2008-11-10 · dioxide and other trace gases. ......
18
10.2.1 Introduction The composition of the lower atmosphere, or troposphere (the layer up to 25 km above the Earth’s surface) consists of oxygen, nitrogen and other gases which account for less than 1% by volume of the air (excluding water vapour). This fraction includes carbon dioxide (0.035%), methane (0.0017%), ozone (0.00006%) and other trace gases such as nitrous oxide, nitrogen oxides (NO x ), halogenated hydrocarbons, carbon monoxide and volatile organic compounds. Despite their extremely low concentrations, these gases – the so-called greenhouse gases (GHGs) – play an important role in regulating the atmosphere’s energy balance, the energy cycle which controls the world’s climate (Buchdahl, 1999). The energy balance of the Earth-Sun system and the natural greenhouse effect Solar energy, produced by nuclear fusion reactions of hydrogen, is released by the Sun’s surface which has an equivalent temperature of about 5800 K. This radiation is emitted in all directions, and only a tiny fraction of the energy released by the Sun is intercepted by the Earth (Critchfield, 1983). Consequently, the energy flux that affects the Earth’s atmosphere is many orders of magnitude smaller than that released by the Sun. Assuming that both the Sun and the Earth behave as black bodies, in other words perfectly radiating, and differentiating Planck’s law, the estimated effective temperature of the Earth’s surface would be 255 K. The wavelength corresponding to the maximum energy emitted is about 0.5 mm (visible part of the spectrum) for the Sun and 10 mm (infrared part of the spectrum) for the Earth. However, it is known that the Earth’s average global temperature is 288 K or 15°C, i.e. 33 K warmer than that estimated from the balance between absorbed and emitted energy. This is due to the presence of the gases forming the earth’s atmosphere. In the atmosphere, there is significant absorption of the Sun’s ultraviolet (UV) radiation by ozone, and of the Earth’s infrared (IR) radiation by water vapour, carbon dioxide and other trace gases. The absorption of terrestrial IR radiation is especially important for the energy balance of the earth’s atmosphere (Campbell, 1986; Trenberth, 2004). A small proportion of this radiation is released into space (generally in the highest and coldest layers of the atmosphere), but most is reflected back towards Earth. The GHGs in the atmosphere are transparent to the incoming short-wave solar radiation, but absorb that emitted by the Earth, whose wavelength is considerably longer. Most of the IR radiation is absorbed by the troposphere. The net effect, known as the natural greenhouse effect, is that the Earth stores more energy near its surface than it would absorb in the absence of an atmosphere, raising the temperature by about 33 K. Despite the considerable absorption by these GHGs, there is an ‘atmospheric window’ through which terrestrial IR radiation can pass unaltered (Kemp, 1994). This occurs in the interval between 8 and 13 mm, and its gradual closing is one of the effects of anthropogenic emissions of GHGs. Naturally, as well as absorbing solar radiation, the gases in the atmosphere, together with aerosols, also scatter it. The scattering of solar radiation is also extremely important, since this can alter the atmosphere’s overall energy balance. Gas molecules, which are small compared to the wavelength of the incident radiation, cause scattering in all directions in accordance with the phenomenon known as Rayleigh scattering. Aerosols whose size are comparable to the wavelength of the incident radiation cause Mie scattering, which mainly occurs in the opposite direction to that of the incident radiation. This explains why the presence of atmospheric aerosol affects the 937 VOLUME III / NEW DEVELOPMENTS: ENERGY, TRANSPORT, SUSTAINABILITY 10.2 Emission and control of greenhouse gases
-
Upload
truongdang -
Category
Documents
-
view
213 -
download
0
Transcript of 10.2 Emission and control of greenhouse gases 2008-11-10 · dioxide and other trace gases. ......
10.2.1 Introduction
The composition of the lower atmosphere, ortroposphere (the layer up to 25 km above the Earth’ssurface) consists of oxygen, nitrogen and other gaseswhich account for less than 1% by volume of the air(excluding water vapour). This fraction includescarbon dioxide (0.035%), methane (0.0017%), ozone(0.00006%) and other trace gases such as nitrousoxide, nitrogen oxides (NOx), halogenatedhydrocarbons, carbon monoxide and volatile organiccompounds. Despite their extremely lowconcentrations, these gases – the so-calledgreenhouse gases (GHGs) – play an important role inregulating the atmosphere’s energy balance, theenergy cycle which controls the world’s climate(Buchdahl, 1999).
The energy balance of the Earth-Sun system and the natural greenhouse effect
Solar energy, produced by nuclear fusion reactionsof hydrogen, is released by the Sun’s surface which hasan equivalent temperature of about 5800 K. Thisradiation is emitted in all directions, and only a tinyfraction of the energy released by the Sun is interceptedby the Earth (Critchfield, 1983). Consequently, theenergy flux that affects the Earth’s atmosphere is manyorders of magnitude smaller than that released by theSun. Assuming that both the Sun and the Earth behaveas black bodies, in other words perfectly radiating, anddifferentiating Planck’s law, the estimated effectivetemperature of the Earth’s surface would be 255 K. The wavelength corresponding to the maximum energyemitted is about 0.5 mm (visible part of the spectrum)for the Sun and 10 mm (infrared part of the spectrum)for the Earth. However, it is known that the Earth’saverage global temperature is 288 K or 15°C, i.e. 33 Kwarmer than that estimated from the balance between
absorbed and emitted energy. This is due to thepresence of the gases forming the earth’s atmosphere.In the atmosphere, there is significant absorption of theSun’s ultraviolet (UV) radiation by ozone, and of theEarth’s infrared (IR) radiation by water vapour, carbondioxide and other trace gases. The absorption ofterrestrial IR radiation is especially important for theenergy balance of the earth’s atmosphere (Campbell,1986; Trenberth, 2004). A small proportion of thisradiation is released into space (generally in the highestand coldest layers of the atmosphere), but most isreflected back towards Earth. The GHGs in theatmosphere are transparent to the incoming short-wavesolar radiation, but absorb that emitted by the Earth,whose wavelength is considerably longer. Most of theIR radiation is absorbed by the troposphere. The neteffect, known as the natural greenhouse effect, is thatthe Earth stores more energy near its surface than itwould absorb in the absence of an atmosphere, raisingthe temperature by about 33 K. Despite theconsiderable absorption by these GHGs, there is an‘atmospheric window’ through which terrestrial IRradiation can pass unaltered (Kemp, 1994). This occursin the interval between 8 and 13 mm, and its gradualclosing is one of the effects of anthropogenic emissionsof GHGs. Naturally, as well as absorbing solarradiation, the gases in the atmosphere, together withaerosols, also scatter it. The scattering of solar radiationis also extremely important, since this can alter theatmosphere’s overall energy balance. Gas molecules,which are small compared to the wavelength of theincident radiation, cause scattering in all directions inaccordance with the phenomenon known as Rayleighscattering. Aerosols whose size are comparable to thewavelength of the incident radiation cause Miescattering, which mainly occurs in the oppositedirection to that of the incident radiation. This explainswhy the presence of atmospheric aerosol affects the
937VOLUME III / NEW DEVELOPMENTS: ENERGY, TRANSPORT, SUSTAINABILITY
10.2
Emission and controlof greenhouse gases
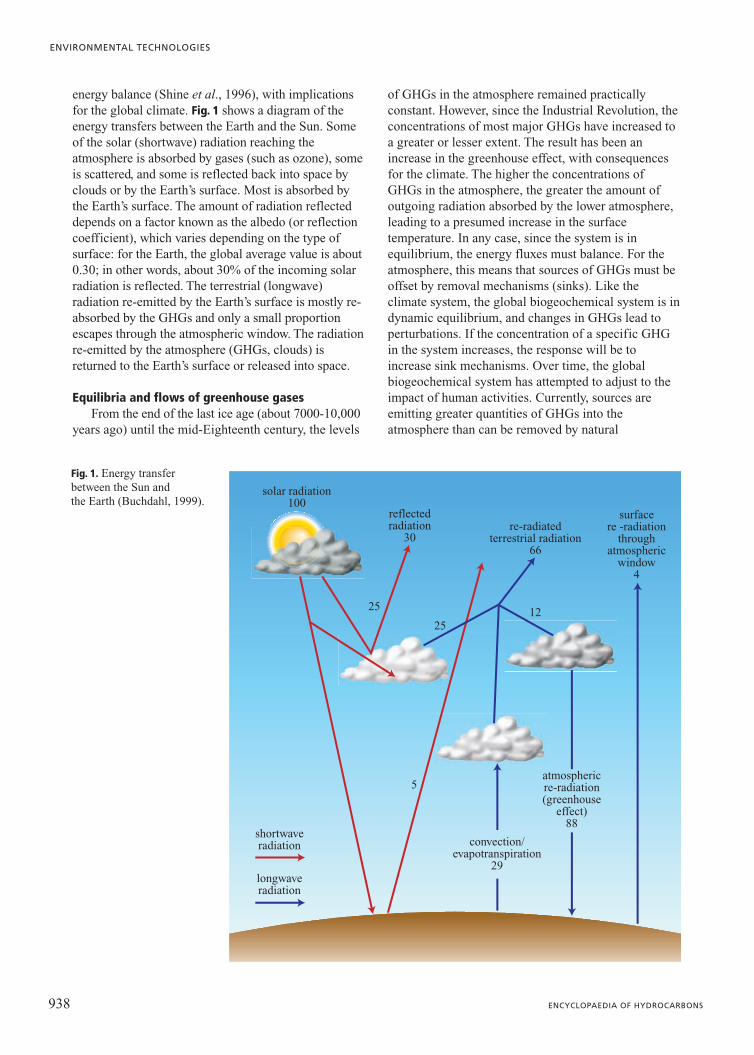
energy balance (Shine et al., 1996), with implicationsfor the global climate. Fig. 1 shows a diagram of theenergy transfers between the Earth and the Sun. Someof the solar (shortwave) radiation reaching theatmosphere is absorbed by gases (such as ozone), someis scattered, and some is reflected back into space byclouds or by the Earth’s surface. Most is absorbed bythe Earth’s surface. The amount of radiation reflecteddepends on a factor known as the albedo (or reflectioncoefficient), which varies depending on the type ofsurface: for the Earth, the global average value is about0.30; in other words, about 30% of the incoming solarradiation is reflected. The terrestrial (longwave)radiation re-emitted by the Earth’s surface is mostly re-absorbed by the GHGs and only a small proportionescapes through the atmospheric window. The radiationre-emitted by the atmosphere (GHGs, clouds) isreturned to the Earth’s surface or released into space.
Equilibria and flows of greenhouse gasesFrom the end of the last ice age (about 7000-10,000
years ago) until the mid-Eighteenth century, the levels
of GHGs in the atmosphere remained practicallyconstant. However, since the Industrial Revolution, theconcentrations of most major GHGs have increased toa greater or lesser extent. The result has been anincrease in the greenhouse effect, with consequencesfor the climate. The higher the concentrations ofGHGs in the atmosphere, the greater the amount ofoutgoing radiation absorbed by the lower atmosphere,leading to a presumed increase in the surfacetemperature. In any case, since the system is inequilibrium, the energy fluxes must balance. For theatmosphere, this means that sources of GHGs must beoffset by removal mechanisms (sinks). Like theclimate system, the global biogeochemical system is indynamic equilibrium, and changes in GHGs lead toperturbations. If the concentration of a specific GHGin the system increases, the response will be toincrease sink mechanisms. Over time, the globalbiogeochemical system has attempted to adjust to theimpact of human activities. Currently, sources areemitting greater quantities of GHGs into theatmosphere than can be removed by natural
938 ENCYCLOPAEDIA OF HYDROCARBONS
ENVIRONMENTAL TECHNOLOGIES
shortwaveradiation
solar radiation100
reflectedradiation
30re-radiated
terrestrial radiation66
surfacere -radiation
throughatmospheric
window4
convection/evapotranspiration
29
25
2512
5atmosphericre-radiation(greenhouse
effect)88
longwaveradiation
Fig. 1. Energy transferbetween the Sun andthe Earth (Buchdahl, 1999).

mechanisms. At their current atmosphericconcentrations, all species of GHG weaken IRradiation. However, each GHG contributes to climatechange to a different extent, depending on a) itscurrent and future concentrations (some compoundsalready absorb 100% of radiation at specificwavelengths, so that any future increases inconcentration will have no effect); b) the wavelength atwhich absorption occurs; this is important, forexample, when the absorption region is the same ofother compounds with complete absorption (furtherincreases will have no effect), whereas if theincreasing species absorb in the ‘window region’, theeffects will potentially be greater; c) the extent ofabsorption; d ) its residence time in the atmosphere.
Two indices have been developed to take accountof all these effects: RIRF (Relative InstantaneousRadiative Forcing), an index which measures theincrease in the absorption of IR radiation by a gas perunit increase in concentration, and GWP (GlobalWarming Potential), which is defined as follows:
ai(t)Ci[1] GWP ��t
0
111dtac(t)Cc
where ai is the instantaneous absorption per unitincrease of the i-th gas, Ci is its concentration at time t,ac is the corresponding absorption of carbon dioxideand Cc is the concentration of carbon dioxide at time t.The ratio ai �a0, where a0 is the instantaneousabsorption at time t�0, is equivalent to the RIRF.When expressed in this way, the GWP provides thecontribution to the global warming of any gas over the
long term, compared to carbon dioxide. Estimates ofthe global warming potential of different gases areshown in Table 1.
The carbon cycleThe biogeochemical carbon cycle (Fig. 2) in the
form of CO2, carbonates or organic substances involvesthe atmosphere, ocean, land and their variousorganisms, and over geological time scales, sediments
939VOLUME III / NEW DEVELOPMENTS: ENERGY, TRANSPORT, SUSTAINABILITY
EMISSION AND CONTROL OF GREENHOUSE GASES
atmosphere: 750primaryproductivity: 61.4
continentalbiomass: 4,380
dissolved organiccarbon: 700
marinebiomass: 3
anthropogenicemissions
surface ocean:1,020
sea floor sediments: 150
deep ocean:38,100
land-usechanges
respiration:60 5.51.6 0.5
66
4
40 91.6 100
92
90
0.2
50
Fig. 2. Global carbon cycle (Schimel et al., 1996).
Table 1. Contributions to the global warming potential
GASResidence time
(year)a Instantaneous RIRF indexGWP
Global warming potentialc
CO2 50-200b 1 1
CH4 12 43 21d
N2O 120 250 310d
CFC-11 60 15,000 3,400e
CFC-12 195 19,000 7,100e
HCFC-22 12 13,000 1,600e
a Residence times obtained from Houghton et al., 1996.b The residence times for CO2 change depending on the method used to calculate uptake by the oceans, especially if the whole surface ocean
is considered in the calculations. c Values obtained by integration over a period of 100 years.d Values obtained from «CO2/Climate Report», 1997.e Values obtained from «CO2/Climate Report», 1993. The values refer to the direct effect. The interaction of CFCs with ozone
in the lower stratosphere may reduce the amount of radiation reaching the atmosphere, contributing to cooling (in this case, the GWPsshould be reduced).

and rocks (Butcher et al., 1992). The global carboncycle, like other biogeochemical cycles, is in dynamicequilibrium. The atmosphere stores about 750 Gt(billion tonnes) of carbon (in the form of CO2). Thedeep ocean represents an enormous store of carbon,with 38,000 Gt, whilst the ocean surface containsapproximately 1,000 Gt (Schimel et al., 1996). Thesources of atmospheric CO2 can be subdivided into twogroups: natural and anthropogenic. Natural sourcesinclude the respiration of animals, 60 Gt per year(Houghton et al., 1994), and the surface of the ocean,90 Gt per year (Schimel et al., 1996). Anthropogenicsources essentially include the combustion of fossilfuels (for transport, the production of electricity, etc.),the production of cement and changing land-use(mainly deforestation). The surface of the ocean alsoacts as a sink for atmospheric CO2, with an annualuptake of 92 Gt of carbon. The other natural sink isphotosynthesis, which sequesters 61.4 Gt of carbonevery year (Schimel et al., 1996). The regrowth offorests in the northern hemisphere is another sink. Inresponse to the perturbation caused by anthropogenicemissions, a process of readjustment is underway,resulting in a rise in the atmospheric concentration ofCO2. A simple balance reveals an excess of 3.2 Gt ofcarbon per year entering the atmosphere. The resultingaccumulation of CO2, with respect to infinitesimal timedt, can be expressed by the equation:
d(DM)[2] 14444321�I �Dn�F �X
dt
where DM is the mass variation of CO2 present in theatmosphere; I, the emissions of CO2 from fossil fuelcombustion and cement production; Dn, the variationsin CO2 caused by changing land-use (deforestation);F, the net oceanic uptake of CO2 and X, the netterrestrial uptake of CO2; I, Dn, F and X are expressedas the mass of CO2 per unit time. Estimates of currentvalues for the terms in equation [2] have been made bythe IPCC (Intergovernmental Panel on ClimateChange; Houghton et al., 1990; 1992; 1994). Largequantities of CO2 are exchanged in the global carboncycle, which is coupled with the climate system onseasonal, yearly and ten-yearly time scales. Anaccurate understanding of the global carbon cycle isessential for the evaluation of future concentrations ofCO2 in the atmosphere.
Greenhouse gases
Carbon dioxideThe data supplied by the World Meteorological
Organization World Data Centre for GreenhouseGases (WMO WDCGG), collected from 102 stations(which measure on-line or off-line, such as thenetwork belonging to the NOAA/CMDL, NationalOceanic and Atmospheric Administration/ClimateMonitoring Diagnostic Laboratory) throughout theworld, indicate that mean global concentrations ofCO2 are increasing annually, and have increased fromabout 280 ppm (parts per million) during thepreindustrial era (Houghton et al., 2001) to a mean
940 ENCYCLOPAEDIA OF HYDROCARBONS
ENVIRONMENTAL TECHNOLOGIES
350
360
340
370
ppm
350
360
340
370
350
360
340
370
1983 1985 1987 1989 1991 19951993 1997 1999 200184 86 88 90 92 9694 98 00 02
year
carbon dioxide (CO2)
global
northern hemisphere
southern hemisphere
Fig. 3. Mean monthly CO2concentrations anddeseasonalized long-termtrends from 1983 to 2002,global and for eachhemisphere (GAW DATAWDCGG, 2004).

concentration of about 374 ppm in 2002, a netincrease of 27%. Concentrations have increasedmainly in the northern hemisphere and at middlelatitudes, indicating their association with the intensesources present in this hemisphere. The globalgrowth rate averaged 1.6 ppm/y in the period 1983-2001. However, growth rates vary significantly fromyear to year. The high rates of increase in 1983,1987-88, 1994-95 and 1997-98 are associated withthe warm oscillation events of El Niño. Theanomalous El Niño event in 1997-98 causedincreases observed worldwide in 1998. Theparticularly low growth rates in 1992, includingnegative values in the North and at middle latitudes,were caused by the low temperatures induced by theeruption of Mt. Pinatubo in 1991 (GAW DATAWDCGG, 2004). Fig. 3 shows, for the period from1983 to 2002, average monthly concentrations ofCO2 (thick dotted line) and long-term deseasonalizedtrends (solid line) obtained by eliminating the effectof seasonal oscillations, global and for eachhemisphere. Fig. 4 shows the deseasonalized long-term trends (Fig. 4 A) and growth rates (Fig. 4 B) forintervals of 30° latitude over the same period. Theseasonal cycle in the North mainly reflects seasonalvariations in uptake/emission into the biosphere,whereas the southern cycle is affected by variationsdetermined by the oceanic masses and thecombustion of biomass in the biosphere.
MethaneMethane (CH4) is the second most important gas in
terms of the greenhouse effect. In the period 1000-1800 BC, the concentration of CH4 was about 700 ppb(parts per billion), with an oscillation of plus or minus40 ppb due to variations in climate. The increase in theatmospheric concentration of CH4 from the beginningof the industrial era accounts for 20% of the totalperturbation in radiation emissions (Houghton et al.,2001). Atmospheric CH4 is produced mainly by theanaerobic digestion of organic matter and during theextraction of fossil fuels. CH4 is released both bynatural and anthropogenic sources: wetlands, oceans,landfills, rice paddies, enteric fermentation, gasextraction and the combustion of biomass. CH4 isremoved from the atmosphere by reaction with thehydroxyl radicals present in the troposphere andstratosphere, by reaction with chlorine atoms andoxygen atoms in the O(1D) excited state formed viaUV absorption in the stratosphere, or by absorptioninto the earth. The main sink for atmospheric methaneconsists of chemical reactions with hydroxyl radicalsin the troposphere, but this natural process is affectedby the reactions of the hydroxyl radicals with otheranthropogenic emissions, mainly carbon monoxide(CO) and hydrocarbons emitted by motor vehicles(Watson et al., 1990). Current evaluations of themethane removal process (Prather et al., 1996) giveestimates of around 445 Mt/y. However, there are
941VOLUME III / NEW DEVELOPMENTS: ENERGY, TRANSPORT, SUSTAINABILITY
EMISSION AND CONTROL OF GREENHOUSE GASES
60N-90N30N-60NEQ-30N30S-EQ60S-30S90S-60S A
B
ppm
ppm/year
year
carbon dioxide (CO2)
350
355
360
365
345
340
375
370
4
3
335
1
0
2
1983 1985 1987 1989 1991 19951993 1997 1999 200184 86 88 90 92 9694 98 00 02
Fig. 4. Deseasonalized long-term trends (A) and growth rates (B) of CO2 for intervals of 30°latitude (GAW DATAWDCGG, 2004).

significant uncertainties regarding sources and sinks,which must be further reduced if the calculations ofpredicted future atmospheric concentrations ofmethane are to be improved. The mean global growthrate was 8 ppb/y during the period 1984-2001, but therates show a decrease starting from the 1980s whennegative values were recorded at northern latitudes; in1996, the increase almost stopped in many areas.However, both hemispheres showed a high rate ofincrease in 1998, caused by an unusually high meanglobal temperature, followed by decreases withnegative values being recorded for the first time in2000. Unlike CO2, the differences in the seasonalcycle are high for CH4, not only in the northernhemisphere, but also at high and middle latitudes inthe southern hemisphere (GAW DATA WDCGG,2004). Fig. 5 shows the mean monthly concentrations(line with dots) and deseasonalized long-term trends(continuous line) from 1983 to 2002, global and foreach hemisphere. Fig. 6 shows the long-termdeseasonalized trends (Fig. 6 A) and growth rates(Fig. 6 B) for intervals of 30° latitude.
Nitrous oxideNitrous oxide (N2O) is a GHG with a residence
time in the atmosphere of 114 years. The atmosphericconcentration of this gas has increased constantly fromabout 270 ppb in the preindustrial era to current levelswhich are 16% higher than those in 1750 (Houghton etal., 2001). Tropical soils are probably the mostimportant source of the N2O in the atmosphere
(Prather et al., 1996) and it is probable that theintensification of agriculture will cause furtherincreases (Matson and Vitousek, 1990). According toIPCC calculations, 4 Mt/y of N2O (in the form ofnitrogen) are emitted by tropical soils (Houghton etal., 1994), 75% of which derives from wet forest zonesand 25% from deserts. Anthropogenic sources mayaccount for 40% of total emissions (5.7 Mt/y) andinclude farmland, the combustion of biomass andindustry (nylon production, for example). Total currentemissions are estimated to be in the order of 14.7 Mt/y(�3.5 Mt/y). The main sinks for N2O are stratosphericphotodissociation and photooxidation, calculated at12.3 Mt/y (�3.5 Mt/y). Fig. 7 (GAW DATA WDCGG,2004) reports the monthly chronological series of N2Oconcentrations in the two hemispheres. The increasecurrently observed in the atmospheric concentration ofN2O suggests that an excess of 3.9 Mt/y is beingemitted into the atmosphere. N2O concentrations arenow in the order of 310 ppb (Machida et al., 1994).
Halogenated hydrocarbonsThe general term halogenated hydrocarbons is used
to describe compounds containing carbon and one ormore halogens: fluorine, chlorine, bromine and iodine.Chlorofluorocarbons (CFCs) contain fluorine andchlorine, but not hydrogen, whereashydrochlorofluorocarbons (HCFCs) also containhydrogen. Carbon tetrachloride (CCl4), trichloroethane(CH3CCl3) and hydrocarbons containing bromine aresubstances which damage the ozone layer.
942 ENCYCLOPAEDIA OF HYDROCARBONS
ENVIRONMENTAL TECHNOLOGIES
ppb
1983 1985 1987 1989 1991 19951993 1997 1999 200184 86 88 90 92 9694 98 00 02
year
methane (CH4)
global
northern hemisphere
southern hemisphere
1,700
1,800
1,600
1,700
1,800
1,600
1,700
1,800
1,600
Fig. 5. Mean monthly CH4concentrations (bold line)and deseasonalizedlong-term trends(continuous line)from 1983 to 2002, global and for bothhemispheres (GAW DATA WDCGG,2004).

The depletion of stratospheric ozone leads to thecooling of the lower stratosphere. However, the increasein halogenated hydrocarbons produces a net positiveperturbation on global warming, since the radiationabsorption effect is greater than the cooling producedby the depletion of stratospheric ozone (WMO, 1999).CFCs are mainly dissociated by UV radiation in thestratosphere and their lifetimes are generally long(for example, about 50 years for CFC-11). HCFC andCH3CCl3, which contain hydrogen, react with the
hydroxyl radicals in the troposphere and haverelatively short lifetimes (for example, about 5 yearsfor CH3CCl3). CFCs and HCFCs are producedexclusively by human activities and do not exist innature. They are widely used as solvents in theelectronics industry and as propellants in aerosols, inthe manufacture of polyurethane foams, inair-conditioning and refrigeration systems. Thanks tothe Montreal Protocol (on substances which depletethe ozone layer), their production and use are being
943VOLUME III / NEW DEVELOPMENTS: ENERGY, TRANSPORT, SUSTAINABILITY
EMISSION AND CONTROL OF GREENHOUSE GASES
60N-90N30N-60NEQ-30N30S-EQ60S-30S90S-60S
A
B
ppb
ppb/year
year
methane (CH4)
1983 1985 1987 1989 1991 19951993 1997 1999 200184 86 88 90 92 9694 98 00 02
1,700
1,750
1,800
1,650
1,850
1,600
20
15
5
0
10
Fig. 6. Deseasonalized long-term trends (A)and growth rates (B) of CH4 for intervals of 30° latitude (GAW DATA WDCGG,2004).
295
320
315
310
305
300
1984198219801978 1986 1988 1990 1992 19961994 1998 2000 2002year
conc
entr
atio
n (p
pb)
northern hemisphere
southern hemisphere
N2O
Fig. 7. Chronological series of mean monthly N2O concentrations.

phased out. Consequently, global concentrations of allCFCs are currently nearly constant or slowlydecreasing in both hemispheres.
The concentrations of HCFC-141b andHCFC-142b, on the other hand, are increasing linearly.Comparing the data from different stations, it can beseen that in the 1980s, the differences in concentrationbetween the hemispheres were high for all compoundsexcept HCFCs. However, the differences aredecreasing, whilst the increased concentration ofHCFCs is the result of their use instead of CFCs.
OzoneOzone (O3) plays an important role in the
atmosphere since it absorbs UV radiation in thestratosphere and IR radiation in the troposphere.However, ozone differs significantly from other GHGs(such as CO2, CH4, and CFC) in that it has no directsources, but is formed in the atmosphere itself. Itsconcentration ranges from 10 ppb in the troposphere toabout 10 ppm in the stratosphere. Unlike CO2, CH4
and CFCs or other halogenated hydrocarbons whoseconcentrations are relatively uniform, ozone hasconcentration gradients (even vertical ones) within thetroposphere. A small quantity of tropospheric ozonemay derive from the stratosphere, but most is formedchemically via various reactions involving ozoneprecursors (mostly Volatile Organic Compounds,VOCs, and nitrogen oxides) of mainly anthropogenicorigin. Ozone is consumed by chemical reactions withnitrogen monoxide, with some VOCs and withhydroxyl radicals, or by deposition on surfaces. Sinceemissions of precursors, mainly VOCs, are localizedand their lifetimes are generally brief, the distributionof ozone at the surface is localized and varies over
time (photochemical smog). The concentration of O3
varies from one monitoring station to another, and hasbeen increasing since the preindustrial era (Houghtonet al., 2001). Since seasonal and annual variations aresignificant, long-term trends are difficult to predict.Fig. 8 (GAW DATA WDCGG, 2004) shows the peakseasonal trends at intervals of 30° latitude aftersubtracting long-term trends.
Particulate matter and aerosolsParticulate Matter (PM) and aerosols (condensed
matter dispersed in the air) reflect and absorb theradiation received, playing an important role in theradiation fluxes exchanged by the atmosphere. Theyare produced directly or by chemical reactions incombustion processes, both from natural sources suchas biomass and in industrial processes or humanactivities. The scattering effect of aerosols on solarradiation has already been mentioned. The extent ofthe scattering depends on the chemical nature of theparticulate substance. For example, sulphuratedspecies, ammonium nitrate and condensed organicmatter contribute differently to scattering. A correctevaluation of the interaction of aerosols with radiationrequires knowledge of the size and chemicalcomposition of the particulate matter (vanLoon andDuffy, 2000). In fact, their optical properties areinfluenced by the size and chemical nature of thesubstances, but also by their hydroscopic properties.Although this topic is still being debated, sulphates areconsidered the most important particulate substancesto track in forecast models. The concentration ofammonium nitrate in aerosols is increasingly beingtaken into consideration, because the available data onatmospheric concentrations are not accurate
944 ENCYCLOPAEDIA OF HYDROCARBONS
ENVIRONMENTAL TECHNOLOGIES
60N-90N30N-60NEQ-30N30S-EQ60S-30S90S-60S
(ppb
)
10
5
0
�10
�5
month
surf
ace
ozon
e
jan feb mar apr may juljun aug sept oct nov dec
Fig. 8. O3 peak meanseasonal cycles for intervals of 30° latitude after the subtraction of long-termtrends (GAW DATAWDCGG, 2004).

(due to analytical errors resulting from its volatility)and because the effects linked to composition areunclear. Most studies on this subject neglect thecontribution of nitrates, since they are found infractions with submicronic diameters which shouldhave a limited effect on scattering. Recentmeasurements of concentrations in aerosols, carried outin the Netherlands using sampling techniques withouterrors, lead to the conclusion that the concentration ofnitrates in the atmosphere is similar to sulphates, and isgenerally underestimated (Khlystov, 1998).
Ammonium nitrate and sulphates are alsohygroscopic salts. The absorption of water underconditions of high humidity causes an increase in thesize of the particulate, with a consequent increase inthe scattering effect. The particles’ hygroscopicity alsoinduces the formation of cloud droplets which producetwo further contrasting effects, leading on the onehand to an increase of reflectivity and on the other toan increase of the lifetime of the clouds, encouragingthe absorption of radiation.
Clouds form on water-soluble particles which pre-exist the aerosols (Cloud Condensation Nuclei or CCN).The number of condensation nuclei determines theconcentration of cloud droplets. Smaller particles tendto increase the number of cloud droplets, inhibitingrainfall and increasing the period of cloud cover, whichimpedes the entrance of shortwave solar radiation. Onthe other hand, the IR absorption of the cloud increasesthe GHG effect. As such, the effect of aerosols on theEarth’s energy balance is controversial. The presence ofaerosols may actually mask the warming produced bythe accumulation of GHGs. Global warming may evenaccelerate if the planned reductions of nitrate andsulphate are implemented in the context of acid rain andeutrophization control programmes.
Water vapourWater is able to absorb IR radiation and thus exerts
a natural greenhouse effect. Water vapour is the mainGHG in the atmosphere, accounting for over 60% ofnatural warming (20.6 of a total of 33 K). Whereas thewater vapour content of the air varies significantly intime and space, global mean relative humidity isconstant at about 1%. The role of water may, however,become critical in the future. In fact, as a result ofglobal warming, an increase in evaporation ispredicted. An increase in atmospheric humidity leadsto an increase of fluxes of wet deposition (rain, snowand storms), with a resulting modification of watercycles. A higher water content in the atmosphere mayalso either increase warming through the absorption ofsolar radiation or decrease warming due to theincrease in reflectivity. Moreover, evaporationprocesses from landmasses are predicted to increase,
given the construction of surface reservoirs and tanksor irrigation practices. While the atmospheric watervapour contributes significantly to the naturalgreenhouse effect, the effects on the climate resultingfrom the increase in the vapour content are predictedto be in a few percentage points. However, since watervapour may cause both warming and cooling, the neteffect on the Earth’s temperature is difficult toforecast.
Although there is ample proof of an increase inatmospheric water vapour in various parts of theworld, based on data from the United Statesmonitoring network (746 stations), the informationprovided by the network of stations (190) belonging tothe ex-Soviet Union shows a decreasing trend. Thoughthis issue still presents some controversial aspects,there is a general consensus that any further increasesin the water content will be insufficient to modify theclimate further, whereas the modification of regionalwater cycles is believed possible.
10.2.2 Sources of greenhouse gas emissions
GHGs are emitted by numerous sources. The mostimportant anthropogenic source is associated with theproduction of energy and the use of fossil fuels fortransport, industrial activities and heating, as well asfarming practices. Every year, international emissioninventories are updated and published on the Internetsites of the relevant authorities. Behind every strategyto intervene on and evaluate emissions lies aninventory on both a local and global scale. TheEuropean situation will be described briefly below asan example of how effective GHG control mechanismscan be implemented on the basis of this information.In 2001, the sector involved in energy productionrepresent the largest source of GHGs (27% of totalGHG emissions; Fig. 9 and Table 2). This calculationincluded emissions from the combustion of fossil fuelsfor the production of electricity and heat, productionand refining of petroleum, the manufacture of solidfuels and other industrial energy productions. Theproduction of heat and electricity accounted for about85% of the emissions from this strategic sector and oilrefining for about 11%. Fuels containing carbonproduce CO2 in combustion processes. Among thefossil fuels, coal releases most CO2 per unit of energyproduced, although new combustion processes andemerging technologies are increasing efficiency,allowing for lower emissions of carbon dioxide perunit of energy produced. Among carbon-basedproducts, natural gas emits less CO2 than coal or oilper unit of energy produced, but the emissions of CH4
945VOLUME III / NEW DEVELOPMENTS: ENERGY, TRANSPORT, SUSTAINABILITY
EMISSION AND CONTROL OF GREENHOUSE GASES

linked to coal mining and gas production wells, and/orlosses during separation processes and transportationmay contribute to the greenhouse effect, since methanealso acts as a GHG.
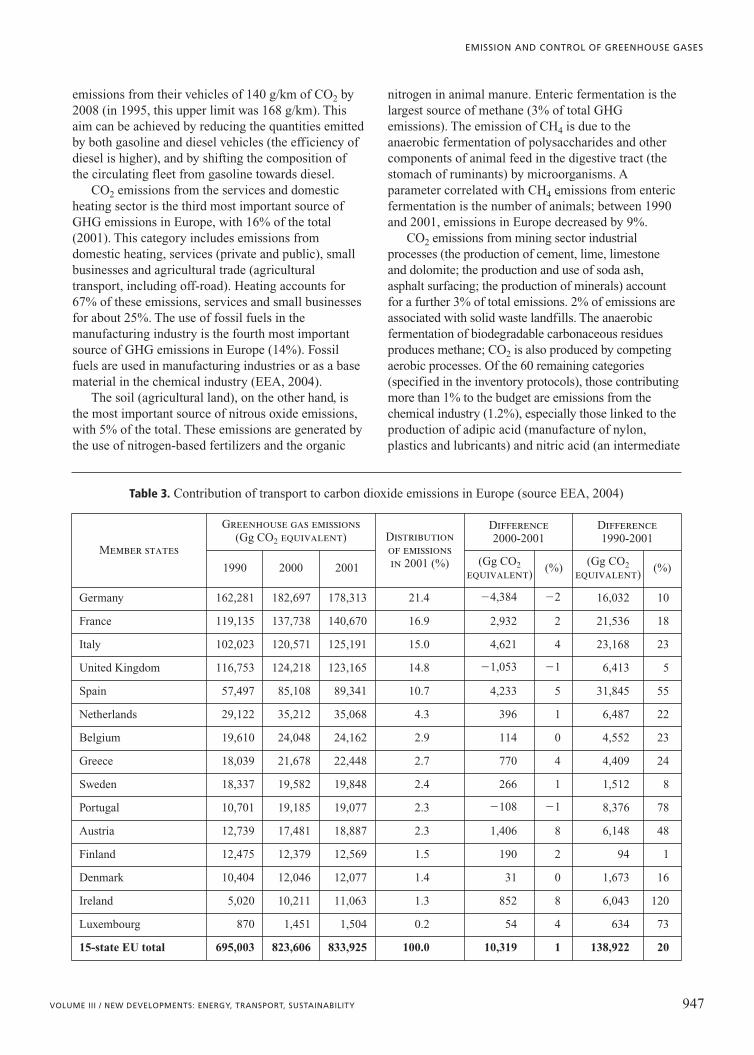
Emissions from transport, in other words thecombustion of fossil fuels for road transport, civilaviation, railways, shipping and other typologies(CDIAC, 1993) are the second most important sourcein the European CO2 inventory. In 2001, the transportsector accounted for 20% of total GHGs. Roadtransport is predominant, accounting for 92% of totalCO2 emissions from transport. Aviation is the mostrapidly growing transport sector, whilst rail transportis the sector experiencing the fastest decrease. Table 3shows the emissions from traffic in European Unioncountries (15 member states) whose trends reflectdifferences in development and the policiesimplemented, and the effects of the circulating fleet(RIVM, 2004). As far as the transport sector isconcerned, Europe aims to further reduce specificemissions of CO2 from new vehicles by increasingtheir efficiency. Manufacturers worldwide, throughvoluntary agreements, have imposed an upper limit on
946 ENCYCLOPAEDIA OF HYDROCARBONS
ENVIRONMENTAL TECHNOLOGIES
27%20%
14%
5%3%
3%2%10%
16%
transport
fermentations(CH4)
others
manufacturingindustrymineralproductionservices and domesticheating
soil (N2O)
landfills
energy
Fig. 9. Contribution of different sources to greenhouse gas emissions in 2001 in Europe (EEA, 2004).
Table 2. Contributions of energy sources to carbon dioxide emissions in Europe (source EEA, 2004)
Memeber states
Greenhouse gas emissions(Gg CO2 equivalent) Distribution
of emissionsin 2001 (%)
Difference 2000-2001
Difference 1990-2001
1990 2000 2001(Gg CO2
equivalent)(%)
(Gg CO2equivalent)
(%)
Germany 412,896 340,043 345,293 30.8 5,250 2 �67,604 �16
United Kingdom 228,090 190,184 199,229 17.8 9,045 5 �28,860 �13
Italy 138,957 157,835 155,279 13.9 �2,556 �2 16,322 12
Spain 77,030 104,082 98,417 8.8 �5,666 �5 21,387 28
Netherlands 51,305 61,222 64,776 5.8 3,553 6 13,471 26
France 67,636 63,694 57,487 5.1 �6,207 �10 �10,149 �15
Greece 43,302 55,058 55,579 5.0 521 1 12,277 28
Finland 18,517 19,815 26,762 2.4 6,946 35 8,244 45
Belgium 28,572 27,482 26,669 2.4 �813 �3 �1,904 �7
Denmark 26,202 25,121 26,375 2.4 1,254 5 173 1
Portugal 16,199 21,280 21,953 2.0 672 3 5,754 36
Ireland 11,057 16,016 17,145 1.5 1,128 7 6,087 55
Austria 13,225 12,236 14,375 1.3 2,139 17 1,150 9
Sweden 10,169 8,336 9,697 0.9 1,361 16 �473 �5
Luxembourg 1,277 255 266 0.0 11 4 �1,011 �79
15-state EU total 1,144,434 1,102,660 1,119,301 100.0 16,641 2 –25,133 –2
emissions from their vehicles of 140 g/km of CO2 by2008 (in 1995, this upper limit was 168 g/km). Thisaim can be achieved by reducing the quantities emittedby both gasoline and diesel vehicles (the efficiency ofdiesel is higher), and by shifting the composition ofthe circulating fleet from gasoline towards diesel.
CO2 emissions from the services and domesticheating sector is the third most important source ofGHG emissions in Europe, with 16% of the total(2001). This category includes emissions fromdomestic heating, services (private and public), smallbusinesses and agricultural trade (agriculturaltransport, including off-road). Heating accounts for67% of these emissions, services and small businessesfor about 25%. The use of fossil fuels in themanufacturing industry is the fourth most importantsource of GHG emissions in Europe (14%). Fossilfuels are used in manufacturing industries or as a basematerial in the chemical industry (EEA, 2004).
The soil (agricultural land), on the other hand, isthe most important source of nitrous oxide emissions,with 5% of the total. These emissions are generated bythe use of nitrogen-based fertilizers and the organic
nitrogen in animal manure. Enteric fermentation is thelargest source of methane (3% of total GHGemissions). The emission of CH4 is due to theanaerobic fermentation of polysaccharides and othercomponents of animal feed in the digestive tract (thestomach of ruminants) by microorganisms. Aparameter correlated with CH4 emissions from entericfermentation is the number of animals; between 1990and 2001, emissions in Europe decreased by 9%.
CO2 emissions from mining sector industrialprocesses (the production of cement, lime, limestoneand dolomite; the production and use of soda ash,asphalt surfacing; the production of minerals) accountfor a further 3% of total emissions. 2% of emissions areassociated with solid waste landfills. The anaerobicfermentation of biodegradable carbonaceous residuesproduces methane; CO2 is also produced by competingaerobic processes. Of the 60 remaining categories(specified in the inventory protocols), those contributingmore than 1% to the budget are emissions from thechemical industry (1.2%), especially those linked to theproduction of adipic acid (manufacture of nylon,plastics and lubricants) and nitric acid (an intermediate
947VOLUME III / NEW DEVELOPMENTS: ENERGY, TRANSPORT, SUSTAINABILITY
EMISSION AND CONTROL OF GREENHOUSE GASES
Table 3. Contribution of transport to carbon dioxide emissions in Europe (source EEA, 2004)
Member states
Greenhouse gas emissions(Gg CO2 equivalent) Distribution
of emissionsin 2001 (%)
Difference 2000-2001
Difference 1990-2001
1990 2000 2001(Gg CO2
equivalent)(%)
(Gg CO2equivalent)
(%)
Germany 162,281 182,697 178,313 21.4 �4,384 �2 16,032 10
France 119,135 137,738 140,670 16.9 2,932 2 21,536 18
Italy 102,023 120,571 125,191 15.0 4,621 4 23,168 23
United Kingdom 116,753 124,218 123,165 14.8 �1,053 �1 6,413 5
Spain 57,497 85,108 89,341 10.7 4,233 5 31,845 55
Netherlands 29,122 35,212 35,068 4.3 396 1 6,487 22
Belgium 19,610 24,048 24,162 2.9 114 0 4,552 23
Greece 18,039 21,678 22,448 2.7 770 4 4,409 24
Sweden 18,337 19,582 19,848 2.4 266 1 1,512 8
Portugal 10,701 19,185 19,077 2.3 �108 �1 8,376 78
Austria 12,739 17,481 18,887 2.3 1,406 8 6,148 48
Finland 12,475 12,379 12,569 1.5 190 2 94 1
Denmark 10,404 12,046 12,077 1.4 31 0 1,673 16
Ireland 5,020 10,211 11,063 1.3 852 8 6,043 120
Luxembourg 870 1,451 1,504 0.2 54 4 634 73
15-state EU total 695,003 823,606 833,925 100.0 10,319 1 138,922 20

in fertilizer production), which are neverthelessdecreasing, and CH4 emissions due to fertilizationpractices (1.1%). The latter are caused by thedecomposition of manure under anaerobic conditions.The greatest sources of emissions are the dairy andforage industries, poultry and pig farms, wheremanure is typically stored in large heaps or in storagetanks (Houghton et al., 1997).
Halogenated hydrocarbons currently account for0.8% of total GHG emissions in Europe. The emissionof HCFCs is due to the gradual elimination of CFCs,their use in place of CFCs in refrigeration and airconditioning units, as aerosol propellants, and in theproduction of materials for thermal insulation. N2Oemissions from transport account for 0.6% of totalGHG emissions in the European Union. The mostimportant source of N2O from transport are gasolinevehicles equipped with catalytic converters. N2Oemissions are mainly produced during the catalystpreheating phase. If the latter degrades or ages, thereis an increase in the duration of the preheating phase,with a resulting increase in emissions. Themeasurement of emissions from gasoline vehiclesequipped with first generation 3-way catalyticconverters has shown a significant increase in N2Oemissions compared to vehicles without converters, adrawback which appears close to finding a solutionwith the introduction of new catalyst formulations(EC, 2000).
10.2.3 Techniques for measuring greenhousegases in ambient air
It has been possible to monitor and control the GHGsin ambient air for many years. The conventionaltechniques are described below; more advancedmethodologies are now available, including satelliteobservation (WMO, 2001).
Carbon dioxideCarbon dioxide measurements can be carried out
by taking air samples, generally weekly, in 2-litre steelcontainers. After collection, the sample is analysedusing an infrared analyser (NDIR, Non DispersiveInfraRed). Water vapour, which interferes with themeasurement, is removed using a cold trap (at �60°C)or, alternatively, by removing the water with selectiveadsorption during measurement. The systems arecalibrated using mixtures of CO2 and air, calibrated attwo levels. The concentration of these referencesamples is calibrated periodically with secondarysamples (produced from the standard primarymixtures) at at least three levels every ten days.
The secondary samples are checked every six monthswith primary samples of CO2 in air.
OzoneThe reference method for the analysis of ozone and
its instrumental calibration has recently beenstandardized by the European Union. The analysismethod is photometric and is based on the absorptionof UV radiation (in accordance with standard ISO13964 of the International Organization forStandardization).
Calibration uses a reference UV photometer(ISO 13964, VDI 2468, B1.6). The European directiveon ozone explicitly cites this calibration method. Thephotometer serves to generate stable and reproducibleconcentrations with which to calibrate the instruments,since it is impossible to prepare primary ozonestandards in other ways.
Measurements of ozone concentrations in theatmosphere currently make use of photometricanalysers of the type described in the referencestandard. The sampling line must be of a specifiedlength and consist of a Teflon tube to avoid losses onthe walls due to the high reactivity of this species. Theline is heated to avoid the condensation of water andfreezing. The instrument is equipped with Teflonfilters for particulate matter, as are all analysers for theatmospheric environment; these are replaced monthly.Checks on the suction rate of the sample and thereference gas must be carried out automatically every24 hours and recorded. The ozone monitoring systemmust be calibrated every two months using a samplewhich allows it to be referred to a primary standard.
Halogenated hydrocarbonsThe measurement technique for CFCs and HCFCs,
considering that their mean atmospheric concentrationranges from 1 to 600 ppt (parts per trillion in volume),requires extremely sensitive analytical methods.Preconcentration takes place during the samplingphase and is generally carried out with adsorptiontraps, cooled by the Peltier effect. Later, thecompounds are thermally desorbed in a gaschromatograph coupled to a mass spectrometer(GC-MS).
Volatile organic compoundsGas chromatography with a Flame Ionization
Detector (FID) is also used to measure VOCs,including methane. Using a separation column makesit possible to analyse total VOCs (THC, TotalHydroCarbons) and methane separately, and to deduceNon Methane Hydrocarbons (NMHC) by subtraction.Instruments based on this principle and meeting therequirements set out in the standards constitute the
948 ENCYCLOPAEDIA OF HYDROCARBONS
ENVIRONMENTAL TECHNOLOGIES

reference method for THC/NMHCs and methanethroughout the world. The performances of theanalytical tools are specified in the standards currentlyin force.
Nitrous oxideThe technique for measuring N2O involves weekly
sampling, generally using containers pressurized to2.8-3.0 bar. The analysis is undertaken using a gaschromatograph with an Electron Capture Detector(ECD).
Particulate matterThe gravimetric method is the reference method
for measuring the atmospheric concentration ofparticulate matter. The filters, whose trappingefficiency is above 99%, enrich the atmosphericparticulate matter which is sucked through them bypumps with suitable properties. Determining theweight under reference conditions (strictly controlledhumidity and temperature conditions before and aftersampling are specified) makes it possible to calculatethe differences in weight associated with thestandardized volume withdrawn. This method involvesdaily measurements and is used to establish one of theair quality standards. It will be necessary to includedevices to select granulometry when quality objectivesfor PM2.5 and PM10 (in other words, fine particulatematter with particle diameters below 2.5 or 10 mm)come into force. In this case, too, there areinternational standards (UNI EN 12341) describingthe sampling and analysis procedure for particulatematter, and the systems for demonstrating theequivalence of any other methods. Certificates issuedby the relevant institutes make it possible to usecertified continuous analysers, especially inmonitoring networks. Examples include those basedon an EPA method consisting of a microbalance inwhich an oscillating element changes its frequency ofoscillation in the presence of particulate matter(TEOM, Tapered Element Oscillating Microbalance),or beta counters which record the variation in theabsorption of beta radiation due to particulate matter.Other methods for measuring granulometricdistribution and particle counters are discussed in thechapters on particulate emissions from traffic, sincethese are designed for use in motor vehicles. Thesedevices make it possible to gain a deeperunderstanding of the distribution, by size and number,of the species in the form of aerosols present in theatmosphere. Usually, the methods and analyticaltechniques described are specified by internationalstandards (ISO), and are applied widely throughout theworld to obtain data which can be compared on aglobal scale, especially for GHGs.
10.2.4 Techniques for measuring greenhousegases in emissions
The measurement of GHG concentrations at source isnot a legal requirement either in Europe or the UnitedStates. The problem of greenhouse gases is currentlytackled with estimates of the amounts emitted basedon calculations and emission factors; however, thereare measurement methods recognized by internationalbodies.
The techniques for measuring GHGs in ambient airdescribed above are usually suited to emissions, but, incontrast to what occurs in the energy sector andmobile sources for which Continuous EmissionMonitoring (CEM) systems or other techniques havebeen developed and applied, their application to themonitoring of GHGs is still fairly rare. CO2
measurements at chimney is sometimes carried outcontinuously with the aim of controlling combustionprocesses.
Continuous monitoring systems for use onchimneys must usually be certified, and meet precisefunctional and construction standards (sometimesspecified in legislation). Standard methods, orinternationally recognized methods, are constantlybeing developed. EPA and ISO methods for measuringGHGs in emissions are available, although often theseare not recognized by local standards (such as themethod for PM2.5 particulate in Europe).
Current standards require sampling and analysis atleast once a year for most pollutants emitted bychimneys and covered by regulations. Until now, onlya few chimneys have been equipped with on-linemonitoring systems able to measure GHGs (CO2 orCH4), due mainly to the absence of legal requirements.IR-based instruments, including Fourier TransformInfraRed (FTIR) spectroscopy, are able to measureemissions from combustion processes, including thoseof CO2 and methane. However, there are recognizedanalysis methods, mainly developed by EPA and ISO,for off-line applications for most of the relevantspecies. In contrast to the United States, Europe has noofficially recognized methodology for the on-linemeasurement of particulate matter, with the selectionof granulometry or the aerodynamic diameter (PM2.5or PM10). A completely different method formeasuring particulate matter in terms of size andnumber of particles and which operates continuouslyis in the advanced testing phase for mobile sources,where it is currently used for research purposes.Similarly, in the case of mobile sources the evaluationof carbon dioxide, methane or nitrous oxide is notcurrently obligatory, but these data are acquired forresearch purposes. Gas chromatography systems
949VOLUME III / NEW DEVELOPMENTS: ENERGY, TRANSPORT, SUSTAINABILITY
EMISSION AND CONTROL OF GREENHOUSE GASES

equipped with FID are used for the on-linemeasurement of methane based on the same principleadopted for ambient air; coupled with ECDs, these areused for the measurement of N2O, also possible withIR spectroscopy. For CO2 and CO, IR analysers arecommonly used.
Among the significant sources of GHG emissionsare combustion in flares, typical of hydrocarbonextraction facilities, refineries and petrochemicalplants (according to ENI estimates, about 30% of totalGHG emissions). The measurement of GHGs fromthis type of source is particularly critical. In fact,conventional methods are influenced by practicaldifficulties, linked mainly to the safety issues thatarise with flame systems. The variable nature of theflare and the surrounding conditions, both ofmeteorological and plant management type, mayinfluence the amounts actually emitted by the flare. Todate, annual emission values have been calculated,mainly for CO2, using an efficiency value (98%)established on the basis of experiments conducted inthe 1980s. The parameters influencing the efficiencyof combustion in flares include the wind velocity atthe mouth, the type of gas, etc. An analytical methodable to determine the actual composition of the gasesemitted during the operation of flares has recentlybeen developed using remote techniques based onIR spectroscopy (FTIR remote sensing).
The collation of emission factors for CO2, CO,CH4 and NOx (also as a function of meteorologicalparameters), the development of a model able topredict emissions as a function of these variables, orthe development of instruments to measure thequantities emitted will make it possible to evaluate andmanage this type of emissions more accurately. Theavailability of accurate experimental data is vital inprecisely those sectors where the evaluation ofemissions is affected by significant uncertainties. Anaccurate and consolidated measurement system wouldmake it possible to guarantee the emission valuescalculated for these systems. Emissions certification isan international requirement (especially in the contextof international emissions trading). As is known, thecertification requires a third, or independent, party toensure that the procedure used to calculate emissionsis transparent and correct, and that they correspondwith the emissions declared; certification may or maynot include experimental data as confirmation. Aninternationally recognized analytical methodology maydemonstrate that the calculations correspond to thequantities actually measured. A new standard iscurrently under development in Europe for themeasurement of carbon dioxide in chimneys andemissions. For the purposes of GHG emissionscertification and the corresponding estimates of
quantities emitted, the chemical characterization of thefuel is needed.
10.2.5 Strategies to controlgreenhouse gases
Mechanisms to control and reduce GHG emissionsrepresent a global problem, which by its very naturerequires a concerted response on a large scale. The factthat environmental problems are caused by the use offossil fuels, and that CO2 emissions are correlatedwith economic development, lead to further problems.The factors influencing CO2 emissions are obviousfrom the Kaya identity (Hoffert and Caldeira, 2004), aformula illustrating the problem of reducing emissionswhilst maintaining economic development. Theidentity expresses the carbon emission rate, C, as theproduct of the population (N), the pro capita grossdomestic product, GDP/N, the intensity of primaryenergy, E/GDP and the C/E carbon emission factor:
GDP E C[3] C �N �131�131�1
N GDP E
Few governments intervene in the development oftheir nation’s population, and economies are growingworldwide. As a result, the first two terms are uselessfor the purposes of reducing emissions. Thestabilization of the climate on a global scale is thus agoal which presents numerous difficulties. Economicdevelopment can hinder the application of measures indifferent countries, making it necessary to establish acommon basis for the actions to be undertaken. Thesecommon bases are set out in protocols (Montrealprotocol, EMEP, European Monitoring and EvaluationProgram, Kyoto Protocol, etc.). The cost of thenecessary interventions is increasing constantly,making it absolutely necessary to attain scientificknowledge of the relationship between cause andeffect regarding emissions. However, the cause-effectrelationships are extremely complex and require theuse of models. As is known, the accuracy of theoutcome of modelling is also linked to the quality ofthe input data – in this case, the intensity of sourcesand mechanisms which remove GHGs from theatmosphere (sinks). In fact, sources and sinks areaffected by significant uncertainties (linked, forexample, to the role of vegetation and the soil). Themanagement and control of GHGs is complicated bythe fact that the increase in CO2 concentrations has, todate, been caused by developed countries, whilst itseffects are particularly severe in developing countries.
The world’s scientific communities all agree on theneed to stabilize the atmospheric concentration of CO2
at values around 550 ppm (Fig. 10). According to
950 ENCYCLOPAEDIA OF HYDROCARBONS
ENVIRONMENTAL TECHNOLOGIES
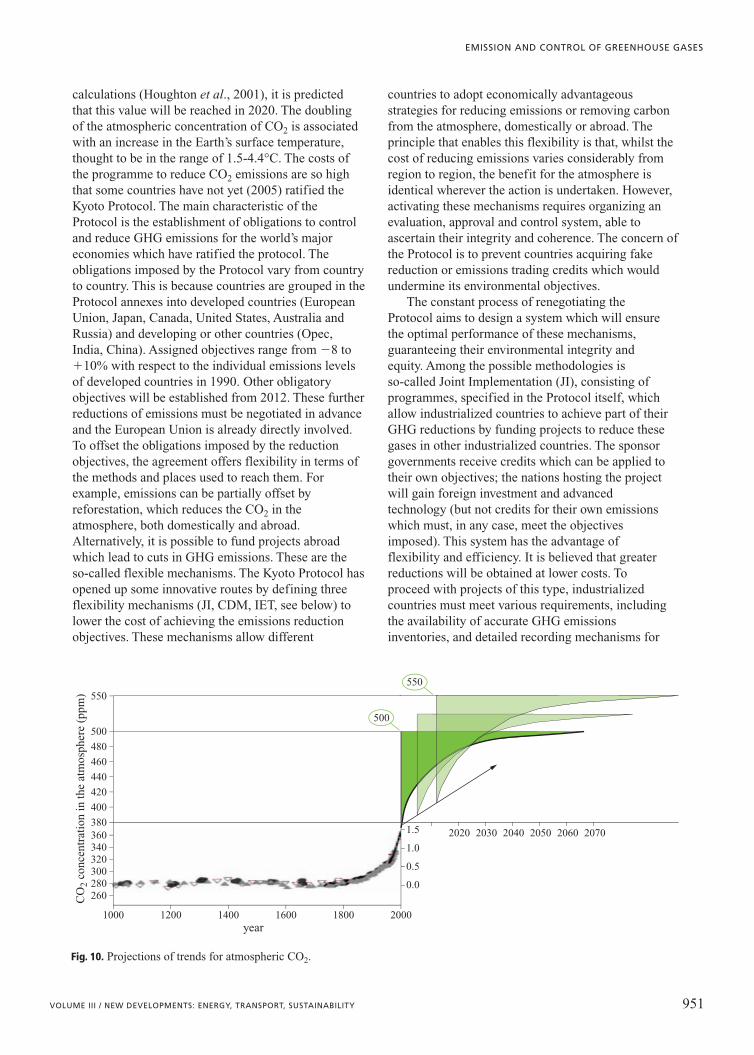
calculations (Houghton et al., 2001), it is predictedthat this value will be reached in 2020. The doublingof the atmospheric concentration of CO2 is associatedwith an increase in the Earth’s surface temperature,thought to be in the range of 1.5-4.4°C. The costs ofthe programme to reduce CO2 emissions are so highthat some countries have not yet (2005) ratified theKyoto Protocol. The main characteristic of theProtocol is the establishment of obligations to controland reduce GHG emissions for the world’s majoreconomies which have ratified the protocol. Theobligations imposed by the Protocol vary from countryto country. This is because countries are grouped in theProtocol annexes into developed countries (EuropeanUnion, Japan, Canada, United States, Australia andRussia) and developing or other countries (Opec,India, China). Assigned objectives range from �8 to�10% with respect to the individual emissions levelsof developed countries in 1990. Other obligatoryobjectives will be established from 2012. These furtherreductions of emissions must be negotiated in advanceand the European Union is already directly involved.To offset the obligations imposed by the reductionobjectives, the agreement offers flexibility in terms ofthe methods and places used to reach them. Forexample, emissions can be partially offset byreforestation, which reduces the CO2 in theatmosphere, both domestically and abroad.Alternatively, it is possible to fund projects abroadwhich lead to cuts in GHG emissions. These are theso-called flexible mechanisms. The Kyoto Protocol hasopened up some innovative routes by defining threeflexibility mechanisms (JI, CDM, IET, see below) tolower the cost of achieving the emissions reductionobjectives. These mechanisms allow different
countries to adopt economically advantageousstrategies for reducing emissions or removing carbonfrom the atmosphere, domestically or abroad. Theprinciple that enables this flexibility is that, whilst thecost of reducing emissions varies considerably fromregion to region, the benefit for the atmosphere isidentical wherever the action is undertaken. However,activating these mechanisms requires organizing anevaluation, approval and control system, able toascertain their integrity and coherence. The concern ofthe Protocol is to prevent countries acquiring fakereduction or emissions trading credits which wouldundermine its environmental objectives.
The constant process of renegotiating theProtocol aims to design a system which will ensurethe optimal performance of these mechanisms,guaranteeing their environmental integrity andequity. Among the possible methodologies isso-called Joint Implementation (JI), consisting ofprogrammes, specified in the Protocol itself, whichallow industrialized countries to achieve part of theirGHG reductions by funding projects to reduce thesegases in other industrialized countries. The sponsorgovernments receive credits which can be applied totheir own objectives; the nations hosting the projectwill gain foreign investment and advancedtechnology (but not credits for their own emissionswhich must, in any case, meet the objectivesimposed). This system has the advantage offlexibility and efficiency. It is believed that greaterreductions will be obtained at lower costs. Toproceed with projects of this type, industrializedcountries must meet various requirements, includingthe availability of accurate GHG emissionsinventories, and detailed recording mechanisms for
951VOLUME III / NEW DEVELOPMENTS: ENERGY, TRANSPORT, SUSTAINABILITY
EMISSION AND CONTROL OF GREENHOUSE GASES
CO
2 co
ncen
trat
ion
in th
e at
mos
pher
e (p
pm)
260280300320340360380
400
420
440
460
480
500500
550550
1.5
1.0
0.5
0.0
1000 1200 1400 1600 1800 2000
2020 2030 2040 2050 2060 2070
year
Fig. 10. Projections of trends for atmospheric CO2.

the units emitted and credits, a requirement sharedby the procedures of International EmissionsTrading (IET) on the carbon market. If theserequirements are met, the countries can start theprojects and receive credits from 2008 onwards. Ifan industrialized country has not yet formalized theGHG recording or inventory system, it can activatethis type of project through an alternativemechanism, subjecting itself to tighter internationalcontrols. These controls may be delegated to privatebodies which will ascertain the true efficiency ofemissions reduction and issue certificates. With theJI mechanism, a country obtains EmissionReduction Units (ERUs) which can be used to reachits own objectives. Replacing a coal-fired powerstation with a more efficient combined cycle powerstation is one example of a JI project. It is thoughtthat most of these projects will be of interest to thecountries of Eastern Europe with transitionaleconomies. JI projects must be approved by all theparties involved and must lead to the reduction orremoval of emissions which are supplementary tothose specified. Projects involving Land Use (LU),Land Use Change (LUC) and Land-Use Change orForestry (LUCF), since these are CO2 removalsystems, may represent JI activities. The projectsmay be activated earlier, but credits will be availableonly after 2008. With the first method describedabove, a country hosting a JI project may apply itsown rules and procedures to the selection of projectsand the evaluation of the associated emissionreductions. With the second procedure, the hostcountry is supervised by a committee. However, acountry may decide to take this alternative routeeven if it has satisfied the Protocol’s requirements, ifthe calculations carried out using the internationalverification procedure allow it to obtain morecredits. The so-called Clean DevelopmentMechanisms (CDMs) are similar to JI projects, andlead to Certified Emission Reductions (CERs)through projects which reduce emissions incountries other than those listed in Annex I of theKyoto Protocol. The CERs generated by theseprojects may be used by the countries in Annex I toattain the emission reductions specified in theProtocol. A CDM project may consist, for example,of a project to provide electricity to a rural area withsolar panels or the installation of more energy-efficient boilers. CDM projects must be approved byall the parties involved and by the relevant nationalorganizations, must reduce emissions to below thelevels existing without the project, and aresupervised by an executive council. A debate is stillunderway on whether to include reforestation amongCDM projects. The limits on GHG emissions
regulated by the Kyoto Protocol assign a commonmonetary value to the Earth’s atmosphere. In fact,the nations which have contributed most to globalwarming have benefited economically, while theyhave not been judged proportionally responsible forthe damage to the environment caused by theiremissions.
The Protocol will also allow countries with excessemission credits to sell these to countries which haveexceeded their objectives. This will create the so-called carbon market, since carbon dioxide will be themost widely produced GHG and other gases will becounted as carbon dioxide equivalents. Countriesunable to meet their commitments will be able to buycompliance at a price determined by the market. Thehigher the price, the greater the pressure to researchmore efficient energy uses and promote and developalternative sources of energy with low emission levels.Creating a global stock market where emission unitsare traded is a simple concept, but requires thecreation of a complex system. The details of theworkings of this Emission Trading system were notspecified in the Protocol, and supplementarynegotiations have taken place at various meetings(Marrakech agreements and COP, Conference ofParties). The difficulties are obvious: the actualemissions of each country must be controlled andguaranteed, and exchanges must be recorded andsubjected to transparent controls. As a consequence,there is a need to establish not only methods forrecording the emissions exchanges of differentcountries, but also procedures for recording emissions;a group of expert auditors must be set up to guaranteecompliance. The emissions traded will also consist ofcredits acquired with JI or CDM projects. Thesecredits can be bought or sold, or set aside for futureuse. Some national recording systems are alreadyoperational in the countries which intend to capitalizeon the emission reductions already achieved. Smallcarbon markets are being activated in Europe andgroups of other countries, which will later be linked tothe global market once it becomes operational. TheKyoto Protocol and its actions were undertaken toreduce the effect of CO2 emissions on the climate, butwithout ignoring the transport sector. In this context, itis known that 25% of the CO2 generated by transport isunaffected by the current policies of the EuropeanUnion, especially the emissions of internationalaviation and sea transport, which grew significantlybetween 1993 and 2001. Deregulation and the so-calledopen skies policy, alliances between airlines and thesignificant reduction of airport taxes, alongside theincrease in low cost companies have led to an increasein this source of CO2 emissions. In Europe, there is adebate on potential interventions in this sector.
952 ENCYCLOPAEDIA OF HYDROCARBONS
ENVIRONMENTAL TECHNOLOGIES
References
Buchdahl J.M. (1999) Global climate change student guide.A review of contemporary and prehistoric global climatechange, Manchester, Manchester Metropolitan University,Atmospheric Research and Information Centre.
Butcher S.S. et al. (edited by) (1992) Global biogeochemicalcycles, London, Academic Press.
Campbell I.M. (1986) Energy and the atmosphere: a physical-chemical approach, Chichester, John Wiley.
CDIAC (Carbon Dioxide Information Analysis Centre) (1993)Trends ’91, ’93. A compendium of data on global change,Oak Ridge (TN), Oak Ridge National Laboratory.
«CO2/Climate Report» (1993), Special Issue.«CO2/Climate Report» (1997), Issue 97-1.Critchfield H.J. (1983) General climatology, Englewood
Cliffs (NJ), Prentice-Hall.EC (European Community) (2000) Economic evaluation of
emissions reductions in the transport sector of the EU.Economic evaluation of sectoral emission reductionobjectives for climate change, Contribution to a study forthe European Commission Environment DG by EcofysEnergy and Environment, AEA Technology Environmentand the National Technical University of Athens, FinalReport, December.
EEA (European Environmental Agency) (2004) Analysis ofgreenhouse gases emission trends and projections in Europe2003, EEA, Technical Report 4.
GAW DATA WDCGG (2004) Greenhouse gases and otheratmospheric gases, March, v.IV, Report 28.
Hoffert M.I., Caldeira K. (2004) Encyclopedia of energy,Amsterdam, Elsevier, 6v.; v.I.
Houghton J.T. et al. (edited by) (1990) Climate change. TheIntergovernmental Panel on Climate Change scientificassessment, IPCC, Cambridge, Cambridge University Press.
Houghton J.T. et al. (edited by) (1992) Climate change 1992.The supplementary report to the Intergovernmental Panelon Climate Change scientific assessment, IPCC, Cambridge,Cambridge University Press.
Houghton J.T. et al. (edited by) (1994) Climate change 1994.Radiative forcing of climate change, and an evaluation ofthe Intergovernmental Panel on Climate Change IS92emission scenarios, IPCC, Cambridge, Cambridge UniversityPress.
Houghton J.T. et al. (edited by) (1996) Climate change 1995.The science of climate change, Cambridge, CambridgeUniversity Press.
Houghton J.T. et al. (edited by) (1997) An introduction tosimple climate models used in the Intergovernmental Panelon Climate Change second assessment report, IPCC,Cambridge, Cambridge University Press.
Houghton J.T. et al. (edited by) (2001) Climate change 2001.The scientific basis, IPCC, Cambridge, Cambridge UniversityPress.
Kemp D.D. (1994) Global environmental issues: a climatologicalapproach, London, Routledge.
Khlystov A. (1998) Cloud forming properties of ambientaerosol in the Netherlands and resultant shortwave radiativeforcing of climate, Wageningen, University of Wageningen,Department of Agricultural Sciences.
Loon G.W. van, Duffy S.J. (2000) Environmental chemistry:a global perspective, New York, Oxford University Press.
Machida T. et al. (1994) Atmospheric methane and nitrousoxide concentrations during the last 250 years deducedfrom H15 Ice Core, Antarctica. Proceedings of theInternational symposium on global cycles of atmosphericgreenhouse gases, Sendai (Japan), 7-10 March, 113-116.
Matson P., Vitousek P. (1990) Ecosystems approach to aglobal nitrous oxide budget, «Bioscience», 40, 667-672.
Prather M. et al. (1996) Other trace gases and atmosphericchemistry, in: Houghton J.T. et al. (edited by) Climatechange 1995. The science of climate change, Cambridge,Cambridge University Press, 73-126.
RIVM (Rijks Instituut voor Volksgezondheld en Milieu) (2004)Outstanding environmental issues. A review of the EU’senvironmental agenda, Bilthoven (The Netherlands), RIVM.
Schimel D. et al. (1996) CO2 and the carbon cycle, in:Houghton J.T. et al. (edited by) Climate change 1995. Thescience of climate change, Cambridge, CambridgeUniversity Press, 35-71.
Shine K.P. et al. (1996) Radiative forcing, in: Houghton J.T.et al. (edited by) Climate change 1995. The science ofclimate change, Cambridge, Cambridge University Press,163-203.
Trenberth K.E. (2004) Encyclopedia of energy, Amsterdam,Elsevier, 6v.; v.I.
Watson R.T. et al. (1990) Greenhouse gases and aerosols,in: Houghton J.T. et al. (edited by) Climate change. TheIntergovernmental Panel on Climate Change scientificassessment, IPCC, Cambridge, Cambridge University Press,1-40.
WMO (World Meteorological Organization) (1999) Scientificassessment of ozone depletion: 1998. Executive summary,WMO Global Ozone Research Monitoring Project,Report 44.
WMO (World Meteorological Organization) (2001) Globalatmosphere watch. Measurements guide, WMO, July,Report 143.
Ivo AllegriniConsiglio Nazionale delle Ricerche
Istituto sull’Inquinamento AtmosfericoMonterotondo, Roma, Italy
Patrizia ButtiniEniTecnologie
Monterotondo, Roma, Italy
953VOLUME III / NEW DEVELOPMENTS: ENERGY, TRANSPORT, SUSTAINABILITY
EMISSION AND CONTROL OF GREENHOUSE GASES