1014 IEEE TRANSACTIONS ON AUTOMATION SCIENCE · PDF file1014 IEEE TRANSACTIONS ON AUTOMATION...
12
1014 IEEE TRANSACTIONS ON AUTOMATION SCIENCE AND ENGINEERING, VOL. 10, NO. 4, OCTOBER 2013 Detection of Correlated Alarms Based on Similarity Coef ficients of Binary Data Zijiang Yang, Jiandong Wang, and Tongwen Chen, Fellow, IEEE Abstract—This paper studies the statistical analysis for alarm signals in order to detect whether two alarm signals are corre- lated. First, a similarity measurement, namely, Sorgenfrei coeffi- cient, is selected among 22 similarity coefficients for binary data in the literature. The selection is based on the desired properties asso- ciated with specialities of alarm signals. Second, the distribution of a so-called correlation delay is shown to be indispensable and effec- tive for the detection of correlated alarms. Finally, a novel method for detection of correlated alarms is proposed based on Sorgenfrei coefficient and distribution of the correlation delay. Numerical and industrial examples are provided to illustrate and validate the ob- tained results. Note to Practitioners: Alarm systems have been recognized as critical assets of industrial plants for safety and efficient opera- tion. However, operators of industrial plants often receive far more alarms than they can handle promptly. Many alarms belong to the correlated alarms that almost always occur within a short time pe- riod of each other. Detecting and handling the correlated alarms can improve the performance of alarm systems. This paper pro- poses a novel method to detect whether two industrial alarm sig- nals are statistically correlated. The proposed method is applicable to alarm signals in various industrial sectors, including power and utility, process and manufacturing, and oil and gas, and is one of the fundamental tools in advanced alarm management systems. Index Terms—Alarm signals, binary data, correlated alarms, similarity coefficients. I. INTRODUCTION A LARM systems are of paramount importance to safety and efficient operation of modern industrial plants, in- cluding power stations, oil refineries, and petrochemical facili- ties [2], [15]. A well designed and efficient alarm system should meet with some performance criteria such as those in the guide from the Engineering Equipment and Materials Users’ Associ- ation (EEMUA) [7]. However, according to industrial surveys (see, e.g., in [2, Table IV], [15, Table 4.7.3]), operators of in- dustrial plants often receive much more alarms than they can Manuscript received August 28, 2012; revised December 03, 2012; accepted February 09, 2013. Date of publication March 22, 2013; date of current version October 02, 2013. This paper was recommended for publication by Associate Editor M. K. Jeong and Editor H. Ding upon evaluation of the reviewers’ comments. This work was supported in part by the Shandong Electric Power Research Institute, NSERC, and NSFC under Grant 60704031 and Grant 61061130559. Z. Yang and J. Wang are with the College of Engineering, Peking University, Beijing 100871, China (e-mail: [email protected]; [email protected]). T. Chen is with the Department of Electrical and Computer Engineering, University of Alberta, Edmonton, AB T6G 2V4, Canada (e-mail: tchen@ual- berta.ca). Color versions of one or more of the figures in this paper are available online at http://ieeexplore.ieee.org. Digital Object Identifier 10.1109/TASE.2013.2248000 handle promptly. Hence, advanced alarm management systems have received an increasing attention from both industrial and academic communities. It is well known that industrial processes are usually equipped with interacting components; as a result, it is not unusual to see several alarms triggered by the same initiating abnormal event, or some closely related alarms conveying similar infor- mation. These alarms are commonly known as consequential/re- lated alarms. Rothenberg [15, p. 123] gave the definitions: “con- sequential alarms are ones that occur one before the other, with the same one activating first; related alarms occur one after the other, but without a specific order.” Both the consequential and related alarms are referred to as the correlated alarms [15]. Once correlated alarms are detected, there are several approaches to deal with them, e.g., redundant alarms in cause-consequence groups can be suppressed [2], [7], or the most important or in- formative alarm in a related group of alarms can be highlighted for operators [15]. Doing so could greatly improve the perfor- mance of alarm systems and bring benefits to industrial opera- tions, e.g., reducing operator reaction time to detect sources of primary faults. Due to the increasing complexity and varying dynamics in the modern industrial processes, usually it is a dif- ficult and time-consuming task for operators to classify the cor- related alarms solely based on process knowledge and operation experience. Hence, it would be valuable to have a systematic ap- proach to detect the correlated alarms in an automatic manner, and design advance alarm management systems to deal with these correlated alarms. The detection of correlated alarms has received increasing attentions lately. Dahlstrand [6] used multilevel flow models based on the process knowledge to perform consequence anal- ysis to find the root cause of alarms. Brooks et al. [3] exploited the parallel coordinate to capture the relationship of multivariate alarm signals and to obtain dynamically varying alarm limits, providing the historical data containing the information of best operating zones. Yang et al. [18] analyzed the discrepancy of correlation between process data and alarm data and used this information to optimize the alarm limits. Kondaveeti et al. [12] provided an alarm similarity color map to group similar alarms together based on the Jaccard similarity coefficient after padding alarm sequence with extra 1’s to existing alarm occurrences. Noda et al. [14] conducted correlation analysis between alarms and operation events to identify sequential alarms and unneces- sary operations. Yang et al. [19] generated pseudo continuous time series from the original binary alarm data and used a cor- relation color map of the pseudo data to show the cluster of cor- related variables. The objective of this paper is to detect correlated alarms via some statistical analysis. The contribution is threefold: First, 1545-5955 © 2013 IEEE
Transcript of 1014 IEEE TRANSACTIONS ON AUTOMATION SCIENCE · PDF file1014 IEEE TRANSACTIONS ON AUTOMATION...

1014 IEEE TRANSACTIONS ON AUTOMATION SCIENCE AND ENGINEERING, VOL. 10, NO. 4, OCTOBER 2013
Detection of Correlated Alarms Based onSimilarity Coefficients of Binary Data
Zijiang Yang, Jiandong Wang, and Tongwen Chen, Fellow, IEEE
Abstract—This paper studies the statistical analysis for alarmsignals in order to detect whether two alarm signals are corre-lated. First, a similarity measurement, namely, Sorgenfrei coeffi-cient, is selected among 22 similarity coefficients for binary data inthe literature. The selection is based on the desired properties asso-ciated with specialities of alarm signals. Second, the distribution ofa so-called correlation delay is shown to be indispensable and effec-tive for the detection of correlated alarms. Finally, a novel methodfor detection of correlated alarms is proposed based on Sorgenfreicoefficient and distribution of the correlation delay. Numerical andindustrial examples are provided to illustrate and validate the ob-tained results.
Note to Practitioners: Alarm systems have been recognized ascritical assets of industrial plants for safety and efficient opera-tion. However, operators of industrial plants often receive far morealarms than they can handle promptly. Many alarms belong to thecorrelated alarms that almost always occur within a short time pe-riod of each other. Detecting and handling the correlated alarmscan improve the performance of alarm systems. This paper pro-poses a novel method to detect whether two industrial alarm sig-nals are statistically correlated. The proposed method is applicableto alarm signals in various industrial sectors, including power andutility, process and manufacturing, and oil and gas, and is one ofthe fundamental tools in advanced alarm management systems.
Index Terms—Alarm signals, binary data, correlated alarms,similarity coefficients.
I. INTRODUCTION
A LARM systems are of paramount importance to safetyand efficient operation of modern industrial plants, in-
cluding power stations, oil refineries, and petrochemical facili-ties [2], [15]. A well designed and efficient alarm system shouldmeet with some performance criteria such as those in the guidefrom the Engineering Equipment and Materials Users’ Associ-ation (EEMUA) [7]. However, according to industrial surveys(see, e.g., in [2, Table IV], [15, Table 4.7.3]), operators of in-dustrial plants often receive much more alarms than they can
Manuscript received August 28, 2012; revised December 03, 2012; acceptedFebruary 09, 2013. Date of publication March 22, 2013; date of current versionOctober 02, 2013. This paper was recommended for publication by AssociateEditor M. K. Jeong and Editor H. Ding upon evaluation of the reviewers’comments. This work was supported in part by the Shandong Electric PowerResearch Institute, NSERC, and NSFC under Grant 60704031 and Grant61061130559.Z. Yang and J. Wang are with the College of Engineering, Peking University,
Beijing 100871, China (e-mail: [email protected]; [email protected]).T. Chen is with the Department of Electrical and Computer Engineering,
University of Alberta, Edmonton, AB T6G 2V4, Canada (e-mail: [email protected]).Color versions of one or more of the figures in this paper are available online
at http://ieeexplore.ieee.org.Digital Object Identifier 10.1109/TASE.2013.2248000
handle promptly. Hence, advanced alarm management systemshave received an increasing attention from both industrial andacademic communities.It is well known that industrial processes are usually equipped
with interacting components; as a result, it is not unusual tosee several alarms triggered by the same initiating abnormalevent, or some closely related alarms conveying similar infor-mation. These alarms are commonly known as consequential/re-lated alarms. Rothenberg [15, p. 123] gave the definitions: “con-sequential alarms are ones that occur one before the other, withthe same one activating first; related alarms occur one after theother, but without a specific order.” Both the consequential andrelated alarms are referred to as the correlated alarms [15]. Oncecorrelated alarms are detected, there are several approaches todeal with them, e.g., redundant alarms in cause-consequencegroups can be suppressed [2], [7], or the most important or in-formative alarm in a related group of alarms can be highlightedfor operators [15]. Doing so could greatly improve the perfor-mance of alarm systems and bring benefits to industrial opera-tions, e.g., reducing operator reaction time to detect sources ofprimary faults. Due to the increasing complexity and varyingdynamics in the modern industrial processes, usually it is a dif-ficult and time-consuming task for operators to classify the cor-related alarms solely based on process knowledge and operationexperience. Hence, it would be valuable to have a systematic ap-proach to detect the correlated alarms in an automatic manner,and design advance alarm management systems to deal withthese correlated alarms.The detection of correlated alarms has received increasing
attentions lately. Dahlstrand [6] used multilevel flow modelsbased on the process knowledge to perform consequence anal-ysis to find the root cause of alarms. Brooks et al. [3] exploitedthe parallel coordinate to capture the relationship of multivariatealarm signals and to obtain dynamically varying alarm limits,providing the historical data containing the information of bestoperating zones. Yang et al. [18] analyzed the discrepancy ofcorrelation between process data and alarm data and used thisinformation to optimize the alarm limits. Kondaveeti et al. [12]provided an alarm similarity color map to group similar alarmstogether based on the Jaccard similarity coefficient after paddingalarm sequence with extra 1’s to existing alarm occurrences.Noda et al. [14] conducted correlation analysis between alarmsand operation events to identify sequential alarms and unneces-sary operations. Yang et al. [19] generated pseudo continuoustime series from the original binary alarm data and used a cor-relation color map of the pseudo data to show the cluster of cor-related variables.The objective of this paper is to detect correlated alarms via
some statistical analysis. The contribution is threefold: First,
1545-5955 © 2013 IEEE

YANG et al.: DETECTION OF CORRELATED ALARMS BASED ON SIMILARITY COEFFICIENTS OF BINARY DATA 1015
two formulations of alarm signals are compared in terms ofsuitability for detection of correlated alarms, and a similaritymeasurement, namely, Sorgenfrei coefficient, is selected among22 existing similarity coefficients for binary data. The selectionis on the basis of some desired properties associated with spe-cialities of alarm signals. Second, a so-called correlation delay,which is the time shift for two alarm signals to achieve the max-imum Sorgenfrei coefficient, is shown to be indispensable andeffective in detecting correlated alarms. Third, a novel methodfor detection of correlated alarms is proposed based on Sorgen-frei coefficient and distribution of the correlation delay. Somepreliminary results of this work have been presented in [20].The present paper is more complete in the formulation of theproposed method and uses different numerical and industrialexamples.Before starting with the study, it is necessary to clarify the
necessity of performing the analysis directly to alarm signals,instead of doing so to process signals, because it is very diffi-cult to have a statistical coefficient to describe a nonlinear re-lationship between two process signals, due to ample possibil-ities of nonlinear types. By contrast, the similarity coefficientsare equally applicable to alarm signals, whose correspondingprocess signals can be correlated in a linear or nonlinear manner.Nevertheless, performing the analysis directly to alarm signalsdoes not exclude the usage of process signals. In fact, the de-tection results based on alarm signals should be consistent withthe actual relationship between the corresponding process sig-nals. That is, with proper setting of alarm trippoint values, twoalarm signals are concluded to be correlated if and only if theirprocess signals are correlated.The rest of this paper is organized as follows. Section II se-
lects Sorgenfrei coefficient as the similarity measure suitable foralarm signals. Section III discusses the necessity of looking atthe distribution of the correlation delay, and proposes a methodfor the detection of correlated alarms. Section IV illustrates theproposed method via an industrial example. Finally, some con-cluding remarks are given in Section V.
II. SIMILARITY COEFFICIENTS FOR ALARM SIGNALS
This section summarizes 22 similarity coefficients for binarysequences, compares two formulations of alarm signals interms of suitability for detection of correlated alarms, andrecommends Sorgenfrei coefficient as the similarity measurefor alarm signals.
A. Similarity Measurements for Binary Sequences
As alarm signals are composed by only ‘1’s and ‘0’s thesimilarity measurements for binary sequences are applicable toalarm signals. There are perhaps 76 statistical coefficients as thesimilarity measurements in the literature [5]. Here, 22 of thembased on [4, Table I], therein, and [8, Table III], therein, aresummarized in Table I. The mathematical symbols in Table Iare defined as follows:
data length of the two sequences;
number of ‘1’s in the first sequence;
number of ‘1’s in the second sequence;
TABLE ISIMILARITY COEFFICIENTS FOR BINARY SEQUENCES
number of ‘0’ appeared simultaneously in bothsequences;
number of ‘1’s appeared simultaneously in bothsequences;
number of ‘1’s in the first sequence corresponding to‘0’s in the second sequence;
number of ‘1’s in the second sequence correspondingto ‘0’s in the first sequence.
Basic properties of the coefficients in Table I have alreadybeen studied, see, e.g., [4]. In particular, some coefficients focuson the matching of ‘1’ to ‘1’, while some pay more attention tothe matching of other types, e.g., ‘0’ to ‘0’. However, a simi-larity coefficient suitable for analyzing correlated alarm signalsshould have some special properties, e.g., the matching of ‘1’ to‘1’ is desired for alarm signals. Thus, it is necessary to analyzethe coefficients in Table I to select the ones having these specialproperties. Before conducting such an analysis, we need to dis-cuss two different formulations of alarm signals in Section II-B.
B. Two Formulations of Alarm Signals
It is a common practice in the industry that when a processsignal goes into the alarm state, the corresponding alarm signalchanges the value from ‘0’ to ‘1’, when the process signal runsfrom the alarm state to the non-alarm one, the alarm signalmakes an opposite switch from ‘1’ to ‘0’. However, thereare two possible formulations for the alarm signal when theprocess signal is in the alarm state. Let and be the

1016 IEEE TRANSACTIONS ON AUTOMATION SCIENCE AND ENGINEERING, VOL. 10, NO. 4, OCTOBER 2013
process signal and its associated high-alarm trippoint value,respectively. The first formulation is to let the alarm signal
take the value of ‘1’ throughout the period that isin the alarm state, i.e.,
ifif
(1)
The alarm signal in the second formulation takes the value of‘1’ only at the time instant when goes into the alarm statefrom the non-alarm state, i.e.,
if andotherwise
(2)
Here, the alarm trippoint value is assumed to be known apriori and properly designed in some manner; see [17] for asystematic design procedure of and other design methodsin [10], [13], and [16]. Both formulations have been adopted inliterature, see, e.g., [12], [18], and [19].The second formulation in (2) is more suitable to generate
alarm signals for the subsequence detection of correlatedalarms. It provides the information on the time instant whenthe process signal goes into the alarm state from the non-alarmstate, which is crucial to tell if two alarm sequences occur in acorrelated manner. By contrast, this information is very likelyto be overwhelmed for the first formulation in (1) by many‘1’s arisen from the period that the process signal stays in thealarm state. Since the similarity coefficients for alarm signalsare based on the matching of ‘1’ to ‘1’, the first formulationwill overestimate the similarity coefficients and may lead toincorrect conclusions. This fact can be revealed by a theoreticalanalysis on the two formulations for independent processsignals as follows.Consider the collected samples of process
signals and , and denote their alarm trippoint valuesas and . Choose Sorgenfrei coefficient1 (the eighth rowin Table I) as the similarity measure of alarm signals and
, denoted as
(3)
If is an independent and identically distributed (IID)process signal, then the probability of greater than itsalarm trippoint value is
(4)
Similarly, for another IID process signal , we have
(5)
Assume and are mutually independent to each other.Thus, for the first formulation of alarm signals in (1), andare binomial random variables being mutually independent,
i.e., , . Here, standsfor a binomial random variable with as the total number ofBernoulli trials and as the probability of success (taking
1Sorgenfrei coefficient is also named as the correlation ratio coefficient [5],[8].
the value of ‘1’) in each trial. The number is a hypergeo-metric random variable, standing for the number of ‘1’s in sam-ples of size drawn from a population consisting ‘1’s and
‘0’s. If and are small, then can be approxi-mated by a binomial random variable being independent toand , i.e., . The mean value of Sorgenfreicoefficient for the first formulation is
(6)
For the second formulation in (2), and are another set ofbinomial random variables being mutually independent, i.e.,
(7)
Owing to the triangular inequality, andare less than 1/4, e.g.,
Thus, can be regarded as a binomial random variables inde-pendent to and , i.e.,
(8)
The mean value of Sorgenfrei coefficient for the second formu-lation is
(9)
Since and , is always larger than
. The larger value of is due to too many‘1’s in the first formulation, and may lead to an incorrect con-clusion against the fact that and are independent,for which the next example provides a numerical illustration.Therefore, the second formulation in (2) is adopted in the sequel.1) Example 1: Let the distribution of a process signal
is
ifif
where is a Bernoulli random variable indicating whetheris in the normal or abnormal condition, and the distribution
of is and. Here, stands for a Gaussian random variable with
mean and standard deviation . Another process signal ,being independent to , has the same distribution as .The trippoint values for and are the same,
, so that both in (4) and in (5) are equal to 0.5.One-thousand Monte Carlo simulations are performed. In eachsimulation, the data length of collected samples for and
is equal to 1000. The two formulations in (1) and (2) areused to generate their own alarm signals for and .Fig. 1 presents some parts of and from the twoformulations in one simulation. Sorgenfrei coefficients
and are calculated based on the two groups of ’s

YANG et al.: DETECTION OF CORRELATED ALARMS BASED ON SIMILARITY COEFFICIENTS OF BINARY DATA 1017
Fig. 1. Two formulations of alarm signals: (a) the process signal (solid)and the alarm trippoint value (dash), (b) the alarm signal from thefirst formulation in (1), and (c) the alarm signal from the second formu-lation in (2).
TABLE IISAMPLE MEAN AND STANDARD DEVIATION OF
SORGENFREI COEFFICIENTS FOR TWO FORMULATIONS
from the first and second formulations, respectively. Table IIlists the sample means and standard deviations of and
, obtained from the 1000 Monte Carlo simulations. The
samplemeans are consistent with the theoretical values
in (6) and in (9) with . For
the first formulation, may lead to an incorrectconclusion that and are correlated.Remark #1: The second formulation has been selected for an-
alyzing correlated alarms. However, this does not imply that thesecond formulation should always be selected for other studieson alarm signals. For instance, the first formulation may bemoresuitable in detecting false alarms.
C. Selection of Similarity Coefficients
With alarm signals generated as that in (2), it is ready to se-lect a similarity coefficient among those in Table I suitable fordetection of correlated alarms.By considering the specialities of alarm signals, it would be
desirable for a selected similarity coefficient to have the fol-lowing properties:a) it focuses on the matching of ‘1’ to ‘1’ only;b) it takes a value inside the interval ;c) its value is expected to be as small as possible for the casethat two process signals are independent.
Property a) is a natural choice for the alarm signals generatedas that in (2) where the matching of ‘1’ to ‘1’ implies that alarms
TABLE IIIMMVS OF SEVEN SIMILARITY COEFFICIENTS
are tripped on in a synchronized manner. Property b) is a stan-dard requirement so that the similarity coefficient can be easilyinterpreted: If the similarity coefficient takes a value close to1 (0), then two alarm signals are strongly (weakly) correlated.Property c) is an intuitive requirement. Since the similarity co-efficient closer to 0 means a weaker correlation, this value isexpected to be as small as possible for two independent processsignals. Otherwise, if the similarity coefficient is quite large,e.g., Simpson coefficient equal to 1/2 shown later in Table III,then it would be against intuition to interpret such a high valueas indicating two uncorrelated alarms.Based on the three properties, we can now select a similarity
coefficient among those in Table I. Property a) rules out the sim-ilarity coefficients containing the term , because alarm sig-nals contain much more ‘0’s than ‘1’s and the term will playa dominant role to overwhelm the matching of ‘1’ to ‘1’. Thevalue ranges of similarity coefficients in Table I have alreadybeen investigated in [4] so that those similarity coefficients donot satisfy Property b) can be readily discarded. In summary,the similarity coefficients satisfying Properties a) and b) includeJaccard, Dice, 2nd Kulcz, Otsuka, Sorgenfrei, Simpson, andBraun-Bl. For Property c), we establish at Proposition 1 themaximum mean values (MMVs) of the above seven similaritycoefficients for two independent process signals. Sorgenfrei co-efficient has the smallest MMV 1/16, much smaller than others.Therefore, Sorgenfrei coefficient is the choice for the subse-quent detection of correlated alarms.Proposition 1: If two process signals and are mu-
tually independent, and each of them is IID, then the MMVsof Sorgenfrei, Jaccard, Dice, 2nd Kulcz, Otsuka, Simpson, andBraun-Bl are those in Table III.Proof of Proposition 1: Here, we prove the MMV of Sor-
genfrei coefficient in (3), i.e., . For Jaccard,Dice, 2nd Kulcz, Otsuka, Simpson, and Braun-Bl coefficients,their MMVs can also be established in a similar manner. Defineand respectively the same as (4) and (5). From (9), the
mean value of Sorgenfrei coefficient is
Using the triangular inequality, we have
The equality holds if and only if and ,leading to .

1018 IEEE TRANSACTIONS ON AUTOMATION SCIENCE AND ENGINEERING, VOL. 10, NO. 4, OCTOBER 2013
Fig. 2. The sample means of Sorgenfrei/Jaccard coefficients (circle/star) withone standard deviation confidence intervals ‘+’/‘x’.
1) Example 2: The MMVs of Sorgenfrei and Jaccard co-efficients are numerically validated here. The process signals
and and their alarm trippoint values are the sameas those in Example 1. We vary the data length of collectedsamples from to . Foreach data length, 1000 Monte Carlo simulations are performed.The sample means of Sorgenfrei and Jaccard coefficients are ob-tained, depicted as the circles and stars in Fig. 2; one standarddeviation confidence intervals around the sample means are alsoprovided in Fig. 2. As the data length increases, the two simi-larity coefficients approach to their own MMVs 1/16 and 1/7respectively.After selecting Sorgenfrei coefficient as the similarity mea-
sure, we propose a hypothesis test based on Proposition 1 to tellif two alarm signals are correlated. Kazt et al. [11] showed thatif and are independent binomial random variables, namely,
and , then withapproximately is normally distributed
with mean and variance
where and are realizations of and , respectively. Ifand are mutually independent and each of them is
IID, then , and are mutually independent binomialrandom variables as given in (7) and (8). By generalizingthe result in [11], it can be shown that the random variable
approximately is normally distributed with meanand variance
Thus, the confidence interval ofis given by
(10)
where is the th percentile of a standardGaussian distribution. A hypothesis test can be formulated toverify if and are correlated. That is, if the in-equality
(11)
holds, then it is claimed that and are correlated.2) Example 3: Two simulation experiments are performed.
In the first experiment, the process signals and andtheir alarm trippoint values are the same as those in Example1. The samples for are collected.After generating the alarm signals and by takingthe second formulation in (2), Sorgenfrei coefficient is cal-culated, with the 95% confidence interval
. Thus, the inequality (11) does not hold so thatand are uncorrelated. In the second experiment,
is the same as that in Example 1, while foran IID Gaussian noise being independent to
. The other settings are the same as the first experiment.Sorgenfrei coefficient is calculated, , with the95% confidence interval . Thus, the inequality(11) holds so that it is concluded that and arecorrelated.
III. DETECTION OF CORRELATED ALARMS
This section discusses the correlation delay, and proposes anovel method to detect whether two alarm signals are statisti-cally correlated or not.
A. Correlation Delay
Because alarm signals may be correlated in a dynamicmanner, Sorgenfrei coefficient is generalized as
(12)
where is referred to as Sorgenfrei sequence, takingthe value of Sorgenfrei coefficient in (3) between and
. Here, is obtained by shifting for-ward by samples if and backward by samples if
. For finite data lengths, a zero-padding strategy is ex-ploited to make and having the same numberof samples. The delay achieving in (12) is named as thecorrelation delay, denoted as , i.e.,
(13)
Proposition 1 says that if is greater than the MMV1/16, then and must be correlated. In practice,
is replaced by the hypothesis test in (11). How-ever, if is smaller than 1/16, then it does not necessarilymean that and are uncorrelated. In other words, it ispossible that for two correlated alarm signals and
is less than 1/16. This is due to strong effects from noise;in addition, Proposition 1 is based on the assumption that twoprocess signals are IID, which may not be hold in practice. Inthis case, we need to look at the distribution of the correlationdelay . If the distribution is concentrated to a small interval,

YANG et al.: DETECTION OF CORRELATED ALARMS BASED ON SIMILARITY COEFFICIENTS OF BINARY DATA 1019
Fig. 3. Process signals in Example 4a: (a) and (b) .
then and are believed to be correlated; otherwise,they are uncorrelated. The necessity of looking at the distribu-tion of is illustrated in the following numerical examples.1) Example 4a: Let the distribution of a process signal
is
ifif
where stands for the samples ofin the range , and is a Bernoullirandom variable indicating whether these samples of arein the normal or abnormal condition with the probabilities:
and . Anotherprocess signal , being independent to , has the samedistribution as . The trippoint values for andare the same, . One-hundred Monte Carlosimulations are performed. In each simulation, the total numberof realizations of is equal to 100, so that the data lengthof collected samples for and is equal to 1000.Fig. 3 presents the collected samples of and in onesimulation. The second formulation in (2) is used to generatethe alarm signals and . The calculated Sorgenfreicoefficients in the 100 simulations are presented in Fig. 4(a),together with the confidence intervals in (10). The histogram ofis presented in Fig. 4(b). It is clear that the inequality (11)
does not hold for most cases and the distribution of is notconcentrated to a small interval.2) Example 4b: The process signal is the same as that
in Example 4a. Another process signal is generated as
where is an IID Gaussian noise beingindependent to . The other settings are the same as Ex-ample 4a. Fig. 5(a) and (b), respectively, present the collectedsamples of and in one simulation. The calculatedSorgenfrei coefficients in the 100 simulations are presented in
Fig. 4. Results in Example 4a: (a) (solid) with its confidence interval(plus) in (10) and the critical value 1/16 (dash) and (b) the histogram of .
Fig. 5. Process signals in Examples 4b and 4c: (a) , (b) , and(c) .
Fig. 6(a). Sorgenfrei coefficients in Fig. 6(a) are similar to thosein Fig. 4(a), but the actual relation between andis completely different. The difference can be effectively foundvia the distribution of shown in Fig. 6(b). In the 100 simula-tions, is concentrated to the right time delay 0.Remark #1: It is important to detect the correlation relation-
ship, even if the current value of is small, and andlook like to be weakly correlated. Such a small value may
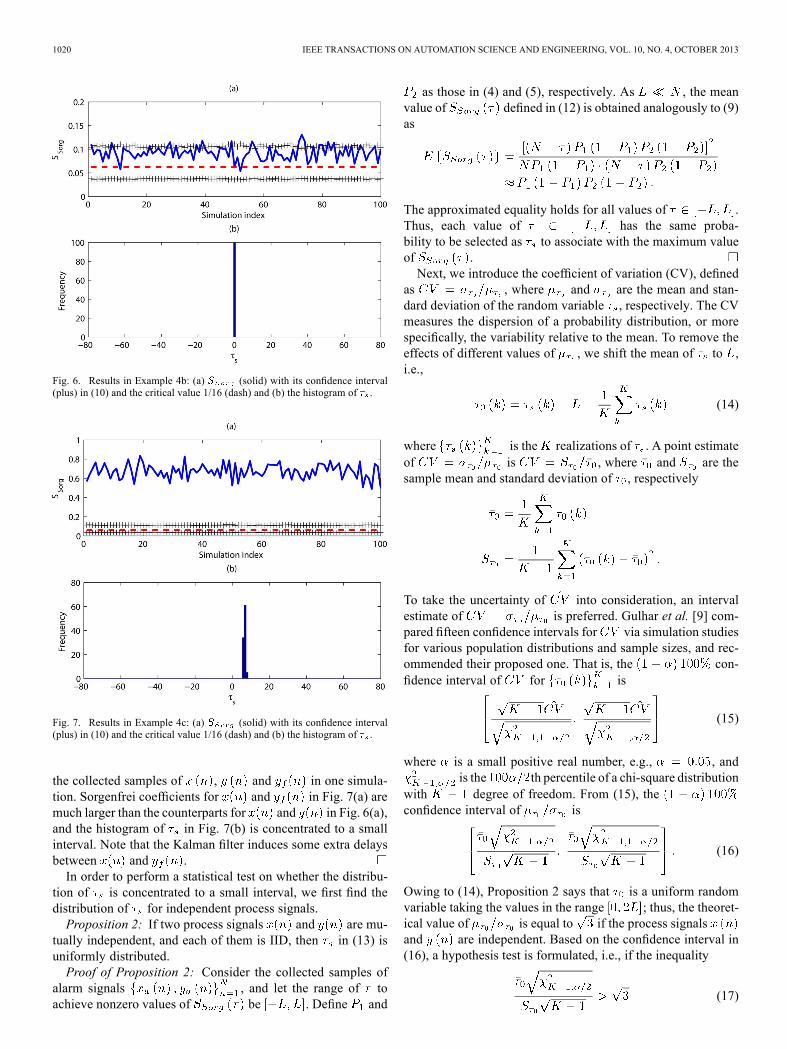
be caused by noise effects. In this case, wemay remove the noiseeffects by filtering process signals in order to detect the presenceof correlation, as illustrated in the next example.3) Example 4c: The process signals and , as well
as the simulation settings, are the same those in Example 4b. Wecan exploit a Kalman filter for tracking the mean variations in
in order to remove the noise effects (see, e.g., [1, Sec. III]).The filter version of is denoted as . Fig. 5 presents
1020 IEEE TRANSACTIONS ON AUTOMATION SCIENCE AND ENGINEERING, VOL. 10, NO. 4, OCTOBER 2013
Fig. 6. Results in Example 4b: (a) (solid) with its confidence interval(plus) in (10) and the critical value 1/16 (dash) and (b) the histogram of .
Fig. 7. Results in Example 4c: (a) (solid) with its confidence interval(plus) in (10) and the critical value 1/16 (dash) and (b) the histogram of .
the collected samples of , and in one simula-tion. Sorgenfrei coefficients for and in Fig. 7(a) aremuch larger than the counterparts for and in Fig. 6(a),and the histogram of in Fig. 7(b) is concentrated to a smallinterval. Note that the Kalman filter induces some extra delaysbetween and .In order to perform a statistical test on whether the distribu-
tion of is concentrated to a small interval, we first find thedistribution of for independent process signals.Proposition 2: If two process signals and are mu-
tually independent, and each of them is IID, then in (13) isuniformly distributed.Proof of Proposition 2: Consider the collected samples of
alarm signals , and let the range of toachieve nonzero values of be . Define and
as those in (4) and (5), respectively. As , the meanvalue of defined in (12) is obtained analogously to (9)as
The approximated equality holds for all values of .Thus, each value of has the same proba-bility to be selected as to associate with the maximum valueof .Next, we introduce the coefficient of variation (CV), defined
as , where and are the mean and stan-dard deviation of the random variable , respectively. The CVmeasures the dispersion of a probability distribution, or morespecifically, the variability relative to the mean. To remove theeffects of different values of , we shift the mean of to ,i.e.,
(14)
where is the realizations of . A point estimateof is , where and are thesample mean and standard deviation of , respectively
To take the uncertainty of into consideration, an intervalestimate of is preferred. Gulhar et al. [9] com-pared fifteen confidence intervals for via simulation studiesfor various population distributions and sample sizes, and rec-ommended their proposed one. That is, the con-fidence interval of for is
(15)
where is a small positive real number, e.g., , andis the th percentile of a chi-square distribution
with degree of freedom. From (15), theconfidence interval of is
(16)
Owing to (14), Proposition 2 says that is a uniform randomvariable taking the values in the range ; thus, the theoret-ical value of is equal to if the process signalsand are independent. Based on the confidence interval in(16), a hypothesis test is formulated, i.e., if the inequality
(17)

YANG et al.: DETECTION OF CORRELATED ALARMS BASED ON SIMILARITY COEFFICIENTS OF BINARY DATA 1021
Fig. 8. Calculated Sorgenfrei coefficients for different values of under threevalues of : (a) , (b) , and (c) .
holds, then it is claimed that the distribution of is not uni-formly distributed so that and are correlated.
B. Numbers of Alarms and Correlation Delays
In order to reach a reliable estimate of the similarity coeffi-cient , the numbers of alarms in and cannotbe too small; otherwise, the alarms tripped by noise could easilydeteriorate the reliability of the estimate. A natural question is:How many ‘1’s in and are required?We propose a rule of thumb as the answer: The numbers of ‘1’s
in the alarm signals and , generated via (2), shouldbe at least 30. This rule of thumb is obtained based on a numer-ical study as follows. Suppose that ,where both and are binary alarm signals. Let thenumber of ‘1’s in be a positive integer . The positionof each ‘1’ in is uniformly distributed and is denoted as. Then, ‘1’ appears either at with probability or at
with probability for a real number , i.e.,
Therefore, the mean value of Sorgenfrei coefficient is
It is expected that the calculated Sorgenfrei coefficient may bequite far away from the true value due to the effects of noise
for small values of , and get closer to the true value,while increases. The expectation is numerically validated inFig. 8. One-hundredMonte Carlo simulations are performed foreach value of , with a fixed data length ofand . Based on Fig. 8, we choose as a thresholdof trust, that is, the estimated similarity coefficient is expectedto be reliable when there are no less than 30 ‘1’s in and
.
Fig. 9. The curve of .
There is also a requirement on the sample size of the corre-lation delay samples . The requirement on can beobtained based on a numerical investigation on the confidenceinterval in (15). Fig. 9 presents the curve of that is de-fined as
Fig. 9 says that is smaller than 1 if is larger than 10.Thus, it is recommended that at least ten samples of are re-quired to yield an accurate estimate of .
C. Detection Method for Correlated Alarms
This subsection proposes a novel detection method for cor-related alarms, based on Sorgenfrei sequence , Sor-genfrei coefficient and the distribution of the correlationdelay .The proposed method consists of the following steps:1) Generate the alarm signals and as describedin the second formulation (2) from the process signalsand with the associated alarm trippoint values and, respectively.
2) If the numbers of ‘1’s in and are larger than30, then proceed to Step 3; otherwise, wait for the occur-rence of more alarms.
3) Calculate Sorgenfrei sequence for andwith where is a user-selected
positive integer, and find the largest value of asSorgenfrei coefficient . If the inequality (11) holds,then it is concluded that and are correlated;otherwise, proceed to Step 4.
4) Separate the collected data of and into at least10 data segments. For each data segment, the least totalnumber of ‘1’s in and is equal to 30. Obtainthe correlation delay in (13) for each data segment.
5) If the inequality (17) holds, then it is concluded that the dis-tribution of is concentrated to a small interval and

1022 IEEE TRANSACTIONS ON AUTOMATION SCIENCE AND ENGINEERING, VOL. 10, NO. 4, OCTOBER 2013
TABLE IVSAMPLE MEANS AND STANDARD DEVIATIONS OF THE SORGENFREI
AND JACCARD COEFFICIENTS IN EXAMPLE 5
and are correlated; otherwise, and arenot correlated.
Once the above steps have been implemented, we can con-clude if two alarm signals are statistically correlated. If thereare multiple alarm signals, the proposed method is applied toeach pair of them to detect the correlated alarms.Remark #2: It is recommended in Section III-B that at least
30 alarms are required to reach a reliable estimate of . Ifthe inequality (11) does not hold, then the distribution of hasto be calculated. In Section III-B, at least ten samples of arerecommended to yield a reliable estimate of . Thus, theestimation of the distribution of may require a large amountof data, depending on the frequency of appearance of alarms.
D. Comparison With Existing Methods
This subsection compares the difference between the pro-posed method and three other methods proposed by Kondaveetiet al. [12], Noda et al. [14], and Yang et al. [19], respectively.The proposed method has three major advantages: 1) the Sor-genfrei coefficient is more robust to noise effects than the Jac-card coefficient used in [12]; 2) the methods in [14] and [19]are based on the first formulation in (1) of alarm signals, whichmay overestimate the similarity coefficients and may lead to anincorrect conclusion; 3) the distribution of the correlation delayhas not been exploited in [12], [14], and [19], while this paper
finds it indispensable for detecting correlated alarms.First, both the proposedmethod and the alarm similarity color
map in [12] are based on the second formulation in (2) of alarmsignals; however, the Sorgenfrei coefficient has a smaller MMVthan that of Jaccard coefficient (Proposition 1), so that the Sor-genfrei coefficient is more robust to noise effects, as illustratedin the next example.1) Example 5: The process signal is the same as that
in Example 1, except that the distribution of is dif-ferent: and ,and another process signal is , where
is an IID Gaussian noise being independentto . The other settings, including the alarm trippoint values,are the same as those in Example 1. For three values of ,the sample means and standard deviations of the Sorgenfrei andJaccard coefficients in 1000 Monte Carlo simulations are listedin Table IV. When the noise level is small, both Sorgenfreiand Jaccard coefficients can correctly indicate that and
are correlated. However, in the case , the Jac-card coefficient is close to its MMV 1/7, which may lead to theconclusion that and are uncorrelated; by contrast,the Sorgenfrei coefficient is quite far away from its MMV 1/16,showing more robustness to noise effects.Second, the methods proposed by Noda et al. [14] and Yang
et al. [19] are based on the first formulation in (1) of alarm sig-nals. As illustrated by the theoretical analysis and Example 1 in
Section II-B, the first formulation may overestimate the simi-larity coefficients and yield an incorrect conclusion.If the second formulation in (2) of alarm signals is used, the
method in [19] may give results similar to the proposed method;however, there are many unsolved issues, such as the establish-ment of MMV of the correlation coefficient between pseudocontinuous time series and the associated hypothesis test, as thecounterparts of the MMV of Sorgenfrei coefficient in Proposi-tion 1 and the hypothesis test in (17). These issues are beyondthe scope of the current paper.In terms of the method in [14], even if the second formula-
tion in (2) of alarm signals is used, the similarity measure in[14] is less effective than in (12) in detecting correlatedalarms. By adopting the notation in this paper, the cross-corre-lation function between two events used in [14] is
and the maximum value of is denoted as
Thus, is the number of ‘1’s appeared simultaneously inboth and . By assuming two events (alarm sig-nals) being independent, the number of ‘1’s appeared simultane-ously in two event sequences approximately follows the Poissondistribution, based on which a similarity measure is proposed
(18)
where
and
It is obvious that is the same as the numerator ofSorgenfrei coefficient in (12). However, in (18)measures the cumulative probability at the value ofthe Poisson random variable with parameter , beingvery different with in (12). The next numerical exampleshows that in (12) may achieve too large values for twouncorrelated alarm signals.2) Example 6: The configuration is the same as that in Ex-
ample 2, with a fixed data length . The similaritymeasure in (18) is calculated with and . Thesample means and standard deviations of the Sorgenfrei coeffi-cient, Jaccard coefficient and in (18) from 1000 MonteCarlo simulations are , , and
, respectively. Since and are ac-tually uncorrelated, the Sorgenfrei and Jaccard coefficients areclose to their MMVs 1/16 and 1/7, respectively. Comparingwith the two coefficients, the similarity measure in (18)takes much larger values of the sample mean and standard devi-ation, which certainly is not a desired property as explained inSection II-C and Example 5.

YANG et al.: DETECTION OF CORRELATED ALARMS BASED ON SIMILARITY COEFFICIENTS OF BINARY DATA 1023
Fig. 10. Process signals in Example 7: (a) and (b) .
IV. INDUSTRIAL EXAMPLE
This section provides an industrial example to illustrate theeffectiveness of the proposed detection method.1) Example 7: Real-time measurements of two process
variables in a large-scale petrochemical plantafflicted to Sinopec Yangzi Petrochemical Company, JiangsuProvince, China. The data are collected with the samplingperiod of 1 min. The data length is , standingfor the operating period about 94 days. All the collected data
are presented in Fig. 10. The alarm trippointvalues are and . They are the low-alarmtrippoint instead of the high-alarm trippoint in (2), e.g.,
if andotherwise
(19)
The proposed method in Section II-C is implemented as fol-lows: Step 1 generates the alarm signals and via(19). In Step 2, the first data segment is se-lected to make the least number of alarms in andequal to 30; Fig. 11 presents the first data segment. Step 3 cal-culates Sorgenfrei sequence for andobtain Sorgenfrei coefficient with its confi-dence interval . Thus, the inequality (11) doesnot hold, and we need to look at the distribution of . In Steps4 and 5, 11 data segments can obtained from the collected datasamples ; the least number of alarms in
and in each segment is equal to 30. The calcu-lated Sorgenfrei coefficients for the 11 data segments are pre-sented in Fig. 12(a), together with the confidence intervals in(10). The histogram of is presented in Fig. 12(b) with the re-sults and the confidence interval ofin (16) as . The inequality (17) holds so thatthe distribution of is concentrated to a small interval, and itis concluded that and are correlated.By looking at the process and alarm signals carefully, we re-
alize that the low values of Sorgenfrei coefficients in Fig. 12(a)are partially due to the small position mismatch between ‘1’s in
Fig. 11. Process signals in the first data segment in Example 7: (a) (solid)and (dash) and (b) (solid) and (dash).
Fig. 12. Results in Example 7: (a) (solid) and its confidence interval(plus) in (10) and (b) the histogram of .
and . Thus, a time window is introduced to re-vise the computation of in (3): if and
, then there is an alarm ‘1’ appeared simultaneouslyin the two alarm signals. Fig. 13 presents the calculated Sorgen-frei coefficients for the 11 data segments with and thehistogram of . Sorgenfrei coefficients in Fig. 13(a) are muchlarger than the counterparts in Fig. 12(a). The distribution ofis also concentrated to a small interval: andthe confidence interval of in (16) is .The averages of in Figs. 12(b) and 13(b) are equal to 1.1818and 2.7273, respectively. Hence, it is concluded that and
are correlated, with the occurrence of lagging be-hind that of by 1 or 2 samples.The conclusion is consistent with the available process
knowledge on the process signals. That is, is the mea-surement of a fuel gas pressure in a pipe connected to a fuel-gas

1024 IEEE TRANSACTIONS ON AUTOMATION SCIENCE AND ENGINEERING, VOL. 10, NO. 4, OCTOBER 2013
Fig. 13. Results in Example 7 with : (a) (solid) and its confi-dence interval (plus) in (10) and (b) the histogram of .
Fig. 14. Enlarged parts of process signals in Example 7: (a) (solid) and(dash) and (b) (solid) and (dash).
pretreatment drum, while is the measurement of thefuel gas temperature inside the drum. Thus, the alarm signals
and are expected to be correlated. The conclusionthat lagging behind is also consistent with thevariations of and , as shown at some magnified timeplots of and in Fig. 14.
V. CONCLUSION
This paper studied the problem of detecting correlated alarmsignals via statistical analysis. The second formulation of alarmsignals in (2) is found to be more suitable for the detection ofcorrelated alarms. Based on the properties desired for alarm sig-nals, Sorgenfrei coefficient in (3) was chosen as the oneto measure the similarity between two alarm signals. The distri-bution of the correlation delay defined in (13) was shown to
be indispensable and effective in detecting correlated alarms.Based on and the distribution of , a novel detectionmethod for correlated alarm signals was proposed. The effec-tiveness of the proposed method was illustrated via numericaland industrial examples.The proposed detection method could be further improved by
considering the effects of false and missed alarms on Sorgenfreicoefficient. One feasible way is to integrate with some changedetection methods to separate the collected data of process sig-nals into isolated segments in normal and abnormal conditions,and suppress the corresponding false andmissed alarms for eachisolated segment. Another future work is on a systematic wayto handle correlated alarms. As stated in Section I, after corre-lated alarms have been detected, there are several approaches todeal with them to improve the performance of alarm systems.However, more research work is required to formulate system-atic approaches to do so.
ACKNOWLEDGMENT
The authors would like to thank the Associate Editor andthe anonymous reviewers for their constructive comments andhelpful suggestions, and Sinopec Yangzi Petro-Chemical Com-pany, Nanjing, China, for providing industrial data used in thisstudy.
REFERENCES[1] G. Bishop and G. Welch, “An introduction to the Kalman filter,” SIG-
GRAPH, Course 8, 2001.[2] M. L. Bransby and J. Jenkinson, The Management of Alarm Systems.
Birmingham, UK: Health and Safety Executive, 1998.[3] R. Brooks, R. Thorpe, and J. Wilson, “A new method for defining and
managing process alarms and for correcting process operation when analarm occurs,” J. Hazardous Mater., vol. 115, pp. 169–174, 2004.
[4] A. H. Cheetham and J. E. Hazel, “Binary (presence-absence) similaritycoefficients,” J. Paleontology, vol. 43, no. 5, pp. 1330–1336, 1969.
[5] S. S. Choi, S. H. Cha, and C. Tappert, “A survey of binary similarityand distance measures,” J. Systemics, Cybern. Informat., vol. 8, no. 1,pp. 43–48, 2010.
[6] F. Dahlstrand, “Consequence analysis theory for alarm analysis,”Knowledge-Based Syst., vol. 15, pp. 27–36, 2002.
[7] Engineering Equipment and Materials Users’ Association (EEMUA),Alarm Systems—A Guide to Design, Management and Procurement.London, U.K., EEMUA Publication 191, Version 2, 2007.
[8] D. P. Faith, “Asymmetric binary similarity measures,” Oecologia, vol.57, pp. 287–290, 1983.
[9] M. Gulhar, B. M. G. Kibria, A. N. Albatineh, and N. U. Ahmed, “Acomparison of some confidence intervals for estimating the populationcoefficient of variation: A simulation study,” Statist. Oper. Res. Trans.,vol. 36, pp. 45–68, 2012.
[10] A. Henningsen and J. P. Kemmerer, “Intelligent alarm handling in ce-ment plants,” IEEE Ind. Appl. Mag., pp. 9–15, Sep./Oct. 1995.
[11] D. Katz, J. Baptista, S. P. Azen, and M. C. Pike, “Obtaining confidenceintervals for the risk ratio in cohort studies,” Biometrics, vol. 34, pp.469–474, 1978.
[12] S. R. Kondaveeti, I. Izadi, S. L. Shah, and T. Black, “Graphical rep-resentation of industrial alarm data,” presented at the Proc. 11th IFACSymp. Anal., Design and Evaluation of Human-Machine Systems, Va-lenciennes, France, 2010.
[13] J. Liu, K. W. Lim, W. K. Ho, K. C. Tan, R. Srinivasan, and A. Tay,“The intelligent alarm management system,” IEEE Software, pp.66–71, 2003.
[14] M. Noda, F. Higuchi, T. Takai, and H. Nishitani, “Event correlationanalysis for alarm system rationalization,” Asia-Pac. J. Chem. Eng.,vol. 6, pp. 497–502, 2011.
[15] D. Rothenberg, Alarm Management for Process Control. New York:Momentum Press, 2009.
[16] R. Srinivasan, J. Liu, K. W. Lim, K. C. Tan, and W. K. Ho, “Intelligentalarm management in a petroleum refinery,” Hydrocarbon Process.,vol. 83, pp. 47–53, 2004.

YANG et al.: DETECTION OF CORRELATED ALARMS BASED ON SIMILARITY COEFFICIENTS OF BINARY DATA 1025
[17] J. Xu, J. Wang, I. Izadi, and T. Chen, “Performance assessment anddesign for univariate alarm systems based on FAR, MAR and AAD,”IEEE Trans. Autom. Sci. Eng., vol. 9, no. 2, pp. 296–307, Apr. 2012.
[18] F. Yang, S. L. Shah, and D. Xiao, “Correlation analysis of alarm dataand alarm limit design for industrial processes,” in Proc. 2010 Amer.Control Conf., Baltimore, MD, 2010, pp. 5850–5855.
[19] F. Yang, S. L. Shah, D. Xiao, and T. Chen, “Improved correlation anal-ysis and visualization for industrial alarm data,” in Proc. 18th IFACWorld Congr., Milano, Italy, 2011, pp. 12898–12903.
[20] Z. Yang, J. Wang, and T. Chen, “On correlation analysis of bivariatealarm signals,” in Proc. 9th IEEE Int. Conf. Inform. Autom., Shenyang,China, 2012, pp. 530–535.
Zijiang Yang received the B.E. degree in automaticcontrol from Taiyuan University of Technology,Shanxi, China, in 2005, and the M.Sc. degree incontrol engineering from Peking University, Beijing,China, in 2012.His current research topic is the advanced alarm
system management.
Jiandong Wang received the B.E. degree in au-tomatic control from the Beijing University ofChemical Technology, Beijing, China, in 1997,and the M.Sc. and Ph.D. degrees in electrical andcomputer engineering from the University of Al-berta, Edmonton, AB, Canada, in 2003 and 2007,respectively.He is presently a Professor with the Department of
Industrial Engineering and Management, College ofEngineering, Peking University, Peking, China. From1997 to 2001, he was a Control Engineer with the
Beijing Tsinghua Energy Simulation Company, Beijing. From February 2006to August 2006, he was a Visiting Scholar at the Department of System De-sign Engineering, Keio University, Japan. His research interests include systemidentification, alarm systems, process monitoring and management, and theirapplications to industrial problems.Dr. Wang currently is an Associate Editor for Systems and Control Letters.
Tongwen Chen (F’06) received the B.Eng. degree inautomation and instrumentation from Tsinghua Uni-versity, Beijing, China, in 1984, and the M.A.Sc. andPh.D. degrees in electrical engineering from the Uni-versity of Toronto, Toronto, ON, Canada, in 1988 and1991, respectively.He is presently a Professor of Electrical and
Computer Engineering with the University of Al-berta, Edmonton, AB, Canada. His research interestsinclude computer and network-based control sys-tems, process safety and alarm systems, and their
applications to the process and power industries.Dr. Chen is a registered Professional Engineer in Alberta, Canada. He has
served as an Associate Editor for several international journals, including theIEEE TRANSACTIONS ON AUTOMATIC CONTROL, Automatica, and Systems andControl Letters.