101273169 - CO2 Safety and Operations Manualscience.uwaterloo.ca/~mauriced/earth691-duss/CO2_General...
51
CO 2 Safety and Operations Manual Halliburton Energy Services, Inc. Part No. 101273169
Transcript of 101273169 - CO2 Safety and Operations Manualscience.uwaterloo.ca/~mauriced/earth691-duss/CO2_General...

CO2 Safety and Operations Manual
Halliburton Energy Services, Inc.Part No. 101273169

All information contained in this publication is confidential and proprietary property of Halliburton Energy Services, Inc. Any reproduction or use of these instructions, drawings, or photographs without the express written permission of an officer of Halliburton Energy Services, Inc. is forbidden.
©Copyright 2001, Halliburton Energy Services, Inc.All Rights Reserved. Printed in the United States of America.
Part No. 101273169

Table of Contents
Preface
Section 1—Using CO2 Safely
Introduction .............................................................................. 1
Respiratory Hazards ................................................................ 1
Background ......................................................................... 1
Precautions .......................................................................... 1
Frozen Flesh ............................................................................ 2
Background ......................................................................... 2
Precautions .......................................................................... 2
The Cannonball Effect ............................................................. 2
Background ......................................................................... 2
Precautions .......................................................................... 2
Cracked Cylinder-Head Threads ............................................. 3
Background ......................................................................... 3
Precautions .......................................................................... 3
Protective Front Covers ........................................................... 3
Improperly Secured Lines ........................................................ 3
Hammer Unions ....................................................................... 3
Open Valves ............................................................................ 4
Notes on Figure 1.2 ............................................................. 4
Example ......................................................................... 4
Notes on Figure 1.3 ............................................................. 4
Example ......................................................................... 5
1 of 4

Section 2—CO2 Properties
Differences Between CO2 and Water ...................................... 1
CO2 Heat Capacities ............................................................... 6
Delivering CO2 to the Job ........................................................ 7
Section 3—CO2 Pumping Equipment
Boost Pumps ........................................................................... 1
Liquid-Gas Separator ............................................................... 4
Suction Y Header ..................................................................... 5
HT-400 Pumps .................................................................... 5
HQ-2000 Pumps .................................................................. 5
HT-2000 Pumps .................................................................. 5
HT-400 Fluid-End Cover Gasket ............................................. 5
HT-400 Header Ring ................................................................ 6
Pumping Liquid CO2 with a Positive-Displacement Pump ...... 6
Performance Curves ........................................................... 6
Determining the Correct Plunger Size ................................. 6
Problem ......................................................................... 6
Answer ........................................................................... 6
Extending the Maximum Operating Pressure ...................... 7
Example ......................................................................... 7
Appendix A—Determining CO2Discharge Temperatures
Numerical Approach ................................................................ 1
Graphical Approach ................................................................. 1
Example .............................................................................. 3
Appendix B—Modifying the Fluid Ends of HT-400 Pumpsfor CO2 Jobs
Tie-Bolt Arrangement ............................................................... 1
Part Numbers ........................................................................... 2
Modifying Fluid Ends ............................................................... 2
2 of 4

Appendix C—CO2 Job Procedures
Preparing the Equipment ......................................................... 1
Determining Available CO2 Product for Job ............................ 1
Downstream CO2 Turbine Meter with Temperature Probe .......................................................... 3
Setting up the Job .................................................................... 4
Pretreatment Safety Meeting ................................................... 5
Pressure-Testing and Cooling Down ....................................... 5
Vapor-Testing CO2 Lines .................................................... 5
Testing CO2 Lines with Glycol ............................................ 5
Liquid CO2 Pumping Procedure .............................................. 8
Shutting Down ......................................................................... 9
Disassembling Equipment ....................................................... 9
3 of 4

4 of 4

Preface
PrefaceFor their safety and the safety of those around them, people who work with carbon dioxide (CO2) should know as much as possible about the substance. This manual provides detailed information essential to people who work with CO2. It consists of the following sections:
• Section 1 discusses the dangers associated with using CO2.
• Section 2 describes the physical properties of CO2.
• Section 3 describes CO2 pumping equipment.
• Appendix A describes how to determine the discharge temperatures for known pressures of CO2.
• Appendix B describes how to modify the fluid ends of HT-400 pumps for use with CO2.
• Appendix C provides CO2 job procedures.
Important—When available, SAP part numbers have been provided within this manual. However, some parts have not yet been assigned SAP numbers. These parts are referred to by their Legacy part numbers.
September 2001 1 of 2 Preface

Preface 2 of 2 September 2001

Section
1
Using CO2 SafelyCaution—CO2 is a very dangerous substance that can cause severe injury, death, and equipment damage. Read this section thoroughly to learn how to prevent unnecessary accidents.
IntroductionCO2 is a colorless, odorless gas that can also exist in liquid and solid forms, depending on temperature and pressure conditions. The following hazards associated with CO2 are discussed in this section:
• respiratory hazards
• frozen flesh
• the cannonball effect
• cracked cylinder-head threads
• improperly secured lines
• hammer unions at low temperatures
• open valves
Respiratory Hazards
Background
The amount of CO2 in the air regulates our breathing. Generally, the normal concentration of CO2 in the air is 0.003% or 300 parts per million (ppm). Exposure to higher levels of CO2 can result in various physical effects, as shown in Table 1.1 (Page 2). If the concen-tration of CO2 is only slightly higher than normal,
people exposed will have a higher respiratory rate, but at extremely high concentrations (25.0% or 25,000 ppm), CO2 will paralyze the human respiratory system, possibly resulting in suffocation.
CO2 is heavier than air and does not diffuse readily. In confined spaces, even the amount of CO2 released by breathing may become hazardous. Because you cannot see, smell, feel, or taste CO2, you could be exposed to dangerous levels of the compound without knowing it. Therefore, when CO2 is used in industry, it is treated as an industrial hazard. According to the 1968 American Conference of Governmental Industrial Hygienists, the recommended threshold value for CO2 is 5,000 ppm. This value represents the concentration of CO2 to which workers can continuously be exposed without experiencing adverse effects. Table 1.1 (Page 2), lists the effects of exposure to various levels of CO2.
Precautions
To avoid exposure to dangerous levels of CO2, follow these guidelines:
• Properly ventilate all work areas exposed to CO2. Air must be able to move freely through the work area.
• Do not let CO2 build up to unacceptable levels (above 5,000 ppm) in the work area.
Always properly drain the lines of CO2 boost pumps. Solid CO2 left in the lines will dissolve into gas, build up to dangerous levels, and push the good air out of the area.
September 2001 1 of 6 Section 1

CO2 Safety Manual
Frozen Flesh
Background
Solid CO2, commonly known as dry ice, has a temper-ature of -109°F. At this temperature, CO2 will freeze flesh upon contact.
Precautions
To prevent injury from solid CO2, follow these guidelines:
• Never pick up solid CO2 with your bare hands.
• Never let solid CO2 come into contact with any exposed skin.
• Never ingest solid CO2.
• When working near CO2 equipment and lines, wear standard protective gear, as well as the following:
—face shield
—noncotton work gloves
—long pants not tucked into boots
—ear protection
The Cannonball Effect
Background
The cannonball effect occurs when slugs of solid CO2 shoot out of the hoses like cannonballs. Liquid CO2 will flash-set to dry ice slugs when you disconnect the hoses after a job. The slugs will lodge in the low areas of the hoses and hose ends. When the temperature in and around the hoses increases, the slugs will release gas, building pressure behind the slugs and forcing them to shoot out of the hoses.
Precautions
To prevent the cannonball effect, follow these guidelines:
• Keep low spots out of hoses, as shown in Figure 1.1 (Page 3).
• Carefully drain and clear hose lines after each job.
• Do not look into hoses or lines unless they have been properly drained.
• When using high-pressure pumps, never point cylinder-head covers toward personnel or other equipment.
Table 1.1—Effects of Exposure to CO2
CO2 in Air (ppm)
Effect
0.1 to 1.0 Slight, unnoticeable increase in respiration rate
2.0 50% increase in respiration rate
3.0 100% increase in respiration rate
5.0 300% increase in respiration rate
10.0 Unconsciousness after a few minutes of exposure
12.0 to 15.0 Unconsciousness immediately upon exposure
25.0 Possible death after several hours of exposure
Section 1 2 of 6 September 2001

CO2 Safety Manual
Figure 1.1—CO2 suction hose with minimal low spots
Cracked Cylinder-Head Threads
Background
At normal temperatures, the threads of cylinder-head cover retainers crack slowly. At the temperature of liquid CO2, cracking occurs more rapidly. Cracked cylinder-head threads can spontaneously fail, causing the cylinder heads to blow off.
Precautions
To avoid injury resulting from cracked cylinder-head threads, follow these guidelines:
• When possible, position pump cylinder heads away from personnel and other equipment.
• Regularly perform magnetic particle inspections on equipment.
• Use a cutting torch to destroy all parts that are cracked or otherwise damaged so that they will not be used by mistake.
Protective Front CoversHT-400s and Grizzly—When pumping CO2, protec-tive covers should be taken out of any HT-400s or Griz-zlies and replaced with standard end caps. Protective front covers have been developed to protect HT-400
and Grizzly fluid ends from becoming damaged by proppant packed in front of the plunger. This is not a problem on the pumps which will be pumping CO2 and can cause a serious safety hazard due to a sudden release of liquid CO2 at the end of the CO2 pump.
HT-2000—Protective covers used in the HT-2000 pumps are hydraulically preloaded and do not pose a safety hazard in CO2 services.
Improperly Secured LinesImproperly secured CO2 discharge lines can break or “whip” if the well kicks or if a closed valve is pumped into the line. To avoid such occurrences, follow current best practices for securing discharge irons. Prior to beginning the job, unhook the glycol return line and any other prime up lines that are not necessary when pumping downwell.
Hammer UnionsHammer unions can become very brittle at the extreme temperature of dry ice and will easily break or chip. Rig down with caution.
September 2001 3 of 6 Section 1

CO2 Safety Manual
Open ValvesA temperature increase will cause any trapped liquid CO2 to expand and increase in pressure, possibly causing equipment damage or failure. To prevent trap-ping liquid CO2, ensure that one valve is always open before opening or closing other valves to change from the cool-down loop to the wellhead.
Figure 1.2 (Page 5), and Figure 1.3 (Page 5), show the effect of temperature on a closed system. Pressures can be increased above the working pressure of the iron, hoses, and equipment.
Note—Typical CO2 hoses used on the suction side of positive-displacement pumps have a working pressure of 500 psi. Therefore, you should confirm that all trans-ports, receivers, suction hoses, suction manifolding, and boost pumps are properly rated and have working relief valves.
Notes on Figure 1.2
Figure 1.2 shows the effects of temperature increases on lines and equipment between the CO2 storage vessel and the positive-displacement pumps. Pressure-relief valves should be installed on CO2 transports, suction hoses, and booster pumps. Ensure that these valves are in place and working properly.
Example
The pumps have been cooled downs, but the job is delayed. The transport or receiver valves are shut, and no downstream release is open. The initial pressure in the transport tank was 220 psi; therefore the tempera-ture of the liquid CO2 was -15°F. On a hot day, the temperature of the liquid CO2 in the transport tank reaches 10°F, and the line pressure increases to 2,500 psi
Notes on Figure 1.3
Figure 1.3 (Page 5) shows the effects of temperature between the positive-displacement pump and the well-head. Extra care must be taken to prevent a “closed-stop” situation in which pressure cannot be released and consequently reaches a dangerous level.
The pressure increase shown in Figure 1.3 depends on the initial pressure in the CO2 receiver/supplier tanks. This chart is based on a tank pressure of 200 psi. When lines are being tested, if the tank pressure is greater than 200 psi, then the pressure increase will be smaller. If the pressure is less than 200 psi, then the pressure increase will be greater.
Section 1 4 of 6 September 2001

CO2 Safety Manual
Example
Lines containing liquid CO2 are tested to 5,000 psi. One line is left full of CO2 with no release open. On a
hot day, the liquid CO2 temperature reaches 100°F, and the line pressure increases to 15,000 psi.
.
Figure 1.2—Potential pressure buildup on lines and equipment between the CO2 storage vessels and positive-displacement pumps if CO2 warms to 10° and 20°F.
Figure 1.3—Potential pressure buildup downstream of positive-displacement CO2 pumps during pressure test
0
500
1,000
1,500
2,000
2,500
3,000
3,500
4,000
4,500
200 210 220 230 240 250 260 270 280 290 300Receiver or Storage Tank Original Pressure (psi)
Ho
se P
ress
ure
IfTe
mp
erat
ure
Incr
ease
sA
gai
nst
Clo
sed
Sto
ps
(psi
)
20ºF
10ºF
0
5,000
10,000
15,000
20,000
25,000
30,000
1,000 2000 3,000 4,000 5,000 6,000 7,000 8,000 9,000 10,00011,00012,00013,00014,00015,000
Initial Test Pressure (psi)
60ºF
80ºF
100ºF
120ºF
Lin
e P
ress
ure
If D
isch
arg
eL
ine
Tem
per
atu
re In
crea
ses
(psi
)
,
September 2001 5 of 6 Section 1

CO2 Safety Manual
Section 1 6 of 6 September 2001

Section
2
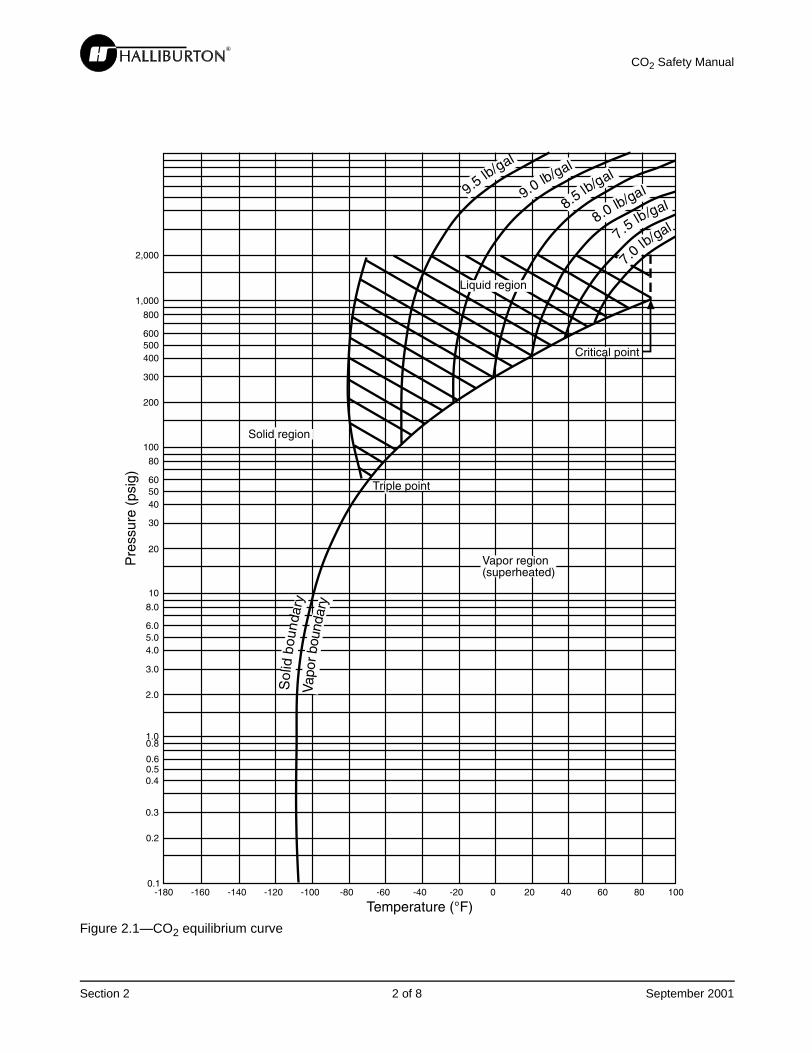
CO2 PropertiesDifferences Between CO2 and WaterLike water, CO2 can exist as a liquid, a solid, or a vapor. Table 2.1 describes the similarities and differ-ences between CO2 and water. As shown in Figure 2.1 (Page 2), the form of CO2 is primarily affected by temperature, but pressure and energy levels also affect its form. When handling CO2, remember the following:• At its triple point (-69.9°F), CO2 can be a liquid, a solid, or a vapor. At temperatures below the triple point, CO2 can be either a solid or a vapor.
• At temperatures between the triple point and the critical temperature (87.8°F), CO2 can be a liquid or a vapor, depending on pressure and energy levels.
• At temperatures above the critical temperature, CO2 is a vapor, and no amount of pressure will transform it into a liquid.
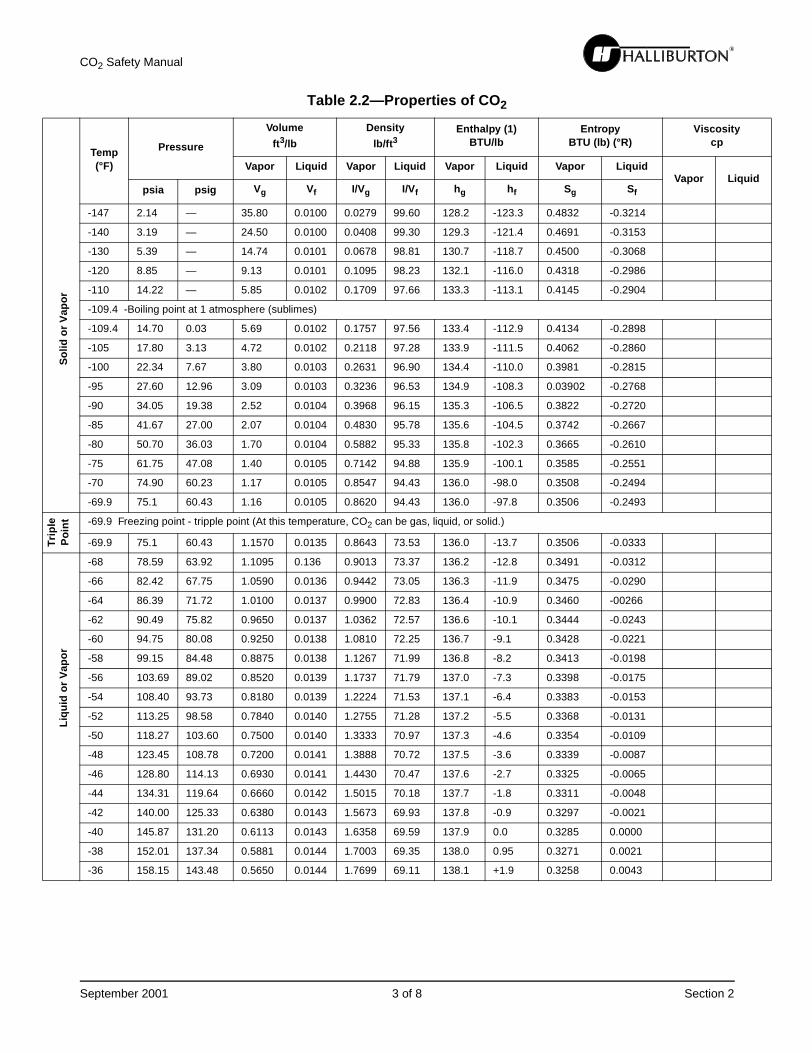
Table 2.2 (Page 3) lists values for different properties of CO2 at temperatures ranging from -147°F to 87.8°F.
Table 2.1—Similarities and Differences between CO2 and Water
Form Similarities Differences
Vapor Both are clear and odorless. CO2 is heavier than air; water is not.
Neither will burn or explode.Neither is poisonous.
Liquid Both are clear and have a similar weight.
The viscosity of liquid CO2 is 1/10th that of water.
Solid Both are white and have a temperature of approxi-mately -109°F.
Unlike water, CO2 expands when it changes from a solid to a liquid form.
Transitional States Both can turn directly into a vapor from a solid state.
The triple point for CO2 is -69.9°F. The triple point for water is 32°F.
September 2001 1 of 8 Section 2
CO2 Safety Manual
Figure 2.1—CO2 equilibrium curve
���
���
���
���������
�����
���
���
���������
����
��
��
����
�
��
���
���
���
���
��
���
����
���
����
�� �������������
���������������
��� ��������������������������������������
���������� �!�
�������� �!�
"�� ������ !������#����$�
% ��$����� !
&�'��$����� !% ��$(
�!$��)
"�� � (
�!$��)
���(*�
����
�(*���
+���(*���
+���(*�
��
,���(*���,�
� �(*�
��
Section 2 2 of 8 September 2001
CO2 Safety Manual
id
So
lido
rV
apo
rT
rip
leL
iqu
ido
rV
apo
r
Table 2.2—Properties of CO2
Temp(°F)
Pressure
Volume
ft3/lb
Density
lb/ft3Enthalpy (1)
BTU/lbEntropy
BTU (lb) (°R)Viscosity
cp
Vapor Liquid Vapor Liquid Vapor Liquid Vapor LiquidVapor Liqu
psia psig Vg Vf I/Vg I/Vf hg hf Sg Sf
-147 2.14 — 35.80 0.0100 0.0279 99.60 128.2 -123.3 0.4832 -0.3214
-140 3.19 — 24.50 0.0100 0.0408 99.30 129.3 -121.4 0.4691 -0.3153
-130 5.39 — 14.74 0.0101 0.0678 98.81 130.7 -118.7 0.4500 -0.3068
-120 8.85 — 9.13 0.0101 0.1095 98.23 132.1 -116.0 0.4318 -0.2986
-110 14.22 — 5.85 0.0102 0.1709 97.66 133.3 -113.1 0.4145 -0.2904
-109.4 -Boiling point at 1 atmosphere (sublimes)
-109.4 14.70 0.03 5.69 0.0102 0.1757 97.56 133.4 -112.9 0.4134 -0.2898
-105 17.80 3.13 4.72 0.0102 0.2118 97.28 133.9 -111.5 0.4062 -0.2860
-100 22.34 7.67 3.80 0.0103 0.2631 96.90 134.4 -110.0 0.3981 -0.2815
-95 27.60 12.96 3.09 0.0103 0.3236 96.53 134.9 -108.3 0.03902 -0.2768
-90 34.05 19.38 2.52 0.0104 0.3968 96.15 135.3 -106.5 0.3822 -0.2720
-85 41.67 27.00 2.07 0.0104 0.4830 95.78 135.6 -104.5 0.3742 -0.2667
-80 50.70 36.03 1.70 0.0104 0.5882 95.33 135.8 -102.3 0.3665 -0.2610
-75 61.75 47.08 1.40 0.0105 0.7142 94.88 135.9 -100.1 0.3585 -0.2551
-70 74.90 60.23 1.17 0.0105 0.8547 94.43 136.0 -98.0 0.3508 -0.2494
-69.9 75.1 60.43 1.16 0.0105 0.8620 94.43 136.0 -97.8 0.3506 -0.2493
-69.9 Freezing point - tripple point (At this temperature, CO2 can be gas, liquid, or solid.)
-69.9 75.1 60.43 1.1570 0.0135 0.8643 73.53 136.0 -13.7 0.3506 -0.0333
-68 78.59 63.92 1.1095 0.136 0.9013 73.37 136.2 -12.8 0.3491 -0.0312
-66 82.42 67.75 1.0590 0.0136 0.9442 73.05 136.3 -11.9 0.3475 -0.0290
-64 86.39 71.72 1.0100 0.0137 0.9900 72.83 136.4 -10.9 0.3460 -00266
-62 90.49 75.82 0.9650 0.0137 1.0362 72.57 136.6 -10.1 0.3444 -0.0243
-60 94.75 80.08 0.9250 0.0138 1.0810 72.25 136.7 -9.1 0.3428 -0.0221
-58 99.15 84.48 0.8875 0.0138 1.1267 71.99 136.8 -8.2 0.3413 -0.0198
-56 103.69 89.02 0.8520 0.0139 1.1737 71.79 137.0 -7.3 0.3398 -0.0175
-54 108.40 93.73 0.8180 0.0139 1.2224 71.53 137.1 -6.4 0.3383 -0.0153
-52 113.25 98.58 0.7840 0.0140 1.2755 71.28 137.2 -5.5 0.3368 -0.0131
-50 118.27 103.60 0.7500 0.0140 1.3333 70.97 137.3 -4.6 0.3354 -0.0109
-48 123.45 108.78 0.7200 0.0141 1.3888 70.72 137.5 -3.6 0.3339 -0.0087
-46 128.80 114.13 0.6930 0.0141 1.4430 70.47 137.6 -2.7 0.3325 -0.0065
-44 134.31 119.64 0.6660 0.0142 1.5015 70.18 137.7 -1.8 0.3311 -0.0048
-42 140.00 125.33 0.6380 0.0143 1.5673 69.93 137.8 -0.9 0.3297 -0.0021
-40 145.87 131.20 0.6113 0.0143 1.6358 69.59 137.9 0.0 0.3285 0.0000
-38 152.01 137.34 0.5881 0.0144 1.7003 69.35 138.0 0.95 0.3271 0.0021
-36 158.15 143.48 0.5650 0.0144 1.7699 69.11 138.1 +1.9 0.3258 0.0043
Po
int
September 2001 3 of 8 Section 2

CO2 Safety Manual
id
0
Liq
uid
or
Vap
or
Temp.(°F)
Pressure
Volume
ft3/lbDensity
lb/ft3Enthalpy (1)
BTU/lbEntropy
BTU (lb) (°R)Viscosity
cp
Vapor Liquid Vapor Liquid Vapor Liquid Vapor LiquidVapor Liqu
psia psig Vg Vf I/Vg I/Vf hg hf Sg Sf
-34 164.66 149.99 0.5430 0.0145 1.8416 68.84 138.2 2.85 0.3245 0.0054
-32 171.17 156.50 0.5210 0.0145 1.9193 68.58 138.3 3.8 0.3232 0.0085
-30 178.07 163.40 0.5027 0.0146 1.9892 68.25 138.35 4.7 0.3218 0.0105
-28 184.97 170.30 0.4845 0.0147 2.0639 67.93 138.4 5.6 0.3205 0.0126
-26 192.27 177.60 0.4672 0.0147 2.1404 67.63 138.5 6.5 0.3217 0.0147
-24 199.57 184.90 0.4500 0.0148 2.2222 67.34 138.6 7.4 0.3180 0.0168
-22 207.29 192.62 0.4332 0.0149 2.3084 67.05 138.65 8.3 0.3167 0.0179
-20 215.02 200.35 0.4165 0.0149 2.4009 66.76 138.7 9.2 0.3155 0.0210
-18 223.17 208.50 0.4015 0.0150 2.4906 66.47 138.75 10.7 0.3142 0.0231
-16 231.32 216.65 0.3865 0.0151 2.5873 66.18 138.8 11.2 0.3130 0.252
-14 239.92 225.25 0.3727 0.0151 2.6831 65.87 138.8 12.05 0.3117 0.0272
-12 248.52 233.85 0.3590 0.0152 2.7855 65.57 138.8 12.9 0.3104 0.0293
-10 257.57 242.90 0.3467 0.0153 2.8843 65.25 138.85 13.95 0.3104 0.314
-8 266.63 251.96 0.3345 0.0153 2.9895 64.94 138.9 15.0 0.3079 0.0335
-6 276.16 261.49 0.3231 0.0154 3.0950 64.62 138.9 15.95 0.3079 0.0355
-4 284.70 271.03 0.3118 0.0155 3.2071 64.31 138.9 16.9 0.3054 0.0376
-2 295.73 281.06 0.3011 0.0156 3.3211 63.98 139.9 17.85 0.3037 0.0397
0 305.76 291.09 0.2905 0.0157 3.4423 63.65 138.9 18.8 0.3030 0.0419
2 316.28 301.61 0.2806 0.0157 3.5637 63.33 138.9 19.8 0.3018 0.0440
4 326.8 312.1 0.2708 0.0158 3.6927 63.01 138.9 20.8 0.3006 0.0462 0.0132a 0.115
6 337.8 323.13 0.2614 0.0159 3.8255 62.66 138.85 21.85 0.2994 0.0482
8 348.9 334.2 0.2520 0.0160 3.9682 62.31 138.8 22.9 0.2982 0.0503
10 360.5 345.8 0.2435 0.0161 4.1067 61.96 138.75 23.95 0.2970 0.525
12 372.1 357.4 0.2350 0.0162 4.2553 61.61 138.7 25.0 0.2958 0.0547
14 384.2 369.5 0.2272 0.0163 4.4014 61.25 138.65 26.15 0.2945 0.0569
16 396.4 381.7 0.2195 0.0164 4.5558 60.90 138.6 27.3 0.2933 0.0591
18 409.1 394.4 0.2121 0.0165 4.7147 60.53 138.55 28.45 0.2921 0.0613
20 421.8 407.1 0.2048 0.0166 4.8828 60.17 138.5 29.6 0.2909 0.0636 0.0135a 0.011
22 435.1 420.4 0.1979 0.167 5.0530 59.77 138.4 30.7 0.2897 0.0660
24 448.4 433.7 0.1910 0.0168 5.2356 59.38 138.3 31.8 0.2885 0.0684
26 462.3 447.6 0.1846 0.0169 5.5171 58.98 138.15 33.05 0.2873 0.0707
28 476.3 461.6 0.1782 0.0170 5.6116 58.58 138.0 34.3 0.2861 0.0730
30 490.8 476.1 0.1722 0.0171 5.8072 58.17 137.85 35.55 0.2859 0.0754
32 505.3 490.6 0.1663 0.0173 6.0132 57.77 137.7 36.8 0.2837 0.0778
34 520.5 505.8 0.1606 0.0714 6.2266 57.34 137.5 38.05 0.2882 0.0800
36 535.7 521.0 0.1550 0.0175 6.4516 56.92 137.3 39.3 0.2807 0.0823
38 551.5 536.7 0.1496 0.0177 6.6844 56.45 137.05 40.55 0.2791 0.0847
Table 2.2—Properties of CO2
Section 2 4 of 8 September 2001

CO2 Safety Manual
id
aAt
Liq
uid
or
Vap
or
Vap
or
Temp.(°F)
Pressure
Volume
ft3/lb
Density
lb/ft3Enthalpy (1)
BTU/lbEntropy
BTU (lb) (°R)Viscosity
cp
Vapor Liquid Vapor Liquid Vapor Liquid Vapor LiquidVapor Liqu
psia psig Vg Vf I/Vg I/Vf hg hf Sg Sf
40 567.3 552.6 0.1442 0.0178 6.9348 55.99 136.8 41.8 0.2775 0.0872 0.0140a 0.095
42 583.8 569.1 0.1392 0.0180 7.1839 55.51 136.5 42.6 0.2760 0.0897
44 600.4 585.7 0.1342 0.0181 7.4515 55.04 136.2 44.4 0.2745 0.0922
48 634.9 620.2 0.1250 0.0185 8.0000 54.00 135.5 47.1 0.2715 0.0972
50 652.8 638.1 0.1206 0.0186 8.2918 53.49 135.05 48.5 0.2698 0.0999
52 670.8 656.1 0.1163 0.0188 8.5984 52.99 134.6 49.9 0.2681 0.1026
54 689.5 674.8 0.1121 0.0190 8.9206 52.45 134.0 51.85 0.2663 0.1053
56 708.3 693.6 0.1080 0.0192 9.2592 51.92 133.4 52.8 0.2645 0.1080
58 727.8 713.1 0.1037 0.0194 9.6432 51.34 132.8 54.25 0.2625 0.1108
60 747.7 732.7 0.0995 0.0197 10.050 50.76 132.2 55.7 0.2606 0.1136
62 767.7 753.0 0.0957 0.0199 10.449 50.11 131.45 57.25 0.2584 0.1164
64 788.1 773.4 0.0920 0.0202 10.869 49.46 130.7 58.8 0.2563 0.1192
66 809.3 794.6 0.0881 0.0205 11.351 48.78 129.8 59.4 0.2539 0.1221
68 830.6 815.9 0.0842 0.0207 11.876 48.10 128.9 62.0 0.2516 0.1250
70 852.7 838.0 0.0801 0.0211 12.484 47.35 127.7 63.8 0.2480 0.1283
72 874.9 860.2 0.0760 0.0214 13.158 46.60 126.5 65.6 0.2455 0.1316
74 898.0 883.3 0.0720 0.0219 13.889 45.62 124.7 67.85 0.2420 0.1353
76 921.1 906.4 0.0680 0.0224 14.706 44.64 122.9 69.9 0.2386 0.1390
78 945.2 930.5 0.0640 0.0230 15.625 43.41 120.95 70.95 0.2345 0.1429
80 969.3 954.6 0.0600 0.0237 16.667 42.19 119.0 74.0 0.2305 0.1469 0.064
82 995.0 980.3 0.0537 0.0258 18.622 38.69 113.5 79.8 0.2199 0.1571
84 1020.7 1006.0 0.0474 0.0284 21.097 35.19 108.0 85.5 0.2093 0.1673
86 1046.4 1031.7 0.0411 0.0315 24.331 31.69 102.6 91.3 0.1987 0.1775
87.8 1072.1 1057.4 0.0345 0.0345 28.96 28.96 97.1 97.1 0.1880 0.1880
87.8 - Critical temperature
one atmosphere pressure
Table 2.2—Properties of CO2
September 2001 5 of 8 Section 2

CO2 Safety Manual
CO2 Heat CapacitiesThe thermal conductivity for CO2 vapor at 1 atm and 32°F is 0.0085 Btu/hr/ft2/°F/ft. Table 2.3 lists the char-acteristics of CO2 vapor. Table 2.4 lists the heat capac-
ities of CO2 vapor at various temperatures. Table 2.5 lists the heat capacities of CO2 liquid at various temperatures.
Table 2.3—Characteristics of CO2 Vapor
Property Value
Molecular weight (M) = 44.01 lb/mol
Specific volume (v) at 14.7 psia and 68°F
= 8.755 ft3/lb
Gas constant
(R = pv/T)a=
35.11 ft-lb/lb °R0.04512 Btu/lb °R
CO2 gas constant (R0) = 1,545.3 ft-lb ÷ (lb-mol, °R) ÷ 1.986 Btu/(lb-mol, °R)
p Vm/R0Tb = 1.000
ap = psia, T = °RbVm = volume per mole
Table 2.4—Heat Capacity of CO2 Vapor at 1 atm
Temperature(°F)
Btu/lb/F°
Cpa Cp ÷ Cv
b = Kc
32 0.205 —
59 — 1.304
212 0.215 —
aCp = specific heat at constant pressurebCv = specific heat at constant volumecK = specific heat ratio
Table 2.5—Heat Capacity of Liquid CO2
Temperature(°F)
Btu/lb/°F
-30 0.45
0 0.48
30 0.62
60 0.75
Section 2 6 of 8 September 2001
CO2 Safety Manual
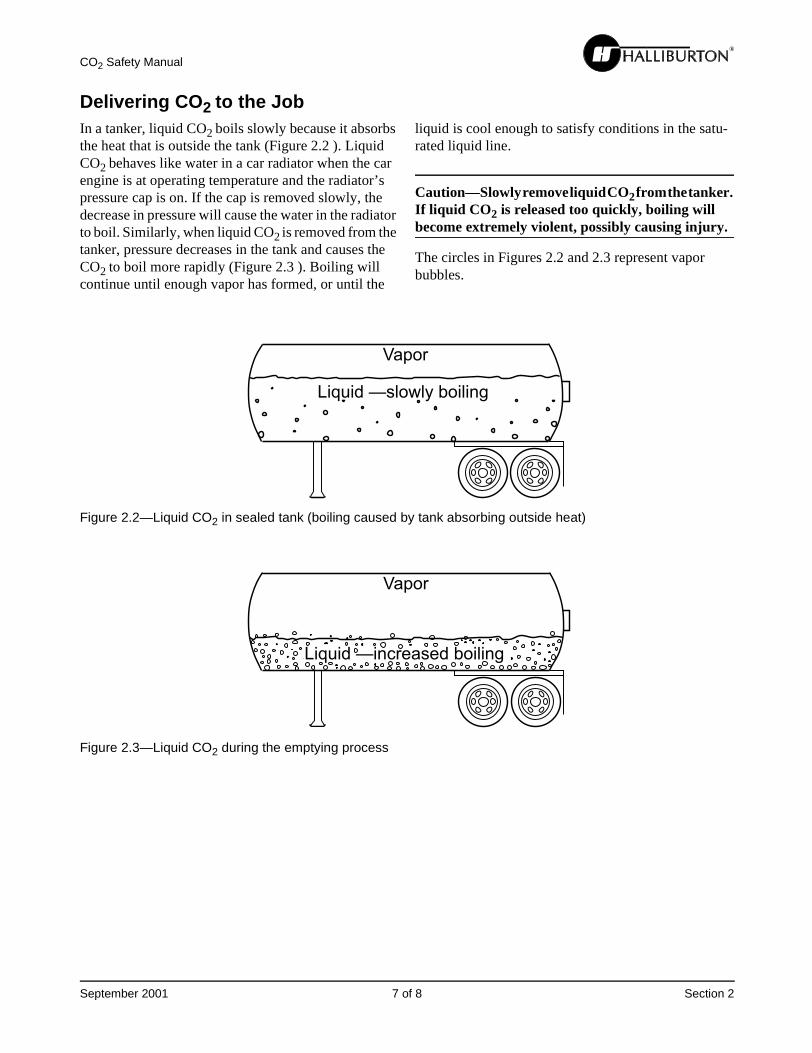
Delivering CO2 to the JobIn a tanker, liquid CO2 boils slowly because it absorbs the heat that is outside the tank (Figure 2.2 ). Liquid CO2 behaves like water in a car radiator when the car engine is at operating temperature and the radiator’s pressure cap is on. If the cap is removed slowly, the decrease in pressure will cause the water in the radiator to boil. Similarly, when liquid CO2 is removed from the tanker, pressure decreases in the tank and causes the CO2 to boil more rapidly (Figure 2.3 ). Boiling will continue until enough vapor has formed, or until the
liquid is cool enough to satisfy conditions in the satu-rated liquid line.
Caution—Slowly remove liquid CO2 from the tanker. If liquid CO2 is released too quickly, boiling will become extremely violent, possibly causing injury.
The circles in Figures 2.2 and 2.3 represent vapor bubbles.
Figure 2.2—Liquid CO2 in sealed tank (boiling caused by tank absorbing outside heat)
Figure 2.3—Liquid CO2 during the emptying process
������������ ����
����
������������������ ����
����
September 2001 7 of 8 Section 2

CO2 Safety Manual
Section 2 8 of 8 September 2001

Section
3
CO2 Pumping EquipmentThis section provides information about CO2 pumping equipment and includes performance charts for various sizes of HT-400, HT-2000, and Grizzly pumps.
Boost PumpsBoost pumps prevent CO2 from boiling in the suction manifold by increasing pressure. This pressure increase changes CO2 vapor into liquid, which reduces vapor locking in the high-pressure pump.
Although the boost pump prevents liquid CO2 from boiling while it is in the suction manifold, the CO2 will still boil during the suction stroke because of the rapid acceleration of the plunger, as shown in Figure 3.1. Boiling will increase because of heat left in the unswept volume of the fluid section. This heat is a result of friction, engine horsepower, and atmosphere.
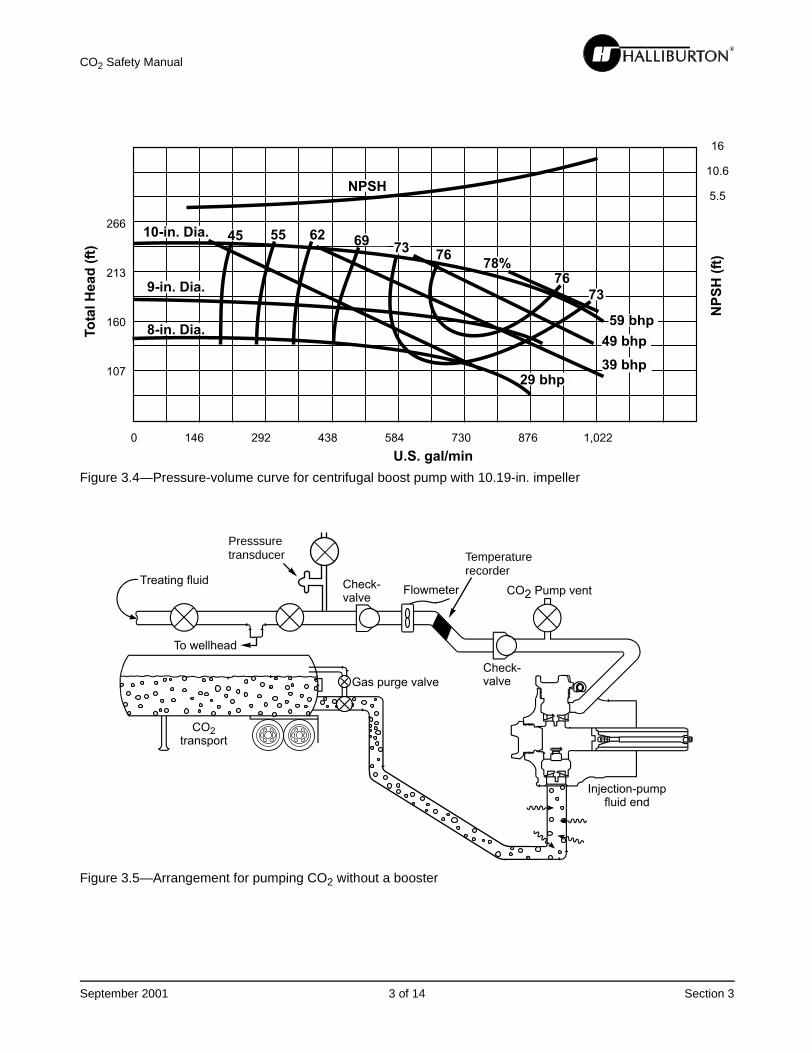
The most efficient pump for boosting CO2 pressure is a centrifugal pump. A centrifugal boost pump can pump a liquid containing some vapor and can run dry for short periods. If the pump is powered by a hydraulic drive, operators do not have to heat the CO2 by pumping it through a bypass valve. Figure 3.2 (Page 2) shows a centrifugal pump with a hydraulic drive. Figure 3.3 (Page 2) and Figure 3.4 (Page 3) demon-strate dimensions and a pressure-volume curve for a centrifugal boost pump with a 10.19-in. impeller.
CO2 can be pumped without a boost pump when the pump rate is low (typically below 1 bbl/min). The maximum rates without a booster will vary depending on the supplier’s equipment and the tank’s starting pressures. Figure 3.5 (Page 3) depicts an arrangement for pumping CO2 without a boost pump.
Figure 3.1—HT-400 plunger in discharge and suction strokes
��������������������
�����������������������
September 2001 1 of 14 Section 3

CO2 Safety Manual
Figure 3.2—CO2 centrifugal boost pump with hydraulic drive
Figure 3.3—Dimensions of centrifugal boost pump with 10.19-in. impeller
Treating fluid
To wellhead
Flowmeter
Injection-pumpfluid end
Liquid-gas separator
Relief valve
COtransport
2
Check-valve
Tricooiler
1.625-in. Shaft dia.w/0.375-in. Keywayy
Suction
Boost pump
24.69-in.10.00-in.
Gas purge valve
Temperaturerecorder
Pressuretransducer
CO2 Pump vent
Check-valve
��������� ���� !����"��#�������$�%�&' !����������
"�����
�(��)�����%�%%����
�%�' ����
'� %����*��������
+!���,�&%%! -."/�0����
'$+!��������!���������&!���������1�2�
� !��������
+!���,�&%%! -."/�0����
&$(!��������!+������'�++!���������1�2�
�%�%%!��������
(!���,�&%%! -."/�0����
Section 3 2 of 14 September 2001
CO2 Safety Manual
Figure 3.4—Pressure-volume curve for centrifugal boost pump with 10.19-in. impeller
Figure 3.5—Arrangement for pumping CO2 without a booster
���
��&
��%
�%'
%
�������
������
������������(� �)� (&+ +( '&% +'� �,%��
��
�%��
�
��������
����
�� ���� ��
�����
��
���� !"��� !
���� !���� !
�#����$���
%&#����$���
�#����$���
"� ��
Check-valve
Flowmeter
To wellhead
Treating fluidCO2 Pump vent
COtransport
2
Injection-pumpfluid end
Gas purge valve
Temperaturerecorder
Presssuretransducer
Check-valve
September 2001 3 of 14 Section 3

CO2 Safety Manual
Liquid-Gas SeparatorIf the liquid-gas separator is used correctly, it will save some CO2 and cool the standby pump. Separators are used on most boost-pump units.
Figure 3.6 shows the separator with liquid CO2 at the proper operating level. The liquid level should be kept between the high and low tubes connected to the 1/4-in. indicator valves. Table 3.1 lists some problems and
solutions related to the presence of liquid in the liquid-gas separator.
Important—Never allow the vent valve on the sepa-rator to release dry ice. If this condition occurs, the separator cannot function properly because it is completely full of CO2, and CO2 is being wasted.
Figure 3.6—Liquid-gas separator
Table 3.1—Liquid CO2 in the Liquid-Gas Separator
Condition Problem Solution
Liquid CO2 comes out of both indicator valves.
The level of liquid CO2 in the separator is too high.
Slightly close the vent valve.
CO2 vapor comes out of both indicator valves.
The level of liquid CO2 in the separator is too low.
Slightly open the vent valve.
CO2 vapor comes out of one indicator valve, and liquid CO2 comes out of the other.
The liquid level is correct. No adjustment is necessary. Con-tinue pumping the job.
�������2�����������##������
Section 3 4 of 14 September 2001
CO2 Safety Manual
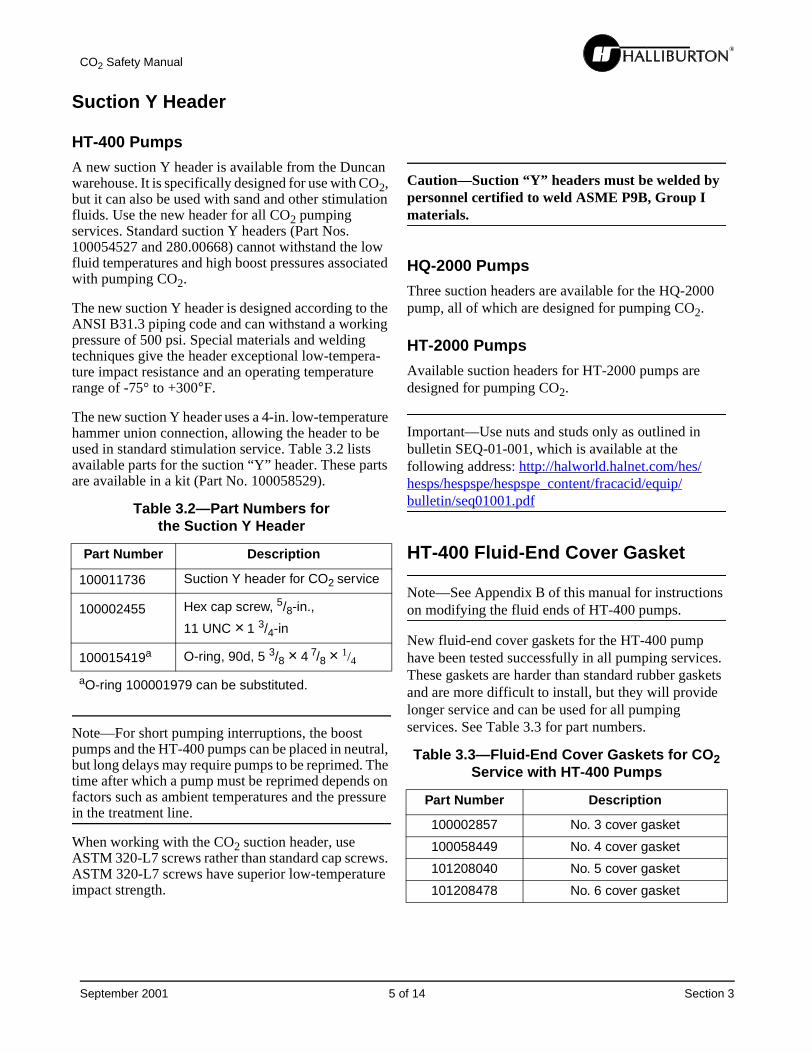
Suction Y Header
HT-400 Pumps
A new suction Y header is available from the Duncan warehouse. It is specifically designed for use with CO2, but it can also be used with sand and other stimulation fluids. Use the new header for all CO2 pumping services. Standard suction Y headers (Part Nos. 100054527 and 280.00668) cannot withstand the low fluid temperatures and high boost pressures associated with pumping CO2.
The new suction Y header is designed according to the ANSI B31.3 piping code and can withstand a working pressure of 500 psi. Special materials and welding techniques give the header exceptional low-tempera-ture impact resistance and an operating temperature range of -75° to +300°F.
The new suction Y header uses a 4-in. low-temperature hammer union connection, allowing the header to be used in standard stimulation service. Table 3.2 lists available parts for the suction “Y” header. These parts are available in a kit (Part No. 100058529).
Note—For short pumping interruptions, the boost pumps and the HT-400 pumps can be placed in neutral, but long delays may require pumps to be reprimed. The time after which a pump must be reprimed depends on factors such as ambient temperatures and the pressure in the treatment line.
When working with the CO2 suction header, use
ASTM 320-L7 screws rather than standard cap screws. ASTM 320-L7 screws have superior low-temperature impact strength.
Caution—Suction “Y” headers must be welded by personnel certified to weld ASME P9B, Group I materials.
HQ-2000 Pumps
Three suction headers are available for the HQ-2000 pump, all of which are designed for pumping CO2.
HT-2000 Pumps
Available suction headers for HT-2000 pumps are designed for pumping CO2.
Important—Use nuts and studs only as outlined in bulletin SEQ-01-001, which is available at the following address: http://halworld.halnet.com/hes/hesps/hespspe/hespspe_content/fracacid/equip/bulletin/seq01001.pdf
HT-400 Fluid-End Cover Gasket
Note—See Appendix B of this manual for instructions on modifying the fluid ends of HT-400 pumps.
New fluid-end cover gaskets for the HT-400 pump have been tested successfully in all pumping services. These gaskets are harder than standard rubber gaskets and are more difficult to install, but they will provide longer service and can be used for all pumping services. See Table 3.3 for part numbers.
Table 3.2—Part Numbers for the Suction Y Header
Part Number Description
100011736 Suction Y header for CO2 service
100002455 Hex cap screw, 5/8-in.,
11 UNC × 1 3/4-in
100015419a O-ring, 90d, 5 3/8 × 4 7/8 × 1/4
aO-ring 100001979 can be substituted.
Table 3.3—Fluid-End Cover Gaskets for CO2 Service with HT-400 Pumps
Part Number Description
100002857 No. 3 cover gasket
100058449 No. 4 cover gasket
101208040 No. 5 cover gasket
101208478 No. 6 cover gasket
September 2001 5 of 14 Section 3

CO2 Safety Manual
HT-400 Header RingAnother improvement in CO2 service is a new urethane header ring. When used in CO2 and Xylene services, the standard header ring swells and blisters, signifi-cantly decreasing its working life. A urethane header ring suitable for use in CO2, Xylene, and standard services has been tested and is now available for general use. Table 3.4 lists part numbers.
To install the new header ring, follow the installation instructions in the HT-400 Repair and Overhaul Manual (Part No. 100002809). Tighten the packing to a 30-lb pull with a standard (short) packing wrench.
Caution—Overtightening will cause the ring to get too hot and melt.
Note—Set the plunger lube system to 15 to 20 psi. Use a low-temperature rock-drill oil with a pour point of -40°F or less, or use C-3 hydraulic fluid.
Important—Pumping systems that use recirculating oil are not recommended for CO2 services. The CO2 can impregnate the oil, causing the reservoir tank to expand and rupture.
Pumping Liquid CO2 with a Positive-Displacement PumpThe following factors influence the performance of a crankshaft pump during operations with liquid CO2:
• differential boost pressure (pressure rise across boost pump)
• discharge pressure
• pump speed (flow rate)
• ambient temperature
• plunger size
• suction-hose diameter and length
• packing lubrication
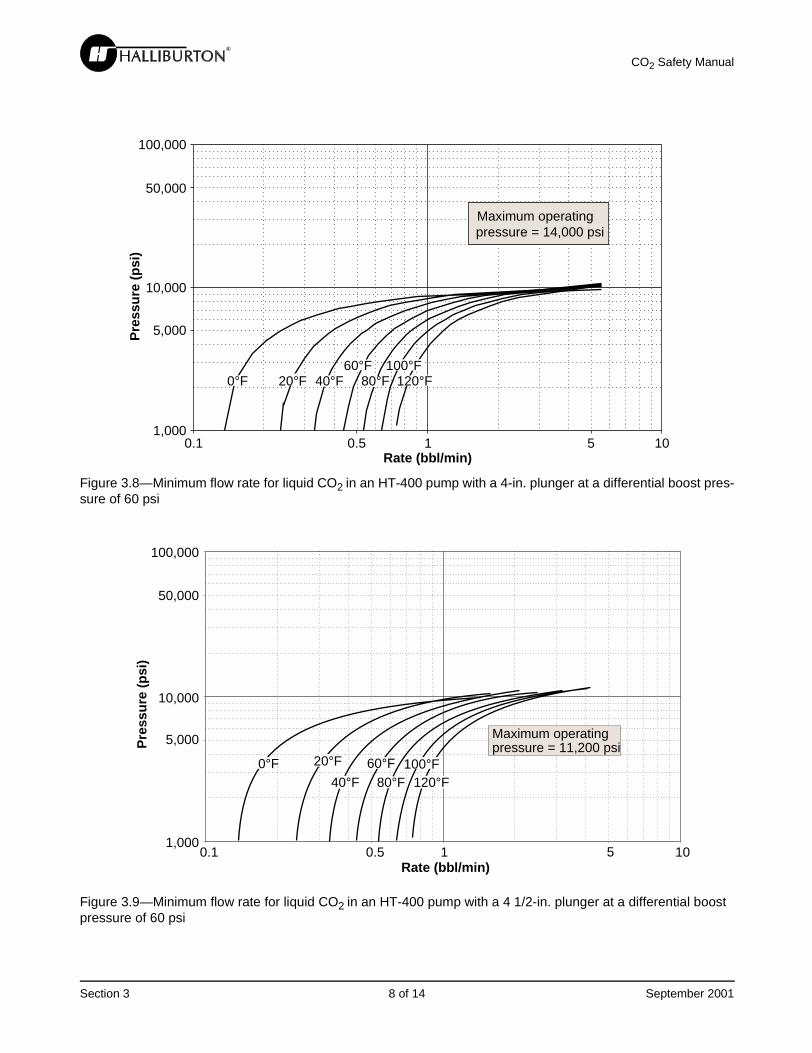
Performance Curves
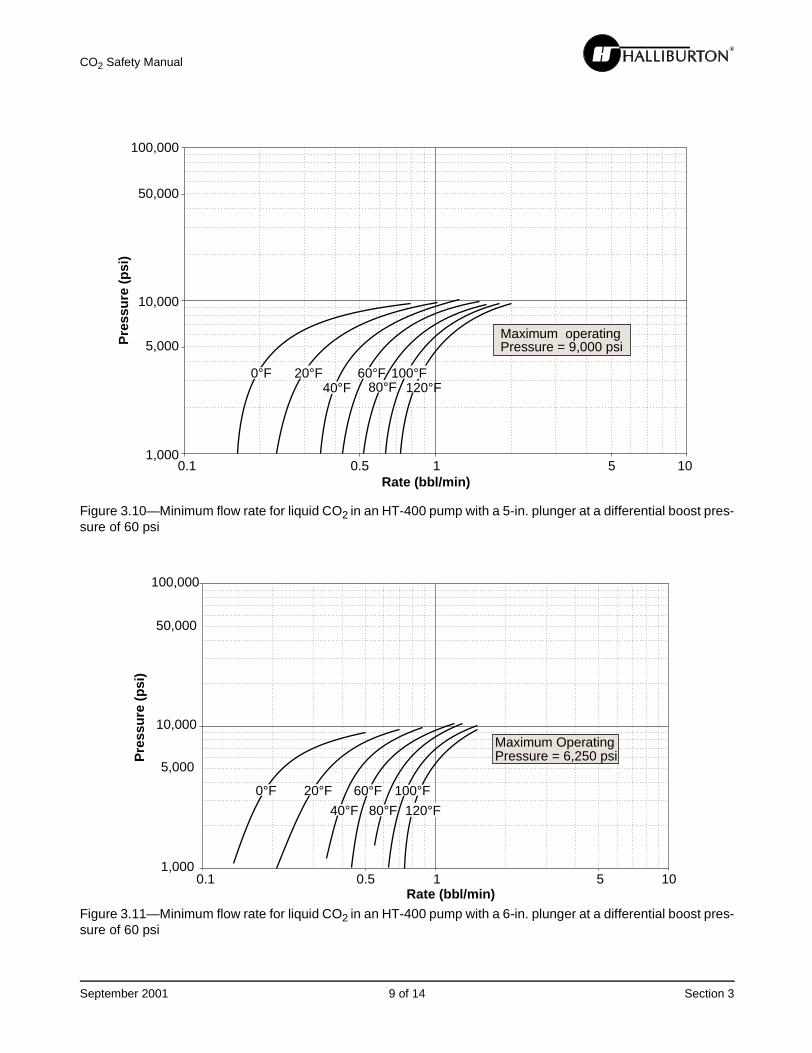
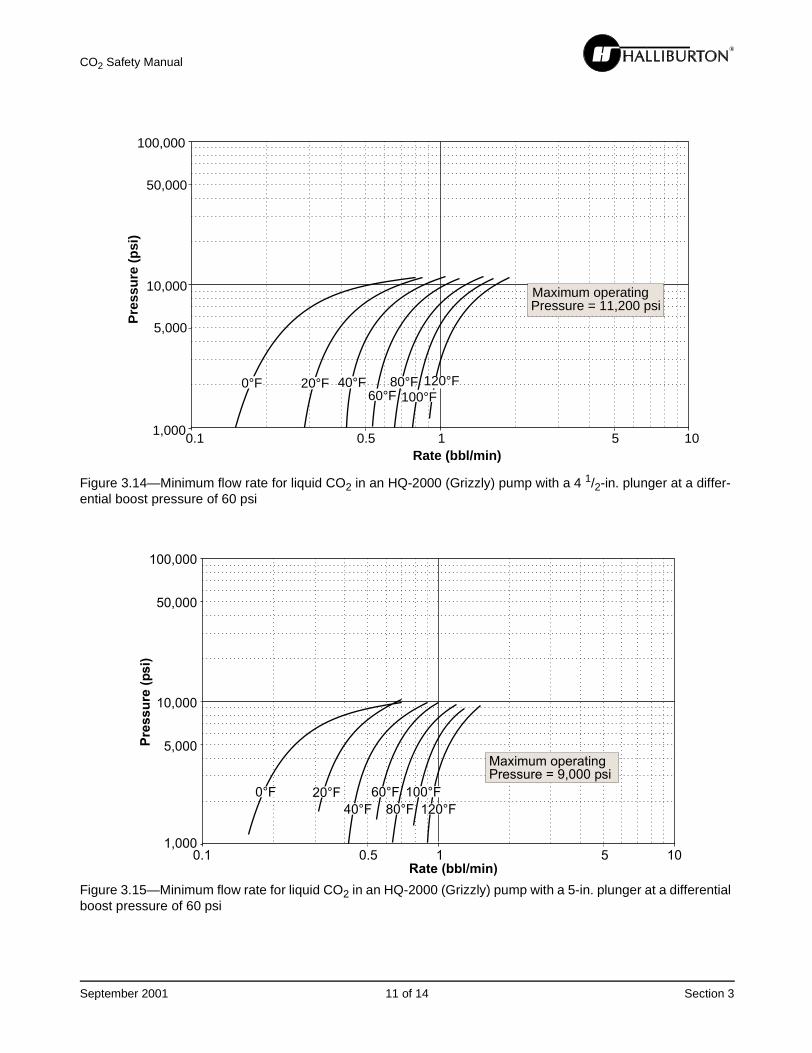
Figure 3.7 (Page 7) through Figure 3.19 (Page 13) show theoretical performance curves for various plunger sizes used with Halliburton pumps. For a given plunger size, each chart shows the maximum pressure at which a pump can operate without vapor-locking, depending on flow rate and ambient temperature.
These performance curves are based on the following assumptions:
• The differential boost pressure is 60 psi (4 bar).
• The suction hose has a 4-in. ID and is 10 ft long.
• The plunger packing is poorly lubricated.
Note—Using a differential boost pressure lower than 60 psi (4 bar) or a suction hose longer than 10 ft would invalidate the charts; however, a higher differential boost pressure or a shorter suction hose would be bene-ficial. Pumps will cavitate when used outside their performance ranges for pumping CO2.
Determining the Correct Plunger Size
Problem
You want to use an HT-400 pump to pump liquid CO2. The job pressure is 7,397 psi (510 bar), the flow rate is 63 gal/min, and the ambient temperature is 100°F. What is the correct plunger size for the job?
Answer
The answer is based on a 60-psi differential boost pres-sure provided by a Halliburton boost trailer. Figure 3.7 (Page 7) through Figure 3.8 (Page 8) show that 3 3/8-in. and 4-in. plungers are unsatisfactory for this job. Under the pumping conditions described in the problem above, these plunger sizes cause vapor locking.
Figure 3.9 (Page 8) shows that the 4 1/2-in. plunger can operate at a maximum pressure of 8,000 psi, making it suitable for this job.
Table 3.4—Urethane Header Rings for CO2 Service with HT-400 Pumps
Part Number Size
100058346 3 3/8 in.
100002897 4 × 5 in.
100002949 4 1/2 in.
100058486 5 in.
100058613 6 in.
Section 3 6 of 14 September 2001

CO2 Safety Manual
Extending the Maximum Operating Pressure
To extend the maximum operating pressure of a pump beyond the values listed in the performance charts, perform the following:
1. Increase the differential boost pressure above 60 psi.
2. Thermally insulate the suction hose and the fluid end of the pump.
3. Lubricate the fluid-end packing with Dexron II or an equivalent low-viscosity oil.
Example
Theoretically, the 3 3/8-in. plunger can operate at 15,000 psi (with a flow rate between 1.2 and 1.5 bbl/min and an ambient temperature of 120°F). You can ensure that the plunger operates correctly at this pressure by using a 100-psi differential boost pressure, a 2-in. ID suction hose, thermal insulation, and packing lubrica-tion.
See Appendix C of this manual for information about modifying the fluid end of the HT-400 pump for use with CO2.
Figure 3.7—Minimum flow rate for liquid CO2 in an HT-400 pump with a 3 3/8-in. plunger at a differential boost pres-sure of 60 psi
0°F 20°F 40°F60°F
80°F100°F
120°F
1 10Rate (bbl/min)
1,000
10,000
100,000
0.1
Pre
ssu
re (
psi
)
5,000
50,000
pressure = 20,000 psiMaximum operating
0.5 5
September 2001 7 of 14 Section 3
CO2 Safety Manual
Figure 3.8—Minimum flow rate for liquid CO2 in an HT-400 pump with a 4-in. plunger at a differential boost pres-sure of 60 psi
Figure 3.9—Minimum flow rate for liquid CO2 in an HT-400 pump with a 4 1/2-in. plunger at a differential boost pressure of 60 psi
1,000
10,000
100,000
0°F 20°F 40°F60°F
80°F100°F
120°F
0.1 1 10Rate (bbl/min)
Pre
ssu
re (
psi
)
5,000
50,000
0.5 5
Maximum operatingpressure = 14,000 psi
10,000
100,000
0.1 1 10Rate (bbl/min)
Maximum operatingpressure = 11,200 psi
1,000
5,000
50,000
0°F 20°F
40°F60°F
80°F100°F
120°F
0.5 5
Pre
ssu
re (
psi
)
Section 3 8 of 14 September 2001
CO2 Safety Manual
Figure 3.10—Minimum flow rate for liquid CO2 in an HT-400 pump with a 5-in. plunger at a differential boost pres-sure of 60 psi
Figure 3.11—Minimum flow rate for liquid CO2 in an HT-400 pump with a 6-in. plunger at a differential boost pres-sure of 60 psi
1,000
10,000
100,000
0.1 1 10Rate (bbl/min)
Maximum operatingPressure = 9,000 psi5,000
50,000
0.5 5
Pre
ssu
re (
psi
)
0°F 20°F40°F
60°F80°F
100°F120°F
1,000
10,000
100,000
0.1 1 10Rate (bbl/min)
Maximum OperatingPressure = 6,250 psi
5,000
50,000
0.5 5
0°F 20°F
40°F
60°F
80°F
100°F
120°F
Pre
ssu
re (
psi
)
September 2001 9 of 14 Section 3

CO2 Safety Manual
Figure 3.12—Minimum flow rate for liquid CO2 in an HQ-2000 (Grizzly) pump with a 3 3/8-in. plunger at a differ-ential boost pressure of 60 psi
Figure 3.13—Minimum flow rate for liquid CO in an HQ-2000 (Grizzly) pump with a 4-in. plunger at a differential boost pressure of 60 psi
1,000
10,000
100,000
0.1 1 10Rate (bbl/min)
Maximum operatingPressure = 20,000 psi
0°F 20°F40°F
60°F80°F
100°F120°F
0.5 5
5,000
50,000
Pre
ssu
re (
psi
)
1,000
10,000
100,000
0.1 1 10Rate (bbl/min)
Maximum operatingPressure = 14,000 psi5,000
50,000
0.5 5
0°F 20°F
40°F60°F
80°F100°F
120°F
Pre
ssu
re (
psi
)
Section 3 10 of 14 September 2001
CO2 Safety Manual
Figure 3.14—Minimum flow rate for liquid CO2 in an HQ-2000 (Grizzly) pump with a 4 1/2-in. plunger at a differ-ential boost pressure of 60 psi
Figure 3.15—Minimum flow rate for liquid CO2 in an HQ-2000 (Grizzly) pump with a 5-in. plunger at a differential boost pressure of 60 psi
0°F
1,000
10,000
100,000
0.1 1 10Rate (bbl/min)
Maximum operatingPressure = 11,200 psi
0.5 5
50,000
5,000
Pre
ssu
re (
psi
)
20°F 40°F 80°F 120°F60°F 100°F
1,000
10,000
100,000
0.1 1 10Rate (bbl/min)
0°F
Maximum operatingPressure = 9,000 psi
120°F80°F
20°F
40°F
60°F 100°F
Pre
ssu
re(p
si)
5,000
50,000
0.5 5
September 2001 11 of 14 Section 3

CO2 Safety Manual
Figure 3.16—Minimum flow rate for liquid CO2 in an HQ-2000 (Grizzly) pump with a 6-in. plunger at a differential boost pressure of 60 psi
Figure 3.17—Minimum flow rate for liquid CO2 in an HT-2000 pump with a 4 1/2-in. plunger at a differential boost pressure of 60 psi
1,000
10,000
0.1 1 10Rate (bbl/min)
0°F 20°F
40°F
60°F
80°F
100°F
120°F
Maximum operatingpressure = 6,250 psi
Pre
ssu
re (
psi
)
5,000
0.5 5
1,000
10,000
100,000
0.1 1 10 100Rate (bbl/min)
0°F 20°F40°F
60°F80°F
100°F
120°F
Pre
ssu
re (
psi
)
50,000
5,000
0.5 5 50
Maximum operatingpressure = 20,000 psi
Section 3 12 of 14 September 2001

CO2 Safety Manual
Figure 3.18—Minimum flow rate for liquid CO2 in an HT-2000 pump with a 5-in. plunger at a differential boost pressure of 60 psi
Figure 3.19—Minimum flow rate for liquid CO2 in an HT-2000 pump with a 6-in. plunger at a differential boost pressure of 60 psi
1,000
10,000
100,000
0.1 1 10 100Rate (bbl/min)
0°F 20°F40°F
60°F80°F
100°F120°FP
ress
ure
(p
si)
50,000
5,000
0.5 5 50
Maximum operatingpressure = 15,000 psi
1,000
10,000
100,000
0.1 1 10Rate (bbl/min)
0°F 20°F 40°F60°F
80°F100°F
120°F
Pre
ssu
re (
psi
)
5,000
50,000
0.5 5
Maximum operatingpressure = 11,500 psi
September 2001 13 of 14 Section 3

CO2 Safety Manual
Section 3 14 of 14 September 2001
Appendix
A
Appendix A—Determining CO2 Discharge TemperaturesThe temperature of the CO2 entering the wellhead determines the amount of tubing contraction that will occur during a job. Therefore, people who use CO2 for oilfield operations must be able to determine CO2 discharge temperatures.
After the CO2 discharge temperature has been deter-mined, software programs can be used for determining the temperature of the mixture containing CO2 and water or hydrocarbon-based stimulation fluid. The soft-ware program CO2 Calcs, which is available in HalWin’s StimWin package, can be used for deter-mining the temperature of the mixture entering the wellhead, and StimWin’s TMP program is used for determining tubing contraction.
Numerical ApproachUse Equation 1 to calculate the discharge temperature of liquid CO2 as a function of the discharge pressure:
Td = Tt Ea..............................................................Eq. 1
Where
Td = absolute temperature of CO2 at discharge, °R
Ts = absolute temperature of CO2 in the tank, °R
a = [1.257 × 10⁻⁵ - 2.2147 × 10⁻¹⁰ (Pd - Pt )][Pd - Pt ]
Pd = discharge pressure, psi
Pt = suction pressure (pressure in the CO2 tank), psi
Equation 1 is based on the assumption of adiabatic compression, and it predicts the discharge temperature within 2°F of available experimental data. Use Equa-tion 2 to calculate the absolute temperature for a given tank pressure (in psi):
Tt = 402.65 + 0.19056 Pt .......................................Eq. 2
Generally, tank pressure varies from 280 psi to approx-imately 220 psi as the liquid level decreases. The reduced pressure causes the suction-fluid temperature to vary between -4° and -15.4°F, resulting in a CO2 discharge-temperature fluctuation of approximately 11.4°F.
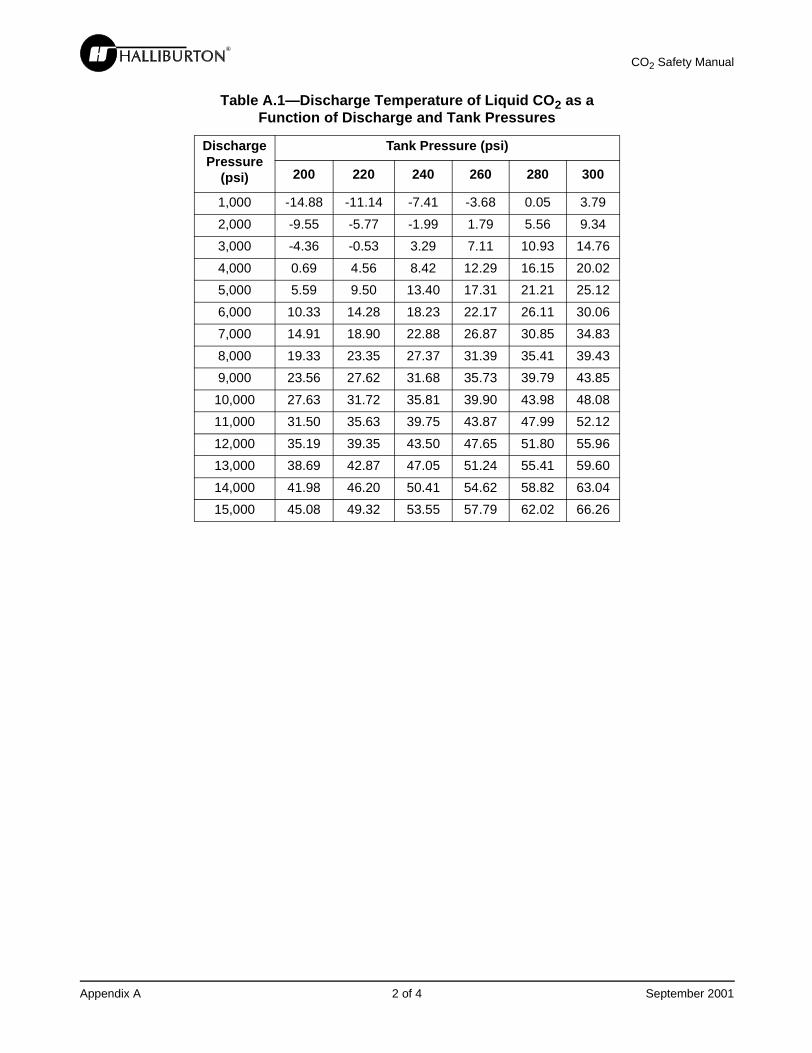
Graphical ApproachTable A.1 (Page 2) shows the discharge temperature of CO2 as a function of discharge and tank pressures. You can accurately determine discharge temperatures from Table A.1 (Page 2), but interpolation is required for intermediate values.
September 2001 1 of 4 Appendix A
CO2 Safety Manual
Table A.1—Discharge Temperature of Liquid CO2 as a Function of Discharge and Tank Pressures
Discharge Pressure
(psi)
Tank Pressure (psi)
200 220 240 260 280 300
1,000 -14.88 -11.14 -7.41 -3.68 0.05 3.79
2,000 -9.55 -5.77 -1.99 1.79 5.56 9.34
3,000 -4.36 -0.53 3.29 7.11 10.93 14.76
4,000 0.69 4.56 8.42 12.29 16.15 20.02
5,000 5.59 9.50 13.40 17.31 21.21 25.12
6,000 10.33 14.28 18.23 22.17 26.11 30.06
7,000 14.91 18.90 22.88 26.87 30.85 34.83
8,000 19.33 23.35 27.37 31.39 35.41 39.43
9,000 23.56 27.62 31.68 35.73 39.79 43.85
10,000 27.63 31.72 35.81 39.90 43.98 48.08
11,000 31.50 35.63 39.75 43.87 47.99 52.12
12,000 35.19 39.35 43.50 47.65 51.80 55.96
13,000 38.69 42.87 47.05 51.24 55.41 59.60
14,000 41.98 46.20 50.41 54.62 58.82 63.04
15,000 45.08 49.32 53.55 57.79 62.02 66.26
Appendix A 2 of 4 September 2001

CO2 Safety Manual
Example
Figure A.1 provides curves for various CO2 discharge temperatures. To determine the discharge temperature for a particular discharge pressure, follow the line for the appropriate discharge pressure upward until you
reach the appropriate curve for tank pressure. Then, follow that line to the left. For example, if the discharge pressure is 5,000 psi and the tank pressure is 280 psi, the discharge temperature would be 21°F.
Figure A.1—CO2 discharge temperatures
5,000 10,000
Discharge Pressure (psi)15,0000
-20
-10
0
10
20
30
40
50
60
70
Dis
ch
arg
eTe
mp
era
ture
(°F
)
+21°F
Tank
Pre
ssur
e=
300
psi
280
psi
260
psi
240
psi
220
psi
200
psi
September 2001 3 of 4 Appendix A

CO2 Safety Manual
Appendix A 4 of 4 September 2001
Appendix
B
Appendix B—Modifying the Fluid Ends of HT-400 Pumps for CO2 JobsTie-Bolt Arrangement
To pump CO2 with HT-400 pumps fitted with true 4-in., 4 × 4 1/2-in., or 4 1/2-in. fluid ends, you must modify the tie-bolt arrangement.
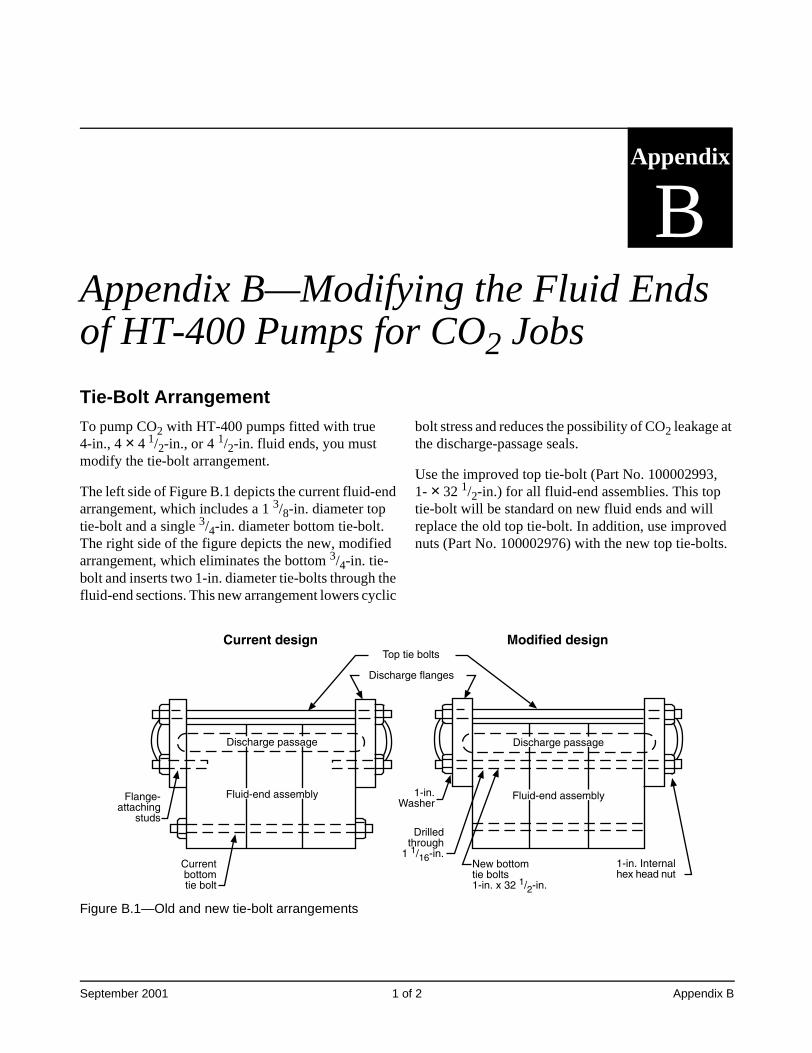
The left side of Figure B.1 depicts the current fluid-end arrangement, which includes a 1 3/8-in. diameter top tie-bolt and a single 3/4-in. diameter bottom tie-bolt. The right side of the figure depicts the new, modified arrangement, which eliminates the bottom 3/4-in. tie-bolt and inserts two 1-in. diameter tie-bolts through the fluid-end sections. This new arrangement lowers cyclic
bolt stress and reduces the possibility of CO2 leakage at the discharge-passage seals.
Use the improved top tie-bolt (Part No. 100002993, 1- × 32 1/2-in.) for all fluid-end assemblies. This top tie-bolt will be standard on new fluid ends and will replace the old top tie-bolt. In addition, use improved nuts (Part No. 100002976) with the new top tie-bolts.
Figure B.1—Old and new tie-bolt arrangements
-���#�����.��!���
� ������( ���
���!�/��#��
0�1�( �� ����( ������!��2�����*���!�
-�����$�#� ��#
���*����!������!�( �� ����( ��
���!��������#�!�
���$�
������������ � ���������
���!��3!���!��#�2�#��$�!��
����$��!$����� (�)����$��!$����� (�)
-���#������������ -���#������������
September 2001 1 of 2 Appendix B
CO2 Safety Manual
Part Numbers
Table B.1 lists the sizes and part numbers for drilled, single fluid-end sections and complete fluid-end assemblies that are available from the Duncan ware-house.
Table B.2 lists the part numbers and quantities of tie-bolts, washers, and hex nuts required for modifying a complete fluid-end (three-section) assembly in the field.
Modifying Fluid Ends
To modify a fluid end, perform the following:
1. Disassemble the fluid end:
a. Drill a 1 1/16-in. diameter hole through all three fluid-end sections at the location of the flange-attaching studs.
b. Pilot-drill the fluid-end sections with a 5/8- or 3/4-in. bit.
Note—Drill slowly from both sides of each section so that the bit can “walk” to the centerline.
2. Coat all threads of the tie-bolts with thread lubri-cant.
3. Place 1 × 32 1/2-in. flange tie-bolts (Part No. 100002994) through the 1 × 1/16-in. drilled holes.
4. Place hardened washers (Part No. 100002798) and hex nuts on each end of the new tie-bolts.
Caution—Do not substitute other washers for the hardened washers. Only hardened washers can withstand the stresses associated with these tie-bolts.
5. Adjust the torque of the 1-in. flange tie-bolts to 200 lb-ft.
6. Place the top tie-bolt through the discharge flanges, and secure the top tie-bolt with nuts.
7. Adjust the torque of the top tie-bolt to 200 lb-ft.
8. While holding one nut fixed, tighten each 1-in. tie-bolt 11/4 turns.
9. Hold one nut fixed, and tighten the top tie-bolt one full turn.
Table B.1—Drilled, Single Fluid-End Sections and Complete Fluid-End Assemblies
Fluid-End Size(in.)
Part No. of Drilled Section
Part No. of Complete Fluid-End Assemblya
True 4 101240205 316.2291
4 1/2 100058461 316.2391
aEquipped with curved discharge flanges on both sides and plungers for L-spacers.
Table B.2—Tie-Bolt, Washer, and Hex Nut Part Numbers
Tie-Bolt Part No.a
Washer Part No.
Hex Nut Part No.
Top 100002993(one unit)
—100002976(two units)
Bottom 100002994(two units)
100002798b
(four units)100002811(four units)
aUse the short top tie-bolt (Part No. 100002893) with narrow blank flanges.bThis washer is specially hardened.
Appendix B 2 of 2 September 2001

Appendix
C
Appendix C—CO2 Job ProceduresPreparing the EquipmentTo prepare equipment for use with CO2, perform the following:1. Magnetically inspect the HT-400, HT-1000, and Grizzly pumps or intensifiers.
2. Use a clean rag or methanol to dry out the fluid ends and flowmeter bearings.
Caution—Water left in the fluid ends or flowmeter bearings will freeze, allowing ice to plug valves and prevent the turbine from spinning.
3. To prevent valves from becoming plugged with ice, lubricate the plunger with one of the following materials suitable for low tempera-tures:
• 5W motor oil
• Automatic transmission fluid
• Diesel fuel
• Conoco DN-600
• Mobil SHC734
Important—Ensure that all heavier lubricants have been flushed from the system
4. Verify that all valves, seats, and inserts are in excellent condition.
5. Replace seals that leak during acid, cement, or water pumping.
6. Clean out the boost-trailer strainer.
Determining Available CO2 Product for JobThe volume of CO2 delivered to location should always be greater than the necessary volume expected for the job. When ordering CO2, consider the following:
• The first ton of liquid CO2 added into a receiver or storage device on location will be converted to gas. This gas cap is necessary for pushing the liquid CO2 out of the receiver. At least 5% of the product in the receiver at the beginning of the job will be converted to CO2 gas. As the job progresses, the pressure in the receiver will decrease, and addi-tional liquid CO2 will be converted to gas.
• The location of the bottom liquid sump varies on different receivers. Most sumps are located in the center of the CO2 receiver, but some sumps are located in the front or back. See Figure C.1 (Page 2). However, the liquid lines are not always located adjacent to the sump. Therefore, you should always have the CO2 supplier verify the location of the sump as well as whether the tanks are level or leaning to the front or back. Adjust accordingly for losses resulting from inaccessible liquids left at the bottom of the tank.
• Conditions such as ambient temperatures, wind, and the length of time the product is left in the receiver will cause additional losses. These losses are especially common in the summer when the receivers or transports can reach the maximum tank pressure within a few days. Consequently, CO2 gas will be vented to the atmosphere.
September 2001 1 of 9 Appendix C

CO2 Safety Manual
• The volume of CO2 necessary for cooling down each pump varies. The volume of CO2 used in the field will vary depending on ambient temperature, wind, and the distance from the suction hose to
other equipment, such as the pump, the suction manifolding arrangement, and the plunger. Follow these guidelines for determining the volume of CO2 required for cooling an individual pump:
•HT-400 pump = 2 to 3 tons per pump
•Grizzly pump = 3 to 4 tons per pump
•HT-2000 pump = 3 to 4 tons per pump
• During job delays, additional CO2 may be neces-sary for performing vapor tests and cooldowns.
Figure C.1—Level CO2 receiver with sump in middle
Appendix C 2 of 9 September 2001

CO2 Safety Manual
Downstream CO2 Turbine Meter with Temperature ProbeTo accurately meter CO2, you must consider the effects of temperature and pressure. A CO2 turbine meter will be within 1% tolerance if it (1) is properly calibrated, (2) includes a temperature probe downstream of a posi-tive-displacement pump, (3) and designed to account for the wellhead treating pressure (WHTP).
Table C.1 shows the limitations of a turbine meter that is not designed to compensate for the effects of temper-ature. When a temperature probe is not used, the expected temperature should be determined and manu-ally entered into the data-acquisition system (DAS) to
limit the error factor. If a turbine meter is used on both the booster trailer and downstream of the positive-displacement pumps, the meters will track each other. Consequently, both meters will be inaccurate because decreasing pressure in the receivers will cause temper-ature fluctuations during the job.
Appendix A provides guidelines for determining CO2 discharge temperatures.
Table C.1
Storage Receiver Pressure (psi)
WHTP Error Percentageb
When CO2 Temperature is Not Accounted For
200 2,000 7.2
300 2,000 3.2
200 6,000 10.5
300 6,000 7.3
200 8,000 14.3
300 8,000 11.8
Storage Receiver Pressure (psi)
WHTP Error Percentageb
With a Hard-Entered CO2 Discharge Temperature of 30°F
200 2,000 8.9
300 2,000 4.8
200 6,000 3.0
300 6,000 0.0
200 8,000 -0.6
300 8,000 -2.8
September 2001 3 of 9 Appendix C

CO2 Safety Manual
Setting up the JobTo set up a CO2 pumping job, perform the following steps:
1. Connect the vapor lines between the liquid CO2 containers to equalize pressure.
2. Install a vapor line from the CO2 supply to the CO2 booster separator (Figure C.2).
Figure C.2—Vapor line (smaller hose) used to equalize presure between receivers
3. Ensure that the hoses you will be using have been approved for CO2 service.
4. To reduce heat absorption by the CO2, ensure that the suction hoses are the minimum required lengths.
5. Inspect all external covers and braids for damage.
Caution—Always use 4-in. hose unions for CO2 service; 5-in. unions are not rated for CO2 suction pressures.
6. Securely chain all hose connections (Figure C.3).
Figure C.3—CO2 hose with pressure release, secured with chain
7. Clean all unions, and lubricate them with diesel.
8. Ensure that the flowmeter is a cryogenic flow. Do not purge through the flowmeter at a high velocity with vapor. This prevents the turbine from overspeeding.
9. Secure all discharge lines.
10. Install a check valve or manifold trailer in the discharge of each HT-400 pump.
11. Install a check valve on the CO2 line upstream of the master CO2 liquid valve.
12. Install a plug valve and a check valve on the non-CO2 liquid line upstream of the master CO2 liquid valve.
13. Install a check valve in the treating line as close to the well as possible.
14. Use a plug valve and a choke on the release line at the wellhead, placing the plug valve upstream of the choke.
Appendix C 4 of 9 September 2001

CO2 Safety Manual
Pretreatment Safety MeetingTo ensure the safety of personnel and equipment, hold a pretreatment safety meeting before each CO2 job:
1. Inform personnel about the job’s maximum pres-sure and the pressure-testing procedures used.
2. Discuss job hazards, emergency procedures, fire fighting equipment, personal safety equipment, and an emergency meeting place.
3. Ensure that personnel are familiar with universal hand signals for CO2 in case a verbal communi-cation breakdown occurs. Figure C.4 shows hand signals associated with CO2.
Figure C.4—Hand signals
4. Supply 5-minute escape packs to all personnel, and randomly choose one individual to demon-strate proper pack use.
5. Inform operators that once liquid CO2 has been admitted into the system, leaking unions in the CO2 line must not be tightened.
Caution—Never tighten CO2 unions after CO2 has been admitted into the system. The unions could break.
Pressure-Testing and Cooling DownA typical line-test procedure is demonstrated in Figure C.6 (Page 7).
Vapor-Testing CO2 Lines
Perform the following low-pressure (< 350 psi) gas test to identify rank leaks:
1. Using vapor lines and gas from the top of the CO2 product source, vapor-test all lines up to a master CO2/liquid valve.
2. Release pressure, and repair any leaks.
3. After repairing the leaks, repeat this procedure.
Testing CO2 Lines with Glycol
Figure C.5 (Page 6) shows the glycol tank setup for testing lines. After vapor-testing the CO2 lines, test them with glycol as follows:
1. Prepare a -50°F mixture containing 11 parts ethylene glycol (antifreeze) and 8 parts water for pressure-testing.
2. Hook up the glycol to the suction side of the pump nearest to the wellhead.
3. Install a release line to the glycol trailer.
Important—Do not use rubber hoses for the release line.
4. Open the bleeder tee.
5. Start boosting glycol through the suction lines to ensure good returns.
6. Engage the positive-displacement pump, and prime the pumps, one at a time, to the glycol trailer.
7. Shut in the plug valve at the bleeder tee.
8. Engage one pump with the engine at idle, and increase the line pressure up to 20% of the test pressure.
9. Engage the other pumps (one at a time) in gear to initially open (bump) the check valves at the current line pressure and test the lines to the desired pressure.
10. Monitor the pressure chart for leaks.
11. Open the bleeder tee to the glycol trailer, and release pressure.
12. Repair any leaks, and retest if leaks were found.
13. If the glycol trailer includes a suction pump, vaccum fluid out of the suction hose and pumps.
14. Hook up the CO2 suction hose to the pumps.
15. Release pressure from the CO2 units to push out any excess glycol.
Liquid Vapor
September 2001 5 of 9 Appendix C

CO2 Safety Manual
16. When vapor is present at the trailer, shut off gas vapor.
17. Before beginning the job, unhook the steel line at the bleeder tee going to the glycol tank.
Important—If the ethylene glycol mixture and the formation are incompatible, remove as much of the mixture as possible from the discharge lines and the pumps by displacing the mixture with CO2 vapor through the release lines and back into the acid trans-port. Save this mixture for use during other jobs.
Figure C.5—Glycol trailer with suction hose to pump and steel line release back to trailer
Appendix C 6 of 9 September 2001

CO2 Safety Manual
Figure C.6—Typical line-test procedure
Fractanks
HT-400s pumpingliquid phase No fluid CO contacts these
high-pressure liquid lines.Can use water for pressure-testing.
2
Discharge ironfor CO Liquid2
Wellhead
Securedreleaseline
GlycolTank
CO transports2
HT-400spumping CO2
Blender
Check valve
Antifreeze solutionrequired in thisline for pressure-testing.
Temperature recorder
1-in. Lo-Torcbleeder tee
CO boosttrailer
2
Flowmeter
Low-torque valves
Check valve
Check valve
Master CO liquid valve2
Choke
Unhook line atbleeder teeafter purgingglycol with vapor.
Pressure transducer
September 2001 7 of 9 Appendix C
CO2 Safety Manual
Liquid CO2 Pumping ProcedureTo pump CO2, perform the following:
1. Close the release valves on top of the HT-400 pumps, and allow the CO2 vapor pressure to reach the maximum value.
2. Completely close the CO2 supply valve.
3. Slowly open the main CO2 source liquid-line valve.
4. Start the boost pumps.
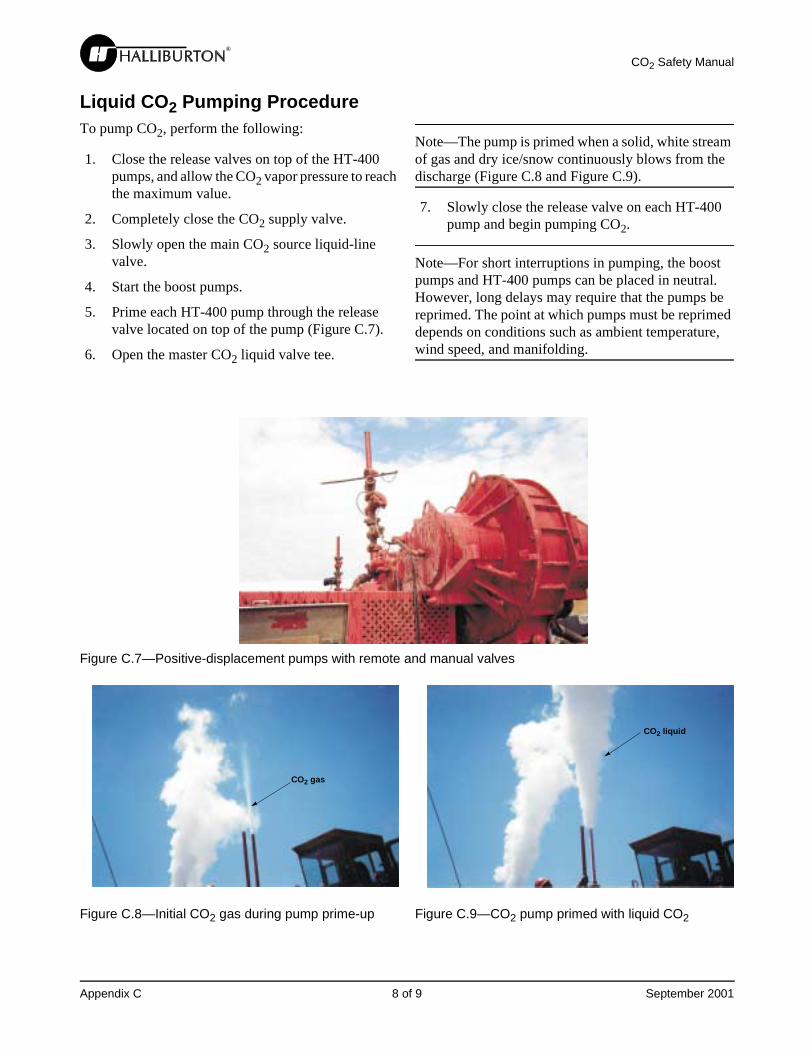
5. Prime each HT-400 pump through the release valve located on top of the pump (Figure C.7).
6. Open the master CO2 liquid valve tee.
Note—The pump is primed when a solid, white stream of gas and dry ice/snow continuously blows from the discharge (Figure C.8 and Figure C.9).
7. Slowly close the release valve on each HT-400 pump and begin pumping CO2.
Note—For short interruptions in pumping, the boost pumps and HT-400 pumps can be placed in neutral. However, long delays may require that the pumps be reprimed. The point at which pumps must be reprimed depends on conditions such as ambient temperature, wind speed, and manifolding.
Figure C.7—Positive-displacement pumps with remote and manual valves
Figure C.8—Initial CO2 gas during pump prime-up Figure C.9—CO2 pump primed with liquid CO2
CO gas2
CO liquid2
Appendix C 8 of 9 September 2001

CO2 Safety Manual
Shutting DownTo shut down the CO2 job, perform the following steps:
1. Shut down the fracturing pumps.
2. Close all liquid CO2 source supply valves at the container.
3. Open the vapor supply valves, and admit CO2 vapor into the system.
4. Close the plug valve in the CO2 discharge line at the master CO2 liquid valve.
5. Slowly open the release valve first at the bleeder tee and then at each fracturing pump.
Caution—Do not allow the manifold pressure to drop below 100 psi because dry ice will form.
6. Place the fracturing pumps in first gear. Allow the pumps to purge the system at idle until only vapor is discharged.
7. Allow the system pressure to bleed off.
Disassembling Equipment
Caution—If the pressure drops below 70 psi when the job stops, wait 30 minutes before draining the system to allow vapor pressure and heat from the atmosphere to melt any dry ice. This will prevent the cannonball effect, which can cause dry-ice slugs to shoot out of hoses. (See Section 1.)
After venting the discharge lines, ensure that the boost pump does not contain residual liquids. Slowly drain the liquid CO2, opening the valves at the lowest points of the boost pump first. Then, drain the vent line. Ensure that the boost-pump pressure is above 100 psi.
To disassemble the equipment after a CO2 job, perform the following steps:
1. When the job is complete, close all valves and remove the vapor line.
Caution—Do not exceed a pressure of 400 psi. The hoses cannot withstand pressures above 400 psi.
2. Allow the frost to melt on the outside of the unions. Then, gently hammer the unions loose.
Caution—Hammer gently on pipe unions. The unions can become brittle at the temperature of dry ice and will easily break or chip.
Caution—Do not flex the rubber hoses until the frost has melted from the outside. The liners in the hoses are not flexible at the temperature of dry ice.
September 2001 9 of 9 Appendix C