
10.1.1.46.5550
11
University College London, December 2 0-22, 1999 S YMPOSIUM ON V IRTUAL R EALITY S OFTWARE AND T ECHNOLOGY , 1999 The HiBall Tracker: High-Performance Wide-Area Tracking for Virtual and Augmented Environments 1 1. ABSTRACT Our HiBall T racking System gene rates over 2000 head-pose estimates per second with less than one millisecond of latency, and less than 0.5 millimeters and 0.02 de grees of position and orientation noise, everywhere in a 4.5 by 8.5 meter room. The system is remarkably respon- sive and robust, enabling VR applications and experiments that previously would have been difficult or even impossible. Previously we published descriptions of only the Kalman filter-based software approach that we call Single-Constraint-at-a-Time tracking. In this paper we describe the complete tracking system, including the novel optical, mechanical, electrical, and algorithmic aspects that enable the unparalleled performance. 1.1 Keywords virtual environments, tracking, calibration, autocalibration, delay, latency, sensor fusion, Kalman filter, optical sensor 2. INTRODUCTION In 1991 the University of North Carolina demonstrated a working scalable optoelectronic head-tracking system in the Tomorrow's Realities gallery at that year’s ACM SIGGRAPH conference [24, 25, 26]. The system used four head-mounted lateral effect photo diode (LEPD) sensors that looked upward at a regular array of infrared light-emitting diodes (LEDs) installed in precisely machined ceiling panels as shown in Figure 1. Photogrammetric techniques were used to compute a user’ s head position and orientation using the known LED positions and their projected images on each LEPD sensor [4]. The system was ground-breaking because it was unaffected by ferromagnetic and conductive materials in the environment, and the working area of the system was determined solely by the number of ceiling panels. See the left panel in Figure 1, and color plate image Welch 1. In this paper we present a new and vastly improved version of that 1991 system. We call the new system the HiBall Tracker . Thanks to significant improvements in both hardware and software this new system offers unprecedented speed, resolution, accuracy, robustness, and flexibility. In particular , the bulky and heavy cameras and backpack of the previous system have been replaced by a small head- mounted HiBall . In addition, the precisely machined LED ceiling panels of the previous system have been replaced by lower-tolerance panels that are relatively inexpensive to make and simple to install. See the right panel in Figure 1, and color plate image Welch 1. Final ly, we are using a n unusual Kalman-filter-based approach to tracking that generates very accurate tracking estimates at a high rate with low latency , and simultaneously self-calibrat es the system. Figure 1. Left: the original UNC optoelectronic ceiling tracker in use, and a close-up of the head-mounted dis- play and sensor fixture, along with the signal processing and communications electronics pack. Right: the new system in use, and a close-up of the self-contained HiBall with lenses and part of the cover removed. See also the color plate Welch 1. The HiBall T racker: High-Performance Wide-Ar ea T racking for Virtual and Augmented Environments Greg Welch, Gary Bishop, Leandra Vicci, Stephen Brumback, Kurtis Keller, D’nardo Colucci † University of North Carolina at Chapel Hill Department of Computer Science, CB# 3175 Chapel Hill, NC 27599-3175 USA 01-919-962-1700 {welch, gb, vicci, brumback, keller}@cs.unc.edu † Alternate Realities Corporation 27 Maple Place Minneapolis, MN 55401 USA 01-612-616-9721 [email protected]
-
Upload
abhishek-kar -
Category
Documents
-
view
217 -
download
0
Transcript of 10.1.1.46.5550

872019 1011465550
httpslidepdfcomreaderfull1011465550 111
University College London December 20-22 1999 S YMPOSIUM ON
V
IRTUAL
R
EALITY
S
OFTWARE
AND
T
ECHNOLOGY
1999
The HiBall Tracker High-Performance Wide-Area Tracking for Virtual and Augmented Environments 1
1 ABSTRACTOur HiBall Tracking System generates over2000 head-pose estimates per second with lessthan one millisecond of latency and less than05 millimeters and 002 degrees of position andorientation noise everywhere in a 45 by 85meter room The system is remarkably respon-sive and robust enabling VR applications andexperiments that previously would have beendifcult or even impossible
Previously we published descriptions of onlythe Kalman lter-based software approach thatwe call Single-Constraint-at-a-Time trackingIn this paper we describe the complete trackingsystem including the novel optical mechanicalelectrical and algorithmic aspects that enablethe unparalleled performance
11 Keywords
virtual environments tracking calibration autocalibrationdelay latency sensor fusion Kalman lter optical sensor
2 INTRODUCTION
In 1991 the University of North Carolina demonstrated aworking scalable optoelectronic head-tracking system in the
Tomorrows Realities
gallery at that yearrsquos ACMSIGGRAPH conference [24 25 26] The system used fourhead-mounted lateral effect photo diode (LEPD) sensors thatlooked upward at a regular array of infrared light-emittingdiodes (LEDs) installed in precisely machined ceiling panelsas shown in Figure 1 Photogrammetric techniques wereused to compute a userrsquos head position and orientation usingthe known LED positions and their projected images on eachLEPD sensor [ 4] The system was ground-breaking because
it was unaffected by ferromagnetic and conductive materialsin the environment and the working area of the system wasdetermined solely by the number of ceiling panels See theleft panel in Figure 1 and color plate image Welch 1
In this paper we present a new and vastly improved versionof that 1991 system We call the new system the HiBallTracker
Thanks to signicant improvements in bothhardware and software this new system offers unprecedentedspeed resolution accuracy robustness and exibility Inparticular the bulky and heavy cameras and backpack of theprevious system have been replaced by a small head-mounted HiBall
In addition the precisely machined LEDceiling panels of the previous system have been replaced bylower-tolerance panels that are relatively inexpensive tomake and simple to install See the right panel in Figure 1 and color plate image Welch 1 Finally we are using anunusual Kalman-lter-based approach to tracking thatgenerates very accurate tracking estimates at a high rate withlow latency and simultaneously self-calibrates the system
Figure 1 Left the original UNC optoelectronic ceilingtracker in use and a close-up of the head-mounted dis-play and sensor fixture along with the signal processing
and communications electronics pack Right the newsystem in use and a close-up of the self-contained HiBallwith lenses and part of the cover removed See also thecolor plate Welch 1
The HiBall Tracker High-Performance Wide-Area Trackingfor Virtual and Augmented Environments
Greg Welch Gary Bishop Leandra Vicci Stephen Brumback Kurtis Keller Drsquonardo Colucci
dagger
University of North Carolina at Chapel HillDepartment of Computer Science CB 3175
Chapel Hill NC 27599-3175 USA01-919-962-1700
welch gb vicci brumback kellercsuncedu
dagger
Alternate Realities Corporation27 Maple Place
Minneapolis MN 55401 USA01-612-616-9721
coluccivirtual-realitycom
872019 1011465550
httpslidepdfcomreaderfull1011465550 211
University College London December 20-22 1999 S
YMPOSIUM
ON
V
IRTUAL
R
EALITY
S
OFTWARE
AND
T
ECHNOLOGY
1999
The HiBall Tracker High-Performance Wide-Area Tracking for Virtual and Augmented Environments 2
As a result of these improvements the HiBall Tracker cangenerate over 2000 estimates per second with less than onemillisecond of latency The system exhibits sub-millimetertranslation noise and similar measured accuracy as well asless than 003 degrees of orientation noise with similarmeasured accuracy The weight of the user-worn HiBall isabout 300 grams making it lighter than just one camera
in
the 1991 system The working volume of the current systemis greater than 90 cubic meters (greater than 45 squaremeters of oor space greater than 2 meters of heightvariation) This area can be expanded by adding more tilesor by using checkerboard congurations which spread tilesover a larger area
3 SYSTEM OVERVIEW
The HiBall tracker system ( Figure 2) provides six-degree-of freedom tracking of devices in real time An outward-looking infrared-sensing subsystem called a HiBall(Figure 1 lower-right) is mechanically xed to each deviceto be tracked The HiBalls view an environment containinga subsystem of xed-location infrared beacons which wecall the Ceiling At the present time the beacons are in fact
entirely located in the ceiling of our laboratory but could aswell be located in walls or other arbitrary xed locationsThese subsystems are coordinated by a Ceiling-HiBallInterface Board (CIB) which provides communication andsynchronization functions between the host computer andthe attached subsystems Each HiBall has 26 narrow (lessthan 6 degree) views distributed over a large solid angleBeacons are selectively ashed in a sequence such that theyare seen by many different elds of view of each HiBallInitial acquisition is performed using a brute force searchthrough beacon space but once initial lock is made theselection of beacons to ash is tailored to the elds of viewof the HiBalls Tracking is maintained using a Kalman-lter-based prediction-correction algorithm known as
SCAAT This technique has been further extended toprovide self-calibration of the Ceiling on-line with thetracking of the attached HiBalls
4 SYSTEM COMPONENTS
41 The Ceiling
The Ceiling architecture provides for ashing only onebeacon at a time The beacons may be ashed in anysequence but protection is provided in hardware and
software to prevent exceeding the duty cycle of the infrared(IR) light emitting diodes (LEDs) Thus no single LED canbe ashed again until it has had sufcient time to cool LEDdriving current and therefore emitted light level is selectablefor use by a software automatic gain control (AGC) functionas described in section 52
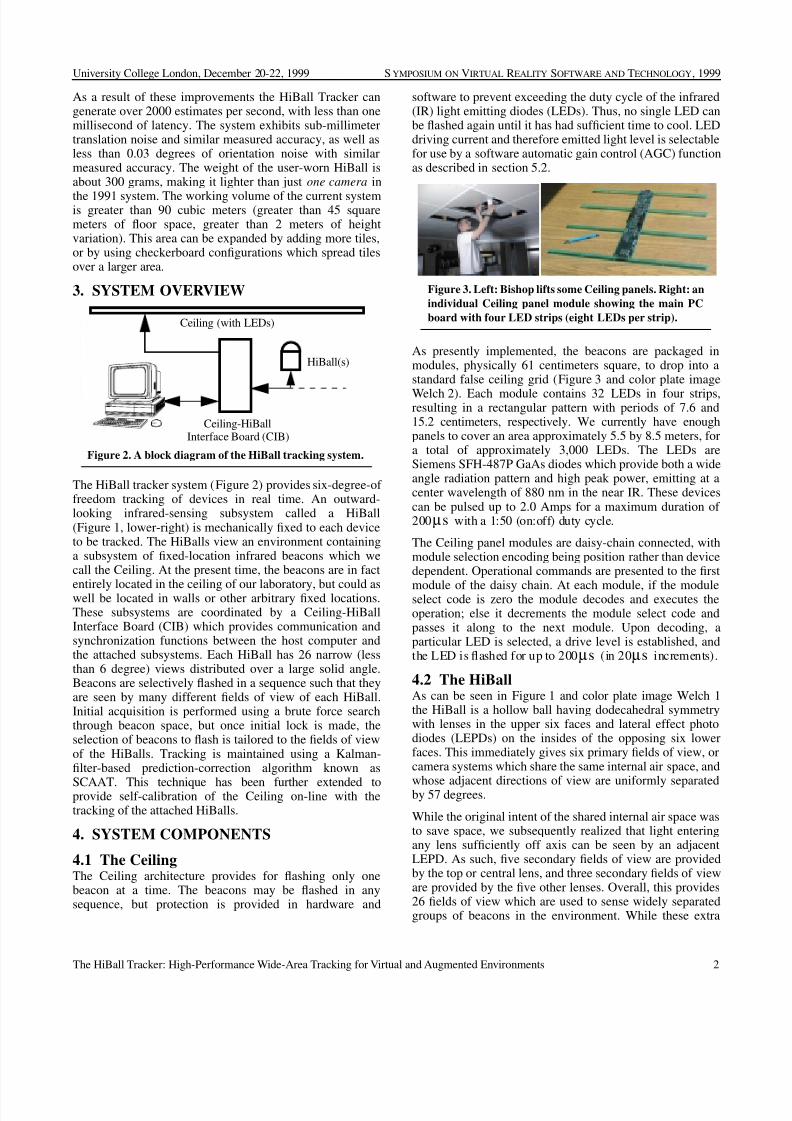
As presently implemented the beacons are packaged inmodules physically 61 centimeters square to drop into astandard false ceiling grid ( Figure 3 and color plate imageWelch 2) Each module contains 32 LEDs in four stripsresulting in a rectangular pattern with periods of 76 and152 centimeters respectively We currently have enoughpanels to cover an area approximately 55 by 85 meters fora total of approximately 3000 LEDs The LEDs areSiemens SFH-487P GaAs diodes which provide both a wideangle radiation pattern and high peak power emitting at acenter wavelength of 880 nm in the near IR These devicescan be pulsed up to 20 Amps for a maximum duration of 200 with a 150 (onoff) duty cycle
The Ceiling panel modules are daisy-chain connected withmodule selection encoding being position rather than devicedependent Operational commands are presented to the rst
module of the daisy chain At each module if the moduleselect code is zero the module decodes and executes theoperation else it decrements the module select code andpasses it along to the next module Upon decoding aparticular LED is selected a drive level is established andthe LED is ashed for up to 200 (in 20 increments)
42 The HiBall
As can be seen in Figure 1 and color plate image Welch 1the HiBall is a hollow ball having dodecahedral symmetrywith lenses in the upper six faces and lateral effect photodiodes (LEPDs) on the insides of the opposing six lowerfaces This immediately gives six primary elds of view orcamera systems which share the same internal air space and
whose adjacent directions of view are uniformly separatedby 57 degrees
While the original intent of the shared internal air space wasto save space we subsequently realized that light enteringany lens sufciently off axis can be seen by an adjacentLEPD As such ve secondary elds of view are providedby the top or central lens and three secondary elds of vieware provided by the ve other lenses Overall this provides26 elds of view which are used to sense widely separatedgroups of beacons in the environment While these extra
Ceiling (with LEDs)
Ceiling-HiBallInterface Board (CIB)
HiBall(s)
Figure 2 A block diagram of the HiBall tracking system
Figure 3 Left Bishop lifts some Ceiling panels Right anindividual Ceiling panel module showing the main PCboard with four LED strips (eight LEDs per strip)
micros
micros micros
872019 1011465550
httpslidepdfcomreaderfull1011465550 311
University College London December 20-22 1999 S
YMPOSIUM
ON
V
IRTUAL
R
EALITY
S
OFTWARE
AND
T
ECHNOLOGY
1999
The HiBall Tracker High-Performance Wide-Area Tracking for Virtual and Augmented Environments 3
views complicate the initialization of the Kalman lter asdescribed in section 55 they turn out to be of great benetduring steady-state tracking by effectively increasing theoverall HiBall eld of view without sacricing resolution
The lenses are simple plano-convex xed focus lenses IRltering is provided by fabricating the lenses themselvesfrom RG-780 Schott glass lter material which is opaque tobetter than 0001 for all visible wavelengths andtransmissive to better than 99 for IR wavelengths longerthan 830 nm The longwave ltering limit is provided by theDLS-4 LEPD silicon photodetector (UDT Sensors Inc)with peak responsivity at 950 nm but essentially blind above1150 nm
The LEPDs themselves are not imaging devices rather theydetect the centroid of the luminous ux incident on thedetector The x-position of the centroid determines the ratioof two output currents while the y-position determines theratio of two other output currents The total output current of each pair are commensurate and proportional to the totalincident ux Consequently focus is not an issue so thesimple xed-focus lenses work well over a range of beacondistances from about half a meter to innity
Finally the LEPDs and associated analog and digitalelectronic components are mounted on a custom rigid-exprinted circuit board as shown in color plate image Welch 2This arrangement makes efcient use of the internal HiBallvolume while maintaining isolation between analog anddigital circuitry and increasing reliability by alleviating theneed for inter-component mechanical connectors
43 The Ceiling-HiBall Interface Board
The Ceiling-HiBall Interface Board (CIB) shown below inFigure 4 provides communication and synchronization
between a host personal computer the Ceiling ( section 41 )and the HiBall ( section 42 )
The CIB has four Ceiling ports allowing interleaving of ceiling panels for up to four simultaneous led ashes andorhigher Ceiling bandwidth for more simultaneous hiballusage (The Ceiling bandwidth is inherently limited by LEDcurrent restrictions as described in section 41 but this canbe increased by spatially multiplexing the Ceiling tiles) TheCIB has two tether interfaces that can communicate with upto four daisy-chained hiballs each The full-duplexcommunication with the hiballs uses a modulation scheme(BPSK) allowing future wireless operation The interface
from the CIB to the host PC is the stable IEEE1284Cextended parallel port (EPP) standard
The CIB comprises analog drive and receive components aswell as digital logic components The digital componentsimplement store and forward in both directions andsynchronize the timing of the LED ldquoonrdquo interval within theHiBall dark-light-dark intervals The protocol supports full-duplex ow control The data are arranged into packetscontaining error detection to insure data quality
5 METHODS
51 Bench-Top (Off-Line) HiBall Calibration
After each HiBall is assembled we perform an off-linecalibration to determine the correspondence between image-plane coordinates and rays in space This involves more than
just determining the view transform for each of the 26camera (sensor) views Non-linearities in the silicon sensorand distortions in the lens (eg spherical aberration) causesignicant deviations from a simple pin-hole camera modelWe dealt with all of these issues through the use of a two-part camera model The rst part is a standard pin-holecamera represented by a 3x4 matrix The second part is atable mapping real image-plane coordinates to ideal image-plane coordinates
Both parts of the camera model are determined using acalibration procedure that relies on a goniometer (an angularpositioning system) of our own design This device consistsof two servo motors mounted together such that one motorprovides rotation about the vertical axis while the secondmotor provides rotation about an axis orthogonal to verticalAn important characteristic of the goniometer is that therotational axes of the two motors intersect at a point at thecenter of the HiBall optical sphere this point is dened as
the origin of the HiBall (It is this origin that provides thereference for the HiBall state during run time as described insection 53 ) The rotational positioning motors were rated toprovide 20 arc-second precision we further calibrated themusing a surveying grade theodolite an angle measuringsystem to 6 arc seconds
In order to determine the mapping between sensor image-plane coordinates and three-space rays we use a single LEDmounted at a xed location in the laboratory such that it iscentered in the view directly out of the top lens of theHiBall This ray denes the Z or up axis for the HiBallcoordinate system We sample other rays by rotating thegoniometer motors under computer control We sample each
view with rays spaced about every 6 minutes of arcthroughout the eld of view We repeat each measurement100 times in order to reduce the effects of noise on theindividual measurements and to estimate the standarddeviation of the measurements
Given the tables of approximately 2500 measurements foreach view we rst determine a 3 by 4 view matrix usingstandard linear least-squares techniques Then we determinethe deviation of each measured point from that predicted bythe ideal linear model These deviations are re-sampled into
Figure 4 The Ceiling-HiBall Interface Board (CIB) TheCIB shown is 19 inches the newest revision is 14 inches
872019 1011465550
httpslidepdfcomreaderfull1011465550 411
University College London December 20-22 1999 S
YMPOSIUM
ON
V
IRTUAL
R
EALITY
S
OFTWARE
AND
T
ECHNOLOGY
1999
The HiBall Tracker High-Performance Wide-Area Tracking for Virtual and Augmented Environments 4
a 25 by 25 grid indexed by sensor-plane coordinates using asimple scan conversion procedure and averaging Given ameasurement from a sensor at run time we convert it to anldquoidealrdquo measurement by subtracting a deviation bi-linearlyinterpolated from the nearest 4 entries in the table
52 On-Line HiBall Measurements
Upon receiving a command from the CIB ( section 43 )which is synchronized with a CIB command to the ceilingthe HiBall selects the specied LEPD and performs threemeasurements one before the beacon ashes one duringthe beacon ash and one after the beacon ash Known asldquodark-light-darkrdquo this technique is used to subtract out DCbias low frequency noise and background light from thebeacon signal
Each LEPD has four transimpedance ampliers the analogoutputs of which are multiplexed with those of the otherLEPDs then sampled held and converted by four 16-bitDelta-Sigma ADCs Multiple samples can be integratedinternally in the HiBall The digitized LEPD data areorganized into a packet for communication back to the CIBThe packets also contain information to assist in error-detection The communication protocol is simple and whilepresently implemented by wire the modulation scheme isamenable to a wireless implementation The present wiredimplementation allows multiple HiBalls to be daisy chainedso a single cable can support a user with multiple HiBalls
During run time we attempt to maximize the signal-to-noiseratio of the measurement with an automatic gain controlscheme For each LED we store a target signal strengthconstant We compute the LED current and number of integrations (of successive AD samples) by dividing thisstrength constant by the square of the distance to the LEDestimated from the current position estimate After a readingwe look at the strength of the actual measurement If it islarger than expected we reduce the gain if it is less thanexpected we increase the gain The increase and decreaseare implemented as on-line averages with scaling such thatthe gain constant decreases rapidly (to avoid overow) andincreases slowly Finally we use the measured signalstrength to estimate the noise on the signal using [ 8] andthen use this as the measurement noise estimate for theKalman lter ( section 53)
53 Recursive Pose Estimation (SCAAT)
The on-line measurements ( section 52 ) are used to estimatethe pose of the HiBall in real time on line The 1991 systemcollected a group of similar measurements for a variety of LEDs and sensors and then used a method of simultaneousnon-linear equations called Collinearity
[4] to estimate thepose of the sensor xture shown in Figure 1 (left) Therewas one equation for each measurement expressing theconstraint that a ray from the front principle point of thesensor lens to the LED must be collinear with a ray fromthe rear principle point to the intersection with the sensorEach estimate made use of a group of measurements(typically 20 or so) that together over-constrained thesolution
This multiple constraint
method had several drawbacksFirst it had a signicantly lower estimate rate due to theneed to collect multiple measurements per estimate Secondthe system of non-linear equations did not account for thefact that the sensor xture continued to move throughout thecollection of the sequence of measurements Instead themethod effectively assumes that the measurements were
taken simultaneously The violation of this simultaneityassumption
could introduce signicant error during evenmoderate motion Finally the method provided no means toidentify or handle unusually noisy individual measurementsThus a single erroneous measurement could cause anestimate to jump away from an otherwise smooth track
In contrast the approach we use with the new HiBall systemproduces tracker reports as each new measurement is maderather than waiting to form a complete collection of observations Because single measurements under-constrainthe mathematical solution we refer to the approach asSingle-Constraint-at-a-Time or SCAAT tracking [ 28 29]The key is that the single measurements provide some
information about the users state and thus can be used toincrementally improve a previous estimate Using a Kalmanlter [ 15] we intentionally
fuse measurements that do notindividually provide sufcient information incorporatingeach individual measurement immediately as it is obtainedWith this approach we are able to generate estimates morefrequently with less latency with improved accuracy andwe are able to effectively estimate the LED positions on-lineconcurrently while tracking the HiBall ( section 54 )
We use a Kalman lter a minimum variance stochasticestimator to estimate the HiBall state
ie the positionand orientation of the HiBall We use a Kalman lter in partbecause the sensor measurement noise and the typical usermotion dynamics can be modeled as normally-distributedrandom processes but also because we want an efcient on-line method of estimation A basic introduction to theKalman lter can be found in Chapter 1 of [ 17] while amore complete introductory discussion can be found in [ 20]which also contains some interesting historical narrativeMore extensive references can be found in [7 12 14 16 1730] The Kalman lter has been used previously to addresssimilar or related problems See for example [2 3 9 10 1823] and most recently [ 11 ]
The SCAAT approach in particular is described in greatdetail in [ 28 29] The benets of using this approach asopposed to a multiple-constraint approach such as [ 4] arealso discussed in [ 28 29] However one key benet warrants
discussion here There is a direct relationship between thecomplexity of the estimation algorithm the correspondingexecution time per estimation cycle and the character of HiBall motion between estimation cycles As thealgorithmic complexity increases the execution timeincreases which allows for signicant non-linear HiBallmotion between estimation cycles which in turn implies theneed for a more complex estimation algorithm
x
872019 1011465550
httpslidepdfcomreaderfull1011465550 511
University College London December 20-22 1999 S
YMPOSIUM
ON
V
IRTUAL
R
EALITY
S
OFTWARE
AND
T
ECHNOLOGY
1999
The HiBall Tracker High-Performance Wide-Area Tracking for Virtual and Augmented Environments 5
The SCAAT approach on the other hand is an attempt toreverse this cycle Because we intentionally use a singleconstraint per estimate the algorithmic complexity isdrastically reduced which reduces the execution time andhence the amount of motion between estimation cyclesBecause the amount of motion is limited we are able to use asimple dynamic (process) model in the Kalman lter which
further simplies the computations In short the simplicityof the approach means it can run very fast which means itcan produce estimates very rapidly with low noise
The Kalman lter requires both a model of the processdynamics and a model of the relationship between theprocess state and the available measurements In part due tothe simplicity of the SCAAT approach we are able to use avery simple process model We model the continuouschange in the HiBall state vector with the simpledifferential equation
where the scalar
is a normally-distributed scalar white noise processand the scalar represents the magnitude of the noise (thespectral density) A similar model with a distinct noisemagnitude is used for each of the six position andorientation elements The individual noise magnitudes aredetermined using an off-line simulation of the system and anon-linear optimization strategy that seeks to minimize the
variance between the estimate pose and a known motionpath (See section 622 ) The above differential equationrepresents a continuous integrated random walk or anintegrated Wiener
or Brownian-motion
process Specicallywe model each component of the linear and angular HiBallvelocities as random walks and use these assumingconstant inter-measurement velocity to estimate the sixelements of the HiBall pose at time as follows
(1)
In addition to a relatively simple process model the HiBallmeasurement model is relatively simple For any CeilingLED ( section 41 ) and HiBall camera view ( section 42 ) the2D sensor measurement can be modeled as
(2)
where
is the camera viewing matrix from section 51 the vectorcontains the position of the LED in the world and is a
rotation matrix constructed from the orientation quaternioncontained in the state vector
In practice we maintain the orientation of the HiBall as acombination of a global (external to the state) quaternionand a set of incremental angles as described in [28 29]
Because the measurement model is non-linear we use an
extended Kalman lter
making use of the Jacobian of thenon-linear HiBall measurement model to transform thecovariance of the Kalman lter While this approach doesnot preserve the Gaussian nature of the covariance it hasbeen used successfully in countless applications since theintroduction of the (linear) Kalman lter Based onobservations of the statistics of the HiBall lter residualsthe approach also appears to work well for the HiBall
At each estimation cycle the next of the 26 possible viewsis chosen randomly Four points corresponding to thecorners of the LEPD sensor associated with that view arethen projected into the world using the 3 by 4 viewingmatrix for that view along with the current estimates for theHiBall position and orientation This projection which isthe inverse of the measurement relationship describedabove results in four rays extending from the sensor into theworld The intersection of these rays and the approximateplane of the Ceiling determines a 2D bounding box on theCeiling within which are the candidate LEDs for thecurrent camera view One of the candidate LEDs is thenchosen in a least-recently-used fashion to ensure a diversityof constraints
Once a particular view and LED have been chosen in thisfashion the CIB ( section 43 ) is instructed to ash the LEDand take a measurement as described in section 52 Thissingle measurement is compared with a prediction obtainedusing (2) and the difference or residual
is used to update thelter state and covariances using the Kalman gain
matrix
The Kalman gain is computed as a combination of thecurrent lter covariance the measurement noise variance(section 621) and the Jacobian of the measurement model
A more detailed discussion of the HiBall Kalman lter andthe SCAAT approach is beyond the scope of this paper Foradditional information see [ 28 29]
x t ( )
t d
d x t ( ) 0 1
0 0
x1 t ( )
x2 t ( )
0
microu t ( )+=
x2 t ( )t d
d x1 t ( )=
u t ( )micro
micro
t δ t +
x t δ t +( ) 1 δ t 0 1
x t ( )=
uv
c x c z frasl
c y c z frasl =
c x
c y
c z
VRT l xyz x xyzndash( )=
V l R
R rot_from_quat xq( )=
872019 1011465550
httpslidepdfcomreaderfull1011465550 611
University College London December 20-22 1999 S YMPOSIUM ON VIRTUAL REALITY SOFTWARE AND TECHNOLOGY 1999
The HiBall Tracker High-Performance Wide-Area Tracking for Virtual and Augmented Environments 6
54 On-line LED AutocalibrationAlong with the benet of simplicity and speed the SCAATapproach offers the additional capability of being able toestimate the 3D positions of the LEDs in the worldconcurrently with the pose of the HiBall on line in realtime This capability is a tremendous benet in terms of theaccuracy and noise characteristics of the estimates AccurateLED position estimates is so important that prior to theintroduction of the SCAAT approach a specialized off-lineapproach was developed to address the problem [13]
The method we use for autocalibration involves effectivelydening a distinct Kalman lter for each and every LEDSpecically for each LED we maintain the state (estimateof the 3D position) and a 3x3 Kalman lter covariance Atthe beginning of each estimation cycle we augment theHiBall Kalman lter described in section 53 with theappropriate individual LED lter In particular we add thethree elements of to the state and similarly augmentthe Kalman lter error covariance matrix with that of theLED lter We then follow the normal steps outlined in
section 53 with the result being that the LED portion of thelter state and covariance is updated in accordance with themeasurement residual At the end of the cycle we extract theLED portions of the state and covariance from the lter andsave them externally The effect is that as the system isbeing used it continually renes its estimates of the LEDpositions thereby continually improving its estimates of theHiBall pose Again for additional information see [ 28 29]
55 Initialization and Re-AcquisitionThe recursive nature of the Kalman lter and hence themethod described in section 53 typically requires that thelter be initialized with a known state and correspondingcovariance before steady-state operation can begin This is
true for the HiBall system as convergence cannot beassured from a randomly chosen state Such an initializationmust take place prior to any tracking session but also uponthe (rare) occasion when the lter diverges and ldquoloses lockrdquoas a result of blocked sensor views for example
Acquiring lock is complicated by the fact that each LEPDsees a number of different widely separated viewsTherefore detecting a beacon provides at best an ambiguousset of potential beacon directions in HiBall coordinatesMoreover before establishing lock no assumptions can bemade to limit the search space of visible beacons As such arelatively slow brute-force algorithm is used to acquire lock
We begin with an exhaustive beacon scan of sufciently ne
granularity to ensure that the central primary eld of view isnot missed For the present Ceiling we ash every 13thLED in sequence and look for it with the central LEPDuntil we get a hit Then a sufciently large patch of beaconscentered on the hit is sampled to ensure that several of theviews of the central LEPD will be hit The elds of view arethen disambiguated by estimating the yaw of the HiBallfrom the initial hits and nally more selectivemeasurements are made to rene the estimate sufciently toswitch into tracking mode
6 RESULTSThree days after the individual pieces of hardware wereshown to be functioning properly we demonstrated acomplete working system After months of subsequenttuning and optimization the system continues to performboth qualitatively and quantitatively as well or in somerespects better than we had anticipated ( section 61 ) Thearticulation of this success is not meant to be self-congratulatory but to give credit to the extensive and carefulmodeling and simulation performed prior to assembly(section 62 ) In fact the Kalman lter parameters found bythe optimization procedure described in section 622 wereand continue to be used directly in the working systemLikewise much of the software written for the originalsimulations continues to be used in the working system
61 On-Line OperationThe HiBall system is in daily use as a tool for education andresearch For example it was recently used by Martin Usohet al to perform Virtual Reality experiments comparingvirtual ldquoyingrdquo walking in place and real walking [ 22]The researchers used the HiBall system to demonstrate thatas a mode of locomotion real walking is simpler morestraightforward and more natural than both virtual yingand walking in place Some images from these experimentsare shown in color plate image Welch 3 The unprecedentedcombination of large working volume and high performanceof the HiBall system led the researchers to claim that therewas literally nowhere else that they could havemeaningfully performed the experiments Other researcherswho visit and try the HiBall system almost always ask howthey can get one We are working on a means to make thathappen in selected laboratories
Strangely enough in some sense it is amazing that thesystem works at all In particular you effectively have toknow where the HiBall is for it to work at all The reason isthat as a result of a mechanical design trade-off each sensoreld of view is less than six degrees A small mistake couldquickly cause problems The focal length is set by the sizeof the sensor housing which is set by the diameter of thesensors themselves Energetics enters in also because youhave to have light collecting area And yet the system isamazingly robust users can dance around crawl on theoor lean over even wave their hands in front of thesensors and the system does not lose lock During onesession we were using the HiBall as a 3D digitization probe a HiBall on the end of a pencil-shaped berglass wand as
l
l x
Figure 5 The HiBall being used by Kevin Arthur to trackthe head and hand for the presence experiments in [ 22]
872019 1011465550
httpslidepdfcomreaderfull1011465550 711
University College London December 20-22 1999 S YMPOSIUM ON VIRTUAL REALITY SOFTWARE AND TECHNOLOGY 1999
The HiBall Tracker High-Performance Wide-Area Tracking for Virtual and Augmented Environments 7
shown in Figure 6 We laid the probe down on a table at onepoint and were amazed to later notice that it was stilltracking even though it could only ldquoseerdquo 3 or 4 LEDs nearthe edge of the Ceiling We picked the probe up andcontinued using it It never missed a beat
The simplest quantitative measurement of tracking systemperformance is standard deviation of its estimates when it isheld stationary With a tracker as sensitive as the HiBall it isimportant to be certain that it really is stationary The raisedoor in our laboratory allows motion for example when aperson walks by that is larger than the expected error in theHiBall We made careful measurements by resting thesupport for the HiBall on the concrete sub-oor in ourlaboratory The standard deviation of the error on the HiBallestimates while stationary is about 02 millimeters and 003degrees The distribution of the errors t a normaldistribution quite well
To make measurements of the noise when the HiBall is inmotion we rely on the assumption that almost all of thesignal resulting from normal human motion is at frequenciesbelow 2 Hz We use Welchrsquos method [ 31] to isolate thesignal energy above 2 Hz (Since the SCAAT method isrunning at about 2000 Hz it is reasonable to assume thatmost of the noise energy is above 2 Hz) This measurementproduces results that are comparable to those made with theHiBall stationary except at positions for which there arevery few LEDs visible in only one or two views In thesepositions near the edge of the ceiling the geometry of theconstraints results in amplication of errors For nearly allof the working volume of the tracker the standard-deviationof the noise on measurements while the HiBall is still ormoving is 02 millimeters and 003 degrees
In July of 1999 two Boeing Corporation engineers David
Himmel and David Princehouse visited our laboratory toassess the accuracy of the HiBall system in tracking theposition and orientation of a hand-held pneumatic drill Theengineers are interested in improving the accuracy of holesdrilled by hand during the aircraft manufacturing processTo asses the accuracy of the HiBall system they broughtwith them an aluminum ldquocouponrdquo (plate) with holes pre-drilled at locations accurate to 11000 of an inch In a set of carefully controlled experiments we together measured anaverage positioning error of 12 millimeter (201000 inch) atthe tip of the HiBall probe mentioned above and shown inthe left image of Figure 6 Unfortunately at the time wedecided not to position the experimental platform on theconcrete sub-oor but for expediency to live with the
additional uncertainty of placing it on the raised oorHowever we are encouraged by the results and are excitedabout the possibility that the HiBall system has uses beyondVirtual Reality tracking Some images from the Boeingexperiments are shown in Figure 6 and in color plate imageWelch 3
62 Off-Line Simulation and ModelingThe design of the HiBall system made substantial use of simulation in some domains to a very detailed level of
abstraction For example Zemax [ 32] was used extensivelyin the design and optimization of the optical designincluding the design of the lter glass lenses and geometryof the optical component layout AutoCADtrade was used todesign specify and t-check the HiBall body mechanicals
to visualize the physical design and to transmit the designto our collaborators at the University of Utah for fabricationby the Alpha 1 System [ 1 21] A custom ray-tracing systemwas built by Stefan Gottschalk (UNC) for the purpose of evaluating the optical behavior and energetics of theprimary secondary and tertiary elds of view the resultswere used by the noise model developed by Chi [ 8] asdescribed in the next section
In addition a complete simulator of the system was writtenin C++ This simulator discussed further in section 622 was used to evaluate the speed accuracy and robustness of the system In addition it was used to ldquotunerdquo the Kalmanlter for realistic motion dynamics This simulatorcontinues to be used to evaluate mechanical optical andalgorithmic alternatives
621 HiBall Measurement Noise ModelSignal-to-noise performance is a prime determiner of bothaccuracy and speed of the system so an in-depth study [ 8]was performed to develop a detailed noise model accountingfor properties of the LED the LEPD (sensor) the opticalsystem the physical distance and pose the electronics andthe dark-light-dark integrations described in section 52 The predominant noise source is shot noise with Johnsonnoise in the sheet resistivity of the LEPD surfaces being thenext most signicant Careful measurements made in thelaboratory with the actual devices yielded results that werealmost identical to those predicted by the sophisticatedmodel in [ 8] A simplied version of this model is used inthe real system to predict the measurement noise for theKalman lter ( section 53 ) when the automatic gain controldescribed in section 52 is not in use
622 Complete System SimulationsTo produce realistic data for developing and tuning ouralgorithms we collected position and orientation reportsfrom our rst generation ceiling tracker at its 70 Hzmaximum report rate These data were recorded both from
Figure 6 Left a Boeing engineer uses our 3D digitization probe (HiBall on a pencil-shaped fiberglass rod) to mea-sure the pre-drilled holes in their aluminum couponRight the HiBall is mounted on a hand-held pneumaticdrill for additional testing and measurements
872019 1011465550
httpslidepdfcomreaderfull1011465550 811
University College London December 20-22 1999 S YMPOSIUM ON VIRTUAL REALITY SOFTWARE AND TECHNOLOGY 1999
The HiBall Tracker High-Performance Wide-Area Tracking for Virtual and Augmented Environments 8
naive users visiting our monthly ldquodemo daysrdquo and fromexperienced users in our labs Based on our previousresearch [5] we ltered the raw ceiling data with a non-causal zero-phase-shift low-pass lter to eliminate energyabove 2 Hz The output of the low-pass ltering was then re-sampled at whatever rate we wanted to run the simulatedtracker usually 1000 Hz For the purposes of our
simulations these paths were considered to be a perfectrepresentation of the userrsquos motion Tracking error wasdetermined by comparing this input ldquotruthrdquo to the estimateproduced by the tracker
The simulator reads camera models describing the 26 viewsthe sensor noise parameters the LED positions and theirexpected error and the motion path described above Beforebeginning the simulation the LED positions are perturbedfrom their ideal positions by adding normally distributederror to each axis Then for each simulated cycle of operation the ldquotruerdquo position and orientation are updatedusing the input motion path Next a view is chosen and avisible LED within that view is selected and the image-
plane coordinates of the LED on the chosen sensor arecomputed using the camera model for the view and the LEDas described in section 53 These sensor coordinates arethen perturbed based on the sensor noise model(section 621) using the distance and angle to the LEDNow these noise corrupted sensor readings are fed to theSCAAT lter to produce an updated position estimate Theposition estimate is compared to the true position to producea scalar error metric described next
The error metric we used combines the error in position andorientation in a way that relates to the effects of tracker erroron a HMD user Imagine points arrayed around the user atsome xed distance We compute two sets of coordinates forthese points the true position using the true pose and theirestimated position using the estimated pose The errormetric is then the sum of the distances between the true andestimated positions of these points By adjusting thedistance of the points from the user we can control therelative importance of the orientation and the position errorin the combined error metric If the distance is small thenthe position error is weighted most heavily if the distance islarge then the orientation error is weighted most heavilyOur single error metric for the entire run is the square-rootof the sum of the squares of all the distances
Determining the magnitude of the parameters which controlthe SCAAT Kalman lter is called tuning We used Powellrsquosmethod [ 19] to minimize the above error metric Starting
with a set of parameters we ran the simulator over a fullmotion run to determine the total error for the run Then theoptimizer made a small adjustment to the parameters andthe process was repeated These runs required hours of computer time and some skill (and luck) in choosing theinitial parameters Of course it was important to choosemotion paths that were representative of expected usermotion For example a run in which the user is very stillwould result in very different tuning from a run in which theuser moves very vigorously
7 FUTURE WORKAt the moment we are investigating the use of a multi-modalor multiple-model Kalman lter framework [ 6 7] Thereason is because the current lter form ( section 53 ) andtuning values ( section 622) are a compromise between theresponsiveness desired for high dynamics and the heavyltering desired for smooth estimates during very slow or nomotion As it stands the system is almost smooth enoughfor open-loop Augmented Reality applications such ascomputer-assisted medical procedures The problem is thatwhen a user attempts to sit very still for example to align aneedle with a tumor for a biopsy even the small noise of oursystem results in visually-noticeable jitter A multiple-model implementation of the HiBall should be ableautomatically continuously and smoothly choose betweenone Kalman lter tuned for high dynamics and anothertuned for little or no motion We have this working insimulation but not yet implemented
As mentioned in section 43 the system was designed tosupport wireless communication between the HiBall and the
CIB without signicant modication or added informationoverhead However because commercial head-mounteddisplays are themselves tethered at this time we have feltlittle incentive to actually implement a wireless version of the system As it turns out our users are becomingincreasingly frustrated by the cumbersome cabling that youmust drag with you when walking around our laboratory Assuch we are now beginning work on a completely wirelessHiBall and display system
Beyond improving the existing system we are anxious tohead down a path of research and development that will leadto systems with reduced dependency on the laboratoryinfrastructure For example our current Ceiling paneldesign with 32 LEDs per panel provides far more densecoverage than we believe is necessary The density of LEDsis a result of design based on the original sensor xtureshow in Figure 1 and the original multiple-constraintalgorithm [ 4] Furthermore we believe that we couldachieve similar performance using a version of the HiBallthat has a small number of wide eld of view cameras
While we are very happy with our ability to autocalibratethe LED positions concurrently while tracking ( section 54 )we would eventually like to take this one step further andbegin with no estimates of beacon locations and possibly nonotion of individual beacon identity We have done somepreliminary investigation and simulation that indicates thisshould be possible Such capability could drastically reducethe cost of the system and provide immense exibilityFinally we believe that by leveraging the knowledge gainedfrom successful work in the laboratory it may some day bepossible to achieve similar performance with no explicitinfrastructure anywhere in a building or even outdoors Aparticular approach that we are interested in pursuing is thehybrid approach presented in [27 ] It is our belief that nosingle technology or fundamental modality can provide thenecessary performance in a consistent and robust fashion
872019 1011465550
httpslidepdfcomreaderfull1011465550 911
University College London December 20-22 1999 S YMPOSIUM ON VIRTUAL REALITY SOFTWARE AND TECHNOLOGY 1999
The HiBall Tracker High-Performance Wide-Area Tracking for Virtual and Augmented Environments 9
across the necessary range of dynamics for head-mounteddisplays We believe that the solution must lie in the cleverand careful combination of complementary technologies
8 ACKNOWLEDGEMENTSWe want to acknowledge several current Tracker Projectmembers including (alphabetically) Matthew Cutts Henry
Fuchs Jeffrey Juliano Benjamin Lok John ThomasNicholas Vallidis Hans Weber and Mary Whitton We alsowant to thank several past members and contributors Inparticular we want to acknowledge the many contributionsof past members Philip Winston Scott Williams and PawanKumar We also want to acknowledge the many earlycontributions of previous members Ronald Azuma StefanGottschalk and Jih-Fang Wang [ 25] and the contributionsof Al Barr (California Institute of Technology) and JohnldquoSpikerdquo Hughes (Brown University) to the original off-lineLED calibration work [ 13] that led to the simpler Ceilingpanels shown in Figure 3 Finally we want to acknowledgeour many collaborators in the NSF Science and TechnologyCenter for Computer Graphics and Scientic Visualization
specically our collaborators in mechanical design andfabrication at the University of Utah Rich Riesenfeld SamDrake and Russ Fish
This work was supported in part by DARPAETO contractnumber DABT 63-93-C-0048 ldquoEnabling Technologies andApplication Demonstrations for Synthetic EnvironmentsrdquoPrinciple Investigators Frederick P Brooks Jr and HenryFuchs (University of North Carolina at Chapel Hill) and bythe National Science Foundation Cooperative Agreementno ASC-8920219 ldquoScience and Technology Center forComputer Graphics and Scientic Visualizationrdquo CenterDirector Andy van Dam (Brown University) PrincipleInvestigators Andy van Dam Al Barr (California Institute of
Technology) Don Greenberg (Cornell University) HenryFuchs (University of North Carolina at Chapel Hill) RichRiesenfeld (University of Utah)
9 REFERENCES[1] ldquoAlpha 1 Publicationsrdquo University of Utah Department
of Computer Science [Cited May 28 1999] Availablefrom httpwwwcsutaheduprojectsalpha1 a1_publicationshtml
[2] Azarbayejani Ali and Alex Pentland June 1995ldquoRecursive Estimation of Motion Structure and FocalLengthrdquo IEEE Trans Pattern Analysis and Machine
Intelligence June 1995 17(6)[3] Azuma Ronald 1995 ldquoPredictive Tracking for Aug-
mented Realityrdquo PhD dissertation University of NorthCarolina at Chapel Hill TR95-007
[4] Azuma Ronald and Mark Ward 1991 ldquoSpace-Resec-tion by Collinearity Mathematics Behind the OpticalCeiling Head-Trackerrdquo UNC Chapel Hill Departmentof Computer Science technical report TR 91-048(November 1991)
[5] Azuma Ronald and Gary Bishop 1995 ldquoA Frequency-Domain Analysis of Head-Motion Predictionrdquo Pro-ceedings of SIGGRAPH 95 (Los Angeles CA) August6-11 1995 pp 401-408
[6] Bar-Shalom Yaakov and Xiao-Rong Li 1993 Estima-tion and Tracking Principles Techniques and Soft-ware Artec House Inc
[7] Brown RG and P Y C Hwang 1992 Introduction to Random Signals and Applied Kalman Filtering 2ndEdition John Wiley amp Sons Inc
[8] Chi Vernon L ldquoNoise Model and Performance Analy-sis Of Outward-looking Optical Trackers Using LateralEffect Photo Diodesrdquo TR95-012 Department of Com-puter Science UNC at Chapel Hill April 1995
[9] Emura S and S Tachi 1994 ldquoSensor Fusion basedMeasurement of Human Head Motionrdquo Proceedings3rd IEEE International Workshop on Robot and HumanCommunication RO-MANrsquo94 NAGOYA (Nagoya Uni-versity Nagoya Japan)
[10]Foxlin Eric 1993 ldquoInertial Head Trackingrdquo MasterrsquosThesis Electrical Engineering and Computer ScienceMassachusetts Institute of Technology
[11]Foxlin Eric Michael Harrington George Pfeifer 1998ldquoConstellationtrade A Wide-Range Wireless Motion-Tracking System for Augmented Reality and Virtual SetApplicationsrdquo SIGGRAPH 98 Conference Proceed-ings Annual Conference Series ACM SIGGRAPHJuly 19-24 1998 Orlando FL
[12]Gelb A 1974 Applied Optimal Estimation MIT PressCambridge MA
[13]Gottschalk Stefan and John F Hughes 1993 ldquoAuto-calibration for Virtual Environments Tracking Hard-warerdquo Proceedings of Annual Conference Series ACMSIGGRAPH 93 (Anaheim CA 1993)
[14] Jacobs O L R 1993 Introduction to Control Theory 2nd Edition Oxford University Press
[15]Kalman RE 1960 ldquoA New Approach to Linear Filter-ing and Prediction Problemsrdquo Transaction of theASMEmdashJournal of Basic Engineering pp 35-45(March 1960)
[16]Lewis Richard 1986 Optimal Estimation with an Introduction to Stochastic Control Theory John Wileyamp Sons Inc
[17]Maybeck Peter S 1979 Stochastic Models Estima-tion and Control Volume 1 Academic Press Inc
[18]Mazuryk Thomas and Michael Gervautz 1995 ldquoTwo-Step Prediction and Image Deection for Exact HeadTracking in Virtual Environmentsrdquo EUROGRAPHICSlsquo95 Vol 14 No 3 pp 30-41
[19] Press William H Brian P Flannery Saul A Teukolskyand William T Vetterling 1990 Numerical Recipes inC The Art of Scientic Computing Cambridge Univer-sity Press
872019 1011465550
httpslidepdfcomreaderfull1011465550 1011
University College London December 20-22 1999 S YMPOSIUM ON VIRTUAL REALITY SOFTWARE AND TECHNOLOGY 1999
The HiBall Tracker High-Performance Wide-Area Tracking for Virtual and Augmented Environments 10
[20]Sorenson HW 1970 ldquoLeast-Squares estimation fromGauss to Kalmanrdquo IEEE Spectrum Vol 7 pp 63-68July 1970
[21]Thomas S W ldquoThe Alpha_1 Computer-Aided Geo-metric Design System in the Unix Environmentrdquo inProc Computer Graphics and Unix Workshop (KatzL ed) USENIX Organization Dec 1984
[22]Usoh Martin Kevin Arthur Mary C Whitton Rui Bas-tos Anthony Steed Mel Slater Frederick P Brooks JrldquoWalking gt Walking-in-Place gt Flying in Virtual Envi-ronmentsrdquo to appear in SIGGRAPH 99 ConferenceProceedings Annual Conference Series ACM SIG-GRAPH August 1999 Los Angeles CA
[23]Van Pabst J V L and Paul F C Krekel ldquoMulti SensorData Fusion of Points Line Segments and Surface Seg-ments in 3D Spacerdquo TNO Physics and Electronics Lab-oratory The Hague The Netherlands [cited 19November 1995] Available from httpwwwbartnl ~lawickindexhtml
[24]Wang Jih-fang Ronald Azuma Gary Bishop VernonChi John Eyles Henry Fuchs ldquoTracking a Head-mounted Display in a Room-sized environment withHead-mounted Camerasrdquo Proceedings of the SPIE1990 Technical Symposium on Optical Engineeringand Photonics in Aerospace Sensing Orlando Florida16-20 April 1990
[25]Wang Jih-fang Vernon Chi Henry Fuchs ldquoA Real-time Optical 3D Tracker for Head-mounted DisplaySystemsrdquo Proceedings of the 1990 Symposium onInteractive 3D Graphics Snowbird UT 25-28 March1990 in Computer Graphics Vol 24 No 2 March1990 pp 205-215
[26]Ward Mark Ronald Azuma Robert Bennett StefanGottschalk and Henry Fuchs 1992 ldquoA DemonstratedOptical Tracker With Scalable Work Area for Head-Mounted Display Systemsrdquo Proceedings of 1992 Sym-
posium on Interactive 3D Graphics (Cambridge MA29 March - 1 April 1992) pp 43-52
[27]Welch Gregory 1995 ldquoHybrid Self-Tracker An Iner-tialOptical Hybrid Three-Dimensional Tracking Sys-temrdquo University of North Carolina Department of Computer Science TR 95-048
[28]Welch Gregory and Gary Bishop 1997 ldquoSCAATIncremental Tracking with Incomplete InformationrdquoSIGGRAPH 97 Conference Proceedings Annual Con-ference Series ACM SIGGRAPH August 1997 LosAngeles CA
[29] Welch Gregory 1996 ldquoSCAAT Incremental Trackingwith Incomplete Informationrdquo University of NorthCarolina at Chapel Hill doctoral dissertation TechnicalReport TR 96-051
[30]Welch Gregory and Gary Bishop 1995 ldquoAn Introduc-tion to the Kalman Filterrdquo University of North Caro-lina Department of Computer Science TR 95-041
[31]Welch PD ldquoThe Use of Fast Fourier Transform for theEstimation of Power Spectra A Method Based on TimeAveraging Over Short Modied Periodogramsrdquo IEEETrans Audio Electroacoust Vol AU-15 (June 1967)pp 70-73
[32]ZEMAX Optical Design Program Users Guide Ver-sion 45 Focus Software Inc Tucson AZ 1995
872019 1011465550
httpslidepdfcomreaderfull1011465550 1111
The HiBall Tracker High-Performance Wide-Area Tracking for Virtual and Augmented Environments COLOR PLATE
University College London December 20-22 1999 S YMPOSIUM ON VIRTUAL REALITY SOFTWARE AND TECHNOLOGY 1999
a b c
Approximately 20 cm
Welch 1 The left image (a) shows the head-mounted display and bulky sensor fixture from the original system The sensorsare colorized in red The middle image (b) shows a close-up of the new self-contained HiBall with lenses and part of thecover removed The right image (c) shows graduate student Pawan Kumar using the new HiBall system
a
b
c
Welch 2 Image (a) shows an unassembled HiBall printed circuit board The board has two separate large round sectionsfor analog and digital circuits and six small round sections for sensors These rigid PCB sections are connected by flexibletrace segments to eliminate connectors After populating the board the pieces are cut away from the rectangular board andfolded into the HiBall as shown Image (b) shows the Ceiling panel PC board from Figure 3 and (c) the CIB from Figure 4
a
d
b
e
c
f
g
h
Welch 3 The images (a)-(f) show the HiBall system in use by Usoh and Martin and their colleagues for experiments in [ 22]Images (a)-(b) show the HiBall being used to track the head and hand (c) shows a test subject walking under the HiBallCeiling (d) is an overview of the virtual world (e)-(f) are sample test subject views Image (g) shows the HiBall mounted ona hand-held pneumatic drill for experiments with Boeing engineers (h) shows a HiBall-based drill-guiding application
COLOR PLATE
872019 1011465550
httpslidepdfcomreaderfull1011465550 211
University College London December 20-22 1999 S
YMPOSIUM
ON
V
IRTUAL
R
EALITY
S
OFTWARE
AND
T
ECHNOLOGY
1999
The HiBall Tracker High-Performance Wide-Area Tracking for Virtual and Augmented Environments 2
As a result of these improvements the HiBall Tracker cangenerate over 2000 estimates per second with less than onemillisecond of latency The system exhibits sub-millimetertranslation noise and similar measured accuracy as well asless than 003 degrees of orientation noise with similarmeasured accuracy The weight of the user-worn HiBall isabout 300 grams making it lighter than just one camera
in
the 1991 system The working volume of the current systemis greater than 90 cubic meters (greater than 45 squaremeters of oor space greater than 2 meters of heightvariation) This area can be expanded by adding more tilesor by using checkerboard congurations which spread tilesover a larger area
3 SYSTEM OVERVIEW
The HiBall tracker system ( Figure 2) provides six-degree-of freedom tracking of devices in real time An outward-looking infrared-sensing subsystem called a HiBall(Figure 1 lower-right) is mechanically xed to each deviceto be tracked The HiBalls view an environment containinga subsystem of xed-location infrared beacons which wecall the Ceiling At the present time the beacons are in fact
entirely located in the ceiling of our laboratory but could aswell be located in walls or other arbitrary xed locationsThese subsystems are coordinated by a Ceiling-HiBallInterface Board (CIB) which provides communication andsynchronization functions between the host computer andthe attached subsystems Each HiBall has 26 narrow (lessthan 6 degree) views distributed over a large solid angleBeacons are selectively ashed in a sequence such that theyare seen by many different elds of view of each HiBallInitial acquisition is performed using a brute force searchthrough beacon space but once initial lock is made theselection of beacons to ash is tailored to the elds of viewof the HiBalls Tracking is maintained using a Kalman-lter-based prediction-correction algorithm known as
SCAAT This technique has been further extended toprovide self-calibration of the Ceiling on-line with thetracking of the attached HiBalls
4 SYSTEM COMPONENTS
41 The Ceiling
The Ceiling architecture provides for ashing only onebeacon at a time The beacons may be ashed in anysequence but protection is provided in hardware and
software to prevent exceeding the duty cycle of the infrared(IR) light emitting diodes (LEDs) Thus no single LED canbe ashed again until it has had sufcient time to cool LEDdriving current and therefore emitted light level is selectablefor use by a software automatic gain control (AGC) functionas described in section 52
As presently implemented the beacons are packaged inmodules physically 61 centimeters square to drop into astandard false ceiling grid ( Figure 3 and color plate imageWelch 2) Each module contains 32 LEDs in four stripsresulting in a rectangular pattern with periods of 76 and152 centimeters respectively We currently have enoughpanels to cover an area approximately 55 by 85 meters fora total of approximately 3000 LEDs The LEDs areSiemens SFH-487P GaAs diodes which provide both a wideangle radiation pattern and high peak power emitting at acenter wavelength of 880 nm in the near IR These devicescan be pulsed up to 20 Amps for a maximum duration of 200 with a 150 (onoff) duty cycle
The Ceiling panel modules are daisy-chain connected withmodule selection encoding being position rather than devicedependent Operational commands are presented to the rst
module of the daisy chain At each module if the moduleselect code is zero the module decodes and executes theoperation else it decrements the module select code andpasses it along to the next module Upon decoding aparticular LED is selected a drive level is established andthe LED is ashed for up to 200 (in 20 increments)
42 The HiBall
As can be seen in Figure 1 and color plate image Welch 1the HiBall is a hollow ball having dodecahedral symmetrywith lenses in the upper six faces and lateral effect photodiodes (LEPDs) on the insides of the opposing six lowerfaces This immediately gives six primary elds of view orcamera systems which share the same internal air space and
whose adjacent directions of view are uniformly separatedby 57 degrees
While the original intent of the shared internal air space wasto save space we subsequently realized that light enteringany lens sufciently off axis can be seen by an adjacentLEPD As such ve secondary elds of view are providedby the top or central lens and three secondary elds of vieware provided by the ve other lenses Overall this provides26 elds of view which are used to sense widely separatedgroups of beacons in the environment While these extra
Ceiling (with LEDs)
Ceiling-HiBallInterface Board (CIB)
HiBall(s)
Figure 2 A block diagram of the HiBall tracking system
Figure 3 Left Bishop lifts some Ceiling panels Right anindividual Ceiling panel module showing the main PCboard with four LED strips (eight LEDs per strip)
micros
micros micros
872019 1011465550
httpslidepdfcomreaderfull1011465550 311
University College London December 20-22 1999 S
YMPOSIUM
ON
V
IRTUAL
R
EALITY
S
OFTWARE
AND
T
ECHNOLOGY
1999
The HiBall Tracker High-Performance Wide-Area Tracking for Virtual and Augmented Environments 3
views complicate the initialization of the Kalman lter asdescribed in section 55 they turn out to be of great benetduring steady-state tracking by effectively increasing theoverall HiBall eld of view without sacricing resolution
The lenses are simple plano-convex xed focus lenses IRltering is provided by fabricating the lenses themselvesfrom RG-780 Schott glass lter material which is opaque tobetter than 0001 for all visible wavelengths andtransmissive to better than 99 for IR wavelengths longerthan 830 nm The longwave ltering limit is provided by theDLS-4 LEPD silicon photodetector (UDT Sensors Inc)with peak responsivity at 950 nm but essentially blind above1150 nm
The LEPDs themselves are not imaging devices rather theydetect the centroid of the luminous ux incident on thedetector The x-position of the centroid determines the ratioof two output currents while the y-position determines theratio of two other output currents The total output current of each pair are commensurate and proportional to the totalincident ux Consequently focus is not an issue so thesimple xed-focus lenses work well over a range of beacondistances from about half a meter to innity
Finally the LEPDs and associated analog and digitalelectronic components are mounted on a custom rigid-exprinted circuit board as shown in color plate image Welch 2This arrangement makes efcient use of the internal HiBallvolume while maintaining isolation between analog anddigital circuitry and increasing reliability by alleviating theneed for inter-component mechanical connectors
43 The Ceiling-HiBall Interface Board
The Ceiling-HiBall Interface Board (CIB) shown below inFigure 4 provides communication and synchronization
between a host personal computer the Ceiling ( section 41 )and the HiBall ( section 42 )
The CIB has four Ceiling ports allowing interleaving of ceiling panels for up to four simultaneous led ashes andorhigher Ceiling bandwidth for more simultaneous hiballusage (The Ceiling bandwidth is inherently limited by LEDcurrent restrictions as described in section 41 but this canbe increased by spatially multiplexing the Ceiling tiles) TheCIB has two tether interfaces that can communicate with upto four daisy-chained hiballs each The full-duplexcommunication with the hiballs uses a modulation scheme(BPSK) allowing future wireless operation The interface
from the CIB to the host PC is the stable IEEE1284Cextended parallel port (EPP) standard
The CIB comprises analog drive and receive components aswell as digital logic components The digital componentsimplement store and forward in both directions andsynchronize the timing of the LED ldquoonrdquo interval within theHiBall dark-light-dark intervals The protocol supports full-duplex ow control The data are arranged into packetscontaining error detection to insure data quality
5 METHODS
51 Bench-Top (Off-Line) HiBall Calibration
After each HiBall is assembled we perform an off-linecalibration to determine the correspondence between image-plane coordinates and rays in space This involves more than
just determining the view transform for each of the 26camera (sensor) views Non-linearities in the silicon sensorand distortions in the lens (eg spherical aberration) causesignicant deviations from a simple pin-hole camera modelWe dealt with all of these issues through the use of a two-part camera model The rst part is a standard pin-holecamera represented by a 3x4 matrix The second part is atable mapping real image-plane coordinates to ideal image-plane coordinates
Both parts of the camera model are determined using acalibration procedure that relies on a goniometer (an angularpositioning system) of our own design This device consistsof two servo motors mounted together such that one motorprovides rotation about the vertical axis while the secondmotor provides rotation about an axis orthogonal to verticalAn important characteristic of the goniometer is that therotational axes of the two motors intersect at a point at thecenter of the HiBall optical sphere this point is dened as
the origin of the HiBall (It is this origin that provides thereference for the HiBall state during run time as described insection 53 ) The rotational positioning motors were rated toprovide 20 arc-second precision we further calibrated themusing a surveying grade theodolite an angle measuringsystem to 6 arc seconds
In order to determine the mapping between sensor image-plane coordinates and three-space rays we use a single LEDmounted at a xed location in the laboratory such that it iscentered in the view directly out of the top lens of theHiBall This ray denes the Z or up axis for the HiBallcoordinate system We sample other rays by rotating thegoniometer motors under computer control We sample each
view with rays spaced about every 6 minutes of arcthroughout the eld of view We repeat each measurement100 times in order to reduce the effects of noise on theindividual measurements and to estimate the standarddeviation of the measurements
Given the tables of approximately 2500 measurements foreach view we rst determine a 3 by 4 view matrix usingstandard linear least-squares techniques Then we determinethe deviation of each measured point from that predicted bythe ideal linear model These deviations are re-sampled into
Figure 4 The Ceiling-HiBall Interface Board (CIB) TheCIB shown is 19 inches the newest revision is 14 inches
872019 1011465550
httpslidepdfcomreaderfull1011465550 411
University College London December 20-22 1999 S
YMPOSIUM
ON
V
IRTUAL
R
EALITY
S
OFTWARE
AND
T
ECHNOLOGY
1999
The HiBall Tracker High-Performance Wide-Area Tracking for Virtual and Augmented Environments 4
a 25 by 25 grid indexed by sensor-plane coordinates using asimple scan conversion procedure and averaging Given ameasurement from a sensor at run time we convert it to anldquoidealrdquo measurement by subtracting a deviation bi-linearlyinterpolated from the nearest 4 entries in the table
52 On-Line HiBall Measurements
Upon receiving a command from the CIB ( section 43 )which is synchronized with a CIB command to the ceilingthe HiBall selects the specied LEPD and performs threemeasurements one before the beacon ashes one duringthe beacon ash and one after the beacon ash Known asldquodark-light-darkrdquo this technique is used to subtract out DCbias low frequency noise and background light from thebeacon signal
Each LEPD has four transimpedance ampliers the analogoutputs of which are multiplexed with those of the otherLEPDs then sampled held and converted by four 16-bitDelta-Sigma ADCs Multiple samples can be integratedinternally in the HiBall The digitized LEPD data areorganized into a packet for communication back to the CIBThe packets also contain information to assist in error-detection The communication protocol is simple and whilepresently implemented by wire the modulation scheme isamenable to a wireless implementation The present wiredimplementation allows multiple HiBalls to be daisy chainedso a single cable can support a user with multiple HiBalls
During run time we attempt to maximize the signal-to-noiseratio of the measurement with an automatic gain controlscheme For each LED we store a target signal strengthconstant We compute the LED current and number of integrations (of successive AD samples) by dividing thisstrength constant by the square of the distance to the LEDestimated from the current position estimate After a readingwe look at the strength of the actual measurement If it islarger than expected we reduce the gain if it is less thanexpected we increase the gain The increase and decreaseare implemented as on-line averages with scaling such thatthe gain constant decreases rapidly (to avoid overow) andincreases slowly Finally we use the measured signalstrength to estimate the noise on the signal using [ 8] andthen use this as the measurement noise estimate for theKalman lter ( section 53)
53 Recursive Pose Estimation (SCAAT)
The on-line measurements ( section 52 ) are used to estimatethe pose of the HiBall in real time on line The 1991 systemcollected a group of similar measurements for a variety of LEDs and sensors and then used a method of simultaneousnon-linear equations called Collinearity
[4] to estimate thepose of the sensor xture shown in Figure 1 (left) Therewas one equation for each measurement expressing theconstraint that a ray from the front principle point of thesensor lens to the LED must be collinear with a ray fromthe rear principle point to the intersection with the sensorEach estimate made use of a group of measurements(typically 20 or so) that together over-constrained thesolution
This multiple constraint
method had several drawbacksFirst it had a signicantly lower estimate rate due to theneed to collect multiple measurements per estimate Secondthe system of non-linear equations did not account for thefact that the sensor xture continued to move throughout thecollection of the sequence of measurements Instead themethod effectively assumes that the measurements were
taken simultaneously The violation of this simultaneityassumption
could introduce signicant error during evenmoderate motion Finally the method provided no means toidentify or handle unusually noisy individual measurementsThus a single erroneous measurement could cause anestimate to jump away from an otherwise smooth track
In contrast the approach we use with the new HiBall systemproduces tracker reports as each new measurement is maderather than waiting to form a complete collection of observations Because single measurements under-constrainthe mathematical solution we refer to the approach asSingle-Constraint-at-a-Time or SCAAT tracking [ 28 29]The key is that the single measurements provide some
information about the users state and thus can be used toincrementally improve a previous estimate Using a Kalmanlter [ 15] we intentionally
fuse measurements that do notindividually provide sufcient information incorporatingeach individual measurement immediately as it is obtainedWith this approach we are able to generate estimates morefrequently with less latency with improved accuracy andwe are able to effectively estimate the LED positions on-lineconcurrently while tracking the HiBall ( section 54 )
We use a Kalman lter a minimum variance stochasticestimator to estimate the HiBall state
ie the positionand orientation of the HiBall We use a Kalman lter in partbecause the sensor measurement noise and the typical usermotion dynamics can be modeled as normally-distributedrandom processes but also because we want an efcient on-line method of estimation A basic introduction to theKalman lter can be found in Chapter 1 of [ 17] while amore complete introductory discussion can be found in [ 20]which also contains some interesting historical narrativeMore extensive references can be found in [7 12 14 16 1730] The Kalman lter has been used previously to addresssimilar or related problems See for example [2 3 9 10 1823] and most recently [ 11 ]
The SCAAT approach in particular is described in greatdetail in [ 28 29] The benets of using this approach asopposed to a multiple-constraint approach such as [ 4] arealso discussed in [ 28 29] However one key benet warrants
discussion here There is a direct relationship between thecomplexity of the estimation algorithm the correspondingexecution time per estimation cycle and the character of HiBall motion between estimation cycles As thealgorithmic complexity increases the execution timeincreases which allows for signicant non-linear HiBallmotion between estimation cycles which in turn implies theneed for a more complex estimation algorithm
x
872019 1011465550
httpslidepdfcomreaderfull1011465550 511
University College London December 20-22 1999 S
YMPOSIUM
ON
V
IRTUAL
R
EALITY
S
OFTWARE
AND
T
ECHNOLOGY
1999
The HiBall Tracker High-Performance Wide-Area Tracking for Virtual and Augmented Environments 5
The SCAAT approach on the other hand is an attempt toreverse this cycle Because we intentionally use a singleconstraint per estimate the algorithmic complexity isdrastically reduced which reduces the execution time andhence the amount of motion between estimation cyclesBecause the amount of motion is limited we are able to use asimple dynamic (process) model in the Kalman lter which
further simplies the computations In short the simplicityof the approach means it can run very fast which means itcan produce estimates very rapidly with low noise
The Kalman lter requires both a model of the processdynamics and a model of the relationship between theprocess state and the available measurements In part due tothe simplicity of the SCAAT approach we are able to use avery simple process model We model the continuouschange in the HiBall state vector with the simpledifferential equation
where the scalar
is a normally-distributed scalar white noise processand the scalar represents the magnitude of the noise (thespectral density) A similar model with a distinct noisemagnitude is used for each of the six position andorientation elements The individual noise magnitudes aredetermined using an off-line simulation of the system and anon-linear optimization strategy that seeks to minimize the
variance between the estimate pose and a known motionpath (See section 622 ) The above differential equationrepresents a continuous integrated random walk or anintegrated Wiener
or Brownian-motion
process Specicallywe model each component of the linear and angular HiBallvelocities as random walks and use these assumingconstant inter-measurement velocity to estimate the sixelements of the HiBall pose at time as follows
(1)
In addition to a relatively simple process model the HiBallmeasurement model is relatively simple For any CeilingLED ( section 41 ) and HiBall camera view ( section 42 ) the2D sensor measurement can be modeled as
(2)
where
is the camera viewing matrix from section 51 the vectorcontains the position of the LED in the world and is a
rotation matrix constructed from the orientation quaternioncontained in the state vector
In practice we maintain the orientation of the HiBall as acombination of a global (external to the state) quaternionand a set of incremental angles as described in [28 29]
Because the measurement model is non-linear we use an
extended Kalman lter
making use of the Jacobian of thenon-linear HiBall measurement model to transform thecovariance of the Kalman lter While this approach doesnot preserve the Gaussian nature of the covariance it hasbeen used successfully in countless applications since theintroduction of the (linear) Kalman lter Based onobservations of the statistics of the HiBall lter residualsthe approach also appears to work well for the HiBall
At each estimation cycle the next of the 26 possible viewsis chosen randomly Four points corresponding to thecorners of the LEPD sensor associated with that view arethen projected into the world using the 3 by 4 viewingmatrix for that view along with the current estimates for theHiBall position and orientation This projection which isthe inverse of the measurement relationship describedabove results in four rays extending from the sensor into theworld The intersection of these rays and the approximateplane of the Ceiling determines a 2D bounding box on theCeiling within which are the candidate LEDs for thecurrent camera view One of the candidate LEDs is thenchosen in a least-recently-used fashion to ensure a diversityof constraints
Once a particular view and LED have been chosen in thisfashion the CIB ( section 43 ) is instructed to ash the LEDand take a measurement as described in section 52 Thissingle measurement is compared with a prediction obtainedusing (2) and the difference or residual
is used to update thelter state and covariances using the Kalman gain
matrix
The Kalman gain is computed as a combination of thecurrent lter covariance the measurement noise variance(section 621) and the Jacobian of the measurement model
A more detailed discussion of the HiBall Kalman lter andthe SCAAT approach is beyond the scope of this paper Foradditional information see [ 28 29]
x t ( )
t d
d x t ( ) 0 1
0 0
x1 t ( )
x2 t ( )
0
microu t ( )+=
x2 t ( )t d
d x1 t ( )=
u t ( )micro
micro
t δ t +
x t δ t +( ) 1 δ t 0 1
x t ( )=
uv
c x c z frasl
c y c z frasl =
c x
c y
c z
VRT l xyz x xyzndash( )=
V l R
R rot_from_quat xq( )=
872019 1011465550
httpslidepdfcomreaderfull1011465550 611
University College London December 20-22 1999 S YMPOSIUM ON VIRTUAL REALITY SOFTWARE AND TECHNOLOGY 1999
The HiBall Tracker High-Performance Wide-Area Tracking for Virtual and Augmented Environments 6
54 On-line LED AutocalibrationAlong with the benet of simplicity and speed the SCAATapproach offers the additional capability of being able toestimate the 3D positions of the LEDs in the worldconcurrently with the pose of the HiBall on line in realtime This capability is a tremendous benet in terms of theaccuracy and noise characteristics of the estimates AccurateLED position estimates is so important that prior to theintroduction of the SCAAT approach a specialized off-lineapproach was developed to address the problem [13]
The method we use for autocalibration involves effectivelydening a distinct Kalman lter for each and every LEDSpecically for each LED we maintain the state (estimateof the 3D position) and a 3x3 Kalman lter covariance Atthe beginning of each estimation cycle we augment theHiBall Kalman lter described in section 53 with theappropriate individual LED lter In particular we add thethree elements of to the state and similarly augmentthe Kalman lter error covariance matrix with that of theLED lter We then follow the normal steps outlined in
section 53 with the result being that the LED portion of thelter state and covariance is updated in accordance with themeasurement residual At the end of the cycle we extract theLED portions of the state and covariance from the lter andsave them externally The effect is that as the system isbeing used it continually renes its estimates of the LEDpositions thereby continually improving its estimates of theHiBall pose Again for additional information see [ 28 29]
55 Initialization and Re-AcquisitionThe recursive nature of the Kalman lter and hence themethod described in section 53 typically requires that thelter be initialized with a known state and correspondingcovariance before steady-state operation can begin This is
true for the HiBall system as convergence cannot beassured from a randomly chosen state Such an initializationmust take place prior to any tracking session but also uponthe (rare) occasion when the lter diverges and ldquoloses lockrdquoas a result of blocked sensor views for example
Acquiring lock is complicated by the fact that each LEPDsees a number of different widely separated viewsTherefore detecting a beacon provides at best an ambiguousset of potential beacon directions in HiBall coordinatesMoreover before establishing lock no assumptions can bemade to limit the search space of visible beacons As such arelatively slow brute-force algorithm is used to acquire lock
We begin with an exhaustive beacon scan of sufciently ne
granularity to ensure that the central primary eld of view isnot missed For the present Ceiling we ash every 13thLED in sequence and look for it with the central LEPDuntil we get a hit Then a sufciently large patch of beaconscentered on the hit is sampled to ensure that several of theviews of the central LEPD will be hit The elds of view arethen disambiguated by estimating the yaw of the HiBallfrom the initial hits and nally more selectivemeasurements are made to rene the estimate sufciently toswitch into tracking mode
6 RESULTSThree days after the individual pieces of hardware wereshown to be functioning properly we demonstrated acomplete working system After months of subsequenttuning and optimization the system continues to performboth qualitatively and quantitatively as well or in somerespects better than we had anticipated ( section 61 ) Thearticulation of this success is not meant to be self-congratulatory but to give credit to the extensive and carefulmodeling and simulation performed prior to assembly(section 62 ) In fact the Kalman lter parameters found bythe optimization procedure described in section 622 wereand continue to be used directly in the working systemLikewise much of the software written for the originalsimulations continues to be used in the working system
61 On-Line OperationThe HiBall system is in daily use as a tool for education andresearch For example it was recently used by Martin Usohet al to perform Virtual Reality experiments comparingvirtual ldquoyingrdquo walking in place and real walking [ 22]The researchers used the HiBall system to demonstrate thatas a mode of locomotion real walking is simpler morestraightforward and more natural than both virtual yingand walking in place Some images from these experimentsare shown in color plate image Welch 3 The unprecedentedcombination of large working volume and high performanceof the HiBall system led the researchers to claim that therewas literally nowhere else that they could havemeaningfully performed the experiments Other researcherswho visit and try the HiBall system almost always ask howthey can get one We are working on a means to make thathappen in selected laboratories
Strangely enough in some sense it is amazing that thesystem works at all In particular you effectively have toknow where the HiBall is for it to work at all The reason isthat as a result of a mechanical design trade-off each sensoreld of view is less than six degrees A small mistake couldquickly cause problems The focal length is set by the sizeof the sensor housing which is set by the diameter of thesensors themselves Energetics enters in also because youhave to have light collecting area And yet the system isamazingly robust users can dance around crawl on theoor lean over even wave their hands in front of thesensors and the system does not lose lock During onesession we were using the HiBall as a 3D digitization probe a HiBall on the end of a pencil-shaped berglass wand as
l
l x
Figure 5 The HiBall being used by Kevin Arthur to trackthe head and hand for the presence experiments in [ 22]
872019 1011465550
httpslidepdfcomreaderfull1011465550 711
University College London December 20-22 1999 S YMPOSIUM ON VIRTUAL REALITY SOFTWARE AND TECHNOLOGY 1999
The HiBall Tracker High-Performance Wide-Area Tracking for Virtual and Augmented Environments 7
shown in Figure 6 We laid the probe down on a table at onepoint and were amazed to later notice that it was stilltracking even though it could only ldquoseerdquo 3 or 4 LEDs nearthe edge of the Ceiling We picked the probe up andcontinued using it It never missed a beat
The simplest quantitative measurement of tracking systemperformance is standard deviation of its estimates when it isheld stationary With a tracker as sensitive as the HiBall it isimportant to be certain that it really is stationary The raisedoor in our laboratory allows motion for example when aperson walks by that is larger than the expected error in theHiBall We made careful measurements by resting thesupport for the HiBall on the concrete sub-oor in ourlaboratory The standard deviation of the error on the HiBallestimates while stationary is about 02 millimeters and 003degrees The distribution of the errors t a normaldistribution quite well
To make measurements of the noise when the HiBall is inmotion we rely on the assumption that almost all of thesignal resulting from normal human motion is at frequenciesbelow 2 Hz We use Welchrsquos method [ 31] to isolate thesignal energy above 2 Hz (Since the SCAAT method isrunning at about 2000 Hz it is reasonable to assume thatmost of the noise energy is above 2 Hz) This measurementproduces results that are comparable to those made with theHiBall stationary except at positions for which there arevery few LEDs visible in only one or two views In thesepositions near the edge of the ceiling the geometry of theconstraints results in amplication of errors For nearly allof the working volume of the tracker the standard-deviationof the noise on measurements while the HiBall is still ormoving is 02 millimeters and 003 degrees
In July of 1999 two Boeing Corporation engineers David
Himmel and David Princehouse visited our laboratory toassess the accuracy of the HiBall system in tracking theposition and orientation of a hand-held pneumatic drill Theengineers are interested in improving the accuracy of holesdrilled by hand during the aircraft manufacturing processTo asses the accuracy of the HiBall system they broughtwith them an aluminum ldquocouponrdquo (plate) with holes pre-drilled at locations accurate to 11000 of an inch In a set of carefully controlled experiments we together measured anaverage positioning error of 12 millimeter (201000 inch) atthe tip of the HiBall probe mentioned above and shown inthe left image of Figure 6 Unfortunately at the time wedecided not to position the experimental platform on theconcrete sub-oor but for expediency to live with the
additional uncertainty of placing it on the raised oorHowever we are encouraged by the results and are excitedabout the possibility that the HiBall system has uses beyondVirtual Reality tracking Some images from the Boeingexperiments are shown in Figure 6 and in color plate imageWelch 3
62 Off-Line Simulation and ModelingThe design of the HiBall system made substantial use of simulation in some domains to a very detailed level of
abstraction For example Zemax [ 32] was used extensivelyin the design and optimization of the optical designincluding the design of the lter glass lenses and geometryof the optical component layout AutoCADtrade was used todesign specify and t-check the HiBall body mechanicals
to visualize the physical design and to transmit the designto our collaborators at the University of Utah for fabricationby the Alpha 1 System [ 1 21] A custom ray-tracing systemwas built by Stefan Gottschalk (UNC) for the purpose of evaluating the optical behavior and energetics of theprimary secondary and tertiary elds of view the resultswere used by the noise model developed by Chi [ 8] asdescribed in the next section
In addition a complete simulator of the system was writtenin C++ This simulator discussed further in section 622 was used to evaluate the speed accuracy and robustness of the system In addition it was used to ldquotunerdquo the Kalmanlter for realistic motion dynamics This simulatorcontinues to be used to evaluate mechanical optical andalgorithmic alternatives
621 HiBall Measurement Noise ModelSignal-to-noise performance is a prime determiner of bothaccuracy and speed of the system so an in-depth study [ 8]was performed to develop a detailed noise model accountingfor properties of the LED the LEPD (sensor) the opticalsystem the physical distance and pose the electronics andthe dark-light-dark integrations described in section 52 The predominant noise source is shot noise with Johnsonnoise in the sheet resistivity of the LEPD surfaces being thenext most signicant Careful measurements made in thelaboratory with the actual devices yielded results that werealmost identical to those predicted by the sophisticatedmodel in [ 8] A simplied version of this model is used inthe real system to predict the measurement noise for theKalman lter ( section 53 ) when the automatic gain controldescribed in section 52 is not in use
622 Complete System SimulationsTo produce realistic data for developing and tuning ouralgorithms we collected position and orientation reportsfrom our rst generation ceiling tracker at its 70 Hzmaximum report rate These data were recorded both from
Figure 6 Left a Boeing engineer uses our 3D digitization probe (HiBall on a pencil-shaped fiberglass rod) to mea-sure the pre-drilled holes in their aluminum couponRight the HiBall is mounted on a hand-held pneumaticdrill for additional testing and measurements
872019 1011465550
httpslidepdfcomreaderfull1011465550 811
University College London December 20-22 1999 S YMPOSIUM ON VIRTUAL REALITY SOFTWARE AND TECHNOLOGY 1999
The HiBall Tracker High-Performance Wide-Area Tracking for Virtual and Augmented Environments 8
naive users visiting our monthly ldquodemo daysrdquo and fromexperienced users in our labs Based on our previousresearch [5] we ltered the raw ceiling data with a non-causal zero-phase-shift low-pass lter to eliminate energyabove 2 Hz The output of the low-pass ltering was then re-sampled at whatever rate we wanted to run the simulatedtracker usually 1000 Hz For the purposes of our
simulations these paths were considered to be a perfectrepresentation of the userrsquos motion Tracking error wasdetermined by comparing this input ldquotruthrdquo to the estimateproduced by the tracker
The simulator reads camera models describing the 26 viewsthe sensor noise parameters the LED positions and theirexpected error and the motion path described above Beforebeginning the simulation the LED positions are perturbedfrom their ideal positions by adding normally distributederror to each axis Then for each simulated cycle of operation the ldquotruerdquo position and orientation are updatedusing the input motion path Next a view is chosen and avisible LED within that view is selected and the image-
plane coordinates of the LED on the chosen sensor arecomputed using the camera model for the view and the LEDas described in section 53 These sensor coordinates arethen perturbed based on the sensor noise model(section 621) using the distance and angle to the LEDNow these noise corrupted sensor readings are fed to theSCAAT lter to produce an updated position estimate Theposition estimate is compared to the true position to producea scalar error metric described next
The error metric we used combines the error in position andorientation in a way that relates to the effects of tracker erroron a HMD user Imagine points arrayed around the user atsome xed distance We compute two sets of coordinates forthese points the true position using the true pose and theirestimated position using the estimated pose The errormetric is then the sum of the distances between the true andestimated positions of these points By adjusting thedistance of the points from the user we can control therelative importance of the orientation and the position errorin the combined error metric If the distance is small thenthe position error is weighted most heavily if the distance islarge then the orientation error is weighted most heavilyOur single error metric for the entire run is the square-rootof the sum of the squares of all the distances
Determining the magnitude of the parameters which controlthe SCAAT Kalman lter is called tuning We used Powellrsquosmethod [ 19] to minimize the above error metric Starting
with a set of parameters we ran the simulator over a fullmotion run to determine the total error for the run Then theoptimizer made a small adjustment to the parameters andthe process was repeated These runs required hours of computer time and some skill (and luck) in choosing theinitial parameters Of course it was important to choosemotion paths that were representative of expected usermotion For example a run in which the user is very stillwould result in very different tuning from a run in which theuser moves very vigorously
7 FUTURE WORKAt the moment we are investigating the use of a multi-modalor multiple-model Kalman lter framework [ 6 7] Thereason is because the current lter form ( section 53 ) andtuning values ( section 622) are a compromise between theresponsiveness desired for high dynamics and the heavyltering desired for smooth estimates during very slow or nomotion As it stands the system is almost smooth enoughfor open-loop Augmented Reality applications such ascomputer-assisted medical procedures The problem is thatwhen a user attempts to sit very still for example to align aneedle with a tumor for a biopsy even the small noise of oursystem results in visually-noticeable jitter A multiple-model implementation of the HiBall should be ableautomatically continuously and smoothly choose betweenone Kalman lter tuned for high dynamics and anothertuned for little or no motion We have this working insimulation but not yet implemented
As mentioned in section 43 the system was designed tosupport wireless communication between the HiBall and the
CIB without signicant modication or added informationoverhead However because commercial head-mounteddisplays are themselves tethered at this time we have feltlittle incentive to actually implement a wireless version of the system As it turns out our users are becomingincreasingly frustrated by the cumbersome cabling that youmust drag with you when walking around our laboratory Assuch we are now beginning work on a completely wirelessHiBall and display system
Beyond improving the existing system we are anxious tohead down a path of research and development that will leadto systems with reduced dependency on the laboratoryinfrastructure For example our current Ceiling paneldesign with 32 LEDs per panel provides far more densecoverage than we believe is necessary The density of LEDsis a result of design based on the original sensor xtureshow in Figure 1 and the original multiple-constraintalgorithm [ 4] Furthermore we believe that we couldachieve similar performance using a version of the HiBallthat has a small number of wide eld of view cameras
While we are very happy with our ability to autocalibratethe LED positions concurrently while tracking ( section 54 )we would eventually like to take this one step further andbegin with no estimates of beacon locations and possibly nonotion of individual beacon identity We have done somepreliminary investigation and simulation that indicates thisshould be possible Such capability could drastically reducethe cost of the system and provide immense exibilityFinally we believe that by leveraging the knowledge gainedfrom successful work in the laboratory it may some day bepossible to achieve similar performance with no explicitinfrastructure anywhere in a building or even outdoors Aparticular approach that we are interested in pursuing is thehybrid approach presented in [27 ] It is our belief that nosingle technology or fundamental modality can provide thenecessary performance in a consistent and robust fashion
872019 1011465550
httpslidepdfcomreaderfull1011465550 911
University College London December 20-22 1999 S YMPOSIUM ON VIRTUAL REALITY SOFTWARE AND TECHNOLOGY 1999
The HiBall Tracker High-Performance Wide-Area Tracking for Virtual and Augmented Environments 9
across the necessary range of dynamics for head-mounteddisplays We believe that the solution must lie in the cleverand careful combination of complementary technologies
8 ACKNOWLEDGEMENTSWe want to acknowledge several current Tracker Projectmembers including (alphabetically) Matthew Cutts Henry
Fuchs Jeffrey Juliano Benjamin Lok John ThomasNicholas Vallidis Hans Weber and Mary Whitton We alsowant to thank several past members and contributors Inparticular we want to acknowledge the many contributionsof past members Philip Winston Scott Williams and PawanKumar We also want to acknowledge the many earlycontributions of previous members Ronald Azuma StefanGottschalk and Jih-Fang Wang [ 25] and the contributionsof Al Barr (California Institute of Technology) and JohnldquoSpikerdquo Hughes (Brown University) to the original off-lineLED calibration work [ 13] that led to the simpler Ceilingpanels shown in Figure 3 Finally we want to acknowledgeour many collaborators in the NSF Science and TechnologyCenter for Computer Graphics and Scientic Visualization
specically our collaborators in mechanical design andfabrication at the University of Utah Rich Riesenfeld SamDrake and Russ Fish
This work was supported in part by DARPAETO contractnumber DABT 63-93-C-0048 ldquoEnabling Technologies andApplication Demonstrations for Synthetic EnvironmentsrdquoPrinciple Investigators Frederick P Brooks Jr and HenryFuchs (University of North Carolina at Chapel Hill) and bythe National Science Foundation Cooperative Agreementno ASC-8920219 ldquoScience and Technology Center forComputer Graphics and Scientic Visualizationrdquo CenterDirector Andy van Dam (Brown University) PrincipleInvestigators Andy van Dam Al Barr (California Institute of
Technology) Don Greenberg (Cornell University) HenryFuchs (University of North Carolina at Chapel Hill) RichRiesenfeld (University of Utah)
9 REFERENCES[1] ldquoAlpha 1 Publicationsrdquo University of Utah Department
of Computer Science [Cited May 28 1999] Availablefrom httpwwwcsutaheduprojectsalpha1 a1_publicationshtml
[2] Azarbayejani Ali and Alex Pentland June 1995ldquoRecursive Estimation of Motion Structure and FocalLengthrdquo IEEE Trans Pattern Analysis and Machine
Intelligence June 1995 17(6)[3] Azuma Ronald 1995 ldquoPredictive Tracking for Aug-
mented Realityrdquo PhD dissertation University of NorthCarolina at Chapel Hill TR95-007
[4] Azuma Ronald and Mark Ward 1991 ldquoSpace-Resec-tion by Collinearity Mathematics Behind the OpticalCeiling Head-Trackerrdquo UNC Chapel Hill Departmentof Computer Science technical report TR 91-048(November 1991)
[5] Azuma Ronald and Gary Bishop 1995 ldquoA Frequency-Domain Analysis of Head-Motion Predictionrdquo Pro-ceedings of SIGGRAPH 95 (Los Angeles CA) August6-11 1995 pp 401-408
[6] Bar-Shalom Yaakov and Xiao-Rong Li 1993 Estima-tion and Tracking Principles Techniques and Soft-ware Artec House Inc
[7] Brown RG and P Y C Hwang 1992 Introduction to Random Signals and Applied Kalman Filtering 2ndEdition John Wiley amp Sons Inc
[8] Chi Vernon L ldquoNoise Model and Performance Analy-sis Of Outward-looking Optical Trackers Using LateralEffect Photo Diodesrdquo TR95-012 Department of Com-puter Science UNC at Chapel Hill April 1995
[9] Emura S and S Tachi 1994 ldquoSensor Fusion basedMeasurement of Human Head Motionrdquo Proceedings3rd IEEE International Workshop on Robot and HumanCommunication RO-MANrsquo94 NAGOYA (Nagoya Uni-versity Nagoya Japan)
[10]Foxlin Eric 1993 ldquoInertial Head Trackingrdquo MasterrsquosThesis Electrical Engineering and Computer ScienceMassachusetts Institute of Technology
[11]Foxlin Eric Michael Harrington George Pfeifer 1998ldquoConstellationtrade A Wide-Range Wireless Motion-Tracking System for Augmented Reality and Virtual SetApplicationsrdquo SIGGRAPH 98 Conference Proceed-ings Annual Conference Series ACM SIGGRAPHJuly 19-24 1998 Orlando FL
[12]Gelb A 1974 Applied Optimal Estimation MIT PressCambridge MA
[13]Gottschalk Stefan and John F Hughes 1993 ldquoAuto-calibration for Virtual Environments Tracking Hard-warerdquo Proceedings of Annual Conference Series ACMSIGGRAPH 93 (Anaheim CA 1993)
[14] Jacobs O L R 1993 Introduction to Control Theory 2nd Edition Oxford University Press
[15]Kalman RE 1960 ldquoA New Approach to Linear Filter-ing and Prediction Problemsrdquo Transaction of theASMEmdashJournal of Basic Engineering pp 35-45(March 1960)
[16]Lewis Richard 1986 Optimal Estimation with an Introduction to Stochastic Control Theory John Wileyamp Sons Inc
[17]Maybeck Peter S 1979 Stochastic Models Estima-tion and Control Volume 1 Academic Press Inc
[18]Mazuryk Thomas and Michael Gervautz 1995 ldquoTwo-Step Prediction and Image Deection for Exact HeadTracking in Virtual Environmentsrdquo EUROGRAPHICSlsquo95 Vol 14 No 3 pp 30-41
[19] Press William H Brian P Flannery Saul A Teukolskyand William T Vetterling 1990 Numerical Recipes inC The Art of Scientic Computing Cambridge Univer-sity Press
872019 1011465550
httpslidepdfcomreaderfull1011465550 1011
University College London December 20-22 1999 S YMPOSIUM ON VIRTUAL REALITY SOFTWARE AND TECHNOLOGY 1999
The HiBall Tracker High-Performance Wide-Area Tracking for Virtual and Augmented Environments 10
[20]Sorenson HW 1970 ldquoLeast-Squares estimation fromGauss to Kalmanrdquo IEEE Spectrum Vol 7 pp 63-68July 1970
[21]Thomas S W ldquoThe Alpha_1 Computer-Aided Geo-metric Design System in the Unix Environmentrdquo inProc Computer Graphics and Unix Workshop (KatzL ed) USENIX Organization Dec 1984
[22]Usoh Martin Kevin Arthur Mary C Whitton Rui Bas-tos Anthony Steed Mel Slater Frederick P Brooks JrldquoWalking gt Walking-in-Place gt Flying in Virtual Envi-ronmentsrdquo to appear in SIGGRAPH 99 ConferenceProceedings Annual Conference Series ACM SIG-GRAPH August 1999 Los Angeles CA
[23]Van Pabst J V L and Paul F C Krekel ldquoMulti SensorData Fusion of Points Line Segments and Surface Seg-ments in 3D Spacerdquo TNO Physics and Electronics Lab-oratory The Hague The Netherlands [cited 19November 1995] Available from httpwwwbartnl ~lawickindexhtml
[24]Wang Jih-fang Ronald Azuma Gary Bishop VernonChi John Eyles Henry Fuchs ldquoTracking a Head-mounted Display in a Room-sized environment withHead-mounted Camerasrdquo Proceedings of the SPIE1990 Technical Symposium on Optical Engineeringand Photonics in Aerospace Sensing Orlando Florida16-20 April 1990
[25]Wang Jih-fang Vernon Chi Henry Fuchs ldquoA Real-time Optical 3D Tracker for Head-mounted DisplaySystemsrdquo Proceedings of the 1990 Symposium onInteractive 3D Graphics Snowbird UT 25-28 March1990 in Computer Graphics Vol 24 No 2 March1990 pp 205-215
[26]Ward Mark Ronald Azuma Robert Bennett StefanGottschalk and Henry Fuchs 1992 ldquoA DemonstratedOptical Tracker With Scalable Work Area for Head-Mounted Display Systemsrdquo Proceedings of 1992 Sym-
posium on Interactive 3D Graphics (Cambridge MA29 March - 1 April 1992) pp 43-52
[27]Welch Gregory 1995 ldquoHybrid Self-Tracker An Iner-tialOptical Hybrid Three-Dimensional Tracking Sys-temrdquo University of North Carolina Department of Computer Science TR 95-048
[28]Welch Gregory and Gary Bishop 1997 ldquoSCAATIncremental Tracking with Incomplete InformationrdquoSIGGRAPH 97 Conference Proceedings Annual Con-ference Series ACM SIGGRAPH August 1997 LosAngeles CA
[29] Welch Gregory 1996 ldquoSCAAT Incremental Trackingwith Incomplete Informationrdquo University of NorthCarolina at Chapel Hill doctoral dissertation TechnicalReport TR 96-051
[30]Welch Gregory and Gary Bishop 1995 ldquoAn Introduc-tion to the Kalman Filterrdquo University of North Caro-lina Department of Computer Science TR 95-041
[31]Welch PD ldquoThe Use of Fast Fourier Transform for theEstimation of Power Spectra A Method Based on TimeAveraging Over Short Modied Periodogramsrdquo IEEETrans Audio Electroacoust Vol AU-15 (June 1967)pp 70-73
[32]ZEMAX Optical Design Program Users Guide Ver-sion 45 Focus Software Inc Tucson AZ 1995
872019 1011465550
httpslidepdfcomreaderfull1011465550 1111
The HiBall Tracker High-Performance Wide-Area Tracking for Virtual and Augmented Environments COLOR PLATE
University College London December 20-22 1999 S YMPOSIUM ON VIRTUAL REALITY SOFTWARE AND TECHNOLOGY 1999
a b c
Approximately 20 cm
Welch 1 The left image (a) shows the head-mounted display and bulky sensor fixture from the original system The sensorsare colorized in red The middle image (b) shows a close-up of the new self-contained HiBall with lenses and part of thecover removed The right image (c) shows graduate student Pawan Kumar using the new HiBall system
a
b
c
Welch 2 Image (a) shows an unassembled HiBall printed circuit board The board has two separate large round sectionsfor analog and digital circuits and six small round sections for sensors These rigid PCB sections are connected by flexibletrace segments to eliminate connectors After populating the board the pieces are cut away from the rectangular board andfolded into the HiBall as shown Image (b) shows the Ceiling panel PC board from Figure 3 and (c) the CIB from Figure 4
a
d
b
e
c
f
g
h
Welch 3 The images (a)-(f) show the HiBall system in use by Usoh and Martin and their colleagues for experiments in [ 22]Images (a)-(b) show the HiBall being used to track the head and hand (c) shows a test subject walking under the HiBallCeiling (d) is an overview of the virtual world (e)-(f) are sample test subject views Image (g) shows the HiBall mounted ona hand-held pneumatic drill for experiments with Boeing engineers (h) shows a HiBall-based drill-guiding application
COLOR PLATE

872019 1011465550
httpslidepdfcomreaderfull1011465550 1111
The HiBall Tracker High-Performance Wide-Area Tracking for Virtual and Augmented Environments COLOR PLATE
University College London December 20-22 1999 S YMPOSIUM ON VIRTUAL REALITY SOFTWARE AND TECHNOLOGY 1999
a b c
Approximately 20 cm
Welch 1 The left image (a) shows the head-mounted display and bulky sensor fixture from the original system The sensorsare colorized in red The middle image (b) shows a close-up of the new self-contained HiBall with lenses and part of thecover removed The right image (c) shows graduate student Pawan Kumar using the new HiBall system
a
b
c
Welch 2 Image (a) shows an unassembled HiBall printed circuit board The board has two separate large round sectionsfor analog and digital circuits and six small round sections for sensors These rigid PCB sections are connected by flexibletrace segments to eliminate connectors After populating the board the pieces are cut away from the rectangular board andfolded into the HiBall as shown Image (b) shows the Ceiling panel PC board from Figure 3 and (c) the CIB from Figure 4
a
d
b
e
c
f
g
h
Welch 3 The images (a)-(f) show the HiBall system in use by Usoh and Martin and their colleagues for experiments in [ 22]Images (a)-(b) show the HiBall being used to track the head and hand (c) shows a test subject walking under the HiBallCeiling (d) is an overview of the virtual world (e)-(f) are sample test subject views Image (g) shows the HiBall mounted ona hand-held pneumatic drill for experiments with Boeing engineers (h) shows a HiBall-based drill-guiding application
COLOR PLATE


