1.01 Notes - SharpSchool...
53
Algebra II Indicators p. 33 Answer Key Notes 1.01 A. 21 15 2 3 7 5 5 2 15 − − + B. 7 2 6 150 3 3 + C. 2 29 20 D. 16 49 E. 15 05 . F. $11,960; $242,000 G. $14,337; $117,800 H. 3.856% I. 12% J. 10 227 14 12 9 log . or e ln . 227 14 12 9 or 227 14.12 9 K. a = 3, b = 2 or a = -3, b = -2 L. 13 11 20 − i
Transcript of 1.01 Notes - SharpSchool...

Algebra II Indicators p. 33 Answer Key
Notes1.01
A. 21
15
23 7 5
5
215− − +
B. 7 2 6 1503 3+
C. 2
29
20
D.
16
49
E. 150 5.
F. $11,960; $242,000
G. $14,337; $117,800
H. 3.856%
I. 12%
J. 10
227
14 12
9
log.
or
eln
.
227
14 12
9
or
227
14.129
K. a = 3, b = 2 or a = -3, b = -2
L.
13 11
20
− i

Algebra II Indicators p. 34 Answer Key
Notes1.02
A. 243x5 - 810x4y + 1080x3y2 - 720x2y3
+ 240xy4 - 32y5
B. x6 + 12x5y + 60x4y2 + 160x3y3
+ 240x2y4 + 192xy5 + 64y6
C. 4 11 33
81
3
2x xx
+ + +−
D. x 8x 36
165
x 5
2 − + −+
E. 4(x2 + 4y2)
F. (2x + 3)(4x2 - 6x + 9)
G. (3x - 1)(2x + 5)
H. (x2 + 1)(x + 1)(x - 1)
I. (3y + 4)(x + 2)
J. 2
K.
2
2 1
x
x +
L.
x
x
++
2
6
M.
a
a
++
7
2
N. x - y
O. 6.6 ohms
P. 3.4 seconds

Algebra II Indicators p. 35 Answer Key
Notes2.01
A. (x + 4)2 + (y - 5.5)2 = 6.25
(x + 4)2 + (y - 0.5)2 = 6.25
(x - 1)2 + (y - 5.5)2 = 6.25
(x - 1)2 + (y - 0.5)2 = 6.25
B. vertex: (3.5, -3.25)
y-intercept: (0, 9)
x-intercepts:
7 13
20
+
, ,
7 13
20
−
,
C. vertex: (-10, 2)
x-intercept: (2, 0)
y-intercepts:
06 30
3,
+
,
06 30
3,
−
D. x-intercepts: − +( )3 6 0, ,
− −( )3 6 0,
y-intercepts: 0 4 13, +( ) ,
0 4 13, −( )

Algebra II Indicators p. 36 Answer Key
Notes2.02
A. Center: (2, -2)
Foci: 2 13 2+ −( ), ,
2 13 2− −( ),
major axis: 8
Minor axis: 2 3x-intercepts: none
y-intercepts: (0, -0.5), (0, -3.5)
B. Center: (-2, 3)
Vertices: − ±( )2 6,3
Asymptotes: y
7
3x 3 2
7
3= + +
y
7
3x 3 2
7
3= − + −
x-intercepts:
− ±
2
69
7,0
y-intercepts: none

Algebra II Indicators p. 37 Answer Key
NotesC. x-intercepts: (-7.83, 0), (1.83, 0)
y-intercepts: (0, 8.96). (0, -0.96)
D. x-intercepts: (0.76, 0), (5.24, 0)
y-intercepts: (0, 0.38), (0, -8.38)

Algebra II Indicators p. 38 Answer Key
Notes3.01
A. The data is widely scattered between
$0.71 and $1.36. There is not an
algebraic expression that will model year
and gasoline prices very well because of
the data’s scattered nature. Students
should research the petroleum industry
and identify variables that are likely to
affect the prices of petroleum-based
products. Some variables they are likely
to discover are: supplies available from
petroleum producing nations; time of
year; weather; wages and benefits for
industry employees; refinery capacity;
transportation costs; taxes; number of
automobiles. Students should correlate
these variables with prices and
determine if algebraic models are
appropriate.
Gasoline: January Price per Gallon
0.00
0.20
0.40
0.600.80
1.00
1.20
1.40
1.60
1975 1980 1985 1990 1995 2000 2005

Algebra II Indicators p. 39 Answer Key
Notes
PGA Championship
0
200
400
600
800
1000
0 5 10 15 20
Place
B. The best model available
(linear, exponential, quadratic) is
y = 533.81(0.8675)X; this does not fit
very well. A better idea is for a student
to contact the PGA and find out how the
prize money is distributed. Winnings are
dependent upon the place an individual
finishes. According to the model, the
prize awarded depreciates in value about
13% for each place from first. Other
variables that may affect prize money
would include category of play (major
championship event); sponsorships;
ticket prices; television contracts.

Algebra II Indicators p. 40 Answer Key
NotesC. The data is increasing for the period
shown. A linear model,
y = 0.019548x - 1.005658, r = 0.9045,
appears to fit reasonably well for
estimation purposes. Transportation
costs, weather, federal subsidies, and
labor costs are a few variables that affect
the price of food. Have students
investigate variables specific to NC
agriculture.
D. B-40
2L-Tower
Area: 12n - 6 Volume: 3n - 2
Cut Block
Area: 6n2 Volume: 3n2 - 3n + 1
B-41
Blocks
Area: good luck!! Volume: 2n-1
Steps
Area: n2 + 5n Volume: 0.5n2 + 0.5n
Apples: Price per Pound
0.00
0.20
0.40
0.60
0.80
1.00
1.20
1975 1980 1985 1990 1995 2000 2005

Algebra II Indicators p. 41 Answer Key
Notes
Newspaper Circulation
0
10
20
30
40
50
60
70
1900 1920 1940 1960 1980 2000 2020
E. Circulation increases until 1985 and then
begins to decline. Competition (TV,
radio, cable, internet) is the major
variable that affects circulation. Since
the relation is increasing and then
decreasing, a quadratic model is
probably best, y = -0.01x2 + 1.6x - 1.8.
According to the model, newspaper
circulation will drop below 50 million
about 2013.

Algebra II Indicators p. 42 Answer Key
Notes3.02
A. The data is decreasing and should
provide a good opportunity for a
discussion of data and its outliers. Gate
receipts, sponsorships, and TV/radio
contracts are variables that can affect
prize money. Ask a student to contact
NASCAR and find out how prize money
is determined. None of the three (linear,
quadratic, exponential) provide a good
model. If first place is excluded,
exponential becomes the better model,
y = 279901(0.93)X.
Brickyard 400
0
200
400
600
800
1,000
0 5 10 15 20
Place

Algebra II Indicators p. 43 Answer Key
Notes
Food Expenditures Away from Home
0
10
20
30
40
50
1920 1940 1960 1980 2000
B. The data is increasing over the period
shown. A linear model (y = 0.43x - 3.15)
fits well (r = 0.98). According to the
linear model, the portion of food
expenditures that will be spent outside
the home will increase 0.43% annually.
Increase in the number of parents
working (two income families, working
single parent) is probably the biggest
contributor. Students may say more
after school, extracurricular activities
contribute. According to the model,
2023 will be when we spend half of the
money we spend on food outside the
home.

Algebra II Indicators p. 44 Answer Key
Notes3.03
A. Two: -6 ≤ c < 6.125
One: c = 6.125
None: c > 6.125
B. Three: -45 ≤ c < -3
Two: c = -3
One: c > -3
None: there is always at least one real
zero
C. Four: e < 278
Three: 278 ≤ e < 279
Two: 279 < e < 446
One: 446 < e < 447
None: e > 447
3.04
A. 33 - 5x2
B. -25x2 - 30x - 3
C. 13
D. -318
E. 33 - 5x2
F.
x − 3
5
G. 3 5− x

Algebra II Indicators p. 45 Answer Key
Notes3.05
A. As b increases, the curves relocate,
curling right to left.
B. Same shape and y-intercept; reflections
of each other across the y-axis.
C. The curve opens up and the vertex
moves right and down (+x, -y); the
y-intercept remains at (0, 5).

Algebra II Indicators p. 46 Answer Key
NotesD. Open in opposite directions and intersect
at (0, c). The relationship between the
two curves could also be expressed as a
combination of two reflections, one
vertical and one horizontal or rotation
about (0, c).
E. The shape of the curve remains the
same; as c increases, curve moves up the
coordinate plane (+y).

Algebra II Indicators p. 47 Answer Key
NotesF. 1972
surplus: y1 > y
2
deficit: y1 < y
2
G. 1920-80 increasing circulation; 1980-98
decreasing circulation.
Peaked in 1980. According to the
equation, circulation approximated 45
million in 1950 and expects the same in
2011.
H. y-intercept: (0, 26)
x-intercepts: (2, 0), (6.5, 0)
vertex:
17
4
81
8,−

Algebra II Indicators p. 48 Answer Key
Notes3.06
A. 355 seconds; 90 seconds
B. 1997; 1994; Yes, 1999.

Algebra II Indicators p. 49 Answer Key
Notes3.07
A. As d increases, the function moves up
the coordinate plane (+y).
B. The functions have the same y-intercept
and are 180o rotations of the other. The
curves open in opposite directions.
C. As a increases, the turns in the curve
become less pronounced; straighter.

Algebra II Indicators p. 50 Answer Key
NotesD. As b increases, the turns in the curve
become more pronounced.
E. Low in early 1992 (1.3, 0.696); high in
late 1996 (4.9, 1.368); low in late 1998
(7.8, 0.975); increasing 1992-96, after
1998; decreasing 1996-98.
Prices fluctuate over the domain given.
Since the function increases after 1998,
you expect gas prices to increase the
next three years. According to the
function, gas prices will reach $2 in late
2000 (9.7, 2.015). Some variables that
affect the price of gasoline are labor
costs, technology, infrastucture, refining
capacity, availability of crude petroleum,
and political unrest in petroleum
producing countries.

Algebra II Indicators p. 51 Answer Key
NotesF. 3x3 + 2x2 = 9x + 6 given
x2(3x + 2) = 3(3x + 2) distributive property
x2(3x + 2) - 3(3x + 2) = 0 add/sub property of equality
(x2 - 3)(3x + 2) = 0 distributive property
x2 - 3 = 0 or 3x + 2 = 0 multiplicative property of zero
(x + 3 )(x - 3 ) = 0 3x = -2 add/sub property of equality
difference of squares (distributive)
x + 3 = 0 or x - 3 = 0 x = − 2
3mult/div property of equality
mult property of zero
x = − 3 or x = 3add/sub property of equality
Therefore x = 3 , − 3, or − 2
3
Notes

Algebra II Indicators p. 52 Answer Key
NotesG. As c increases, the curve closes and
looks more parabolic.
H. As e increases, the curve moves
vertcally (+y)
I. As a increases positively, the curve
closes and the turns are less pronounced.

Algebra II Indicators p. 53 Answer Key
Notes3.08
A. In the 7th month, $35.0645; in the 20th
month, $17.577; decreasing, then in-
creasing; by month 29, the metal reaches
a value of $69.737
B. 1956; the incidence of measles in 1940;
1940-44 decreasing; 1944-56 increasing;
1956-60 decreasing; 1963; increasing
population, vaccinations.

Algebra II Indicators p. 54 Answer Key
Notes3.09
A. N-shaped curve intersecting the x-axis
once at -2.
B. G(x) will intersect x-axis one unit to the
left of F(x).
C. H(x) will intersect the x-axis at 2, -2,
and -3.
D. Generally increasing functions;
N-shaped; H(x) shares an x-intercept
with F(x) and G(x).

Algebra II Indicators p. 55 Answer Key
Notes3.10
A. The function is decreasing except at
x = 2 where it is undefined.
Asymptotes at y = 0 and x = 2; intercept
at (0, -0.5)
The zero for y = x - 2 is where y
1
x 2=
−is undefined.
B. The verical asymptote moves to the left
(-x direction) as b increases.
.

Algebra II Indicators p. 56 Answer Key
NotesC. The horizontal asymptote moves up
(+y direction) as c increases.
D. For the domain x < 0.5, function is
increasing; for domain x > 0.5, function
is decreasing; undefined at x = -2 and x
= 3. The zeros for y = x2 - x - 6 are are
where y
1
x x 62=
− − is undefined.

Algebra II Indicators p. 57 Answer Key
NotesE. The vertical asymptotte moves to the left
(-x direction) as b increases.
F. The horizontal asymptote moves up
(+y direction) as c increases.

Algebra II Indicators p. 58 Answer Key
NotesG. The function is decreasing except at
x = -2 and x = 3 where it is undefined.
Asymptotes are x = -2, x = 3 and y = 0
for the domain x < -2 and x > 3.
y = x and y
x
x x 62=
− − share an
intercept at the origin; the zeros for
y = x2 - x - 6 are the vertical asymptotes
for y
x
x x 62=
− −;
the zero for y
x
x x 62=
− − is the vertical
asymptote for y
x x 6
x
2
= − −

Algebra II Indicators p. 59 Answer Key
NotesH. The function is increasing for x < 0 and
decreasing for x > 0 except for x = -2
and x = 3 where the function is
undefined. The origin is the only
intercept. The asymptotes are
x = -2, x = 3, and y = 0. y = x2 and
y
x
x x 6
2
2=
− − share an intercept at the
origin; the zeros for y = x2 - x - 6 are the
asymptotes for y
x
x x 6
2
2=
− −; the zero
for y
x
x x 6
2
2=
− − is an asymptote for
y
x x 6
x
2
2= − −
; y
x
x x 6
2
2=
− − and
y
x x 6
x
2
2= − −
share an asymptote,
y = 1, for domain x > 3.

Algebra II Indicators p. 60 Answer Key
NotesI. Decreasing for x < -2.1, increasing for
-2.1 < x < 0.8, and decreasing for x > 0.8
except at x = -3, -1, and 2 where the
function is undefined. Asymptotes at
x = -3, x = -1, x = 2, and y = 0. The
zeros for y = x 2x 5x 63 2+ − − are
where y =
1
x 2x 5x 63 2+ − − is
undefined.

Algebra II Indicators p. 61 Answer Key
NotesJ. Increasing for x < 0.36 and undefined at
x = -3, -1, and 2. Intercepts at (-2, 0)
and (0, − 1
3); asymptotes at x = -3,
x = -1, x = 2, and y = 0 for x > 2 and
x < -3. y = x + 2 shares an x-intercept
with y =
x + 2
x 2x 5x 63 2+ − −;
y =
x + 2
x 2x 5x 63 2+ − − and
y =
x 2x 5x 6
x + 2
3 2+ − − are undefined for
the same x-values; y =
x + 2
x 2x 5x 63 2+ − −is undefined where y = x3 + 2x2 - 5x - 6
has zeros.

Algebra II Indicators p. 62 Answer Key
NotesK. Decreasing for x < -7.4, increasing for
-7.4 < x < -2.2, decreasing for
-2.2 < x < 0.8, increasing for
0.8 < x < 8.8, and decreasing for x > 8.8;
undefined at x =-3, -1, and 2. Intercepts
at (-5, 0) and (5, 0); asymptotes are
x = -3, x = -1, and x = 2. y = x2 - 25 and
y =
x 25
x 2x 5x 6
2
3 2
−+ − −
share x-intercepts;
y =
x 25
x 2x 5x 6
2
3 2
−+ − −
and
y =
x 2x 5x 6
x 5
3 2
2
+ − −− 2
are undefined at
x = -3, -1, and 2. y = x 2x 5x 63 2+ − −has intercepts where
y =
x 25
x 2x 5x 6
2
3 2
−+ − −
is undefined.
Algebra II Indicators p. 63 Answer Key
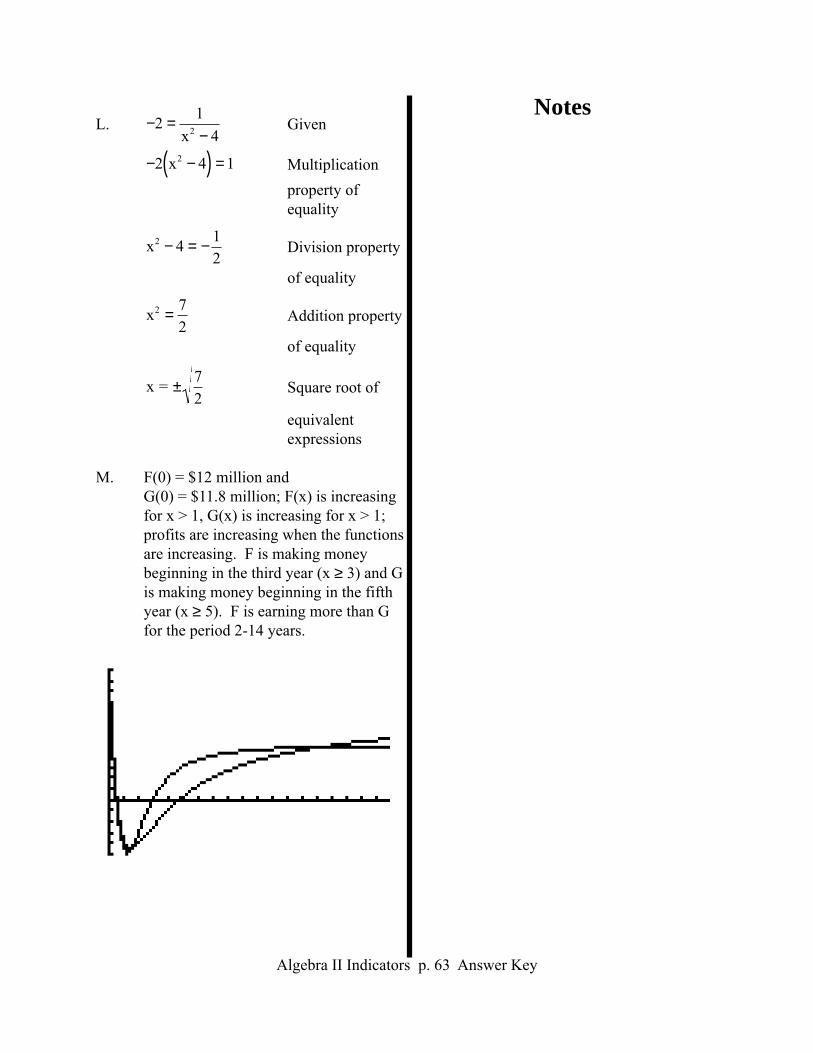
NotesL.
− =
−2
1
x 42Given
− −( ) =2 x 4 12
Multiplication
property of
equality
x 4
1
2
2 − = − Division property
of equality
x
7
2
2 = Addition property
of equality
x =
7
2± Square root of
equivalent
expressions
M. F(0) = $12 million and
G(0) = $11.8 million; F(x) is increasing
for x > 1, G(x) is increasing for x > 1;
profits are increasing when the functions
are increasing. F is making money
beginning in the third year (x ≥ 3) and G
is making money beginning in the fifth
year (x ≥ 5). F is earning more than G
for the period 2-14 years.

Algebra II Indicators p. 64 Answer Key
Notes3.11
A. The x-intercept moves closer to the
origin and the curve gets steeper.
B. The curve moves to the left
(-x direction).
C. The curve moves up the coordinate plane
(+y direction) as c increases.
Algebra II Indicators p. 65 Answer Key
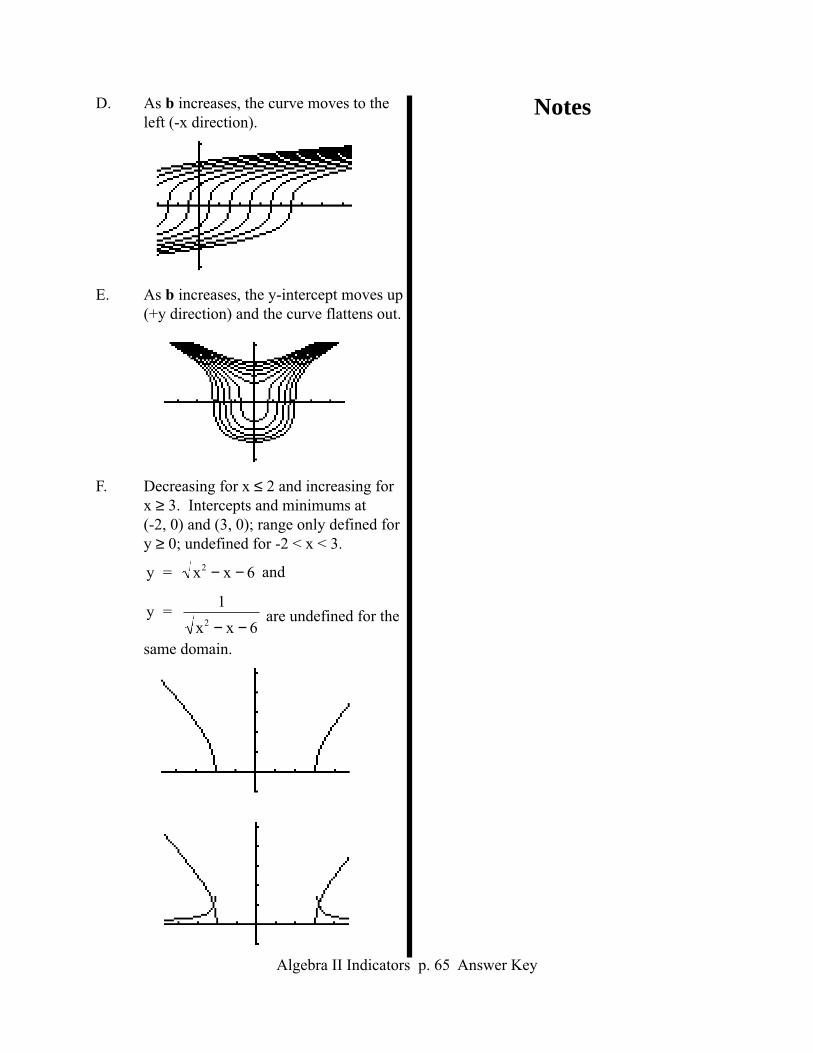
NotesD. As b increases, the curve moves to the
left (-x direction).
E. As b increases, the y-intercept moves up
(+y direction) and the curve flattens out.
F. Decreasing for x ≤ 2 and increasing for
x ≥ 3. Intercepts and minimums at
(-2, 0) and (3, 0); range only defined for
y ≥ 0; undefined for -2 < x < 3.
y = x x 62 − − and
y = 1
x x 62 − − are undefined for the
same domain.

Algebra II Indicators p. 66 Answer Key
NotesG. x 5x 4 2 x2 + + = − Given
x 5x 4 4 4x x2 2+ + = − +Square equivalent expressions
9x = 0
Add/sub properties of equality
x = 0
Division property of equality
H. 6x 4 x 1+ = + Given
6x 4 x 2x 12+ = + +Square equivalent expressions
0 = x2 - 4x - 3
Add/sub properties of equality
x 2 7= ±Apply quadratic formula; simplify
I. x = 5.3 (approx.)
J. x = -7.1 (approx.)
Algebra II Indicators p. 67 Answer Key
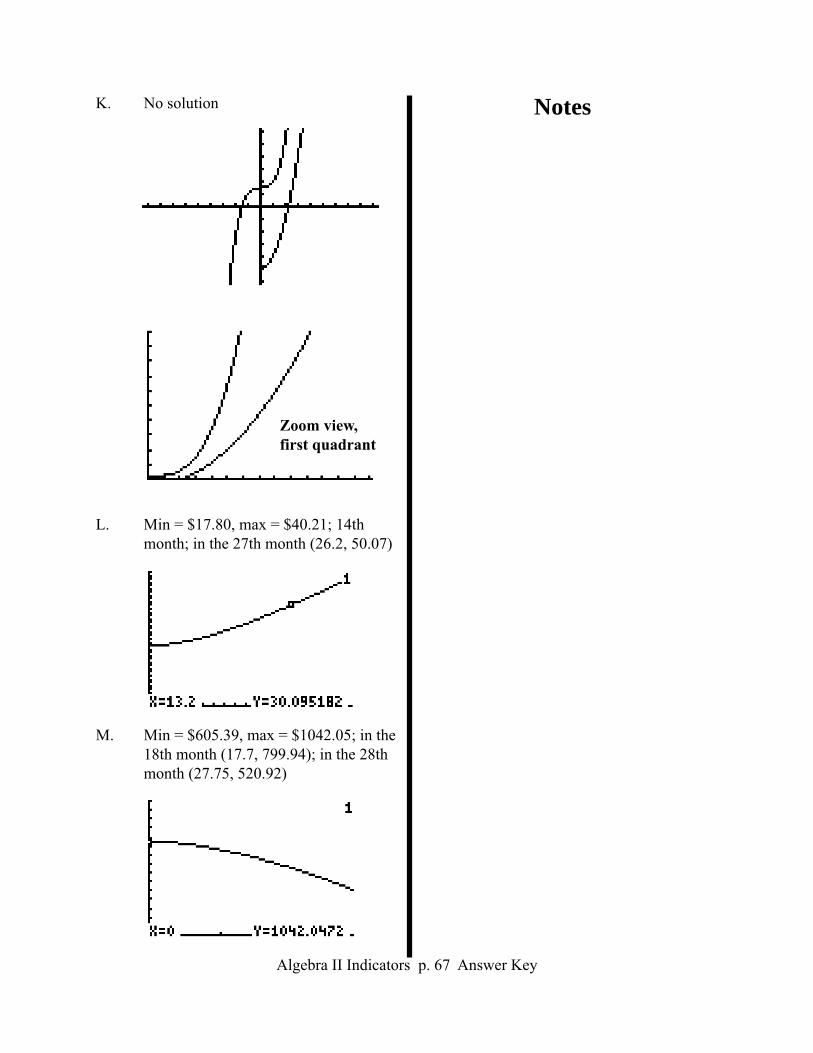
NotesK. No solution
L. Min = $17.80, max = $40.21; 14th
month; in the 27th month (26.2, 50.07)
M. Min = $605.39, max = $1042.05; in the
18th month (17.7, 799.94); in the 28th
month (27.75, 520.92)
Zoom view,
first quadrant

Algebra II Indicators p. 68 Answer Key
Notes3.12
A. 6.1 years; 7 years; 8.4 years
B.
1 1 1 1
216 36 6 1
1331 121 11 1
3375 225 15 1
77
2
3
6
a
b
c
d
1
−
−
=
−
− −− −
− −− −
0.001 0.004 0.005 0.002
0.046 0.12 0.11 0.036
0.459 0.849 0.555 0.165
1.414 0.733 0.45 0.131
C. Answers vary. An example is:
y
11
2x 10= −
y
7
3x
64
3= − +
y
4
5x
3
5= −
D. (3.09, 0.26, 0.27)
E. (1.71, 1.75, 3.08, -0.38)
Algebra II Indicators p. 69 Answer Key
Notes3.13
A. An example: y ≥ -3x - 20
y ≤ -3x - 5
y
3
4x
55
4≤ +
y
3
4x
25
4≥ +
B. 2 ≤ x ≤ 6
10 ≤ y ≤ 40
x + y ≤ 35
I(x,y) = 10x + 6.25y
I(6, 29) = $241.25

Algebra II Indicators p. 70 Answer Key
Notes3.14
A. The graph closes and moves closer to the
y-axis. The vertex approaches the origin
along the x-axis.
B. The graph moves away from the y-axis
(-x direction).
C. rhombus

Algebra II Indicators p. 71 Answer Key
NotesD. Answers vary. An example is:
y ≤ 9 - |4x - 6|
E. |3x - 4| ≤ 17 Given
3x - 4 ≤ 17 and 3x - 4 ≥ -17
Definition of inequality with respect to
absolute value
-17 ≤ 3x - 4 ≤ 17
Re-express inequalities as a compound
inequalitiy
-13 ≤ 3x ≤ 21
Addition property of inequalities
− ≤ ≤13
3x 7
Mult/div property of inequalities
F. Solve by graphing y = |16 - 3x| and
y = |x| + 3; x = {3.25, 9.5}

Algebra II Indicators p. 72 Answer Key
Notes3.15
A. As b increases, the curve becomes
steeper.
B. As b approaches zero, the curve
becomes steeper and approaches
y = 0 more quickly.
C. As a increases, the curve becomes
steeper.

Algebra II Indicators p. 73 Answer Key
NotesD.
log 5
log 3.1,0
( )( )
and (0, -8).
E. (2006, 754,468); 12 years;
y = 429316(1.07302039)x
(x = 0 for 1998)
F. $128.31; 7 months

Algebra II Indicators p. 74 Answer Key
NotesG. Let x = 0 for 1990. The data generates
y = 10498(1.178)x as the exponential
curve of best fit. Assuming that we are
in the 2001 model year, a new vehicle
costs $63,672. The depreciation
function, based on the age of the vehicle
in 2001, is y = 63672(0.849)x.
3.16
A. c 101.662=
B. d
6
e3.25=
C. x e ba= −
D.
x
logc
a
log b=
( )

Algebra II Indicators p. 75 Answer Key
Notes3.17
A. Solve 614.3 = 465.6R8 for R to
determine the annual growth rate.
R = 1.035.
614.3R7 = 782.9 million passengers in
2005.
B. y = 465.6(1.035)x is the model for airline
passengers in millions since 1990
(x = 0 for 1990).
C. $2500; $4.39
D. 350 200e2r= given
350
200e2r=
division property of equality
ln
350
2002r
=
law of logarithms (equivalent
expressions); definition of natural log
ln350
200
2r
=
division property of equality
0.2798 ≈ r
simplify expression

Algebra II Indicators p. 76 Answer Key
NotesE. 960 1 0758= ×A . given
960
1.075A
8=
division property of equality
538.274 ≈ A
simplify expression
F. 663 49 2.165x= × given
663
492.165x=
division property of equality
log
663
49log 2.165x
= ( )law of logarithms
(equivalent expressions)
log
663
49xlog 2.165
= ( )law of logarithms
(exponential expressions)
log663
49
log 2.165
( ) = x
division property of equality
3.372 ≈ x
simplify expression
Algebra II Indicators p. 77 Answer Key
Notes4.01
A. 170; y = 0.5x2 - 1.5x
B. Both sets of data are decreasing over
time, flattening out for the last several
Olympics.
The women’s performance have
improved more over the domain shown.
Training, health and nutrition, and
increased number of swimmers
competing are a few independent
variables affecting the swimmers’
performances.
Men: y = 337.1(0.9956)x
(x = 24 for 1924)
Women: y = 399.5(0.9946)x
(x = 24 for 1924)
Women showed the greater
improvement, 118.35 seconds compared
to the men’s 83.61 seconds, within the
domain shown.
Accoring to the models: men (2004,
216.58), women (2004, 232.20)
The actual results at the 2004 Athens
Olympics: men, 223.10; women, 245.34.
According to the models, the winning
woman at the 2068 or 2072 Olympics
(depends how much you round off
constants in the algebraic model) will
outpreform her male counterpart.
Reality may be a different matter. It
certainly would be an appropriate topic
to address in conjuction with Health/PE,
Anatomy/Physiology, Allied Health
Sciences, Biomedical Technology, or
Sports Medicine classes.

Algebra II Indicators p. 78 Answer Key
NotesC. y = 0.008x - 0.481 (x = 58 for 1958);
(2005, 0.38)
According to the model, first class
postage increases $0.008 annually.
Technology, fuel, and labor costs are
independent variables that affect postage
rates.

Algebra II Indicators p. 79 Answer Key
Notes4.02
A. For ther domain given, the quadratic
best-fit for Imports appears to fit the best
and the correlation coefficient compares
favorably to the exponential (0.9983
compared to 0.9786). Imports:
y = 0.883x2 - 118.696x + 4037.4
(x = 70 for 1970)
Imports: Exponential Best Fit
Imports: Quadratic Best Fit

Algebra II Indicators p. 80 Answer Key
NotesFor ther domain given, the quadratic
best-fit for Exports appears to fit the best
and the correlation coefficient compares
favorably to the exponential (0.9935
compared to 0.9809). Exports:
y = 0.691x2 - 94.406x + 3286.6
(x = 70 for 1970)
Trade was balanced, according to the
best models, in 1972.
Exports: Exponential Best Fit
Exports: Quadratic Best Fit

Algebra II Indicators p. 81 Answer Key
NotesB. The exponential and quadratic curves of
best fit both appear to fit the data well.
The coorelation coefficients are virtually
the same, 0.9980 and 0.9986
respectively. The graph of the residuals
shows both curves fitting well, although
the quadratic has one distinctly bigger
“bump”. The exponential model,
y = 0.394(1.0144)x (x = 0 for 1790),
predicts the 2000 population most
accurately (7.923 million estimated
versus 8.049 million actual).
Exponential Best Fit
Quadratic Best Fit
Exponential Residuals
Quadratic Residuals

Algebra II Indicators p. 82 Answer Key
NotesC. Since the function is always decreasing,
an exponential best-fit is probably the
best model.
y = 23200(0.619)x
(x = 6 for September 6). According to
the model, 38.1% of the customers have
their power restored daily. Power
restored to all customers (<1000) on
September 21.
D. Within the domain provided, the data
increases and then decreases, hence a
quadratic curve as the choice for the best
fit curve.
y = -0.4786x2 + 79.67x - 619.36
(x = 0 for 1900)
According to the model, US petroleum
reserves will be exhausted by 2058-59.
Technology, price, and political/eco-
nomic situations in other petroleum
producing countries are some variables
that affect production.
For 1859, x = -61, the model provides
irrelevant data. The data can be adjusted
to include 1859 (x= 0 for 1859) with the
petroleum production for that year. It
appears there will be no simple algebraic
model for the data

Algebra II Indicators p. 83 Answer Key
Notes4.03
A. Solve 144 = 106.3R12 for R to find the
growth rate for the domain identified.
(R = 1.0256)
Solve 144Rx = 281.4 for x to determine
how long until all Americans are
connected.
x = 26.5 months (October 2002).
B. Solve 44568 = 20102R50 for R to find
the annual family income growth.
(R = 1.016)
Solve 44568Rx = 50000 for x to deter-
mine how for family median income to
reach $50,000. x = 7.2 years (2004).
C. 3454(1.0448)3 = $3939.33
Solve 4500 = 3454(1.0448)x for x to
determine how long it will take tuition to
reach $4500 at the growth rate indicated.
x = 6.0 years (2010-11)

Algebra II Indicators p. 84 Answer Key
Notes4.04
A. Total Value of Goods =
242.8 271.6 290.1 320.0 331.1
46.1 57.3 63.5 75.5 85.5
50.9 59.2 62.4 67.6 76.5
172.7 187.8 182.8 187.2 179.9
100.3 108.4 131.1 157.3 173.7
Balance of Trade =
-14.0 -17.2 -21.7 -16.4 -18.5
-27.5 -33.7 -39.5 -49.7 -56.9
-12.5 -14.4 -15.4 -18.6 -23.2
-65.7 -59.2 -47.6 -56.2 -64.1
1.3 -15.8 -17.5 -14.5 -15.7
B.
1+ a 3 + a 2 + a
2 + b 4 + b 5 + b
;
1+ a 3 + a 2 + a
2 + b 4 + b 5 + b
;
4 6 5
8 10 11
;
1 5 3
2 6 8

Algebra II Indicators p. 85 Answer Key
NotesC.
2 0
0 3
=
1 3 2
2 4 5
2 6 4
6 12 15
D.
21 3 2
2 4 5
7 7 7
1 1 1
+
− − −
or
21 3 2
2 4 5
7 0
0 1
1 1 1
1 1 1
+
−
E.
−
1 0
0 1;
1 0
0 1−
F.
1 3 2
2 4 5
9 0
0 6
1 1 1
1 1 1
+
−−