100-NR-2 Apatite Treatability Test FY09 Status: High ... · High-Concentration...
134
PNNL-19572 Prepared for the U.S. Department of Energy under Contract DE-AC05-76RL01830 100-NR-2 Apatite Treatability Test: High-Concentration Calcium-Citrate- Phosphate Solution Injection for In Situ Strontium-90 Immobilization FINAL REPORT VR Vermeul JE Szecsody BG Fritz MD Williams JS Fruchter September 2010
Transcript of 100-NR-2 Apatite Treatability Test FY09 Status: High ... · High-Concentration...
PNNL-19572
Prepared for the U.S. Department of Energy under Contract DE-AC05-76RL01830
100-NR-2 Apatite Treatability Test: High-Concentration Calcium-Citrate-Phosphate Solution Injection for In Situ Strontium-90 Immobilization FINAL REPORT VR Vermeul JE Szecsody BG Fritz MD Williams JS Fruchter September 2010


PNNL-19572
100-NR-2 Apatite Treatability Test: High-Concentration Calcium-Citrate-Phosphate Solution Injection for In Situ Strontium-90 Immobilization FINAL REPORT VR Vermeul JE Szecsody BG Fritz MD Williams JS Fruchter September 2010 Prepared for the U.S. Department of Energy under Contract DE-AC05-76RL01830 Pacific Northwest National Laboratory Richland, Washington 99352


iii
Summary
Following an evaluation of potential strontium-90 (90Sr) treatment technologies and their applicability under 100-NR-2 hydrogeologic conditions, the U.S. Department of Energy (DOE), Fluor Hanford, Inc. (now CH2M Hill Plateau Remediation Company [CHPRC]), Pacific Northwest National Laboratory, and the Washington State Department of Ecology agreed that the long-term strategy for groundwater remediation at the 100-N Area should include apatite as the primary treatment technology. This agreement was based on results from an evaluation of remedial alternatives that identified the apatite permeable reactive barrier (PRB) technology as the approach showing the greatest promise for reducing 90Sr flux to the Columbia River at a reasonable cost. This report documents work completed to date on developing a high-concentration amendment formulation and initial field-scale testing of this amendment solution.
The general approach for developing an in situ remedial technology for sequestering 90Sr in groundwater through the formation of calcium-phosphate mineral phases (i.e., apatite) was documented in a project-specific treatability test plan that provides a detailed discussion of test objectives and outlines the technical approach for developing and deploying the technology. Activities completed to date in support of the 100-NR-2 apatite treatability test that have been reported in previous documents include 1) laboratory-scale studies, 2) pilot-scale field testing with a low-concentration solution, 3) initial treatment of a 91-m (300-ft) -long PRB section with the low-concentration formulation, and 4) analysis of sediment samples collected following low-concentration treatment to determine whether any apatite had formed. A high-concentration amendment solution was formulated to maximize apatite formation within the targeted treatment zone while minimizing the short-term increases in 90Sr concentration associated with injecting high-ionic-strength solutions.
The original concept for field-scale deployment of the apatite PRB technology involved injecting a low-concentration, apatite-forming solution, followed by higher concentration injections as required to emplace sufficient treatment capacity to meet remedial objectives. The low-concentration injections were designed to provide a small amount of treatment capacity, thus stabilizing the 90Sr residing within the treatment zone while minimizing 90Sr mobilization because of the injection of high-ionic-strength solutions. In theory, this approach would act to minimize 90Sr mobilization during subsequent high-concentration injections. However, results from the low-concentration field testing with a formulation containing stoichiometric calcium and phosphate concentrations for apatite precipitation and subsequent laboratory studies aimed at optimizing the amendment formulation determined that modifying the solution to a calcium-poor formulation was a better approach for maximizing apatite formation while minimizing short-term increases in 90Sr concentration. This modified formulation, which relies more heavily on calcium naturally present in the aquifer sediments as a source for apatite formation, was used during the high-concentration treatments documented in this report and will likely be used in all future PRB injection operations in the saturated zone without low-concentration pretreatment.
In June and July 2008, high-concentration apatite solution injections were performed in support of the initial phase of barrier-emplacement operations (i.e., post-low-concentration pretreatment) for the 91-m (300-ft) -long apatite PRB section. Injection operations were conducted in 16 wells, the original 10 injection wells completed over the Hanford formation and upper contaminated portion of the Ringold Formation and 6 additional Ringold-only injection wells. Design criteria for the high-concentration injection operations were based on 1) amendment volume and mass injected, 2) amendment arrival at
iv
adjacent wells, 3) water-level elevation during treatment, and 4) injection rate limitations associated with well plugging. An evaluation of compliance with these injection design criteria was used to assess operational performance and identify candidate wells for supplemental treatment. Injection design criteria were not fully met at 8 of the 16 injection well locations with the primary deficiency at 4 of 8 locations being the limited vertical extent of Hanford formation treatment due to low-river-stage conditions during the injection. Wells whose extent of treatment did not meet design criteria should be considered for retreatment, or at a minimum, be placed on a watch list to identify premature 90Sr breakthrough in a timely manner.
Although injection design criteria were not fully met at a significant number of well locations, aqueous performance assessment monitoring data collected to date indicate good barrier performance. The average reduction in 90Sr concentrations at the four compliance monitoring locations was 95% relative to the high end of the baseline range and 84% relative to the low end of the baseline range, indicating that the performance objective specified in the treatability test plan (90% reduction in 90Sr concentration) was being met approximately 1 year after treatment. Consideration of these performance assessment data in conjunction with the observed operational performance deficiencies provides evidence that the apatite PRB technology may be relatively robust and capable of performing effectively under the geohydrologic and geochemical heterogeneities present at field scale.
In addition to aqueous performance assessment monitoring results, sediment core samples were collected in November 2009, approximately 1 year after the high-concentration treatments, and analyzed to quantify the amount of apatite that was formed from the barrier-emplacement operations completed to date. Apatite amendment arrival responses observed during treatment operations indicate that target PO4 concentrations were generally met or exceeded within the saturated portion of the Hanford formation, while Ringold Formation wells were generally at or below the established performance metric of 20 to 30% concentration at a radial distance of 30 ft (i.e., at adjacent injection wells). Results from post-treatment sediment core analyses indicate that the processes that account for the observed reduction in aqueous 90Sr concentrations include: 1) incorporation of 90Sr into apatite (about 39.4% of the total 90Sr mass in the core), 2) ion exchange flushing due to the Ca-citrate-PO4 solution injection (about 47% of the mass), and 3) a small increase in 90Sr adsorbed to sediment and apatite precipitate. The amount of 90Sr incorporated in apatite was quantified (39.4%), which is no longer considered mobile (i.e., not aqueous or adsorbed). Over years to decades, additional 90Sr will incorporate into the apatite structure. Pre-injection conditions indicate that 90% of the 90Sr was adsorbed to sediment ion exchange sites. Core analysis results were generally consistent with operational monitoring results and indicate that larger injection volumes are needed for effective Ringold Formation treatment.
Development of the final injection approach for full-scale deployment of the apatite PRB technology considered the following design criteria: 1) emplacing sufficient apatite to meet long-term remedial objectives, 2) limiting permeability reduction by emplacing only the apatite content needed to meet remedial objectives, 3) limiting short-term increases in 90Sr concentration associated with injecting high-ionic-strength solutions, and 4) reducing implementation costs. Recommended operational changes during future barrier expansion injections are provided in the Summary and Conclusions section.

v
Acronyms and Abbreviations
ACS American Chemical Society °C degree(s) Celsius BHI Bechtel Hanford, Inc. CERCLA Comprehensive Environmental Response, Compensation, and Liability Act CHPRC CH2M Hill Plateau Remediation Company Ci curie(s) cm2 square centimeter(s) cm3 cubic centimeter(s) DOE U.S. Department of Energy DOE/RL U.S. Department of Energy, Richland Operations FCC Food Chemicals Codex ft foot (feet) FW formula weight FY fiscal year g gram(s) gpm gallon(s) per minute hr hour(s) ITRD Innovative Treatment and Remediation Demonstration Program kg kilogram(s) km kilometer(s) L liter(s) LWDF liquid waste disposal facility m meter(s) mg milligram(s) mg/L milligram(s) per liter mi mile(s) mM millimolar mmol millimole(s) OU operable unit pCi/L picocurie(s) per liter ppm parts per million PRB permeable reactive barrier PRD Priest Rapids Dam 90Sr strontium-90 SpC specific conductance USP United States Pharmacopeia

vii
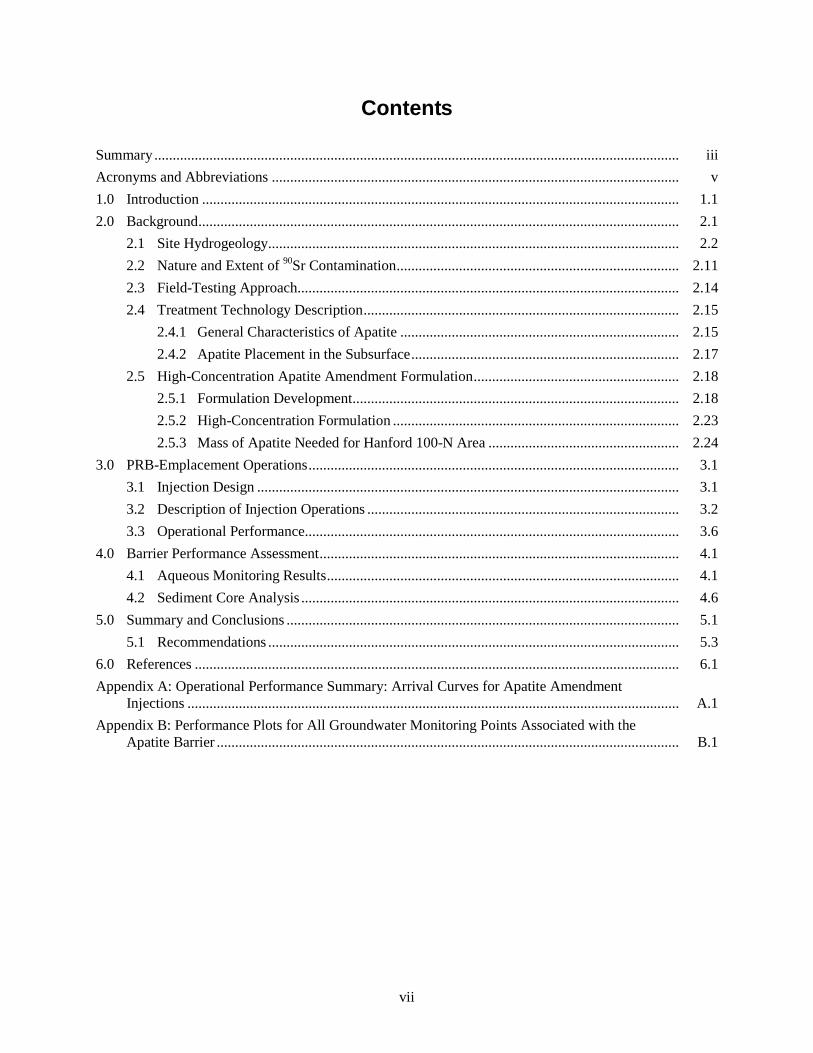
Contents
Summary ............................................................................................................................................... iii Acronyms and Abbreviations ............................................................................................................... v
1.0 Introduction .................................................................................................................................. 1.1
2.0 Background ................................................................................................................................... 2.1
2.1 Site Hydrogeology................................................................................................................ 2.2
2.2 Nature and Extent of 90Sr Contamination ............................................................................. 2.11
2.3 Field-Testing Approach ........................................................................................................ 2.14
2.4 Treatment Technology Description ...................................................................................... 2.15
2.4.1 General Characteristics of Apatite ............................................................................ 2.15
2.4.2 Apatite Placement in the Subsurface ......................................................................... 2.17
2.5 High-Concentration Apatite Amendment Formulation ........................................................ 2.18
2.5.1 Formulation Development ......................................................................................... 2.18
2.5.2 High-Concentration Formulation .............................................................................. 2.23
2.5.3 Mass of Apatite Needed for Hanford 100-N Area .................................................... 2.24
3.0 PRB-Emplacement Operations ..................................................................................................... 3.1
3.1 Injection Design ................................................................................................................... 3.1
3.2 Description of Injection Operations ..................................................................................... 3.2
3.3 Operational Performance ...................................................................................................... 3.6
4.0 Barrier Performance Assessment .................................................................................................. 4.1
4.1 Aqueous Monitoring Results ................................................................................................ 4.1
4.2 Sediment Core Analysis ....................................................................................................... 4.6
5.0 Summary and Conclusions ........................................................................................................... 5.1
5.1 Recommendations ................................................................................................................ 5.3
6.0 References .................................................................................................................................... 6.1
Appendix A: Operational Performance Summary: Arrival Curves for Apatite Amendment Injections ...................................................................................................................................... A.1
Appendix B: Performance Plots for All Groundwater Monitoring Points Associated with the Apatite Barrier .............................................................................................................................. B.1

viii
Figures
1.1. Index Map for the Hanford Site in South-Central Washington ................................................... 1.21.2. 100-N Area Groundwater Monitoring Wells (from Hartman et al. 2007) .................................. 1.31.3. Aquifer Tubes, Seep Wells, and Monitoring Wells on 100-N Area Shoreline Showing the
Location of the Initial 300-ft-long Apatite Barrier Section ......................................................... 1.42.1. Aerial Photo of the Treatability Test Site Location in 2003 ....................................................... 2.22.2. 100-N Area Site Conceptual Model in Cross Section ................................................................. 2.32.3. Map of the 100-N Area Apatite Treatability Test Plan Site ........................................................ 2.52.4. 90Sr Profiles from Three Boreholes Along the 100-N Area Apatite Treatability Test Site ......... 2.62.5. Pilot Test Site 1 (around well 199-N-138) .................................................................................. 2.72.6. Pilot Test Site 2 (around well 199-N-137) .................................................................................. 2.82.7. Geologic Cross Section Updated Based on Data Collected During Installation of Injection
and Compliance Monitoring Wells in 2006 ................................................................................ 2.92.8. Map of the 100-N Area Water Table, April 2006 ....................................................................... 2.102.9. Average 90Sr Concentrations in 100-N Area, Upper Part of Unconfined Aquifer for
September 2006 ........................................................................................................................... 2.122.10. 90Sr Distributions Along 100-N Area Shoreline, September 2006 .............................................. 2.132.11. Cation and Anion Substitution in Apatite ................................................................................... 2.162.12. 90Sr Aqueous and Ion Exchangeable Fraction in 100-N Area Sediments with no Apatite
Addition (diamonds) and with Ca-Citrate-PO4 Solution Addition (squares) to Form Apatite .... 2.172.13. Sr Aqueous Peak (a) and 30-Day (b) Concentrations During Ca-citrate-PO4 Solution
Injection into 1-D Sediment Columns ......................................................................................... 2.202.14. Sr Aqueous Concentration in 1-D Column During Sequential Injection of (a) Low
Ca-citrate-PO4 Solution, Followed by a 1-Year Wait and then (b) High-Concentration Solution Injection ........................................................................................................................ 2.21
2.15. Sr and Calcium Aqueous Peak (a) and 30-Day (b) Concentrations During Ca-Citrate-PO4 Sequential Solution Injection into 1-D Sediment ........................................................................ 2.22
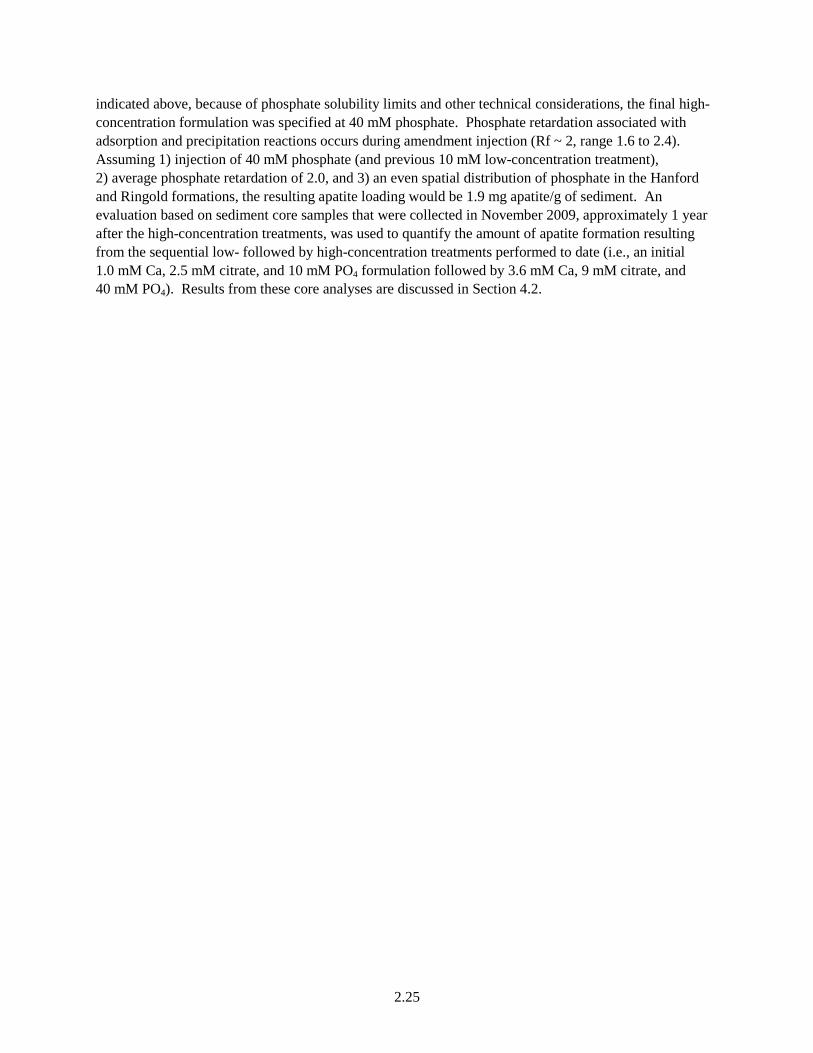
3.1. Columbia-River-Stage Conditions During Barrier-Emplacement Operations ............................ 3.34.1. Performance Monitoring Plots for Compliance Monitoring Well 199-N-122 ............................ 4.24.2. Performance Monitoring Plots for Compliance Monitoring Well 199-N-123 ............................ 4.24.3. Performance Monitoring Plots for Compliance Monitoring Well 199-N-146 ............................ 4.34.4. Performance Monitoring Plots for Compliance Monitoring Well 199-N-147 ............................ 4.34.5. Performance Monitoring Plots for Hanford-Inclusive Injection Well 199-N-142 ...................... 4.44.6. Performance Monitoring Plots for Hanford-Inclusive Injection Well 199-N-145 ...................... 4.44.7. Performance Monitoring Plots for Ringold-Only Injection Well 199-N-160 ............................. 4.54.8. Performance Monitoring Plots for Ringold-Only Injection Well 199-N-164 ............................. 4.54.9. Monitoring Wells and Coreholes Near N-137 (b) ...................................................................... 4.74.10. Borehole Data for N-368, N369, and N-370 Showing 90Sr (pCi/g), PO4 (mg/g), and Grain
Size < 4 mm ................................................................................................................................ 4.9
ix
Tables
3.1. Injection Start and Stop Times for Initial High-Concentration Barrier-Emplacement Operations ................................................................................................................................... 3.2
3.2. Average River Stage During Injection Operations and 1-Week Reaction Period at each Well Location (Ringold-only injection wells highlighted in gray) ............................................. 3.3
3.3. Operational Data Summary for High-Concentration Injections at 16 Injection Well Locations ..................................................................................................................................... 3.4
3.4. Summary of Operational Data Presented as a Percentage of the Design Specification .............. 3.53.5. Pressure Buildup Observations and Associated Injection Rate Limitations Encountered
During Barrier-Emplacement Operations (Ringold-only injection wells highlighted in gray) ... 3.53.6. Final Concentrations of Specific Conductance Measurements and Amendment Arrival at
Adjacent Monitoring Locations (9.1-m [30-ft] radial distance unless otherwise noted) as a Percentage of the Injection Solution Concentration .................................................................... 3.7
3.7. Operational Performance Summary Assessing Compliance with Injection Design Criteria (well locations where design criteria were not fully met are highlighted in green) .................... 3.8
4.1. Percent Reduction in 90Sr Concentration ..................................................................................... 4.64.2. Surveyed Location of Groundwater Injection Boreholes ............................................................ 4.74.3. Measured Phosphate Mass Near N-137 ...................................................................................... 4.8


1.1
1.0 Introduction
Efforts to reduce the flux of strontium-90 (90Sr) to the Columbia River from past-practice liquid waste disposal sites have been underway since the early 1990s in the 100-N Area of the U.S. Department of Energy’s (DOE’s) Hanford Site in south-central Washington State (Figure 1.1 and Figure 1.2). Terminating all liquid discharges to the ground in 1993 was a major step toward meeting this goal. However, 90Sr adsorbed on aquifer solids beneath the liquid waste disposal sites and extending beneath the near-shore riverbed remains a continuing source to groundwater and the Columbia River. Researchers realized from the onset that the initial pump-and-treat system was unlikely to be an effective long-term solution because of the geochemical characteristics of 90Sr; subsequent performance monitoring has substantiated this concern. Accordingly, the first Comprehensive Environmental Response, Compensation, and Liability Act of 1980 (CERCLA 1980) 5-year review re-emphasized the need to pursue alternative methods to reduce impacts on the Columbia River.
After evaluating potential 90Sr treatment technologies and their applicability under 100-NR-2 hydrogeologic conditions and presenting the Evaluation of 90Sr Treatment Technologies for the 100 NR-2 Groundwater Operable Unit(a
The general approach for developing an in situ remedial technology for sequestering 90Sr in groundwater through the formation of calcium-phosphate mineral phases (i.e., apatite) was documented in a project-specific treatability test plan (DOE/RL 2006). This document includes a detailed discussion of test objectives and outlines the technical approach for developing the technology, up to and including field-scale deployment of a 91-m (300-ft) -long PRB section. Activities completed to date in support of the 100-NR-2 apatite treatability test that have been reported in previous documents include:
) at the December 8, 2004, public meeting, DOE, Fluor Hanford, Inc. (now CH2M Hill Plateau Remediation Company [CHPRC]), Pacific Northwest National Laboratory, and the Washington State Department of Ecology agreed that the long-term strategy for groundwater remediation at the 100-N Area should include apatite sequestration as the primary treatment technology. This agreement was based on results from evaluating remedial alternatives that identified the apatite permeable reactive barrier (PRB) technology as the approach showing the greatest promise for reducing 90Sr flux to the Columbia River at a reasonable cost. In July 2005, aqueous injection (i.e., introducing apatite-forming chemicals to the subsurface through standard injection wells) was endorsed as the interim remedy and selected for treatability testing.
• Laboratory-scale studies were performed to 1) demonstrate in situ apatite formation and 90Sr sequestration proof-of-principle, 2) characterize the apatite formation and 90Sr sequestration mechanisms important to development of a pilot field-scale test design, and 3) optimize calcium-citrate-phosphate (Ca-citrate-PO4) amendment formulation to achieve site remedial objectives. Bench-scale development work is documented by Szecsody et al. (2007).
(a) Fluor Hanford, Inc. and CH2M HILL Hanford Group. 2004. Evaluation of Strontium-90 Treatment
Technologies for the 100-NR-2 Groundwater Operable Unit. Letter Report available online at http://www.washingtonclosure.com/projects/endstate/risk_library.html#narea.

1.2
Figure 1.1. Index Map for the Hanford Site in South-Central Washington. The 100-N Area is located on
the northern portion of the site along the Columbia River.
1.3
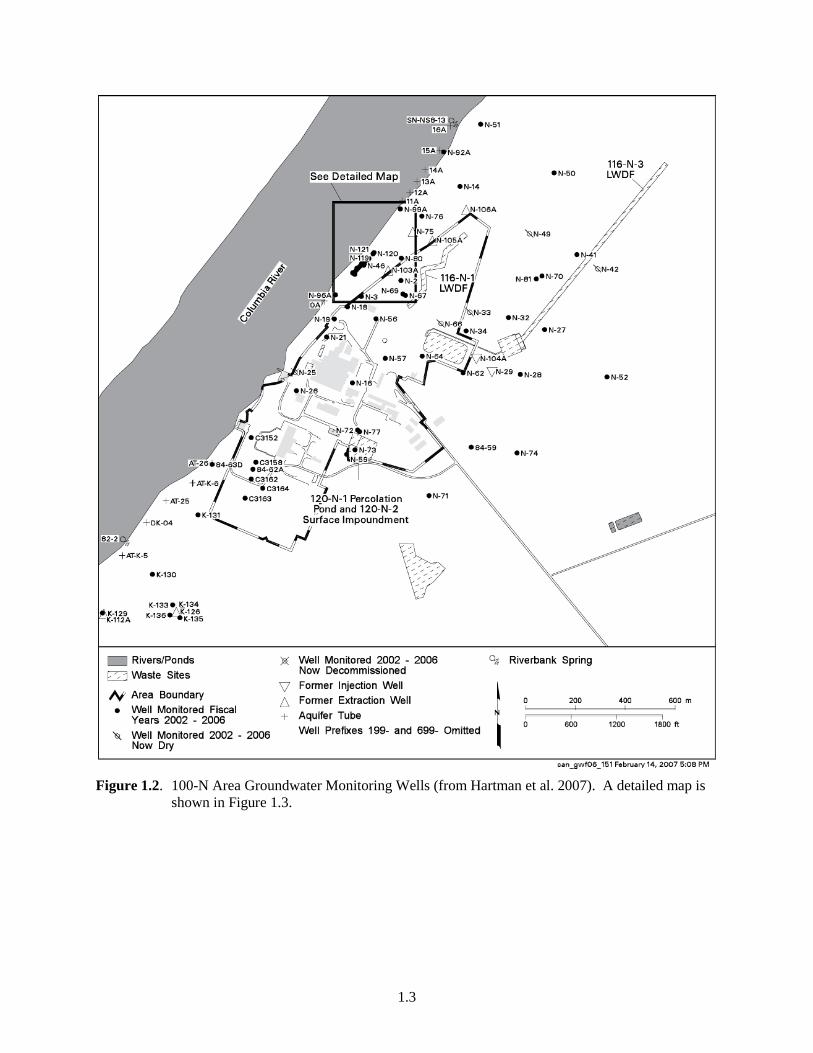
Figure 1.2. 100-N Area Groundwater Monitoring Wells (from Hartman et al. 2007). A detailed map is
shown in Figure 1.3.
1.4
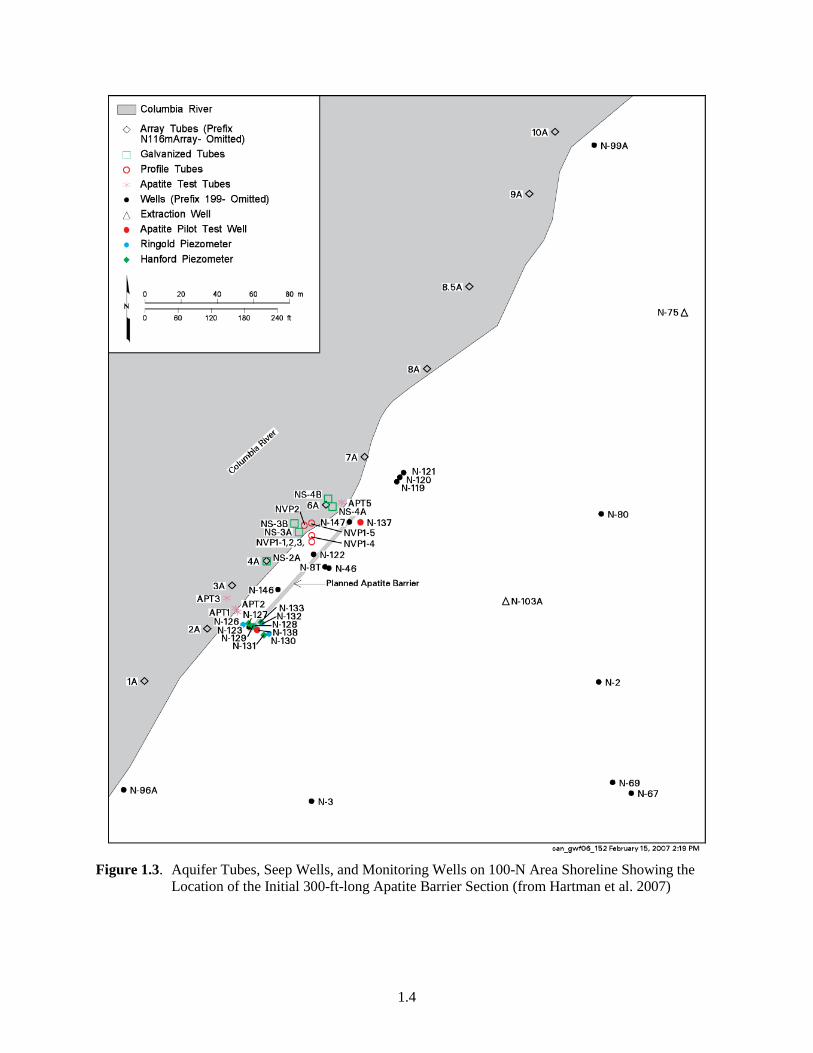
Figure 1.3. Aquifer Tubes, Seep Wells, and Monitoring Wells on 100-N Area Shoreline Showing the
Location of the Initial 300-ft-long Apatite Barrier Section (from Hartman et al. 2007)

1.5
• Two pilot-scale field tests of the technology were conducted, one at each end of the 91-m (300-ft) -long PRB section, to characterize field-scale geohydrologic/geochemical conditions and assess the upscaling of laboratory results to actual field site conditions. Results from these pilot tests were used to refine the injection design for the remaining injections wells used to emplace the 91-m (300-ft) -long PRB section. The pilot-scale testing activities were reported by Williams et al. (2008).
• Initial treatment of the 91-m (300-ft) -long PRB section was performed using a low-concentration formulation and injection operations design that was based on results from the previous laboratory- and pilot-scale test results. The low-concentration Ca-citrate-PO4 amendment formulation was designed to emplace a small amount of treatment capacity (i.e., apatite formation), while minimizing any short-term increase in 90Sr concentration associated with injecting relatively high-ionic-strength solutions. A detailed description of the PRB-emplacement operations, including performance-assessment monitoring results through November 2007, is provided by Williams et al. (2008).
• Sediment core samples collected after the initial low-concentration treatments were analyzed for apatite content and compared with the apatite formation design target for this initial treatment. Although the apatite contents were small, they were sufficient to demonstrate that phosphate mineral phases had been formed with the overlap zone between adjacent wells receiving an average treatment of 110% of the targeted apatite content within the Hanford formation and 30% of the targeted apatite content within the Ringold Formation (Szecsody et al. 2009). The Ringold apatite content data, in addition to amendment arrival responses observed in available Ringold Formation monitoring wells, support the decision to install Ringold-only injection wells that were used during subsequent high-concentration treatments (and will be used in all future saturated-zone injection operations).
This report documents work completed to date on developing a high-concentration amendment formulation and initial field-scale testing of the amendment solution. The high-concentration amendment solution was formulated to maximize apatite formation within the targeted treatment zone while minimizing the short-term increases in 90Sr concentration associated with injecting high-ionic-strength solutions. Section 2.0 includes a brief discussion of pertinent background information for the site and the apatite PRB technology. It also describes the development and final formulation of the high-concentration Ca-citrate-PO4 amendment solution. Section 3.0 provides a detailed description of the pilot-scale field testing and PRB injection operations that were performed using the high-concentration Ca-citrate-PO4 amendment solution, and Section 4.0 presents performance-assessment monitoring results collected through the end of fiscal year (FY) 2009, more than 1 year after injecting the high-concentration amendment. A summary of results and conclusions is presented in Section 5.0, and cited references are listed in Section 6.0. Appendixes A and B contain operational performance summary arrival curves for apatite amendment injections and performance plots for all groundwater monitoring points associated with the apatite barrier, respectively.

2.1
2.0 Background
The Hanford Site is a DOE-owned site located in southeastern Washington State near Richland, Washington (Figure 1.1). The 100-N Area is located along the Columbia River and includes the 100-N Reactor, a DOE nuclear reactor previously used for plutonium production.
Operation of the 100-N Area nuclear reactor required the disposal of bleed-and-feed cooling water from the reactor’s primary cooling loop, the spent-fuel storage basins, and other reactor-related sources. Two crib and trench liquid waste disposal facilities (LWDFs) were constructed to receive these waste streams, and disposal consisted of percolation into the soil. The first LWDF (1301-N/116-N-1 shown in Figure 1.2 and Figure 2.1) was constructed in 1963, about 244 m (800 ft) from the Columbia River.
Liquid discharges to this LWDF contained radioactive fission and activation products, including 60Co, 137Cs, 90Sr, and tritium. Minor amounts of hazardous wastes, such as sodium dichromate, phosphoric acid, lead, and cadmium, were also part of the waste stream. When 90Sr was detected at the shoreline, a second crib and trench (1325-N LWDF/116-N-3) was constructed in 1983 farther inland, and disposal at the first LWDF was terminated. Discharges to 1325-N stopped in 1991. The LWDFs have been excavated to remove the most highly contaminated soil and backfilled.
A more complete history of groundwater contamination at the 100-N Area is provided in Hanford 100-N Area Remediation Options Evaluation Summary Report (ITRD 2001). In summary, as a result of wastewater disposal practices, soils beneath the LWDF were contaminated from the surface sediments to the lower boundary of the unconfined aquifer. A portion of the contaminants migrated to the Columbia River via groundwater. To address contamination in the 100-N Area, the area was divided into two operable units (OUs). The 100-NR-1 OU contains all the source waste sites located within the main industrial area around the 100-N Reactor and the Hanford Generating Plant, and includes the LWDF surface sediments and shallow subsurface soil. The 100-NR-2 OU contains the contaminated groundwater and aquifer.
Hartman et al. (2007) described remediation activities in the 100-N Area related to the groundwater contamination as summarized below. As part of the source waste site remediation, contaminated soil was removed from 116-N-1 LWDF to a depth of ~4.6 m (15 ft) from 2002 to 2005 and was backfilled with clean soil in 2006. Contaminated soil was also excavated and removed from 116-N-3 LWDF (Figure 1.2) to a depth of ~4.6 m (15 ft) from 2000 to 2003 and backfilled with clean soil in 2004 and 2005. From 1995 to 2006, a groundwater pump-and-treat system for 90Sr was operated in the 100-N Area under a CERCLA interim action for the 100-NR-2 OU. This pump-and-treat system was put on cold standby in 2006 because it did not meet the remedial action objectives. DOE is testing alternative groundwater remediation methods for 90Sr in the 100-N Area, which includes the apatite PRB treatability testing described in this report.

2.2
Treatability Test Site Area
1301N Crib
Figure 2.1. Aerial Photo of the Treatability Test Site Location in 2003. The 1301-N Crib has been
backfilled since this photo was taken.
2.1 Site Hydrogeology
Stratigraphic units of significance at the 100-N Area include the following:
• Elephant Mountain Member of the Columbia River Basalt Group
• Ringold Formation
• Hanford formation.
The Elephant Mountain Member is an extensive basalt unit that underlies the fluvial-lacustrine deposits of the Ringold Formation and glaciofluvial deposits of the Hanford formation. The unconfined aquifer at the 100-N Area near the shoreline is composed of gravels and sands of the Hanford and Ringold formations, as shown in Figure 2.2. The Ringold Formation is composed of several lithologic facies; of most interest at the 100-N Area is Ringold Unit E, which forms the unconfined aquifer beneath the Hanford formation, and the Ringold Upper Mud Unit, which forms the base of the unconfined aquifer.
The uppermost stratigraphic unit in the 100-N Area is the Hanford formation, which consists of uncemented and clast-supported pebble, cobble, and boulder gravel with minor sand and silt interbeds. The matrix in the gravel is composed mostly of coarse-grained sand, and an open-framework texture is common. For most of the 100-N Area, the Hanford formation extends from the ground surface to just above the water table, 5.8 to 24.5 m (19 to 77 ft) in thickness. However, some channels of Hanford formation gravels extend below the water table.

2.3
Figure 2.2. 100-N Area Site Conceptual Model in Cross Section
The uppermost Ringold stratum at the 100-N Area is Unit E, which consists of variably cemented pebble to cobble gravel with a fine- to coarse-grained sand matrix. Sand and silt interbeds may also be present. Unit E forms the unconfined aquifer in the 100-N Area and is approximately 12 to 15 m (39 to 49 ft) thick. The base of the aquifer is situated at the contact between Ringold Unit E and the underlying, much less transmissive, silty strata referred to locally as the Ringold Upper Mud, approximately 60 m (197 ft) thick.
The Hanford formation is much more transmissive than the underlying Ringold Unit E; however, due to geologic heterogeneity, the hydraulic conductivity in both units is highly variable. Typical values of 15.2 and 182 m/day (50 and 597 ft/day) have been used for modeling purposes for the Ringold and Hanford Units, respectively. Figure 2.2 depicts a cross section of the Hanford and upper Ringold Units in

2.4
the near-river environment. As illustrated in Figure 2.2, the aquifer outcrops into the Columbia River channel, and the high-river stage rises into the Hanford formation.
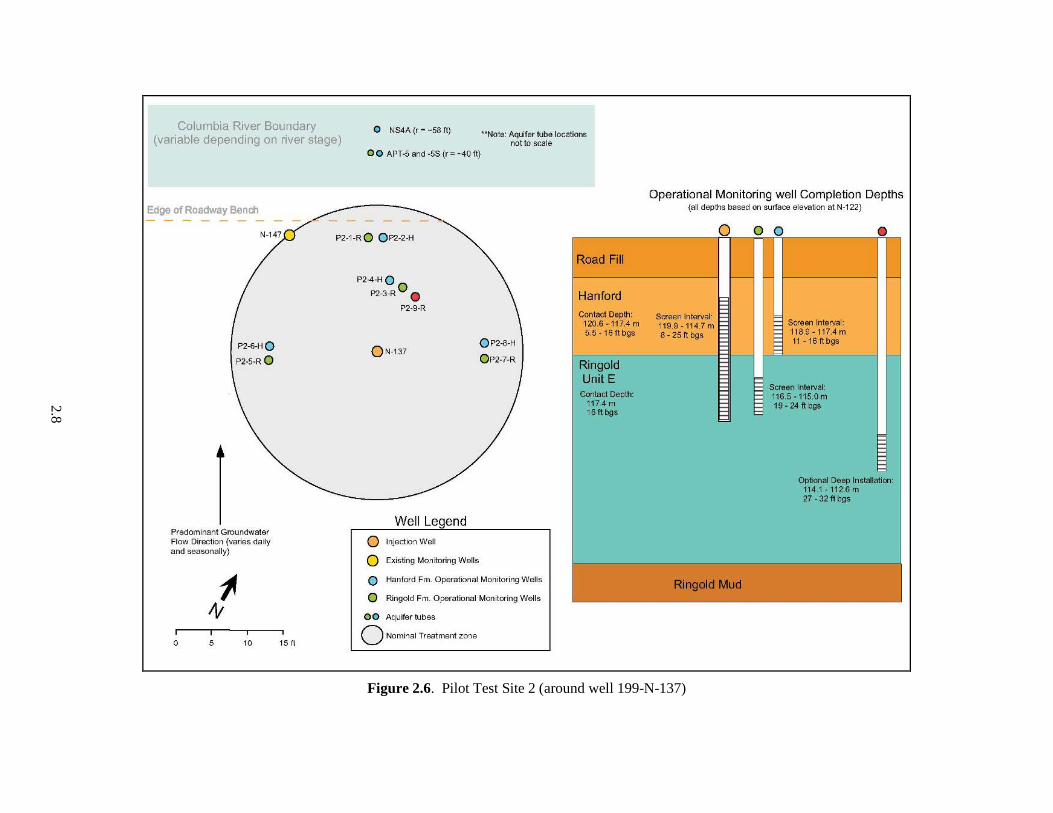
Site-specific hydrogeologic characterization data were gathered while treatability-test injection and monitoring wells were being installed. Two initial characterization wells were installed at the 100-N Area apatite treatability-test site in 2005 for detailed aquifer and sediment analysis, including depth-discrete 90Sr measurements of the sediment (wells 199-N-122 and 199-N-123; see Figure 2.3 and Figure 2.4). These wells and two additional wells installed in 2006 (199-N-146 and 199-N-147) were designated as compliance monitoring wells. Also during 2006, 10 injection wells were installed at 9-m (30-ft) intervals along the 91-m (300-ft) PRB length. Two pilot-test sites located at the upstream and downstream ends of this PRB section (Figure 2.3, Figure 2.5, and Figure 2.6), which are equipped with extensive monitoring well networks, were used for the initial injections to develop the injection design for the remaining portions of the barrier. Conducting pilot tests at both ends of the barrier helped to assess differences in hydrogeologic conditions along the PRB test section. Comparing test results from these two locations indicated that the permeability contrast between the Hanford and Ringold Formations was significantly less over the upstream-most one third of the barrier. Williams et al. (2008) estimated hydraulic conductivity for the Hanford and Ringold Formations over the upstream portion of the barrier at 12 and 10 m/day (39 and 33 ft/day), respectively. By contrast, hydraulic conductivity for the Hanford and Ringold Formations over the downstream portion of the barrier was estimated at 29 and 9 m/day (95 and 30 ft/day), respectively. It should be noted that these hydraulic conductivity estimates for the Hanford formation are significantly lower than had previously been used in 100-N Area modeling studies (Connelly 2001).
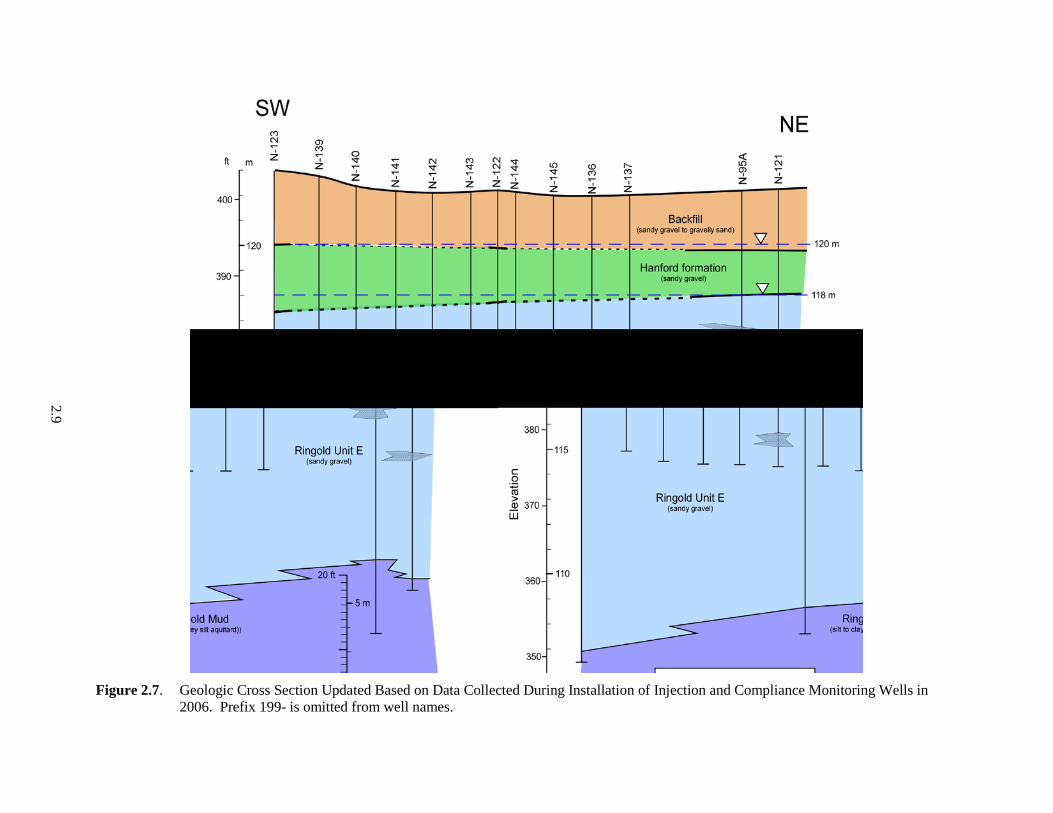
Geologic characterization data collected during well installation were used to develop a detailed geologic cross section along the 100-N Area shoreline. A southwest-to-northeast cross section through the treatability test site is presented in Figure 2.7. It should be noted that because the texture of the sediments between the upper stratigraphic units (Ringold Unit E, Hanford formation, and backfill) is so similar (i.e., sandy gravel), there is uncertainty associated with distinguishing between these units. Furthermore, the boundaries between these units are not discrete, but instead often grade into one another as a result of the sediment reworking and mixing during deposition. Although the actual backfill-Hanford-Ringold contact depth remains somewhat uncertain, the geologic conceptual model depicted in Figure 2.7 represents the working model for the site.
Groundwater flows primarily in a north-northwesterly direction most of the year and discharges to the Columbia River, as shown in Figure 2.8, which shows a local water table map constructed using April 2006 water-level data. The groundwater gradient varies from 0.0005 to 0.003. Near the LWDFs, average groundwater velocities are estimated to be between 0.03 and 0.6 m/day (0.1 and 2 ft/day) where 0.3 m/day (1 ft/day) is generally considered typical (DOE/RL 2006). However, groundwater flows near the river are significantly influenced by both diurnal and seasonal variability in the stages of the Columbia River.
Fluctuations in river stage resulting from seasonal variations and daily operations of Priest Rapids Dam (PRD), located 29 km (18 mi) upstream of 100-N Area, have a significant effect on groundwater flow direction, hydraulic gradient, and groundwater levels near the river. The volume of water moving in and out of the unconfined aquifer on both a daily and seasonal basis is an order of magnitude greater than groundwater flowing as a result of the regional hydraulic gradient. In addition, with the changing direction of groundwater flow, pore-water velocities near the river may exceed 10 m/day (32.8 ft/day)

2.5
Figure 2.3. Map of the 100-N Area Apatite Treatability Test Plan Site
(Connelly 1999). During the high-river stage, river water moves into the bank and mixes with groundwater. The zone of mixing is restricted to within tens of meters of the shoreline. During low-river stage, this bank storage water drains back into the river and may be observed as springs along the riverbank. Springs, seeps, and subsurface discharge along the riverbank are the primary pathway of 100-N Area groundwater contaminants to the Columbia River. Additional details about the extent of seasonal and daily changes in river stage at the site from PRD discharge are reported by Williams et al. (2008).
2.6
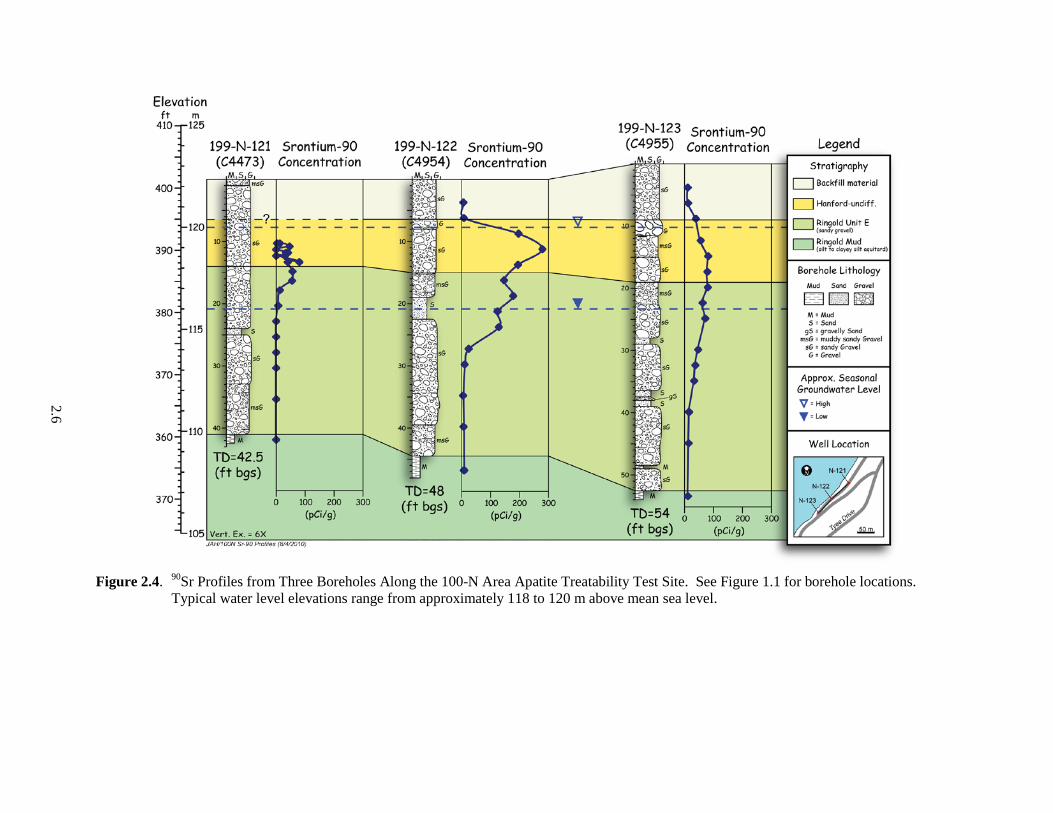
Figure 2.4. 90Sr Profiles from Three Boreholes Along the 100-N Area Apatite Treatability Test Site. See Figure 1.1 for borehole locations.
Typical water level elevations range from approximately 118 to 120 m above mean sea level.

2.7
Figure 2.5. Pilot Test Site 1 (around well 199-N-138)
2.8
Figure 2.6. Pilot Test Site 2 (around well 199-N-137)
2.9
Figure 2.7. Geologic Cross Section Updated Based on Data Collected During Installation of Injection and Compliance Monitoring Wells in
2006. Prefix 199- is omitted from well names.

2.10
Figure 2.8. Map of the 100-N Area Water Table, April 2006 (from Hartman et al. 2007)

2.11
2.2 Nature and Extent of 90Sr Contamination
Groundwater at the 100-N Area has been contaminated with various radionuclides and nonionic and ionic constituents. Contaminants of concern in the 100-NR-2 OU include 90Sr, tritium, nitrate, sulfate, petroleum hydrocarbons, manganese, and chromium (Hartman et al. 2007). Of primary concern is the presence of 90Sr in the groundwater and the discharge of 90Sr to the Columbia River via groundwater (Figure 2.9 and Figure 2.10). Although 90Sr sorbs to sediment strongly by ion exchange (retardation factor ~100 in natural groundwater) and thus moves slowly under natural gradient conditions, higher ionic strength waste streams discharged to groundwater result in more rapid migration as 90Sr is exchanged off sediment surfaces. In addition, because of its chemical similarity with calcium, 90Sr bioaccumulates in plants and animals. With a half-life of 29.1 years, it will take approximately 300 years for the 90Sr concentrations present in the subsurface at the 100-N Area to decay to below current drinking water standards.
The zone of 90Sr-contaminated soils resulting from 30 years of wastewater discharge to the LWDFs includes the portions of the vadose zone that were saturated during discharge operations and the underlying aquifer, which extends to the Columbia River (Figure 2.2). During operations, a groundwater mound approximately 6 m (20 ft) high was created. Not only was the water table raised into more transmissive Hanford Site sediments, but steeper hydraulic gradients were created, increasing the groundwater flow rate toward the river. While the 100-N Reactor was operating, riverbank seepage was pronounced. Since then, the number of springs and seeps has decreased in proportion to the decrease in artificial recharge caused by the wastewater disposal.
The majority of the estimated 1500 curies (Ci) of 90Sr remaining in the unsaturated and saturated zones in the 100-N Area as of 2003 (DOE/RL 2004) is present in the vadose zone above the aquifer. An estimated 72 Ci of 90Sr are contained in the saturated zone, and approximately 0.8 Ci are in the groundwater. This sediment-to-aqueous mass proportioning equates to a 90Sr retardation factor of approximately 100. Data from soil borings collected along the riverbank indicate that 90Sr concentrations in soil reach a maximum near the mean water table elevation and then decrease with depth (BHI 1995) (see Figure 2.2 and Figure 2.4). This vertical contaminant distribution will also be reflected in depth-discrete groundwater concentration data. Because 90Sr has a much greater affinity for sediment than for water (high Kd), its rate of transport in groundwater to the river is considerably slower than the actual groundwater flow rate. The relative velocity of 90Sr to groundwater is approximately 1:100. Under current conditions, approximately 0.14 to 0.19 Ci are released to the Columbia River from the 100-N Area annually (ITRD 2001).
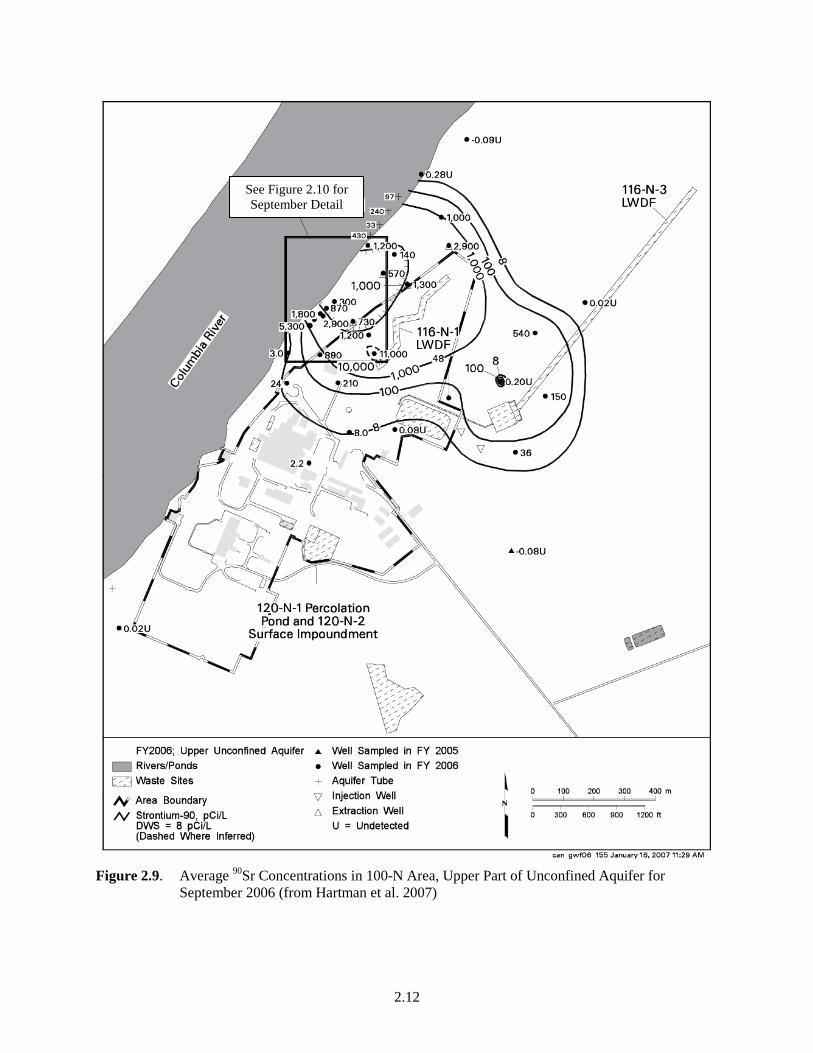
In 1995, the 90Sr groundwater plume extended approximately 400 m (1300 ft) along the length of the Columbia River between the 1000 picocuries per liter (pCi/L) contours, and approximately 800 m (2600 ft) between the 8 pCi/L (drinking water standard) contours (Connelly 1999, ITRD 2001). The highest concentrations along the shoreline were observed between wells 199-N-94 and 199-N-46. An area of “preferential flow” was identified in the Technical Reevaluation of the N-Springs Barrier Wall (BHI 1995) that encompasses 199-N-94, 199-N-95, and 199-N-46. Because of an erosional feature in the Ringold Unit, the Hanford formation dips below the water table at this location, forming a more transmissive flow path between the disposal crib and the Columbia River (see Figure 2.2 and Figure 2.4).
2.12
Figure 2.9. Average 90Sr Concentrations in 100-N Area, Upper Part of Unconfined Aquifer for
September 2006 (from Hartman et al. 2007)
See Figure 2.10 for September Detail

2.13
Figure 2.10. 90Sr Distributions Along 100-N Area Shoreline, September 2006 (from Hartman
et al. 2007)

2.14
N-Springs data from 1985 to 1991 show significantly higher concentrations of 90Sr in seep wells NS-2, NS-3, and NS-4 compared to the adjacent springs upstream and downstream (Figure 2.10) (BHI 1995). Well NS-3 and the neighboring monitoring wells 199-N-46 and 199-N-8T have currently and historically shown the highest 90Sr concentrations along the shoreline, with concentrations as high as 15,000 pCi/L observed at 199-N-46 (ITRD 2001; DOE/RL 2004). Recent clam data collected for the ecological risk assessment show that the highest concentrations of 90Sr in clams were observed along the approximately 90 m (300 ft) of riverbank that encompasses well 199-N-123 and galvanized tube locations NS-2, NS-3, and NS-4 (Figure 1.3). The previous N-Springs, aquifer tube, groundwater, and clam data (DOE/RL 2006) all indicate that treating the 91 m (300 ft) of shoreline near well 199-N-46 will address the highest concentration portion, if not the majority, of the near-shore 90Sr contamination. The targeted length of shoreline is approximately between wells NS-1 and NS-4, as shown in Figure 1.3.
The 90Sr concentrations in groundwater along the Columbia River at the 100-N Area show significant temporal variability based on measurements from aquifer tubes and compliance monitoring wells installed before the apatite treatability test. Additionally, as discussed above, there is a general spatial trend in 90Sr concentrations in the aquifer along the river, with the highest concentrations existing over the central and/or downstream portion of the 300-ft-long apatite PRB section, and concentrations decrease from this high in both the upstream and downstream directions. Because of the short time between the installation of compliance, injection, and pilot-test monitoring wells at the 100-N Area apatite treatability test site and the Ca-citrate-PO4 injections (started at the site in the spring of 2006), there were insufficient data from these wells to establish baseline conditions for 90Sr. Therefore, baseline 90Sr ranges were developed for the injection and compliance wells at the treatability test site based on gross beta concentrations from nearby aquifer tubes and limited pre-injection 90Sr monitoring from the treatability-test wells (Williams et al. 2008). These developed baseline ranges are shown on all post-treatment performance-assessment groundwater monitoring data plots for reference.
2.3 Field-Testing Approach
The original concept for field-scale deployment of the apatite PRB technology involved initial low-concentration, apatite-forming solution injections (Williams et al. 2008), followed by higher concentration injections to emplace sufficient treatment capacity to meet remedial objectives. The low-concentration injections were designed to provide a small amount of treatment capacity, thus stabilizing the 90Sr residing within the treatment zone while minimizing 90Sr mobilization as a result of injecting high-ionic-strength solutions. In theory, this approach would act to minimize 90Sr mobilization during subsequent high-concentration injections. However, results from the low-concentration field testing with a formulation containing all the calcium and PO4 needed for apatite precipitation and subsequent laboratory studies aimed at optimizing the amendment formulation (Szecsody et al. 2007; see Section 2.5 of this report for a description of the high-concentration formulation) determined that modifying the solution to a calcium-poor formulation (i.e., less calcium in the injection solution) was a better approach for maximizing apatite formation while minimizing short-term increases in 90Sr concentration. This modified formulation, which relies more heavily on calcium naturally present in the aquifer sediments as a source for apatite formation, was used during the high-concentration injections and will likely be used in all future PRB injection operations without low-concentration pretreatment.
Injections at the treatability test site were timed during high- and low-river-stage periods to focus treatment in different portions of the contaminated zone. Initially, injection wells were screened across

2.15
both the Hanford formation and upper portion of the Ringold Formation. However, based on results from the first phase of field-scale injection testing at the pilot-test sites and remaining injection locations, wells screened only across the contaminated portion of the Ringold Formation were installed for better efficiency and treatment coverage. Injections conducted during high-river-stage periods targeted Hanford formation treatment as a result of the higher permeability of this formation relative the Ringold Formation. High-river-stage injections were scheduled in an attempt to take advantage of the highest possible river-stage conditions because contaminated sediments are present above the mean water table elevation (Figure 2.6). The contaminated upper portion of the Ringold Formation was targeted during low-river-stage periods to minimize reagent flux to the Hanford formation. Permeability contrast between the Hanford and Ringold formations was significantly less over the upstream portion of the barrier (injection wells 199-N-138, -139, -140, and -141), allowing for the entire screened interval to be treated (i.e., Hanford and Ringold inclusive) with a single injection operation at high-river stage.
The operational and early monitoring results of the pilot tests were analyzed to modify the injection solution composition, injection volumes, and operational parameters. A tracer injection test and the first pilot apatite injection test (well 199-N-138) were conducted in the spring of 2006 during high-river-stage conditions. A second pilot test at a different well (199-N-137) at the downstream end of the barrier was conducted in September 2006 during low-river-stage conditions. Injections in the 10 barrier wells were conducted during two phases: the first in February-March 2007, which was supposed to target low-river-stage conditions but resulted in both low- and high-river-stage conditions, and a second phase in June-July of 2007 during high-river-stage conditions.
2.4 Treatment Technology Description
All technologies considered for 90Sr removal from groundwater at 100-NR-2 use apatite as the sequestering agent, differing only by emplacement method. This section describes apatite in general and the properties that make it a good sequestering agent, a description of the different forms of apatite commercially available that have been evaluated in bench-scale testing, and a description of the aqueous injection technology.
2.4.1 General Characteristics of Apatite
Apatite [Ca10(PO4)6(OH)2] is a natural calcium phosphate mineral occurring primarily in the Earth’s crust as phosphate rock. It is also a primary component in the teeth and bones of animals. Apatite minerals sequester elements into their molecular structures via isomorphic substitution, whereby elements of similar physical and chemical characteristics replace calcium, phosphate, or hydroxide in the hexagonal crystal structure (Hughes et al. 1989, Spence and Shi 2005). Apatite has been used for remediation of other metals, including uranium (Arey et al. 1999, Fuller et al. 2002, 2003; Jeanjean et al. 1995), lead (Bailliez et al. 2004, Mavropoulos et al. 2002, Ma et al. 1995), plutonium (Moore et al. 2005), and neptunium (Moore et al. 2003). Because of the extensive substitution into the general apatite structure (Figure 2.11), over 350 apatite minerals have been identified (Moelo et al. 2000). Strontium incorporation into apatite has also been previously studied (Smiciklas et al. 2005, Rendon-Angeles et al. 2000). Apatite minerals are very stable and practically insoluble in water (Tofe 1998, Wright 1990, Wright et al. 2004). The solubility product of hydroxyapatite is about 10-44, while quartz crystal, which is considered the most stable mineral in the weathering environment, has a solubility product (Ksp) of 10-4 (Geochem Software 1994). Strontiapatite, Sr10(PO4)6(OH)2, which is formed by the complete substitution

2.16
Ca10(PO4)6(OH)2
Pb, U, Zn, Cd, Th, Cr, Co, Na, Ni, Sr, Rb, Zr, Cs, and others
F, Cl, Br, CO3, and others
CO3, SO4, SiO4, and others
Figure 2.11. Cation and Anion Substitution in Apatite
of calcium by strontium (or 90Sr), has a Ksp of about 10-51, another 107 times less soluble than hydroxyapatite (Verbeeck et al. 1977). The substitution of strontium for calcium in the crystal structure is thermodynamically favorable and will proceed if the two elements coexist. Strontium substitution in natural apatites is as high as 11%, although dependent on available strontium (Belousova et al. 2002). Synthetic apatites have been made with up to 40% strontium substitution for calcium (Heslop et al. 2005). The mechanism (solid-state ion exchange) of strontium substitution for calcium in the apatite structure has been previously studied at elevated temperatures (Rendon-Angeles et al. 2000), and low-temperature aqueous rates under Hanford Site groundwater conditions (i.e., calcium/strontium ratio of 220/1) have also been studied (Szecsody et al. 2007, 2009).
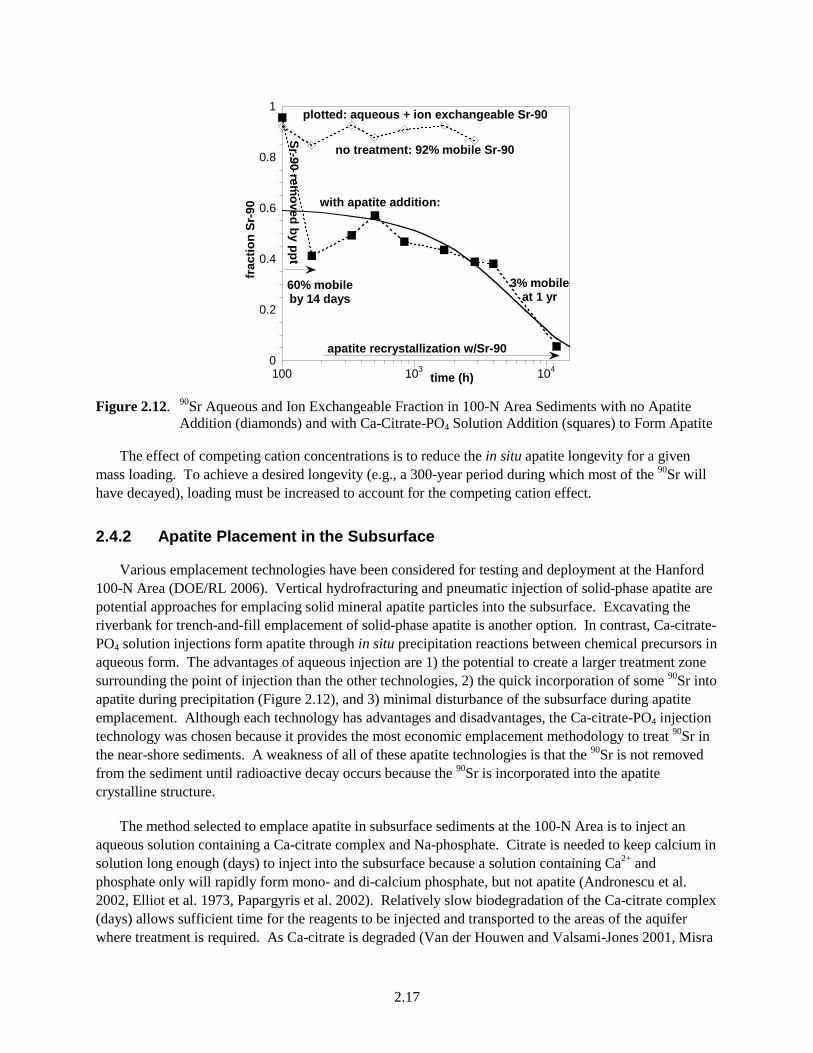
Apatite can remove soluble strontium and 90Sr from groundwater both during and after its formation. Removal can occur via precipitation of strontium in solution with PO4 anion (Figure 2.12; <300 hours), adsorption to the apatite surface (adsorption is ~55 times stronger than to Hanford sediment), and slow substitution into the apatite structure (months to years time scale). Precipitation directly from solution, or homogeneous nucleation, generally occurs only at very high metal concentrations, that is, greater than 10 parts per million (ppm). However, apatite will act as a seed crystal for the precipitation of metal phosphates at much lower concentrations (Ma et al. 1995). The apatite itself serves as a small but sufficient source of phosphate to solution, and with low concentrations of cations, such as strontium or calcium, heterogeneous nucleation occurs on the surface of the apatite seed crystal (Lower et al. 1998). Over time, the precipitated metals are sequestered into the apatite crystal matrix.
Although the rate of metal incorporation into the apatite crystal lattice can be relatively slow (on the order of months to years), the precipitation reaction is nearly instantaneous on the molecular scale. Initially, the precipitate formed is amorphous apatite; however, over time it will transform into a more stable apatite crystal.
Note that stable strontium and other competing cations in groundwater, especially the divalent transition metals (e.g., cadmium, zinc, iron, lead, and manganese), can also be incorporated in the apatite structure. The average concentrations of stable strontium and competing cations present in groundwater will dictate the mass of apatite needed for long-term sequestration. Recent experiments measuring strontium incorporation in apatite from a solution containing only calcium and strontium to groundwater (containing all transition metals) found no difference in the strontium uptake mass (Szecsody et al. 2007).
2.17
100 103 1040
0.2
0.4
0.6
0.8
1
time (h)
frac
tion
Sr-9
0
plotted: aqueous + ion exchangeable Sr-90
no treatment: 92% mobile Sr-90
with apatite addition:
60% mobileby 14 days
Sr-90 removed by ppt
apatite recrystallization w/Sr-90
3% mobileat 1 yr
Figure 2.12. 90Sr Aqueous and Ion Exchangeable Fraction in 100-N Area Sediments with no Apatite
Addition (diamonds) and with Ca-Citrate-PO4 Solution Addition (squares) to Form Apatite
The effect of competing cation concentrations is to reduce the in situ apatite longevity for a given mass loading. To achieve a desired longevity (e.g., a 300-year period during which most of the 90Sr will have decayed), loading must be increased to account for the competing cation effect.
2.4.2 Apatite Placement in the Subsurface
Various emplacement technologies have been considered for testing and deployment at the Hanford 100-N Area (DOE/RL 2006). Vertical hydrofracturing and pneumatic injection of solid-phase apatite are potential approaches for emplacing solid mineral apatite particles into the subsurface. Excavating the riverbank for trench-and-fill emplacement of solid-phase apatite is another option. In contrast, Ca-citrate-PO4 solution injections form apatite through in situ precipitation reactions between chemical precursors in aqueous form. The advantages of aqueous injection are 1) the potential to create a larger treatment zone surrounding the point of injection than the other technologies, 2) the quick incorporation of some 90Sr into apatite during precipitation (Figure 2.12), and 3) minimal disturbance of the subsurface during apatite emplacement. Although each technology has advantages and disadvantages, the Ca-citrate-PO4 injection technology was chosen because it provides the most economic emplacement methodology to treat 90Sr in the near-shore sediments. A weakness of all of these apatite technologies is that the 90Sr is not removed from the sediment until radioactive decay occurs because the 90Sr is incorporated into the apatite crystalline structure.
The method selected to emplace apatite in subsurface sediments at the 100-N Area is to inject an aqueous solution containing a Ca-citrate complex and Na-phosphate. Citrate is needed to keep calcium in solution long enough (days) to inject into the subsurface because a solution containing Ca2+ and phosphate only will rapidly form mono- and di-calcium phosphate, but not apatite (Andronescu et al. 2002, Elliot et al. 1973, Papargyris et al. 2002). Relatively slow biodegradation of the Ca-citrate complex (days) allows sufficient time for the reagents to be injected and transported to the areas of the aquifer where treatment is required. As Ca-citrate is degraded (Van der Houwen and Valsami-Jones 2001, Misra
2.18
1998), the free calcium and phosphate combine to form amorphous apatite. The formation of amorphous apatite occurs within a week, and crystalline apatite forms within a few weeks. Citrate biodegradation rates in Hanford 100-N Area sediments (water saturated) at temperatures from 10°C to 21°C (aquifer temperature 15 to 17°C) over the range of citrate concentrations to be used (10 to 100 mM) have been determined experimentally (Szecsody et al. 2009) and simulated with a first-order model (Bailey and Ollis 1986, Bynhildsen and Rosswall 1997). In addition, the microbial biomass has been characterized with depth and position along the Columbia River shoreline, and the relationship between biomass and the citrate biodegradation rate has been determined (Szecsody et al. 2007). Because Hanford 100-N Area injections typically use river water (~90 to 95%) along with the concentrated chemicals, microbes in the river water are also injected, which results in a somewhat more uniform citrate biodegradation rate in different aquifer zones.
The specific steps of this remediation technology are as follows:
• injection of Ca-citrate/PO4 solution
• in situ biodegradation of citrate resulting in apatite [Ca6(PO4)10(OH)2] precipitation and coprecipitation of 90Sr in pore fluid and solids in the treatment zone
• adsorption of 90Sr by the apatite surface (new 90Sr migrating into the treated zone from upgradient sources)
• apatite recrystallization with 90Sr substitution for calcium (permanent)
• radioactive decay of 90Sr to 90Y to 90Zr.
2.5 High-Concentration Apatite Amendment Formulation
This section contains 1) a description of the evolution of the Ca-citrate-PO4 amendment solution from a low- to a high-concentration formulation, 2) specifications for the resulting high-concentration apatite amendment formulation, and 3) a discussion of the quantity of apatite that will be required to meet remedial objectives for 90Sr sequestration at 100-NR-2.
2.5.1 Formulation Development
The original Ca-citrate-PO4 amendment formulation was based on the stoichiometric ratio of Ca:PO4 in apatite (5:3), and a Ca:citrate ratio of 1:2.5 to form the aqueous Ca-citrate complex (Moore et al. 2004, 2007). Therefore, the initial Ca-citrate-PO4 formulation contained the ratios of 4 mM Ca, 10 mM citrate, and 2.4 mM PO4. Early laboratory experiments with this formulation (and higher concentrations) did successfully precipitate apatite, but left considerable excess calcium in solution because there is a significant quantity of adsorbed Ca2+ on sediment minerals (by ion exchange) that exchanges off the surface during solution injection.
Using a Ca-citrate-PO4 solution to treat 90Sr requires injecting sufficient phosphate for treatment while avoiding negative side effects. A sufficient mass of phosphate needs to be emplaced in the aquifer to sequester 90Sr for 300 years, as defined by both mass balance (incorporation of 90Sr into apatite) and 90Sr flux rate considerations, as discussed in Section 2.5.2. However, any solution injected into the aquifer that is of higher ionic strength than groundwater will cause some desorption of 90Sr2+ (and Sr2+,

2.19
Ca2+, Mg2+...) from the sediment because 99% of the 90Sr mass is adsorbed by ion exchange on sediment minerals. The ion exchange process is a function of the concentration of monovalent and divalent cations in the solution and the total volume injected. The rate of solution injection into the sediment is also important because it influences the movement of solution components. Phosphate exhibits slow sorption and precipitation, and phosphate reactions are, therefore, sensitive to injection rate, even though cation exchange is relatively rapid and generally invariant with respect to injection rate. To better mimic field conditions, laboratory experiments using 1-m to 10-m-long one-dimensional (1-D) columns at field flow rates, followed by slow groundwater injection were used to approximate field flow conditions and evaluate different Ca-citrate-PO4 injection formulations.
The primary objectives of 1) injecting sufficient phosphate and 2) minimizing initial 90Sr mobilization were evaluated in laboratory experiments by testing different injection strategies that included the following:
• different Ca-citrate-PO4 concentrations (original 4:10:2.4 ratio of Ca:citrate:PO4)
• injection of phosphate only
• injection of citrate-PO4 (no Ca)
• sequential injection of a low, then high-concentration Ca-citrate-PO4 formula
• sequential injection with different formulations
• calcium-poor formulations
• addition of fluoride to increase the precipitation rate.
Of the injection strategies evaluated, those showing the most promise included 1) sequentially injecting low- and then high-concentration Ca-citrate-PO4 and 2) injecting a calcium-poor formulation of Ca-citrate-PO4 solution. As discussed in Section 2.3, the original concept for field-scale deployment of the apatite PRB technology was based on sequential low- and then high-concentration treatments. Because the most recent laboratory experiments demonstrated that injection of a high-concentration calcium-poor solution achieved the objectives as well as sequential low- and then high-concentration solution injections (i.e., emplacement of sufficient PO4 mass, limit short-term 90Sr mobilization), future field injections will likely use only the high-concentration, calcium-poor, solution formulation because it provides for a more cost-effective implementation approach.
Laboratory experiments testing different sequential injection strategies (described in Section 5.8 in the report by Szecsody et al. [2007]) showed that a greater amount of strontium was incorporated into apatite if a calcium-poor formulation was used. In the calcium-carbonate-saturated Hanford groundwater system, there is sufficient calcium adsorbed on the sediment by ion exchange to precipitate apatite for a 35-mM phosphate solution, assuming 100% of the Ca2+ adsorbed on the sediment would be available for the apatite precipitation. Although this calculation shows that lower calcium mass could be injected with the phosphate, the exact quantity of calcium that needs to be injected depends on the dynamics of the calcium ion exchanging off the minerals during an injection. Injection of any calcium-poor (i.e., less calclium than the 5:3 ratio of Ca:PO4) will use some Ca2+ from the sediment as well as strontium and 90Sr, which chemically behave similarly to calcium. Overusing calcium-poor Ca-citrate-PO4 solutions would eventually deplete the sediment Ca2+ content, and the phosphate would have to drift downgradient in the aquifer to a zone with some available calcium for precipitation to occur. The final low-concentration

2.20
apatite amendment formulation designed to minimize the initial 90Sr peak was a Ca-citrate-PO4 solution with a 1: 2.5:10 ratio (Szecsody et al. 2007), which is 75% depleted in the calcium needed to form apatite (i.e., 75% of the calcium used in apatite formation is desorbed from aquifer sediments).
The decrease in the short-term peak aqueous strontium concentrations and concentrations at 30 days was substantial as the formulation was changed from a Ca-citrate-PO4 ratio of 4:10:2.4 to 1:2.5:10. At the original formulation (2.4 mM PO4, ionic strength 96 mM), the peak strontium concentration was 10 times that of the initial groundwater concentration (Figure 2.13a), and the strontium concentration did not decrease by 30 days (Figure 2.13b). With the calcium-poor formulation at 4 times the amount of phosphate (1 mM Ca, 2.5 mM citrate, 10 mM PO4, ionic strength = 65 mM), the initial strontium peak aqueous concentration was 3.3 times that in groundwater, and by 30 days, it had decreased to 0.4 times that of groundwater (i.e., due to precipitation using calcium and strontium desorbed from sediment). Phosphate at 20 mM (with no calcium or citrate) injected into the sediment also had similar peak and 30-day aqueous concentrations (Figure 2.13), but was not used as a final low-concentration formulation because with no injected calcium, eventually all of the calcium in the sediment would be depleted, and the injected plume would move down gradient (i.e., the apatite would not precipitate in the zone of interest).
0.0
2.0
4.0
6.0
8.0
10.0
12.0
0 5 10 15 20
peak
con
c/gw
con
c.
Peak Sr, Ca during Ca-Citrate-PO4 Injection
SrCa
worse than gwbetter than gw
PO4 (mM)
1 mM Ca2.5 mM citrate10 mM PO4
4 mM Ca10 mM citrate2.4 mM PO4
0 mM Ca0 mM citrate20 mM PO4
0.1
1.0
10.0
0 5 10 15 20
aque
ous
conc
/gw
con
c.Aqueous Sr, C a at 30 daysafter C a-c itrate-P O 4 In jectio
S r
C a
w orse than gwbetter than gw
P O 4 (m M )
1 m M C a2.5 m M c itrate10 m M PO 4
4 m M C a10 m M citrate2 .4 m M P O 4
0 m M C a0 m M c itra te20 m M PO 4
(a) (b)
Figure 2.13. Sr Aqueous Peak (a) and 30-Day (b) Concentrations During Ca-citrate-PO4 Solution Injection into 1-D Sediment Columns. Different ratios of C:citrate:PO4 were used in these experiments.
A series of laboratory experiments was conducted to determine an appropriate high-concentration, Ca-citrate-PO4 formulation for use in the PRB-emplacement injections. As shown in Figure 2.14, a low-concentration injection followed by a 1-year wait and then a high-concentration (60 mM PO4) resulted in decreased 90Sr aqueous peak concentrations. In the initial low-concentration experiment (Figure 2.14a), the strontium peak aqueous concentration (0.5 mg/L) was 5 times that of the initial groundwater concentration (0.1 mg/L) and by 30 days had decreased to 0.28 times the initial concentration. In the second sequential injection (Figure 2.14b), the initial strontium peak aqueous concentration was 6 times that of groundwater (0.6 mg/L) and by 30 days, the aqueous concentration was 0.02 times that of groundwater.
A concentration range of 20 mM to 60 mM phosphate in Ca-citrate-PO4 solutions (with the relative ratios of Ca:citrate:PO4 of 1:2.5:10) was evaluated in laboratory experiments using sediments that were previously treated with a 10-mM phosphate solution (shown in Figure 2.14a) and allowed to incorporate

2.21
strontium for 1 year. As the phosphate concentration was increased from 10 mM to 60 mM, the peak aqueous strontium concentration (Figure 2.15a, large black diamonds) increased (i.e., strontium peak 6× to 12×). In the same experiments, the calcium peak aqueous concentrations also increased (open triangles). At phosphate concentrations greater than 30 mM, the apatite precipitation was more rapid (within hours), so precipitation was occurring in some effluent tubes (accounting for the spread in peak strontium and calcium values, Figure 2.15a). This precipitation artifact was eliminated by preacidifying the tubes to prevent precipitation (i.e., apatite dissolves under highly acidic conditions). In comparison to sequential low- and then high-concentration injections, a single high-concentration Ca-citrate-PO4 injection (squares, Figure 2.15a) shows similar strontium peak concentrations (data only at 30 and 40 mM PO4).
Figure 2.14. Sr Aqueous Concentration in 1-D Column During Sequential Injection of (a) Low
Ca-citrate-PO4 Solution, Followed by a 1-Year Wait and then (b) High-Concentration Solution Injection

2.22
0.0
2.0
4.0
6.0
8.0
10.0
12.0
0 10 20 30 40 50 60
Sr peakCa peakF peak Sr
peak
con
c/gw
con
c.
Peak Sr, Ca during Ca-Citrate-PO4 Injection
Sr for seq. injectionCa for seq. injectionSr for single high conc. inj.
worse than gwbetter than gw
PO4 (mM)
10-2
10-1
100
101
0 10 20 30 40 50 60
Sr fCa f
catio
n aq
con
c/gw
con
c.
PO 4 (m M ) in Ca-citra te-PO 4 solu tion
Sr, C a 30 D ays After In jections
worse than groundwaterbetter than groundwater
S r for seq. injectionC a for seq. in jection
(a) (b)
Figure 2.15. Sr and Calcium Aqueous Peak (a) and 30-Day (b) Concentrations During Ca-Citrate-PO4 Sequential Solution Injection into 1-D Sediment
After 30 days, substantially lower strontium and calcium aqueous concentrations were observed for the higher Ca-citrate-PO4 concentrations in the second injection (Figure 2.14b). Higher phosphate injections precipitated more rapidly, and because the solution was calcium-poor, both calcium and strontium were removed more quickly from solution.
Alternative injection strategies in addition to the sequential low- and then high-concentration Ca-citrate-PO4 formulation were also evaluated in laboratory experiments. Injecting 20-mM PO4 only (shown in Figure 2.13) produced similar peak and 30-day strontium concentrations as the calcium-poor Ca-citrate-PO4 solution. As described earlier, two disadvantages of injecting only phosphate include 1) depletion of sediment Ca2+, which would limit the total phosphate mass that could be injected, and 2) overly rapid precipitation rates that limit the lateral extent of phosphate transport. The Ca-citrate complex maintains some injected calcium as a solution complex until the citrate is biodegraded, thus limiting the apatite precipitation rate (i.e., allowing time for the solution to be injected before precipitation occurs). Injecting a single high-concentration Ca-citrate-PO4 solution (squares, Figure 2.15a) produced similar strontium peak concentration as sequential low- and then high-concentration injections and is more cost effective at the field scale. In another series of experiments, F- was added to the Ca-citrate-PO4 injection solution at 0.21-mM (drinking water limit) and at 2.1-mM concentrations. The F- addition had little effect on the initial strontium and calcium peak concentration, but increased the apatite precipitation rate, so at 30 days after the injection, both strontium and calcium concentrations were 10× or more lower than a corresponding injection experiment without F- addition.
The final high-concentration formulation (3.6 mM Ca, 9 mM citrate, 40 mM PO4) is a calcium-poor solution of sufficient phosphate mass such that two high-concentration injections will provide sufficient apatite mass for 300 years of 90Sr sequestration. The solubility limit of a single high-concentration injection is ~70 mM PO4 in a Ca-citrate-PO4 solution. The initial aqueous 90Sr peak concentration for this high-concentration injection is predicted at 6 to 12 times the initial groundwater concentration (i.e., Figure 2.15a), and once groundwater has flushed into the injection zone (i.e., approximated in Figure 2.15b), the 90Sr peak is predicted to be <1/10 the pre-injection 90Sr concentration. Based on laboratory experiments, a high-concentration formulation between 40 and 60 mM PO4 would produce similar initial 90Sr peak and post-peak aqueous concentrations (Figure 2.15), but the higher precipitation

2.23
rate of the 60-mM PO4 solution would increase the likelihood of precipitates forming in the injection systems and/or well screen and possibly limiting the lateral extent of treatment.
2.5.2 High-Concentration Formulation
Based on the bench- and field-scale treatability tests conducted to date using both low- and high-concentration apatite amendment formulations, the most favorable formulation identified for field-scale deployment of the technology consists of 3.6-mM calcium, 9-mM citrate, and 40-mM phosphate. This amendment solution was identified as the best formulation for meeting the following objectives: 1) minimize the number of injection operations required, 2) minimize short-term increases in 90Sr concentrations associated with injection of high-ionic-strength solutions, and 3) keep amendment formulations well below solubility limits to reduce the potential for operational challenges associated with solution stability. The recipe for the high-concentration apatite injection solution is as follows:
1. 9.0 mM trisodium citrate [HOC(COONa)(CH2COONa)2*2H2O] formula weight (FW) 294.1 g/mol
– also called sodium citrate dihydrate, American Chemical Society (ACS) registry 6132-04-3
– granular more soluble than powdered
– reagent-grade (quality) or equivalent for the citrate: U.S. Pharmacopeia/Food Chemicals Codex (USP/FCC), lower grades contain up to 5 ppm heavy metals
2. 3.6 mM calcium chloride (CaCl2), FW 110.98 g/mol
– reagent-grade (quality) or equivalent: certified ACS, ACS registry 10043-52-4 (lower grades can contain 20 ppm lead)
3. 32.4 mM disodium hydrogenphosphate (Na2HPO4), FW 141.96 g/mol
– also called disodium phosphate, anhydrous
– reagent-grade (quality) or equivalent: certified ACS, ACS registry 7558-79-4 (lower grades can contain extra NaOH, which is only a small problem; changes pH and ionic strength)
4. 5.6 mM sodium dihydrogenphosphate (NaH2PO4), FW 119.98 g/mol
– also called monosodium phosphate, anhydrous
– reagent-grade or equivalent: certified ACS grade, ACS registry 7558-80-7 (lower grades can contain 8 ppm arsenic and 10 ppm heavy metals)
5. 2.0 mM diammonium hydrogenphosphate [(NH4)2HPO4], FW 132.1 g/mol
– also called diammonium phosphate
– granular more soluble than powdered
– reagent-grade (quality) or equivalent: certified ACS, ACS registry 7783-28-0
6. 1.0 mM sodium bromide (NaBr), FW 102.90 g/mol (included as conservative tracer)
– reagent-grade (quality) or equivalent: certified ACS, ACS registry 7647-15-6.

2.24
2.5.3 Mass of Apatite Needed for Hanford 100-N Area
Two factors control the amount of apatite needed to sequester Sr in the Hanford 100-N Area. First, from the standpoint of mass balance, a specific amount of apatite is needed to remove all strontium and 90Sr from groundwater over the next 300 years (i.e., 10 half-lives of 90Sr decay, half-life 29.1 years). This calculation depends on the crystal substitution of strontium for calcium in apatite. If a 10% substitution is assumed, then 1.7 mg of apatite is sufficient to sequester strontium and 90Sr from the estimated 3300 pore volumes of water that will flow through an apatite-laden zone. This calculation assumes an average groundwater flow rate of 0.3 m/day (1 ft/day) and a 10-m (32-ft) apatite PRB thickness. Electron microprobe analysis of the strontium substitution in apatite precipitate (Szecsody et al. 2009) showed that after 1.3 years, there was a 16.1% substitution of strontium for calcium in microcrystalline (20- to 40-micron particles composed of <1-micron crystals) apatite, and a 9.1% substitution of strontium for calcium in crystalline apatite (20 to 40 microns, single crystal). The majority of the apatite precipitating in sediment was microcrystalline, so the assumption of a 10% substitution is achievable. The 1.7-mg apatite/g of sediment does occupy some pore space in the aquifer, which has an average field porosity of 20%. Given crystal lattice dimensions of 9.3 A by 6.89 A (assume a cylinder of dimensions 7.5 × 10⁻²¹ cm3/atom), the 1.7 mg apatite/g sediment would occupy 13.6% of the pore space, so some degree of permeability decrease would be expected.
The second factor that controls the amount of apatite needed to sequester 90Sr is the rate of incorporation. This permeable reactive barrier concept, which relies on emplacement of apatite solids in the aquifer, is viable only if the natural groundwater flux rate of strontium and 90Sr (1.36 × 10⁻⁶ mmol strontium/day/cm2) is slower than the removal rate of strontium and 90Sr by apatite. If the groundwater flow rate is too high, even highly sorbing strontium and 90Sr could advect through the apatite-laden zone more quickly than it is removed. The way to circumvent this issue is to have additional apatite in the groundwater system (i.e., greater than the amount needed based on the mass balance calculation above) to essentially remove 90Sr at an increased rate. To assess possible implementation limitations associated with the rate of 90Sr incorporation, numerous experiments were conducted to clearly define the rates at which strontium and 90Sr are incorporated into the crystal structure of apatite. Although the strontium sorption to apatite is very high (Kd = 1370 cm3/g or 55 times greater than to sediment), because the total mass of apatite is small in the system, sorption (alone) to apatite does not remove significant strontium or 90Sr mass. However, strontium incorporation into apatite does remove 90Sr from aqueous solution and ion exchange sites, so it is no longer labile in the subsurface sediments. For the initial low-concentration treatments (i.e., 10 mM PO4 injected resulting in 0.38 mg apatite/g sediment), the strontium uptake rate was 8.8 × 10⁻⁶ mmol Sr/day/cm2, or 6.5 times the average strontium groundwater flux rate (1.36 × 10⁻⁶ mmol Sr/day/cm2). Therefore, on a rate basis, all of the strontium (and 90Sr) would be consumed by the apatite in the barrier. However, for zones of higher groundwater flux (e.g., 10 to 100 times), the groundwater strontium flux rate would be expected to exceed the barrier uptake rate for this low apatite loading. In addition, this low apatite loading would not result in sufficient treatment capacity for the longevity of a 300-year barrier. At an apatite content of 1.7 mg apatite/g of sediment, the strontium uptake rate was 8.8 × 10⁻⁵ mmol Sr/day/cm2 or 65 times the average strontium groundwater flux rate (1.36 × 10⁻⁶ mmol 90Sr/day/cm2). At this apatite content (needed from a mass balance perspective), strontium and 90Sr would be incorporated into apatite more rapidly than the average groundwater flow rate and most high-flow events.
This target apatite content (1.7 mg apatite/g of sediment) corresponds to a pore volume amendment concentration, on a molar basis, of 90 mM of phosphate precipitated in sediment with no retardation. As
2.25
indicated above, because of phosphate solubility limits and other technical considerations, the final high-concentration formulation was specified at 40 mM phosphate. Phosphate retardation associated with adsorption and precipitation reactions occurs during amendment injection (Rf ~ 2, range 1.6 to 2.4). Assuming 1) injection of 40 mM phosphate (and previous 10 mM low-concentration treatment), 2) average phosphate retardation of 2.0, and 3) an even spatial distribution of phosphate in the Hanford and Ringold formations, the resulting apatite loading would be 1.9 mg apatite/g of sediment. An evaluation based on sediment core samples that were collected in November 2009, approximately 1 year after the high-concentration treatments, was used to quantify the amount of apatite formation resulting from the sequential low- followed by high-concentration treatments performed to date (i.e., an initial 1.0 mM Ca, 2.5 mM citrate, and 10 mM PO4 formulation followed by 3.6 mM Ca, 9 mM citrate, and 40 mM PO4). Results from these core analyses are discussed in Section 4.2.


3.1
3.0 PRB-Emplacement Operations
As discussed in Section 2.3, the field-testing approach adopted for implementing the apatite PRB technology involved initial pilot-scale field testing that was used to refine the injection design for subsequent barrier well treatments. This same approach was adopted during initial testing and subsequent PRB-emplacement injections that used the high-concentration, apatite amendment formulation. This section contains a description of the injection design, operations, and operational performance for the high-concentration, pilot-scale testing and PRB-emplacement injection operations.
3.1 Injection Design
Based on design analysis and chemical arrival responses observed during low-concentration, pilot-scale testing and PRB treatment operations (Williams et al. 2008) and pilot-scale field tests with the high-concentration solution, an injection volume of 120,000 gallons of apatite amendment solution was specified for each well (or Hanford/Ringold well pair). This specified volume was demonstrated to provide a sufficient radial extent of treatment at the targeted radial extent of 20 ft, resulting in effective overlap coverage between adjacent injection wells. Over the upstream-most one third of the barrier (199-N-138 and 199-N-141, Figure 2.3), a single 120,000-gallon injection was conducted to treat the Hanford and Ringold Formations simultaneously. Over the downstream portion of the barrier, two separate injection operations of approximately 60,000 gallons each were required for a targeted treatment of the Hanford and Ringold Formations. This portion of the barrier was characterized by generally higher well-specific capacity and a larger hydraulic conductivity contrast between the Hanford and Ringold Formations (with the Hanford formation hydraulic conductivity values higher relative to the upstream values). The implication of these conditions is that injections over the downstream portion of the barrier must be performed as two separate operations, one targeting the Ringold Formation, the other targeting the Hanford formation; injections were split between fully screened wells (which focus treatment predominantly on the Hanford formation) and wells screened across only the Ringold Formation.
An injection rate of 40 gpm was specified for treating the upstream portion of the barrier based on the hydraulic performance of injection wells observed during previous barrier treatment operations and injection design analyses, indicating that these rates were sufficient for effective delivery of the phosphate amendment. During treatment of the downstream portion of the barrier, an injection rate of 20 gpm was specified for both the Hanford-inclusive and Ringold-only injection wells (for a total of 40 gpm). At this rate, the treatment at each well location took ~50 hours to complete.
Both the upstream portion of the barrier and the Hanford interval over the downstream portion of the barrier requires treatment during high-Columbia-River-stage conditions to treat as high in the Hanford formation profile as possible. It was originally thought that treatment of the Ringold-only injection wells could be conducted during any river-stage condition; however, as discussed below, amendment arrival response data collected during the high-concentration injections indicate that treatment of the Ringold Formation is most effective when conducted in Ringold-only injection wells at low-Columbia-River stage. A detailed description of the injection and monitoring equipment and the aqueous sampling and analysis requirements for these barrier-emplacement operations are provided by Williams et al. (2008). A description of the high-concentration amendment formulation is provided in Section 1.5.2.

3.2
3.2 Description of Injection Operations
The section describes the high-concentration apatite solution injections conducted during the initial phase of barrier-emplacement operations (i.e., post-low-concentration pretreatment) for the 91-m (300-ft) -long apatite PRB section. Injection operations were conducted in 16 wells in June and July 2008 (Table 3.1), the original 10 injection wells completed over the Hanford formation and upper contaminated portion of the Ringold Formation, and 6 additional Ringold-only injection wells.
Injections were conducted during both low- and high-river-stage conditions (see Figure 3.1 and Table 3.2). The river elevation typically varied by as much as 1 m during the injection and reaction period. The targeted water-level elevation for full treatment of the Hanford formation sediments (i.e., the approximate contact elevation between the undisturbed Hanford formation sediments and the road fill materials) is approximately 120 m. As shown in Figure 3.1, the last two barrier-emplacement campaigns in mid to late July were conducted during river-stage conditions that were up to 2 m below this design target when only a small portion of the Hanford formation sediments were saturated. Of the 10 Hanford-inclusive injections wells, four were treated when the average water-level elevation was approximately 120 m (full Hanford treatment), two were treated to an elevation of approximately 119 m, and four were treated to an elevation of approximately 118 m (~2 m below the targeted water-level elevation).
Table 3.1. Injection Start and Stop Times for Initial High-Concentration Barrier-Emplacement Operations
Well Start Time End Time
N-137 6/4/2008 13:30 6/6/2008 14:40 N-159 6/4/2008 13:30 6/6/2008 14:40 N-136 7/14/2008 11:30 7/17/2008 1:30 N-160 7/14/2008 11:30 7/17/2008 1:30 N-145 6/26/2008 12:24 6/28/2008 17:35 N-161 6/26/2008 12:24 6/28/2008 17:35 N-144 7/22/2008 12:50 7/24/2008 15:10 N-162 7/22/2008 12:50 7/24/2008 15:10 N-143 6/30/2008 11:00 7/3/2008 13:30 N-163 6/30/2008 11:00 7/3/2008 13:30 N-142 7/14/2008 11:30 7/17/2008 22:30 N-164 7/14/2008 11:30 7/17/2008 4:00 N-141 6/26/2008 12:24 6/28/2008 17:35 N-140 7/22/2008 12:50 7/24/2008 15:10 N-139 6/30/2008 11:00 7/3/2008 13:30 N-138 6/4/2008 13:30 6/6/2008 14:30
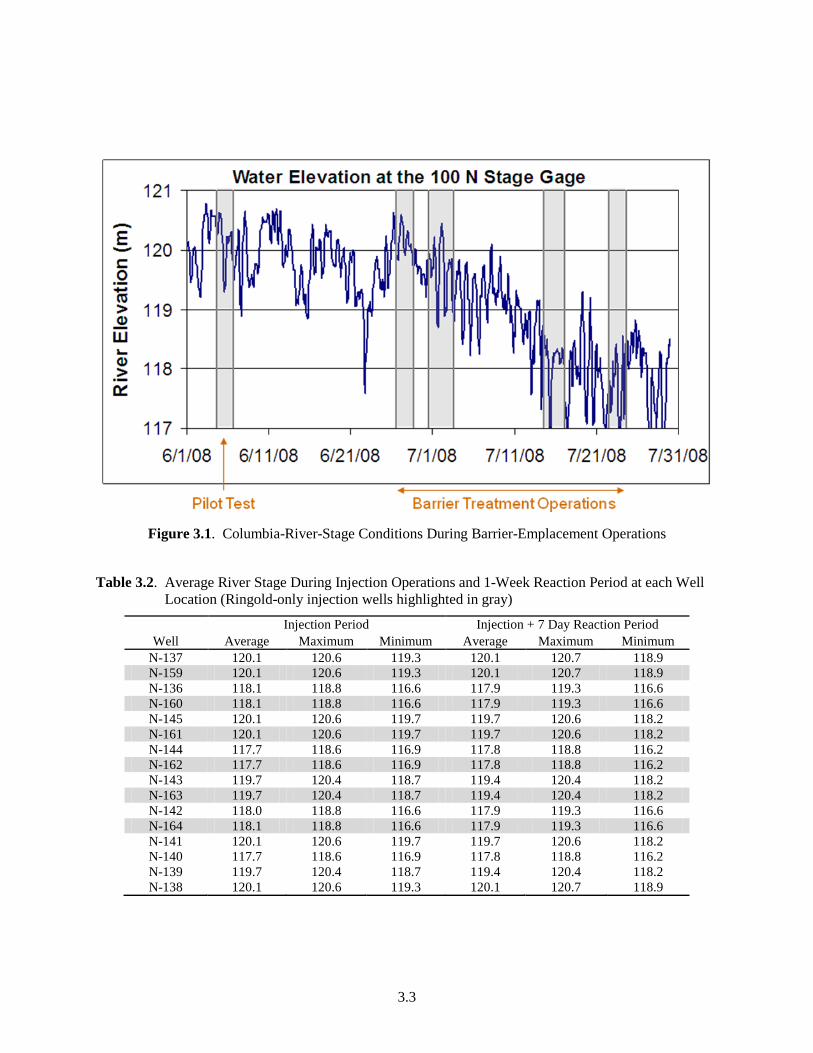
3.3
Figure 3.1. Columbia-River-Stage Conditions During Barrier-Emplacement Operations
Table 3.2. Average River Stage During Injection Operations and 1-Week Reaction Period at each Well Location (Ringold-only injection wells highlighted in gray)
Well Injection Period Injection + 7 Day Reaction Period
Average Maximum Minimum Average Maximum Minimum N-137 120.1 120.6 119.3 120.1 120.7 118.9 N-159 120.1 120.6 119.3 120.1 120.7 118.9 N-136 118.1 118.8 116.6 117.9 119.3 116.6 N-160 118.1 118.8 116.6 117.9 119.3 116.6 N-145 120.1 120.6 119.7 119.7 120.6 118.2 N-161 120.1 120.6 119.7 119.7 120.6 118.2 N-144 117.7 118.6 116.9 117.8 118.8 116.2 N-162 117.7 118.6 116.9 117.8 118.8 116.2 N-143 119.7 120.4 118.7 119.4 120.4 118.2 N-163 119.7 120.4 118.7 119.4 120.4 118.2 N-142 118.0 118.8 116.6 117.9 119.3 116.6 N-164 118.1 118.8 116.6 117.9 119.3 116.6 N-141 120.1 120.6 119.7 119.7 120.6 118.2 N-140 117.7 118.6 116.9 117.8 118.8 116.2 N-139 119.7 120.4 118.7 119.4 120.4 118.2 N-138 120.1 120.6 119.3 120.1 120.7 118.9
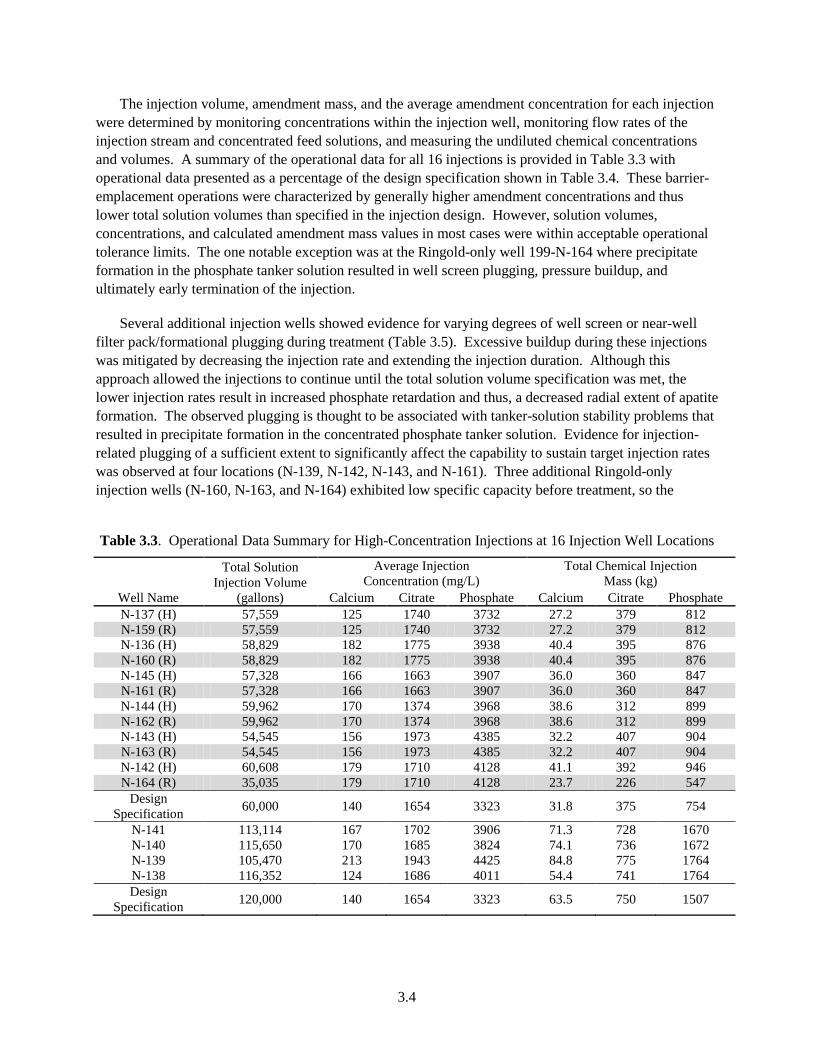
3.4
The injection volume, amendment mass, and the average amendment concentration for each injection were determined by monitoring concentrations within the injection well, monitoring flow rates of the injection stream and concentrated feed solutions, and measuring the undiluted chemical concentrations and volumes. A summary of the operational data for all 16 injections is provided in Table 3.3 with operational data presented as a percentage of the design specification shown in Table 3.4. These barrier-emplacement operations were characterized by generally higher amendment concentrations and thus lower total solution volumes than specified in the injection design. However, solution volumes, concentrations, and calculated amendment mass values in most cases were within acceptable operational tolerance limits. The one notable exception was at the Ringold-only well 199-N-164 where precipitate formation in the phosphate tanker solution resulted in well screen plugging, pressure buildup, and ultimately early termination of the injection.
Several additional injection wells showed evidence for varying degrees of well screen or near-well filter pack/formational plugging during treatment (Table 3.5). Excessive buildup during these injections was mitigated by decreasing the injection rate and extending the injection duration. Although this approach allowed the injections to continue until the total solution volume specification was met, the lower injection rates result in increased phosphate retardation and thus, a decreased radial extent of apatite formation. The observed plugging is thought to be associated with tanker-solution stability problems that resulted in precipitate formation in the concentrated phosphate tanker solution. Evidence for injection-related plugging of a sufficient extent to significantly affect the capability to sustain target injection rates was observed at four locations (N-139, N-142, N-143, and N-161). Three additional Ringold-only injection wells (N-160, N-163, and N-164) exhibited low specific capacity before treatment, so the
Table 3.3. Operational Data Summary for High-Concentration Injections at 16 Injection Well Locations
Well Name
Total Solution Injection Volume
(gallons)
Average Injection Concentration (mg/L)
Total Chemical Injection Mass (kg)
Calcium Citrate Phosphate Calcium Citrate Phosphate N-137 (H) 57,559 125 1740 3732 27.2 379 812 N-159 (R) 57,559 125 1740 3732 27.2 379 812 N-136 (H) 58,829 182 1775 3938 40.4 395 876 N-160 (R) 58,829 182 1775 3938 40.4 395 876 N-145 (H) 57,328 166 1663 3907 36.0 360 847 N-161 (R) 57,328 166 1663 3907 36.0 360 847 N-144 (H) 59,962 170 1374 3968 38.6 312 899 N-162 (R) 59,962 170 1374 3968 38.6 312 899 N-143 (H) 54,545 156 1973 4385 32.2 407 904 N-163 (R) 54,545 156 1973 4385 32.2 407 904 N-142 (H) 60,608 179 1710 4128 41.1 392 946 N-164 (R) 35,035 179 1710 4128 23.7 226 547
Design Specification 60,000 140 1654 3323 31.8 375 754
N-141 113,114 167 1702 3906 71.3 728 1670 N-140 115,650 170 1685 3824 74.1 736 1672 N-139 105,470 213 1943 4425 84.8 775 1764 N-138 116,352 124 1686 4011 54.4 741 1764 Design
Specification 120,000 140 1654 3323 63.5 750 1507

3.5
Table 3.4. Summary of Operational Data Presented as a Percentage of the Design Specification
Well Name
Total Solution Injection Volume
(gallons)
Average Injection Concentration (mg/L)
Total Chemical Injection Mass (kg)
Calcium Citrate Phosphate Calcium Citrate Phosphate N-137 (H) 96% 89% 105% 112% 86% 101% 108% N-159 (R) 96% 89% 105% 112% 86% 101% 108% N-136 (H) 98% 130% 107% 119% 127% 105% 116% N-160 (R) 98% 130% 107% 119% 127% 105% 116% N-145 (H) 96% 119% 101% 118% 114% 96% 112% N-161 (R) 96% 119% 101% 118% 114% 96% 112% N-144 (H) 100% 122% 83% 119% 122% 83% 119% N-162 (R) 100% 122% 83% 119% 122% 83% 119% N-143 (H) 91% 112% 119% 132% 102% 108% 120% N-163 (R) 91% 112% 119% 132% 102% 108% 120% N-142 (H) 101% 128% 103% 124% 129% 104% 125% N-164 (R) 58% 128% 103% 124% 75% 60% 73%
N-141 94% 119% 103% 118% 112% 97% 111% N-140 96% 121% 102% 115% 117% 98% 111% N-139 88% 152% 117% 133% 134% 103% 117% N-138 97% 88% 102% 121% 86% 99% 117%
Average 96% 114% 103% 120% 110% 99% 115% Standard Deviation 3% 15% 12% 7% 16% 9% 5%
Table 3.5. Pressure Buildup Observations and Associated Injection Rate Limitations Encountered During Barrier-Emplacement Operations (Ringold-only injection wells highlighted in gray)
Injection Well
Injection Duration (hr)
Pressure Buildup After 2 Hours (ft)
Pressure Buildup at End of Injection (ft)
Start Flow Rate
(gpm)
End Flow Rate
(gpm) N-137 49.2 1.6 0.3 20 20 N-159 49.2 27.2 14.4 20 20 N-136 62.0 4.9 23 20 10 N-160 62.0 39.3 >47(a) 20 10 N-145 53.2 4.6 4.9 20 15 N-161 53.2 10.5 >42(a) 20 15 N-144 50.3 1.6 17.4 20 20 N-162 50.3 11.5 22.6 20 20 N-143 74.5 1 30.5 20 4.45 N-163 74.5 >42(a) >42(a) 20 4.45 N-142 64.5 6.6 >41(a) 20 4.05 N-164 83.0 >41(a) >41(a) 20 4.05 N-141 53.2 5.2 4.6 40 30 N-140 50.3 8.5 15.1 40 40 N-139 74.5 9.8 53.5 40 7.3 N-138 49.0 9.2 9.2 40 40
(a) Sensor over range

3.6
impacts of treatment-related plugging cannot be effectively assessed. Regardless of the cause, these seven well locations should be considered for aggressive well maintenance and development procedures, including the potential for using acidic solutions to dissolve precipitates formed on the well screens before any future barrier-emplacement operations.
3.3 Operational Performance
Design specifications for the PRB-emplacement injections stipulated that the chemical concentrations should be at least 50% of injection concentration at 6.1 m (20 ft) from each injection well (Williams et al. 2008). This is considered a sufficient radial extent of treatment to provide overlap of treatment between adjacent injection wells. However, with the exception of the two pilot test sites at either end of the barrier, no overlap zone monitoring is available. To address this limitation, arrival data from adjacent injection wells (9.1-m [30-ft] spacing) were used as an indicator. To account for the increase in radial distance to this monitoring point, the phosphate concentration metric for arrival at adjacent injection wells was reduced to 20% to 30% of the injection concentration (from 50% at a 6.1-m [20-ft] distance).
Specific conductance (SpC) and phosphate concentration arrival values at adjacent monitoring locations are presented in Table 3.6. In addition to this arrival summary, full SpC arrival responses at available adjacent monitoring locations during each of these injections are provided in Appendix A. As expected, phosphate transport was somewhat retarded relative to the bulk solution (as indicated by comparison of the SpC and phosphate concentration measurements presented in Table 3.6). The SpC in adjacent wells was consistently closer to injection well values than the phosphate concentration. Thus, the phosphate concentration was considered a better indicator of treatment efficiency than SpC. Evaluating treatment distribution effectiveness was hampered by the timing of the injections, with elevated amendment concentrations from previous injections in adjacent wells limiting the ability to assess arrival response. An inclusive evaluation of arrival responses at all injection well locations indicates generally satisfactory treatment. However, arrivals in the Ringold Formation were less radially extensive than those observed for the Hanford formation. Ringold treatment performance may be improved by performing injections during low-Columbia-River-stage conditions. This approach is supported by the observation that the two highest percent arrivals in Ringold Formation monitoring locations (N-160 and N-162) occurred during the lowest river-stage conditions.
Operational performance measures that should be considered when identifying candidate wells for supplemental treatment (i.e., reinjection to address treatment deficiencies) include 1) amendment volume and mass injected, 2) amendment arrival at adjacent wells, 3) water-level elevation during treatment, and 4) injection rate limitations associated with well plugging. An operational performance matrix is shown in Table 3.7 that summarizes operational effectiveness at each injection well location. Injection design criteria were not fully met at 8 of the 16 injection well locations (well locations highlighted in green), with the primary deficiency at 4 of 8 locations being the limited vertical extent of Hanford formation treatment due to low-river-stage conditions during the injection. Wells whose extent of treatment did not meet design criteria should be considered for retreatment, or at a minimum, be placed on a watch list to identify premature 90Sr breakthrough in a timely manner.
Although injection design criteria were not fully met at a significant number of well locations, aqueous performance assessment monitoring data collected to date (see Section 3.0) indicate good barrier

3.7
performance, providing evidence that the apatite PRB technology may be relatively robust and capable of performing effectively under the geohydrologic and geochemical heterogeneities present at field scale. A more definitive assessment of barrier performance, based on both aqueous monitoring results and analysis of post-treatment sediment core samples to quantify apatite content and distribution, is discussed in Section 4.
Table 3.6. Final Specific Conductance Measurements and Amendment Arrival Concentrations at Adjacent Monitoring Locations (9.1-m [30-ft] radial distance unless otherwise noted) as a Percentage of the Injection Solution Concentration
Injection Well
Upstream Well Downstream Well
% of Injection Stream Specific Conductance
% of Injection Stream PO4- Concentration
% of Injection Stream Specific Conductance
% of Injection Stream PO4-
Concentration N-137(a) 100% 100% 75% @ 15' 70% @ 15' N-159(b) (c) (c) 35% 20% N-136(a) 85%(d) 70%(d) (d) <60%(d)(e)
N-160(b) (d) <25%(d)(e) 60% 35% N-145(a) 90% 90% 90% 90% N-161(b) 0% 0% 15% 7% N-144(a) (d) <40%(d)(e) (d) <25%(d)(e)
N-162(b) (d) <30%(d)(e) 90% 85% N-143(a) 85% 70% 80%(d) 65% N-163(b) 5% 1% 5% 1% N-142(a) 85%(d) 60%(d) (d) <60%(d)(e)
N-164(b) (c) (c) (d) <30%(d)(e)
N-141(a) 7% 5% 30% 30% N-141(b) (c) (c) 5% @ 15' 1% @ 15' N-140 (d) (d) (d) <40%(d)(e)
N-139(a) 65% (80% @ 15') 55% (70% @15') 70% 55% N-139(b) 65% @ 15' 40% @ 15' (c) (c)
N-138(a) (c) (c) 80% (90% @15') 85% (95% @15') N-138(b) (c) (c) 45% @ 15' 45% @ 15' (a)- Hanford formation treatment (c)- No data available (b)- Ringold Formation treatment (d)- Previous injections interfered with monitoring results (e)- No conclusive evidence for arrival; reported maximum concentration may be associated with previous
injections

3.8
Table 3.7. Operational Performance Summary Assessing Compliance with Injection Design Criteria
(well locations where design criteria were not fully met are highlighted in green)
Injection Well
Compliance with Injection Design Criteria Injection Volume
Injection Mass
Radial Extent of Treatment - Hanford
Radial Extent of Treatment - Ringold
Vertical Extent of Hanford Treated(a)
N-137 Yes Yes Yes -- 103% N-159 Yes Yes -- Yes -- N-136 Yes Yes Yes -- 16% N-160 Yes Yes -- Yes -- N-145 Yes Yes Yes -- 86% N-161 Yes Yes -- No -- N-144 Yes Yes Inconclusive -- 14% N-162 Yes Yes -- Yes -- N-143 Yes Yes Yes -- 75% N-163 Yes Yes -- No -- N-142 Yes Yes Inconclusive -- 16% N-164 No No -- Inconclusive -- N-141 Yes Yes No No 86% N-140 Yes Yes Inconclusive Inconclusive 14% N-139 Yes Yes Yes Yes 75% N-138 Yes Yes Yes Yes 103%
(a) Assumes Hanford formation extends between 117.5 and 120 m elevation. Average river stage over injection period and 7-day reaction period used.
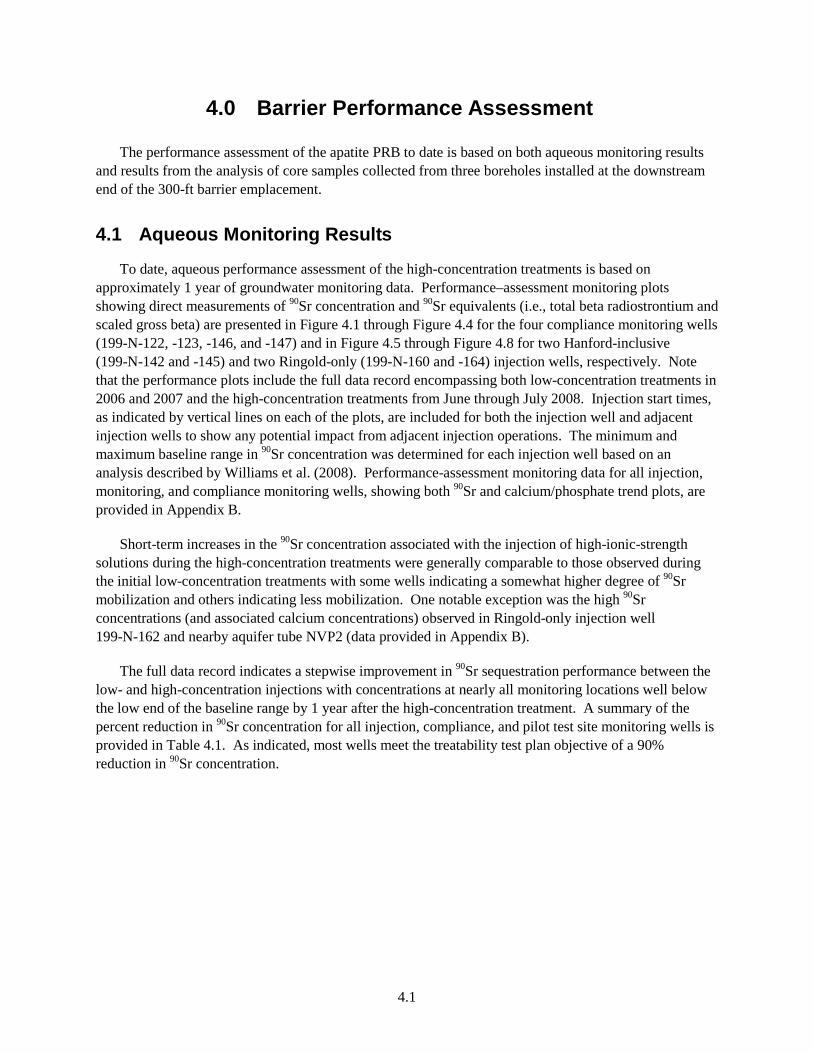
4.1
4.0 Barrier Performance Assessment
The performance assessment of the apatite PRB to date is based on both aqueous monitoring results and results from the analysis of core samples collected from three boreholes installed at the downstream end of the 300-ft barrier emplacement.
4.1 Aqueous Monitoring Results
To date, aqueous performance assessment of the high-concentration treatments is based on approximately 1 year of groundwater monitoring data. Performance–assessment monitoring plots showing direct measurements of 90Sr concentration and 90Sr equivalents (i.e., total beta radiostrontium and scaled gross beta) are presented in Figure 4.1 through Figure 4.4 for the four compliance monitoring wells (199-N-122, -123, -146, and -147) and in Figure 4.5 through Figure 4.8 for two Hanford-inclusive (199-N-142 and -145) and two Ringold-only (199-N-160 and -164) injection wells, respectively. Note that the performance plots include the full data record encompassing both low-concentration treatments in 2006 and 2007 and the high-concentration treatments from June through July 2008. Injection start times, as indicated by vertical lines on each of the plots, are included for both the injection well and adjacent injection wells to show any potential impact from adjacent injection operations. The minimum and maximum baseline range in 90Sr concentration was determined for each injection well based on an analysis described by Williams et al. (2008). Performance-assessment monitoring data for all injection, monitoring, and compliance monitoring wells, showing both 90Sr and calcium/phosphate trend plots, are provided in Appendix B.
Short-term increases in the 90Sr concentration associated with the injection of high-ionic-strength solutions during the high-concentration treatments were generally comparable to those observed during the initial low-concentration treatments with some wells indicating a somewhat higher degree of 90Sr mobilization and others indicating less mobilization. One notable exception was the high 90Sr concentrations (and associated calcium concentrations) observed in Ringold-only injection well 199-N-162 and nearby aquifer tube NVP2 (data provided in Appendix B).
The full data record indicates a stepwise improvement in 90Sr sequestration performance between the low- and high-concentration injections with concentrations at nearly all monitoring locations well below the low end of the baseline range by 1 year after the high-concentration treatment. A summary of the percent reduction in 90Sr concentration for all injection, compliance, and pilot test site monitoring wells is provided in Table 4.1. As indicated, most wells meet the treatability test plan objective of a 90% reduction in 90Sr concentration.

4.2
0
1,000
2,000
3,000
4,000
5,000
6,000
7,000
8,000
9,000
0
1,000
2,000
3,000
4,000
5,000
6,000
7,000
8,000
11/1/05 6/14/06 1/25/07 9/7/07 4/19/08 11/30/08 7/13/09
SpC
(uS/
cm)
Sr-9
0 (p
Ci/L
)
199-N-122 Strontium-90
Total beta radiostrontium
Sr-90 from Gross Beta
Baseline Min/Max Sr-90
Adjacent Injections
Specific Conductance
Figure 4.1. Performance Monitoring Plots for Compliance Monitoring Well 199-N-122
0
1,000
2,000
3,000
4,000
5,000
6,000
7,000
8,000
9,000
0
1,000
2,000
3,000
4,000
5,000
6,000
7,000
8,000
11/1/05 6/14/06 1/25/07 9/7/07 4/19/08 11/30/08 7/13/09
SpC
(uS/
cm)
Sr-9
0 (p
Ci/L
)
199-N-123 Strontium-90
Total beta radiostrontium
Sr-90 from Gross Beta
Baseline Min/Max Sr-90
Adjacent Injections
Specific Conductance
Figure 4.2. Performance Monitoring Plots for Compliance Monitoring Well 199-N-123

4.3
0
1,000
2,000
3,000
4,000
5,000
6,000
7,000
8,000
9,000
0
1,000
2,000
3,000
4,000
5,000
6,000
7,000
8,000
11/1/05 6/14/06 1/25/07 9/7/07 4/19/08 11/30/08 7/13/09
SpC
(uS/
cm)
Sr-9
0 (p
Ci/L
)
199-N-146 Strontium-90
Total beta radiostrontium
Sr-90 from Gross Beta
Baseline Min/Max Sr-90
Adjacent Injections
Specific Conductance
Figure 4.3. Performance Monitoring Plots for Compliance Monitoring Well 199-N-146
0
1,000
2,000
3,000
4,000
5,000
6,000
7,000
8,000
9,000
0
1,000
2,000
3,000
4,000
5,000
6,000
7,000
8,000
11/1/05 6/14/06 1/25/07 9/7/07 4/19/08 11/30/08 7/13/09
SpC
(uS/
cm)
Sr-9
0 (p
Ci/L
)
199-N-147 Strontium-90
Total beta radiostrontium
Sr-90 from Gross Beta
Baseline Min/Max Sr-90
Adjacent Injections
Specific Conductance
Figure 4.4. Performance Monitoring Plots for Compliance Monitoring Well 199-N-147
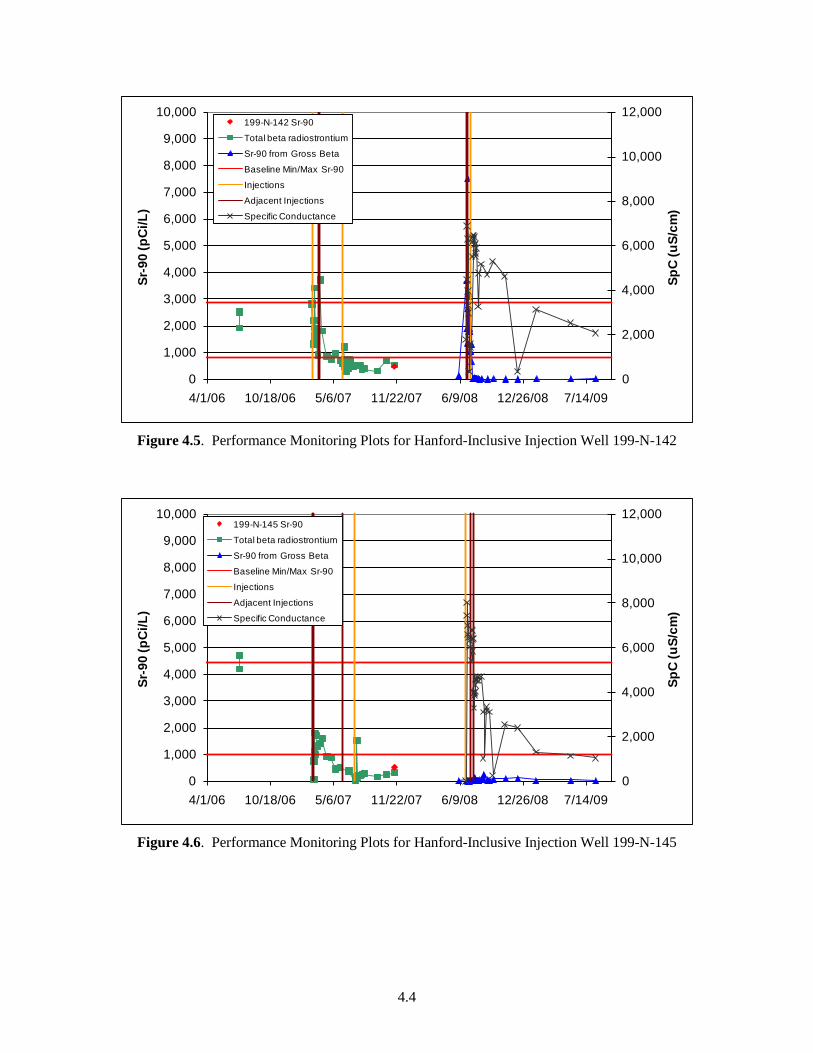
4.4
0
2,000
4,000
6,000
8,000
10,000
12,000
0
1,000
2,000
3,000
4,000
5,000
6,000
7,000
8,000
9,000
10,000
4/1/06 10/18/06 5/6/07 11/22/07 6/9/08 12/26/08 7/14/09
SpC
(uS/
cm)
Sr-9
0 (p
Ci/L
)199-N-142 Sr-90
Total beta radiostrontium
Sr-90 from Gross Beta
Baseline Min/Max Sr-90
Injections
Adjacent Injections
Specific Conductance
Figure 4.5. Performance Monitoring Plots for Hanford-Inclusive Injection Well 199-N-142
0
2,000
4,000
6,000
8,000
10,000
12,000
0
1,000
2,000
3,000
4,000
5,000
6,000
7,000
8,000
9,000
10,000
4/1/06 10/18/06 5/6/07 11/22/07 6/9/08 12/26/08 7/14/09
SpC
(uS/
cm)
Sr-9
0 (p
Ci/L
)
199-N-145 Sr-90
Total beta radiostrontium
Sr-90 from Gross Beta
Baseline Min/Max Sr-90
Injections
Adjacent Injections
Specific Conductance
Figure 4.6. Performance Monitoring Plots for Hanford-Inclusive Injection Well 199-N-145
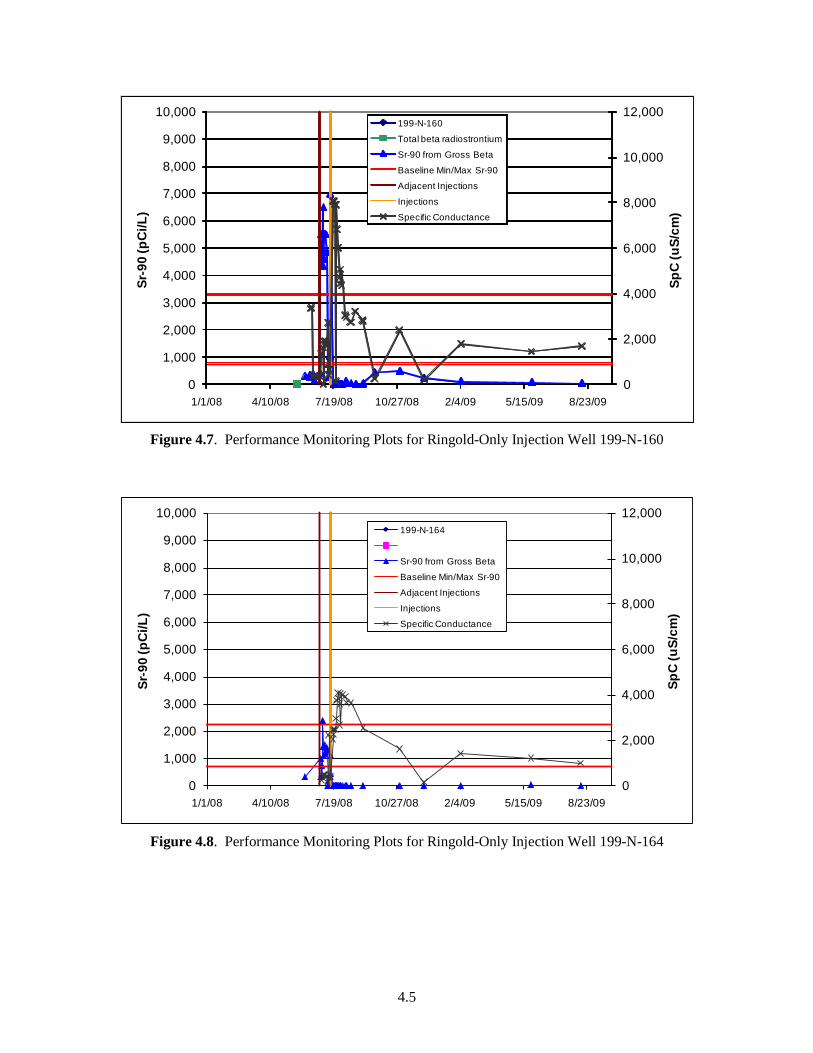
4.5
0
2,000
4,000
6,000
8,000
10,000
12,000
0
1,000
2,000
3,000
4,000
5,000
6,000
7,000
8,000
9,000
10,000
1/1/08 4/10/08 7/19/08 10/27/08 2/4/09 5/15/09 8/23/09
SpC
(uS/
cm)
Sr-9
0 (p
Ci/L
)199-N-160
Total beta radiostrontium
Sr-90 from Gross Beta
Baseline Min/Max Sr-90
Adjacent Injections
Injections
Specific Conductance
Figure 4.7. Performance Monitoring Plots for Ringold-Only Injection Well 199-N-160
0
2,000
4,000
6,000
8,000
10,000
12,000
0
1,000
2,000
3,000
4,000
5,000
6,000
7,000
8,000
9,000
10,000
1/1/08 4/10/08 7/19/08 10/27/08 2/4/09 5/15/09 8/23/09
SpC
(uS/
cm)
Sr-9
0 (p
Ci/L
)
199-N-164
Sr-90 from Gross Beta
Baseline Min/Max Sr-90
Adjacent Injections
Injections
Specific Conductance
Figure 4.8. Performance Monitoring Plots for Ringold-Only Injection Well 199-N-164
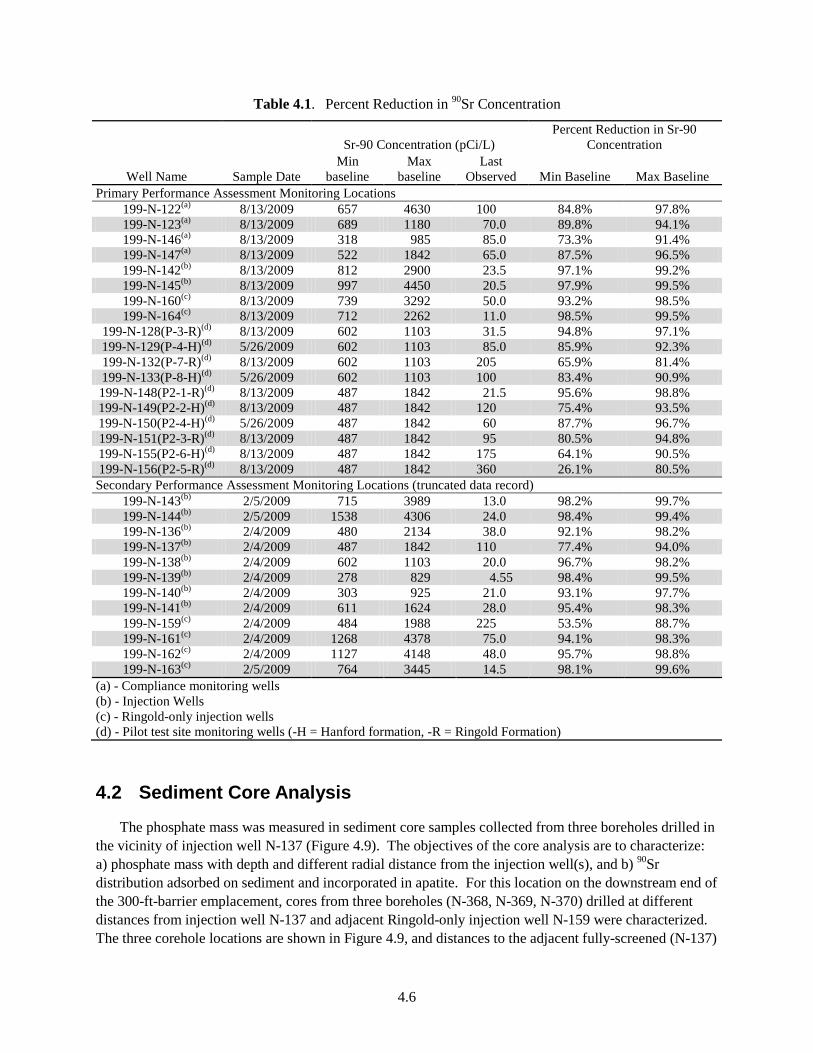
4.6
Table 4.1. Percent Reduction in 90Sr Concentration
Well Name Sample Date
Sr-90 Concentration (pCi/L) Percent Reduction in Sr-90
Concentration Min
baseline Max
baseline Last
Observed Min Baseline Max Baseline Primary Performance Assessment Monitoring Locations
199-N-122(a) 8/13/2009 657 4630 100 84.8% 97.8% 199-N-123(a) 8/13/2009 689 1180 70.0 89.8% 94.1% 199-N-146(a) 8/13/2009 318 985 85.0 73.3% 91.4% 199-N-147(a) 8/13/2009 522 1842 65.0 87.5% 96.5% 199-N-142(b) 8/13/2009 812 2900 23.5 97.1% 99.2% 199-N-145(b) 8/13/2009 997 4450 20.5 97.9% 99.5% 199-N-160(c) 8/13/2009 739 3292 50.0 93.2% 98.5% 199-N-164(c) 8/13/2009 712 2262 11.0 98.5% 99.5%
199-N-128(P-3-R)(d) 8/13/2009 602 1103 31.5 94.8% 97.1% 199-N-129(P-4-H)(d) 5/26/2009 602 1103 85.0 85.9% 92.3% 199-N-132(P-7-R)(d) 8/13/2009 602 1103 205 65.9% 81.4% 199-N-133(P-8-H)(d) 5/26/2009 602 1103 100 83.4% 90.9% 199-N-148(P2-1-R)(d) 8/13/2009 487 1842 21.5 95.6% 98.8% 199-N-149(P2-2-H)(d) 8/13/2009 487 1842 120 75.4% 93.5% 199-N-150(P2-4-H)(d) 5/26/2009 487 1842 60 87.7% 96.7% 199-N-151(P2-3-R)(d) 8/13/2009 487 1842 95 80.5% 94.8% 199-N-155(P2-6-H)(d) 8/13/2009 487 1842 175 64.1% 90.5% 199-N-156(P2-5-R)(d) 8/13/2009 487 1842 360 26.1% 80.5% Secondary Performance Assessment Monitoring Locations (truncated data record)
199-N-143(b) 2/5/2009 715 3989 13.0 98.2% 99.7% 199-N-144(b) 2/5/2009 1538 4306 24.0 98.4% 99.4% 199-N-136(b) 2/4/2009 480 2134 38.0 92.1% 98.2% 199-N-137(b) 2/4/2009 487 1842 110 77.4% 94.0% 199-N-138(b) 2/4/2009 602 1103 20.0 96.7% 98.2% 199-N-139(b) 2/4/2009 278 829 4.55 98.4% 99.5% 199-N-140(b) 2/4/2009 303 925 21.0 93.1% 97.7% 199-N-141(b) 2/4/2009 611 1624 28.0 95.4% 98.3% 199-N-159(c) 2/4/2009 484 1988 225 53.5% 88.7% 199-N-161(c) 2/4/2009 1268 4378 75.0 94.1% 98.3% 199-N-162(c) 2/4/2009 1127 4148 48.0 95.7% 98.8% 199-N-163(c) 2/5/2009 764 3445 14.5 98.1% 99.6%
(a) - Compliance monitoring wells (b) - Injection Wells (c) - Ringold-only injection wells (d) - Pilot test site monitoring wells (-H = Hanford formation, -R = Ringold Formation)
4.2 Sediment Core Analysis
The phosphate mass was measured in sediment core samples collected from three boreholes drilled in the vicinity of injection well N-137 (Figure 4.9). The objectives of the core analysis are to characterize: a) phosphate mass with depth and different radial distance from the injection well(s), and b) 90Sr distribution adsorbed on sediment and incorporated in apatite. For this location on the downstream end of the 300-ft-barrier emplacement, cores from three boreholes (N-368, N-369, N-370) drilled at different distances from injection well N-137 and adjacent Ringold-only injection well N-159 were characterized. The three corehole locations are shown in Figure 4.9, and distances to the adjacent fully-screened (N-137)
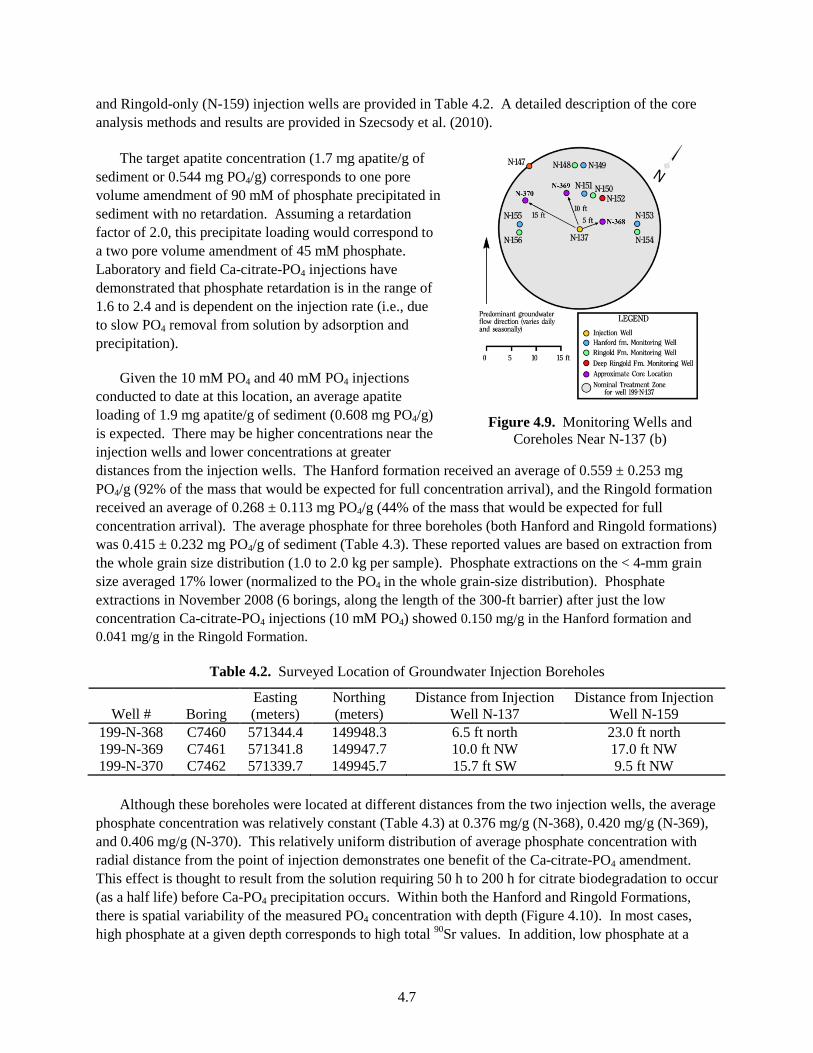
4.7
and Ringold-only (N-159) injection wells are provided in Table 4.2. A detailed description of the core analysis methods and results are provided in Szecsody et al. (2010).
The target apatite concentration (1.7 mg apatite/g of sediment or 0.544 mg PO4/g) corresponds to one pore volume amendment of 90 mM of phosphate precipitated in sediment with no retardation. Assuming a retardation factor of 2.0, this precipitate loading would correspond to a two pore volume amendment of 45 mM phosphate. Laboratory and field Ca-citrate-PO4 injections have demonstrated that phosphate retardation is in the range of 1.6 to 2.4 and is dependent on the injection rate (i.e., due to slow PO4 removal from solution by adsorption and precipitation).
Given the 10 mM PO4 and 40 mM PO4 injections conducted to date at this location, an average apatite loading of 1.9 mg apatite/g of sediment (0.608 mg PO4/g) is expected. There may be higher concentrations near the injection wells and lower concentrations at greater distances from the injection wells. The Hanford formation received an average of 0.559 ± 0.253 mg PO4/g (92% of the mass that would be expected for full concentration arrival), and the Ringold formation received an average of 0.268 ± 0.113 mg PO4/g (44% of the mass that would be expected for full concentration arrival). The average phosphate for three boreholes (both Hanford and Ringold formations) was 0.415 ± 0.232 mg PO4/g of sediment (Table 4.3). These reported values are based on extraction from the whole grain size distribution (1.0 to 2.0 kg per sample). Phosphate extractions on the < 4-mm grain size averaged 17% lower (normalized to the PO4 in the whole grain-size distribution). Phosphate extractions in November 2008 (6 borings, along the length of the 300-ft barrier) after just the low concentration Ca-citrate-PO4 injections (10 mM PO4) showed 0.150 mg/g in the Hanford formation and 0.041 mg/g in the Ringold Formation.
Table 4.2. Surveyed Location of Groundwater Injection Boreholes
Well # Boring Easting (meters)
Northing (meters)
Distance from Injection Well N-137
Distance from Injection Well N-159
199-N-368 C7460 571344.4 149948.3 6.5 ft north 23.0 ft north 199-N-369 C7461 571341.8 149947.7 10.0 ft NW 17.0 ft NW 199-N-370 C7462 571339.7 149945.7 15.7 ft SW 9.5 ft NW
Although these boreholes were located at different distances from the two injection wells, the average phosphate concentration was relatively constant (Table 4.3) at 0.376 mg/g (N-368), 0.420 mg/g (N-369), and 0.406 mg/g (N-370). This relatively uniform distribution of average phosphate concentration with radial distance from the point of injection demonstrates one benefit of the Ca-citrate-PO4 amendment. This effect is thought to result from the solution requiring 50 h to 200 h for citrate biodegradation to occur (as a half life) before Ca-PO4 precipitation occurs. Within both the Hanford and Ringold Formations, there is spatial variability of the measured PO4 concentration with depth (Figure 4.10). In most cases, high phosphate at a given depth corresponds to high total 90Sr values. In addition, low phosphate at a
Figure 4.9. Monitoring Wells and
Coreholes Near N-137 (b)

4.8
specific depth also generally corresponds to low total 90Sr. It is hypothesized that this correlation between PO4 and 90Sr concentration is related to a finer grained sediment zone with a higher surface area (and more ion exchange sites). Borehole N-370 is 15.7 feet from fully screened injection well N-137 and 9.5 feet from Ringold-only screened well N-159. Analysis of the N-370 cores showed a similar phosphate mass in the Ringold Formation as was observed at the other two borehole locations, but elevated phosphate in the Hanford formation (0.72 mg/g). This higher phosphate mass is likely associated with overlap with Hanford formation treatment in the adjacent injection well (N-136), which was injected during relatively low river stage conditions that resulted in a larger radial extent of treatment than planned (see amendment arrival response curves for Wells N-137 and N-147 in Figure A.11, Appendix A).
Table 4.3. Measured Phosphate Mass Near N-137
Borehole Hanford Fm(a) (mg/g) Ringold Fm(a) (mg/g) Average(a) (mg/g) N-368 0.510±0.138 0.276±0.099 0.376±0.180 N-369 0.497±0.056 0.305±0.189 0.420±0.147 N-370 0.719±0.518 0.269±0.128 0.406±0.346
0.559±0.253 0.268±0.113 0.413±0.232 (a) Using average background PO4 = 0.46 mg/g.
Strontium-90 (and Sr) behaves nearly the same as Ca in the Hanford 100N sediments, so it is found primarily adsorbed by ion exchange to sediments. The retardation factor for Sr (and 90Sr) under natural groundwater conditions has been estimated to range between 100 and 125, meaning that approximately 100 times more Sr mass is held on the surface than is in groundwater. Pre-injection, 90% 90Sr was adsorbed to sediment ion exchange sites, 9.3% 90Sr was in other surface phases (carbonates), and 0.7% was aqueous. Post-injection, total 90Sr concentrations in sediment (open circles, Figure 4.10a, d, g) varies with depth. The percentage of ion exchangeable 90Sr (triangles, Figure 4.10a, d, g) in the post-treatment Hanford and Ringold Formation sediments averaged 50.6%, indicating that on average, 39.4% 90Sr was incorporated into apatite by 1 year (i.e., the difference between pre- and post-injection ion exchangeable 90Sr). It is expected that additional 90Sr will be incorporated into apatite in the following years because Sr-apatite is thermodynamically more stable than Ca-apatite. The processes that account for the low 90Sr values in aqueous solution in the injection zone that are observed at field scale are 1) incorporation of 90Sr into apatite (about 39.4% of the mass), 2) ion exchange flushing due to the Ca-citrate-PO4 solution injection (about 47% of the mass, as shown by ion exchangeable Ca and Sr; Szecsody et al. [2010]), and 3) slightly more 90Sr adsorbed to sediment and apatite precipitate.
Analysis of the ion exchangeable Ca2+ and Sr2+ from the field cores clearly shows significant depletion in both Sr2+ (average 95% lower concentration relative to natural sediment) and Ca2+ (average depletion 47%), as described in detail elsewhere (Szecsody et al. 2010). The natural sediment has 2.04 meq of ion exchange sites/100 g that are occupied with Ca2+ (77.2%), Mg2+ (16.8%), K+ (4.2%), Na+ (2.7%), and Sr2+ (2.4%). In addition to the accumulation of 90Sr (and Sr) in apatite by adsorption/incorporation into the apatite structure, ion exchange during the initial Ca-citrate-PO4 solution injection has also altered the cations on the sediment ion exchange sites from their natural condition. The high concentration Ca-citrate-PO4 solution cation composition was 3.6 mM Ca2+, 4.0 mM NH4
+, and 100.4 mM Na+. Because Sr2+ and Ca2+ geochemical behavior is nearly the same, the amount of depletion caused by the high ionic strength flushing should be the same. The much greater depletion in ion

4.9
exchangeable Sr2+ compared to Ca2+ is likely due to incorporation of Sr into apatite. The ion exchange analysis shows that Sr2+ adsorption on the sediment surface is ~5% of natural values, so it is expected that groundwater Sr2+ (and 90Sr values) will reflect similar 95% depletion. As discussed in Section 4.1, aqueous monitoring data collected to date indicate that most wells meet the treatability test plan objective of a 90% reduction in 90Sr concentration. In the next few years, ion exchangeable Ca2+ and Sr2+ will be replenished as upgradient groundwater (with Ca2+, Sr2+, and 90Sr) invades the apatite-laden zone. However, because the sediments are being amended with a relatively small amount of apatite, the total ion exchangeable 90Sr on both sediment and apatite will only be slightly larger than for natural sediments. The real value of the apatite amendment is the incorporation of Sr and 90Sr into the apatite structure.
Figure 4.10. Borehole Data for N-368, N369, and N-370 Showing 90Sr (pCi/g), PO4 (mg/g), and Grain Size < 4 mm
4.10
The grain-size distributions for boreholes N-368 and N-370 (shown with the grain size fraction < 4 mm, Figure 4.10c, f, i) show relatively even distributions with depth, and N-369 shows a fine-grained zone at an 18-ft depth. The total 90Sr and extracted PO4 data show good correlation (R = 0.82). It should be noted that over time (decades) apatite accumulates 90Sr in its structure, so this correlation will become stronger as upgradient 90Sr flows into the apatite-laden zone.
As discussed in Section 3.3, apatite amendment arrival responses observed during treatment operations indicate that target PO4 concentrations were generally met or exceeded within the saturated portion of the Hanford formation, while Ringold Formation wells were generally at or below the established performance metric of 20 to 30% concentration at a radial distance of 30 feet (i.e., at adjacent injection wells). The difference in amendment arrival for the Hanford and Ringold intervals is clearly illustrated by comparing specific conductance arrival curves presented in Figures A.2 and A.12 for pilot test sites 1 and 2, respectively. Results from the analysis of core samples collected from pilot test site 2 were generally consistent with these aqueous results, showing on average significantly higher apatite content in Hanford formation sediments (0.559 ± 0.253 mg PO4/g) than in Ringold Formation sediments (0.268 ± 0.113 mg PO4/g).
In addition to corroborating the difference in apatite content between the Hanford and Ringold Formations, core results showed a relatively uniform distribution of average phosphate concentration with radial distance from the point of injection. Available core results indicate that larger injection volumes are needed for effective Ringold Formation treatment. It should be noted that the N-159 injection (pilot test site 2) was conducted during a high Columbia River stage. Treatment during a low river stage at this location may have provided somewhat more effective Ringold Formation treatment. Based on average PO4 concentrations measured in Hanford and Ringold sediments, the injection volume for the upper zone (Hanford) wells should be maintained at 60,000 gal, while the injection volume for Ringold-only injection wells should be increased to 120,000 gal.

5.1
5.0 Summary and Conclusions
Bench- and field-scale treatability tests conducted to date using both low-and high-concentration apatite amendment formulations indicate that the most favorable formulation for field-scale deployment of the technology consists of 3.6 mM calcium, 9 mM citrate, and 40 mM phosphate. This amendment solution, which was used in all high-concentration treatments conducted in FY08, was identified as the best formulation for meeting the following objectives: 1) minimize the number of injection operations required, 2) minimize short-term increases in 90Sr concentrations associated with injection of high-ionic-strength solutions, and 3) keep amendment formulations well below solubility limits to reduce the potential for operational challenges associated with solution stability.
Based on design analysis and chemical arrival responses observed during low-concentration, pilot-scale testing and PRB treatment operations (Williams et al. 2008) and pilot-scale field tests with the high-concentration solution, an injection volume of 120,000 gallons of apatite amendment solution was specified for each well (or Hanford/Ringold well pair). Over the downstream portion of the barrier, two separate injection operations of approximately 60,000 gallons each were required for targeted treatment of the Hanford and Ringold Formations. An injection rate of 40 gpm was specified for treating the upstream portion of the barrier. This was based on the injection well hydraulic performance observed during previous barrier-treatment operations and injection design analyses indicating that these rates were sufficient for effective delivery of the phosphate amendment. During treatment of the downstream portion of the barrier, an injection rate of 20 gpm was specified for both the Hanford-inclusive and Ringold-only injection wells (for a total of 40 gpm). Injections targeting the Hanford formation were performed during high-Columbia-River-stage conditions to treat as much of the Hanford formation profile as possible. It was originally thought that treatment of the Ringold-only injection wells could be conducted during any river-stage condition; amendment arrival response data collected during the high-concentration injections indicates that treatment of the Ringold Formation is most effective when conducted in Ringold-only injection wells at low-Columbia-River stage. This approach should be used in all future injections.
Design criteria for the high-concentration injection operations were based on 1) amendment volume and mass injected, 2) amendment arrival at adjacent wells, 3) water-level elevation during treatment, and 4) injection rate limitations associated with well plugging. An evaluation of compliance with these injection design criteria was used to assess operational performance and identify candidate wells for supplemental treatment. Injection design criteria were not fully met at 8 of the 16 injection well locations, with the primary deficiency at 4 of 8 locations being the limited vertical extent of Hanford formation treatment due to low-river-stage conditions during the injection. Wells whose extent of treatment did not meet design criteria should be considered for retreatment, or at a minimum, should be placed on a watch list to identify premature 90Sr breakthrough in a timely manner. Although injection design criteria were not fully met at a significant number of well locations, aqueous performance-assessment monitoring data collected to date indicate good barrier performance.
Short-term increases in 90Sr concentration associated with the injection of high-ionic-strength solutions during the high-concentration treatments were generally comparable to or less than those observed during the initial low-concentration treatment. The full data record indicates a stepwise improvement in 90Sr sequestration performance between the low- and high-concentration injections. The average reduction in 90Sr concentrations at the four compliance monitoring locations was 95% relative to

5.2
the high end of the baseline range and 84% relative to the low end of the baseline range, indicating that the performance objective specified in the treatability test plan (90% reduction in 90Sr concentration) was met within 1 year of high-concentration treatment.
An evaluation based on sediment core samples collected in November 2009, approximately 1 year after the high-concentration treatments, was used to quantify the amount of apatite formation resulting from the sequential low- followed by high-concentration treatments performed to date (i.e., an initial 1.0 mM Ca, 2.5 mM citrate, and 10 mM PO4 formulation followed by 3.6 mM Ca, 9 mM citrate, and 40 mM PO4). The average phosphate for three boreholes (both Hanford and Ringold Formations) was 0.415 ± 0.232 mg PO4/g of sediment, or 68% of the injected mass (0.608 mg PO4/g of sediment, equivalent to 1.9 mg apatite/g). The Hanford formation received an average of 0.559 ± 0.253 mg PO4/g (92% of the injected mass) and the Ringold Formation received an average of 0.268 ± 0.113 mg PO4/g (44% of the injected mass). Results from the core analysis are generally consistent with aqueous operational performance monitoring data collected during the injections and indicate that larger injection volumes are needed for effective Ringold Formation treatment. Based on average PO4 concentrations measured in Hanford and Ringold sediments, the injection volume for the upper zone (Hanford) wells should be maintained at 60,000 gal., while the injection volume for Ringold-only injection wells should be increased to 120,000 gal.
The objective of the field treatability testing, as stated in the treatability test plan (DOE/RL 2006), is to address the following:
• Will apatite precipitate in the target zone?
• Does the apatite result in reducing 90Sr in groundwater?
• Given a fixed well spacing of 9.1 m (30 ft), what is the optimal injection volume per well for installing a 91-m (300-ft) barrier wall?
All three test objectives have been addressed through the treatability test activities completed to date. The first bullet has been addressed by analyzing sediment samples collected from boreholes drilled within the treatment zone (Szecsody et al. 2009, 2010) and performance-assessment groundwater monitoring following the low-concentration (Williams et al. 2008) and high-concentration Ca-citrate-PO4 injections.
Reductions in 90Sr concentrations in groundwater (bullet 2 above) have been indicated by performance-assessment monitoring results after low-concentration treatments and to a larger extent after high-concentration treatments. The treatment target of a 90% reduction in 90Sr concentration was realized at all four compliance monitoring wells and at a majority of the other site wells that have been routinely monitored to assess performance.
Injection volume requirements for the fixed 9.1-m (30-ft) injection well spacing (bullet 3 above), which provides for overlap between adjacent injection wells of sufficient extent to form a continuous PRB, have been determined based on amendment arrival responses observed during the low-concentration Ca-citrate-PO4 injections (Williams et al. 2008) and the high-concentration injection results described in this report. In addition to the specified injection volumes, it was determined that installation of injection wells targeting only the lower portion of the contaminated zone (Ringold Formation only) were needed to provide effective amendment coverage over the downstream section of the PRB. It was also determined that, in addition to the requirement that Hanford formation treatments be performed

5.3
during the highest Columbia-River-stage conditions (to treat the full saturated thickness), Ringold-only injection wells should be treated during low-Columbia-River-stage conditions to achieve an acceptable radial extent of treatment. Specific recommendations for future barrier expansion amendment injections are provided below.
5.1 Recommendations • No change in apatite formulation is required (see Section 2.5.2 for specification). A single treatment
with this high-concentration formulation is estimated to provide 270 years of treatment capacity.
• Upper zone (i.e., Hanford) injection wells should be treated during high Columbia River stage conditions (target elevation of 120 m, minimum elevation of 119 m).
• The injection volume for Hanford formation wells should be maintained at 60,000 gal.
• Ringold-only injection wells should be treated during low Columbia River stage conditions (not to exceed an elevation of 118 m).
• The injection volume for Ringold Formation wells should be increased to 120,000 gal. In addition to emplacing higher apatite content within the treatment zone, higher volumes will extend treatment further out into the river bottom sediments.
• Amendment arrival response should continue to be monitored in adjacent injection wells during barrier emplacement operations.


6.1
6.0 References
Andronescu E, E Stefan, E Dinu, and C Ghitulica. 2002. “Hydroxyapatite Synthesis.” Key Engineering Materials 206-213:1595-1598.
Arey JS, JC Seaman, and PM Bertsch. 1999. “Immobilization of Uranium in Contaminated Sediments by Hydroxyapatite Addition.” Environmental Science & Technology 33:337-342.
Bailey JE and DF Ollis. 1986. Biochemical Engineering Fundamentals. McGraw-Hill Publishing Co., New York.
Bailliez S, A Nzihou, E Beche, and G Flamant. 2004. “Removal of Lead by Hydroxyapatite Sorbent.” Process Safety and Environmental Protection 82(2):175-180. DOI: 10.1205/095758204322972816.
Belousova EA, WL Griffin, SY O’Reilly, and NI Fisher. 2002. “Apatite as an Indicator Mineral for Mineral Exploration: Trace-Element Compositions and Their Relationship to Host Rock Type.” Journal of Geochemical Exploration 76(1):45-69. DOI:10.1016/S0375-6742(02)00204-2.
BHI—Bechtel Hanford, Inc. 1995. Technical Reevaluation of the N-Springs Barrier Wall. BHI-00185 Rev. 0, Bechtel Hanford, Inc., Richland, Washington.
Bynhildsen L and T Rosswall. 1997. “Effects of Metals on the Microbial Mineralization of Organic Acids.” Water, Air, and Soil Pollution 94(1-2):45-57. DOI:10.1007/BF02407092.
CERCLA—Comprehensive Environmental Response, Compensation, and Liability Act. 1980. Public Law 96-510, as amended, 94 Stat. 2767, 42 USC 9601 et seq.
Connelly MP. 1999. Groundwater-River Interaction in the Near River Environment at the 100-N Area. Innovative Treatment and Remediation Demonstration Program, HydroGeoLogic, Reston, Virginia.
Connelly MP. 2001. Strontium-90 Transport in the Near-River Environment at the 100-N Area. Innovative Treatment and Remediation Demonstration Program, HydroGeoLogic, Reston, Virginia.
DOE/RL—U.S. Department of Energy, Richland Operations. 2004. Calendar Year 2003 Annual Summary Report for the 100-HR-3, 100-KR-4, and 100-NR-2 Operable Unit (OU) Pump & Treat Operations. DOE/RL-2004-21, Rev. 0, Richland, Washington.
DOE/RL—U.S. Department of Energy, Richland Operations. 2006. Strontium-90 Treatability Test Plan for 100-NR-2 Groundwater Operable Unit. DOE/RL-2005-96, Rev. 0, Richland, Washington.
Elliot JC, PE Mackie, and RA Young. 1973. “Monoclinic Hydroxyapatite.” Science 180(4090):1055-1057.
Fuller CC, JR Bargar, JA Davis, and MJ Piana. 2002. “Mechanisms of Uranium Interactions with Hydroxyapatite: Implications for Groundwater Remediation.” Environmental Science & Technology 36(2):158-165. DOI:10.1021/es0108483.
Fuller CC, JR Bargar, and JA Davis. 2003. “Molecular-Scale Characterization of Uranium Sorption by Bone Apatite Materials for a Permeable Reactive Barrier Demonstration.” Environmental Science & Technology 37(20):4642-4649. DOI:10.1021/es0343959.

6.2
Geochem Software, Inc. (Geochem). 1994. Mac MINTEQ-A2: Aqueous Geochemistry for the Macintosh. Geochem Software, Inc., Reston, Virginia.
Hartman MJ, LF Morasch, and WD Webber. 2007. Hanford Site Groundwater Monitoring for Fiscal Year 2006. PNNL-16346, Pacific Northwest National Laboratory, Richland, Washington.
Heslop DD, Y Bi, AA Baig, M Otsuka, and WI Higuchi. 2005. “A Comparative Study of the Metastable Equilibrium Solubility Behavior of High-Crystallinity and Low-Crystallinity Carbonated Apatites Using pH and Solution Strontium as Independent Variables.” Journal of Colloid and Interface Science 289(1):14-25.
Hughes JM, M Cameron, and KD Crowley. 1989. “Structural Variations in Natural F, OH and Cl Apatites.” American Mineralogist 74:870-876.
ITRD—Innovative Treatment and Remediation Demonstration Program. 2001. Hanford 100-N Area Remediation Options Evaluation Summary Report. Office of Environmental Management, Subsurface Contaminants Focus Area, Sandia National Laboratories, Albuquerque, New Mexico.
Jeanjean J, JC Rouchaud, L Tran, and M Fedoroff. 1995. “Sorption of Uranium and Other Heavy Metals on Hydroxyapatite.” Journal of Radioanalytical and Nuclear Chemistry 201:529-539.
Lower SK, PA Maurice, SJ Traina, and EH Carlson. 1998. “Aqueous Lead Sorption by Hydroxylapatite: Applications of Atomic Force Microscopy to Dissolution, Nucleation and Growth Studies.” American Mineralogist 83:147-158.
Ma QY, SJ Traina, and TJ Logan. 1995. “In Situ Lead Immobilization by Apatite.” Environmental Science & Technology 27:1803-1810.
Mavropoulos E, AM Rossi, AM Costa, CAC Perez, JC Moreira, and M Saldanha. 2002. “Studies on the Mechanisms of Lead Immobilization by Hydroxyapatite.” Environmental Science & Technology 36:1625-1629.
Misra DN. 1998. “Interaction of Some Alkali Metal Citrates with Hydroxyapatite – Ion-Exchange Adsorption and Role of Charge Balance.” Colloids and Surfaces a-Physicochemical and Engineering Aspects 141:173-179.
Moelo Y, B Lasnier, P Palvadeau, P Leone, and F Fontan. 2000. “Lulzacite, Sr2Fe2+(Fe2
+,Mg)(2)Al-4(PO4)(4)(OH)(10), a New Strontium Phosphate.” In: Comptes Rendus De L Academie Des Sciences Serie Ii Fascicule a-Sciences De La Terre Et Des Planetes, Saint-Aubin-des-Chateaux, Loire-Atlantique, France, 330:317-324.
Moore RC, K Holt, HT Zhao, A Hasan, N Awwad, M Gasser, and C Sanchez. 2003. “Sorption of Np(V) by Synthetic Hydroxyapatite.” Radiochimica Acta 91:721-727.
Moore RC, C Sanchez, K Holt, P Zhang, H Xu, and GR Choppin. 2004. “Formation of Hydroxyapatite in Soils Using Calcium Citrate and Sodium Phosphate for Control of Strontium Migration.” Radiochimica Acta 92(9-11/2004):719-723.
Moore RC, M Gasser, N Awwad, KC Holt, FM Salas, A Hasan, MA Hasan, H Zhao, and CA Sanchez. 2005. “Sorption of Plutonium(VI) by Hydroxyapatite.” Journal of Radioanalytical and Nuclear Chemistry 263(1):97-101. DOI:10.1007/s10967-005-0019-z.

6.3
Moore RC, J Szecsody, MJ Truex, K Helean, R Bontchev, and C Ainsworth. 2007. “Formation of Nanosize Apatite Crystals in Sediments for Containment and Stabilization of Contaminants.” In: Environmental Applications of Nanomaterials, Synthesis, Sorbents, and Sensors, G Fryxell and G Cao (eds), Imperial College Press. p 89-109.
Papargyris A, A Botis, and S Papargyri. 2002. “Synthetic Routes for Hydroxyapatite Powder Production.” Key Engineering Materials 206-213:83-86.
Rendon-Angeles JC, K Yanagisawa, N Ishizawa, and S Oishi. 2000. “Effect of Metal Ions of Chlorapatites on the Topotaxial Replacement by Hydroxyapatite under Hydrothermal Conditions.” Journal of Solid State Chemistry 154:569-578.
Smiciklas I, A Onjia, and S Raicevic. 2005. “Experimental Design Approach in the Synthesis of Hydroxyapatite by Neutralization Method.” Separation and Purification Technology 44:97-102.
Spence RD and C Shi. 2005. Stabilization and Solidification of Hazardous, Radioactive, and Mixed Wastes. CRC Press, Boca Raton, Florida.
Szecsody JE, CA Burns, RC Moore, JS Fruchter, VR Vermeul, MD Williams, DC Girvin, JP McKinley, MJ Truex, and JL Phillips. 2007. Hanford 100-N Area Apatite Emplacement: Laboratory Results of Ca-Citrate-PO4 Solution Injection and Sr-90 Immobilization in 100-N Sediments. PNNL-16891, Pacific Northwest National Laboratory, Richland, Washington.
Szecsody JE, ML Rockhold, M Oostrom, RC Moore, CA Burns, MD Williams, L Zhong, JS Fruchter, JP McKinley, VR Vermeul, MA Covert, TW Wietsma, AT Breshears, and BJ Garcia. 2009. Sequestration of Sr-90 Subsurface Contamination in the Hanford 100N Area by Surface Infiltration of a Ca-Citrate-PO4 Solution. PNNL-18303, Pacific Northwest National Laboratory, Richland, Washington.
Szecsody J, V Vermeul, J Fruchter, M Williams, M Rockhold, and J. Phillips. 2010. Hanford 100N Area In Situ Apatite and Phosphate Emplacement by Groundwater and Jet Injection: Geochemical and Physical Core Analysis. PNNL-19524, Pacific Northwest National Laboratory, Richland, Washington.
Tofe AJ. 1998. “Chemical Decontamination Using Natural or Artificial Bone.” U.S. Patent 5,711,015.
Van der Houwen JAM and AE Valsami-Jones. 2001. “The Application of Calcium Phosphate Precipitation Chemistry to Phosphorus Recovery: The Influence of Organic Ligands.” Environmental Technology 22(11):1325-1335. DOI:10.1080/09593332108618187.
Verbeeck RMH, M Hauben, HP Thun, and F Verbeeck. 1977. “Solubility and Solution Behaviour of Strontium Hydroxyapatite.” Zeitschrift für Physikalische Chemie (Wiesbaden) 108(2):203-215.
Williams MD, BG Fritz, DP Mendoza, ML Rockhold, PD Thorne, YL Xie, BN Bjornstad, RD Mackley, JE Szecsody, and VR Vermeul. 2008. 100-NR-2 Apatite Treatability Test: Low Concentration Calcium Citrate-Phosphate Solution Injection for In Situ Strontium-90 Immobilization. PNNL-17429, Pacific Northwest National Laboratory, Richland, Washington.
Wright J. 1990. “Conodont Apatite: Structure and Geochemistry.” Biomineralization: Patterns, Processes and Evolutionary Trends, J Carter (ed.), Van Nostrand Reinhold, New York.
Wright J, KR Rice, B Murphy, and J Conca. 2004. “PIMS Using Apatite II™: How It Works To Remediate Soil and Water.” Sustainable Range Management, RE Hinchee and B Alleman (eds.). Battelle Press, Columbus, Ohio. Accessed December 21, 2009, at www.batelle.org/bookstore.


Appendix A
Operational Performance Summary: Arrival Curves for Apatite Amendment Injections


A.1
Appendix A
Operational Performance Summary: Arrival Curves for Apatite Amendment Injections
Figure .1. Location of Injection Wells for the Reactive Barrier

A.2
Hanford/Ringold (N-138)
0100020003000400050006000700080009000
6/4/080:00
6/4/0812:00
6/5/080:00
6/5/0812:00
6/6/080:00
6/6/0812:00
6/7/080:00
Spec
ific
Con
duct
ance
(μS/
cm)
N-123N-126 (1R)N-127 (2H)N-128 (3R)N-129 (4H)N-130 (5R)N-131 (6H)N-132 (7R)N-133 (8H)N-139
Inj. Start
Figure A.2. Arrival Curves for Treatment of Well 199-N-138
Figure A.3. Well Locations at Pilot Test Site 1

A.3
N-139
01000
200030004000
500060007000
80009000
6/30/080:00
6/30/0812:00
7/1/080:00
7/1/0812:00
7/2/080:00
7/2/0812:00
7/3/080:00
7/3/0812:00
Spec
ific
Con
duct
ance
(μS/
cm) N-128 (3R)
N-130 (5R)
N-132 (7R)
N-133 (8H)
N-138
N-140
Inj. Start
Figure A.4. Arrival Curves for Treatment of Well 199-N-139
N-140
0
1000
2000
3000
4000
5000
6000
7000
8000
9000
7/22/08 12:00 7/23/08 0:00 7/23/08 12:00 7/24/08 0:00 7/24/08 12:00 7/25/08 0:00
Spec
ific
Con
duct
ance
(μS/
cm)
N-141 N-146
Inj. Start
Figure A.5. Arrival Curves for Treatment of Well 199-N-140

A.4
N-141
0100020003000400050006000700080009000
6/26/080:00
6/26/0812:00
6/27/080:00
6/27/0812:00
6/28/080:00
6/28/0812:00
6/29/080:00
Spec
ific
Con
duct
ance
(μS/
cm)
N-140 N-142N-146 N-164Inj. Start
Figure A.6. Arrival Curves for Treatment of Well 199-N-141
N-142 & N-164
0100020003000400050006000700080009000
7/14/080:00
7/14/0812:00
7/15/080:00
7/15/0812:00
7/16/080:00
7/16/0812:00
7/17/080:00
7/17/0812:00
7/18/080:00
Spec
ific
Con
duct
ance
(μS/
cm)
N-141N-143N-163
Inj. Start
Figure A.7. Arrival Curves for Treatment of Wells 199-N-142 and 199-N-164

A.5
N-143 & N-163
0
1000
2000
3000
4000
5000
6000
7000
8000
9000
6/30/080:00
6/30/0812:00
7/1/080:00
7/1/0812:00
7/2/080:00
7/2/0812:00
7/3/080:00
7/3/0812:00
7/4/080:00
Spec
ific
Con
duct
ance
(μS/
cm)
N-122N-142N-144N-162N-164
Inj. Start
Figure A.8. Arrival Curves for Treatment of Wells 199-N-143 and 199-N-163
N-144 & N-162
0100020003000400050006000700080009000
7/22/0812:00
7/23/080:00
7/23/0812:00
7/24/080:00
7/24/0812:00
7/25/080:00
Spec
ific
Con
duct
ance
(μS/
cm)
N-143 N-145N-161 N-163N-122
Inj. Start
Figure A.9. Arrival Curves for Treatment of Wells 199-N-144 and 199-N-162

A.6
N-145 & N-161
0100020003000400050006000700080009000
6/26/080:00
6/26/0812:00
6/27/080:00
6/27/0812:00
6/28/080:00
6/28/0812:00
6/29/080:00
Spec
ific
Con
duct
ance
(μS/
cm)
N-136N-144N-160N-162
Inj. Start
Figure A.10. Arrival Curves for Treatment of Wells 199-N-145 and 199-N-161
N-136 & N-160
0
1000
2000
3000
4000
5000
6000
7000
8000
9000
7/14/080:00
7/14/0812:00
7/15/080:00
7/15/0812:00
7/16/080:00
7/16/0812:00
7/17/080:00
7/17/0812:00
7/18/080:00
Spec
ific
Cond
cuta
nce
(μS/
cm)
N-137 N-145N-147 P2-6HP2-5R N-159N-161
Inj Start
Figure A.11. Arrival Curves for Treatment of Wells 199-N-136 and 199-N-160

A.7
Hanford Injection (N-137)
0
1000
20003000
4000
5000
60007000
8000
9000
6/4/080:00
6/4/0812:00
6/5/080:00
6/5/0812:00
6/6/080:00
6/6/0812:00
6/7/080:00
Spec
ific
Cond
ucta
nce
(μS/
cm)
N-136
N-147
N-149 (2H)
N-150 (4H)
N-153 (8H)
N-155 (6H)
APT-5S
Ringold Injection (N-159)
0
1000
2000
3000
40005000
6000
7000
8000
9000
6/4/080:00
6/4/0812:00
6/5/080:00
6/5/0812:00
6/6/080:00
6/6/0812:00
6/7/080:00
Spec
ific
Cond
ucta
nce
(μS/
cm)
N-136
N-147
N-148 (1R)
N-151 (3R)
N-152 (9R)
N-154 (7R)
N-156 (5R)
Figure A.12. Arrival Curves for Treatment of Wells 199-N-137 and 199-N-159

A.8
Figure A.13. Well Locations at Pilot Test Site 2
Appendix B
Performance Plots for All Groundwater Monitoring Points Associated with the Apatite Barrier

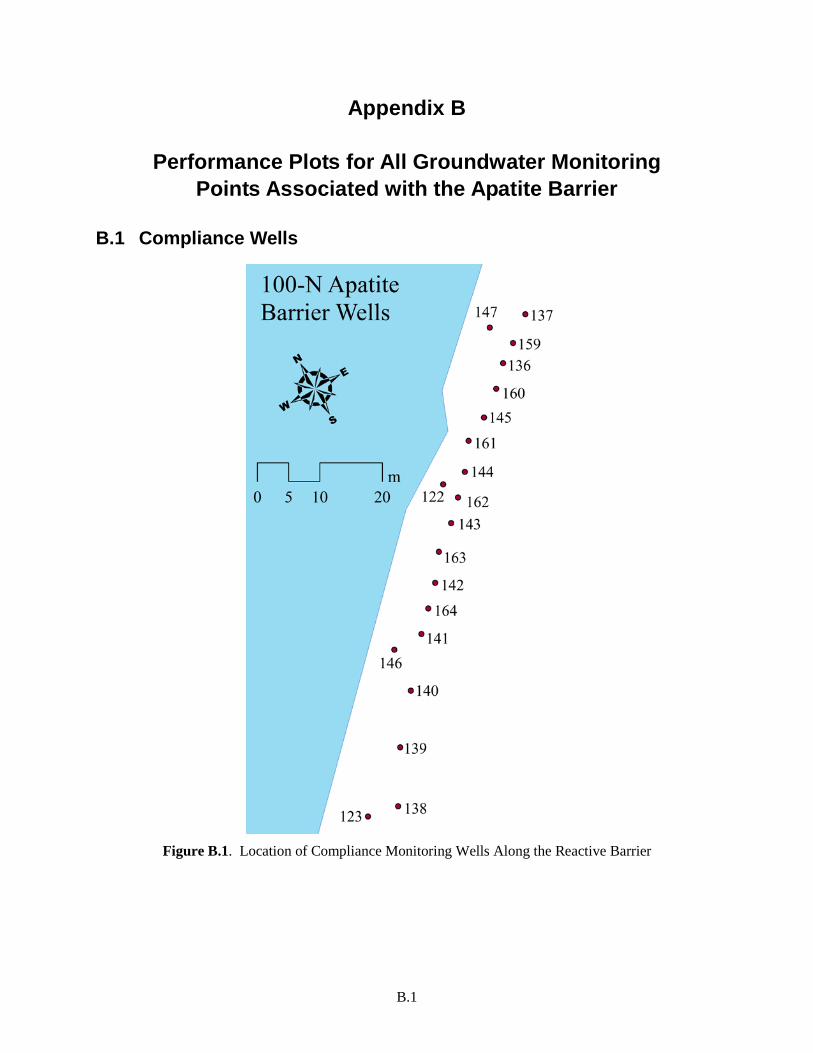
B.1
Appendix B
Performance Plots for All Groundwater Monitoring Points Associated with the Apatite Barrier
B.1 Compliance Wells
Figure B.1. Location of Compliance Monitoring Wells Along the Reactive Barrier
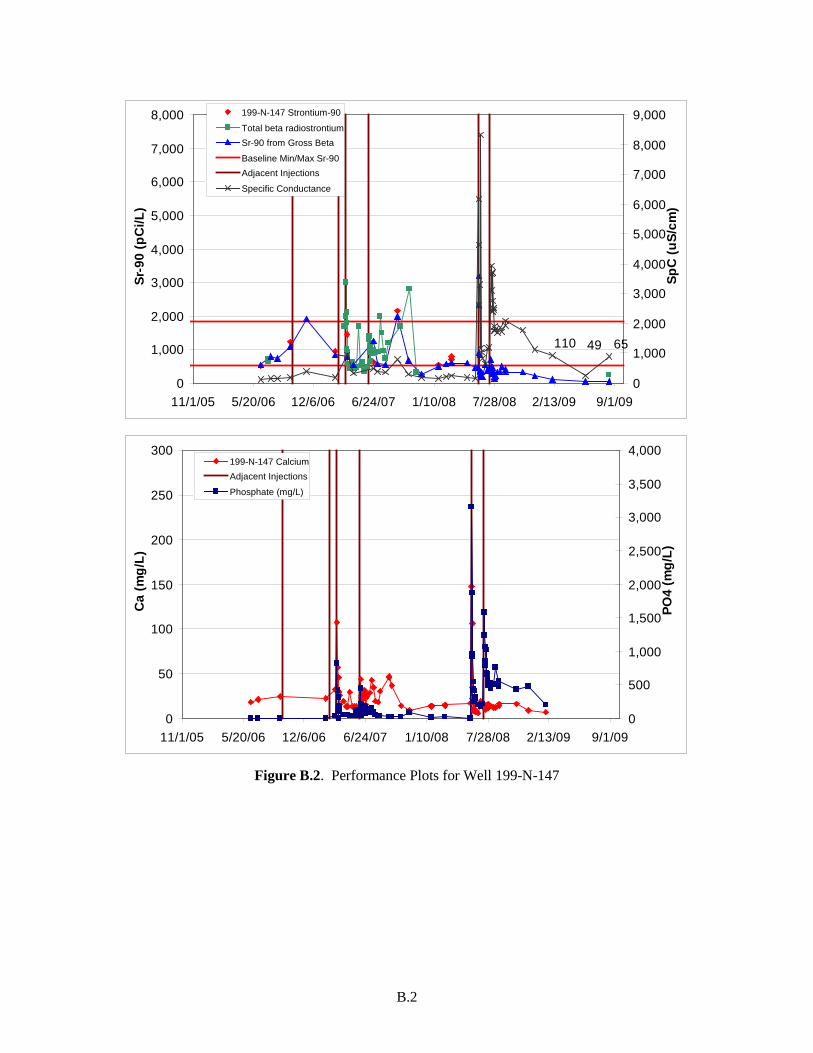
B.2
110 49 65
0
1,000
2,000
3,000
4,000
5,000
6,000
7,000
8,000
11/1/05 5/20/06 12/6/06 6/24/07 1/10/08 7/28/08 2/13/09 9/1/09
Sr-9
0 (p
Ci/L
)
0
1,000
2,000
3,000
4,000
5,000
6,000
7,000
8,000
9,000
SpC
(uS/
cm)
199-N-147 Strontium-90Total beta radiostrontiumSr-90 from Gross BetaBaseline Min/Max Sr-90Adjacent InjectionsSpecific Conductance
0
50
100
150
200
250
300
11/1/05 5/20/06 12/6/06 6/24/07 1/10/08 7/28/08 2/13/09 9/1/09
Ca
(mg/
L)
0
500
1,000
1,500
2,000
2,500
3,000
3,500
4,000
PO4
(mg/
L)
199-N-147 CalciumAdjacent InjectionsPhosphate (mg/L)
Figure B.2. Performance Plots for Well 199-N-147

B.3
335 300 100
0
1,000
2,000
3,000
4,000
5,000
6,000
7,000
8,000
11/1/05 5/20/06 12/6/06 6/24/07 1/10/08 7/28/08 2/13/09 9/1/09
Sr-9
0 (p
Ci/L
)
0
1,000
2,000
3,000
4,000
5,000
6,000
7,000
8,000
9,000
SpC
(uS/
cm)
199-N-122 Strontium-90Total beta radiostrontiumSr-90 from Gross BetaBaseline Min/Max Sr-90Adjacent InjectionsSpecific Conductance
0
50
100
150
200
250
300
11/1/05 5/20/06 12/6/06 6/24/07 1/10/08 7/28/08 2/13/09 9/1/09
Ca
(mg/
L)
0
500
1,000
1,500
2,000
2,500
3,000
3,500
4,000
PO4
(mg/
L)
199-N-122 CalciumAdjacent InjectionsPhosphate (mg/L)
Figure B.3. Performance Plots for Well 199-N-122
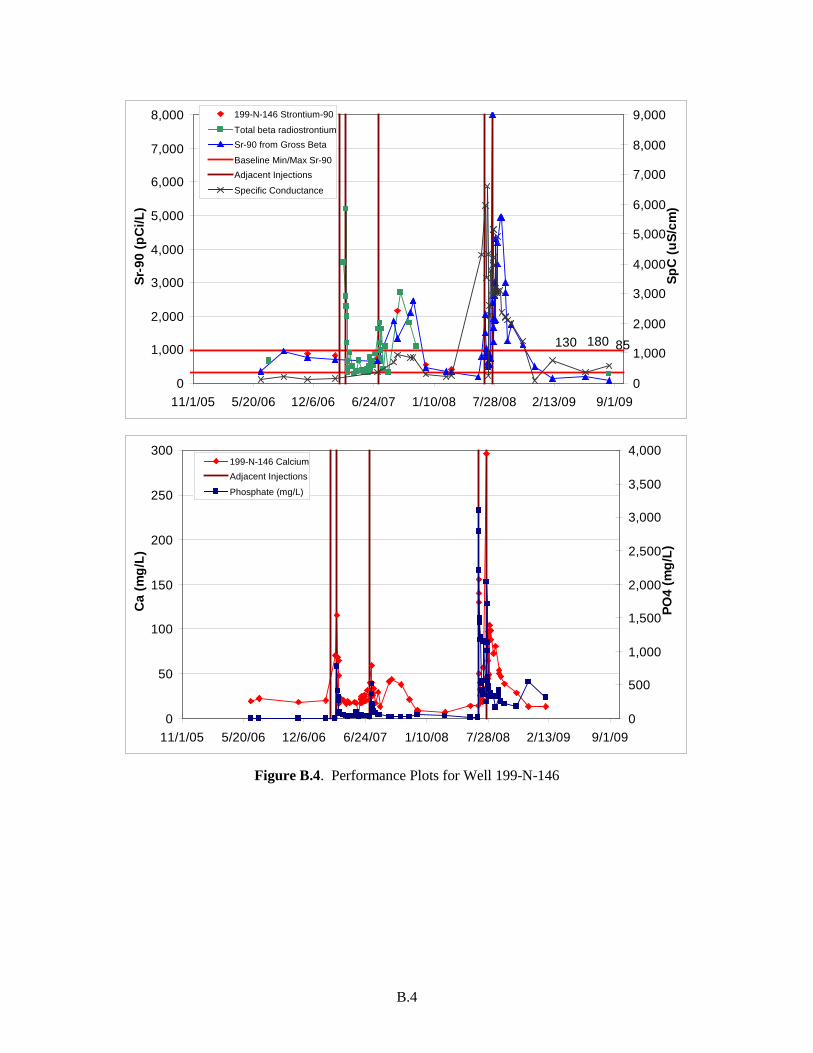
B.4
130 180 85
0
1,000
2,000
3,000
4,000
5,000
6,000
7,000
8,000
11/1/05 5/20/06 12/6/06 6/24/07 1/10/08 7/28/08 2/13/09 9/1/09
Sr-9
0 (p
Ci/L
)
0
1,000
2,000
3,000
4,000
5,000
6,000
7,000
8,000
9,000
SpC
(uS/
cm)
199-N-146 Strontium-90Total beta radiostrontiumSr-90 from Gross BetaBaseline Min/Max Sr-90Adjacent InjectionsSpecific Conductance
0
50
100
150
200
250
300
11/1/05 5/20/06 12/6/06 6/24/07 1/10/08 7/28/08 2/13/09 9/1/09
Ca
(mg/
L)
0
500
1,000
1,500
2,000
2,500
3,000
3,500
4,000
PO4
(mg/
L)
199-N-146 CalciumAdjacent InjectionsPhosphate (mg/L)
Figure B.4. Performance Plots for Well 199-N-146

B.5
110 55 70
0
1,000
2,000
3,000
4,000
5,000
6,000
7,000
8,000
11/1/05 5/20/06 12/6/06 6/24/07 1/10/08 7/28/08 2/13/09 9/1/09
Sr-9
0 (p
Ci/L
)
0
1,000
2,000
3,000
4,000
5,000
6,000
7,000
8,000
9,000
SpC
(uS/
cm)
199-N-123 Strontium-90Total beta radiostrontiumSr-90 from Gross BetaBaseline Min/Max Sr-90Adjacent InjectionsSpecific Conductance
0
50
100
150
200
250
300
11/1/05 5/20/06 12/6/06 6/24/07 1/10/08 7/28/08 2/13/09 9/1/09
Ca
(mg/
L)
0
500
1,000
1,500
2,000
2,500
3,000
3,500
4,000
PO4
(mg/
L)
199-N-123 CalciumAdjacent InjectionsPhosphate (mg/L)
Figure B.5. Performance Plots for Well 199-N-123
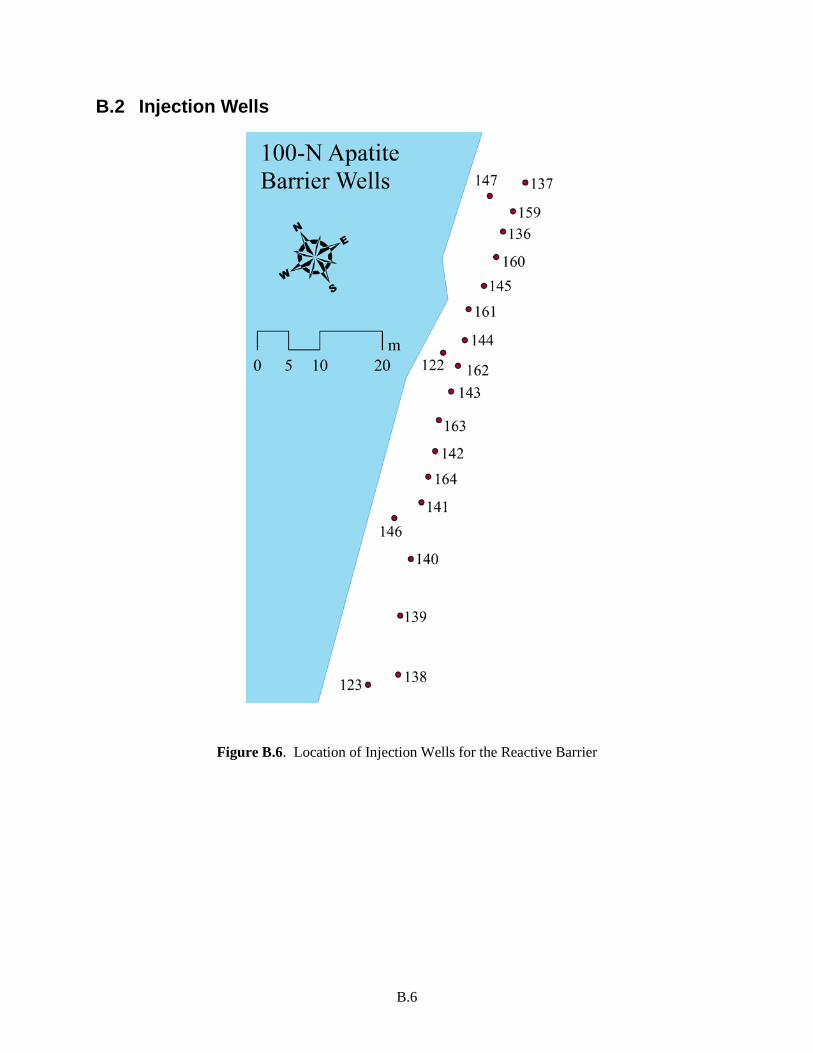
B.6
B.2 Injection Wells
Figure B.6. Location of Injection Wells for the Reactive Barrier

B.7
113
85
200
1,000
2,000
3,000
4,000
5,000
6,000
7,000
8,000
9,000
10,000
4/1/06 10/18/06 5/6/07 11/22/07 6/9/08 12/26/08 7/14/09
Sr-9
0 (p
Ci/L
)
0
2,000
4,000
6,000
8,000
10,000
12,000
SpC
(uS/
cm)
199-N-138 Sr-90Total beta radiostrontiumSr-90 from Gross BetaBaseline Min/Max Sr-90InjectionsAdjacent InjectionsSpecific Conductance
0
50
100
150
200
250
300
4/1/06 10/18/06 5/6/07 11/22/07 6/9/08 12/26/08 7/14/09
Ca
(mg/
L)
0
1,000
2,000
3,000
4,000
5,000
6,000
7,000
8,000
9,000
10,000
PO4
(mg/
L)
199-N-138 CalciumInjectionsAdjacent InjectionsPhosphate (mg/L)
Figure B.7. Performance Plots for Well 199-N-138

B.8
5.9 0.314.55
0
1,000
2,000
3,000
4,000
5,000
6,000
7,000
8,000
9,000
10,000
4/1/06 10/18/06 5/6/07 11/22/07 6/9/08 12/26/08 7/14/09
Sr-9
0 (p
Ci/L
)
0
2,000
4,000
6,000
8,000
10,000
12,000
SpC
(uS/
cm)
199-N-139 Sr-90Total beta radiostrontiumSr-90 from Gross BetaBaseline Min/Max Sr-90InjectionsAdjacent InjectionsSpecific Conductance
0
50
100
150
200
250
300
4/1/06 10/18/06 5/6/07 11/22/07 6/9/08 12/26/08 7/14/09
Ca
(mg/
L)
0
1,000
2,000
3,000
4,000
5,000
6,000
7,000
8,000
9,000
10,000
PO4
(mg/
L)
199-N-139 CalciumInjectionsAdjacent InjectionsPhosphate (mg/L)
Figure B.8. Performance Plots for Well 199-N-139

B.9
25 20 210
1,000
2,000
3,000
4,000
5,000
6,000
7,000
8,000
9,000
10,000
4/1/06 10/18/06 5/6/07 11/22/07 6/9/08 12/26/08 7/14/09
Sr-9
0 (p
Ci/L
)
0
2,000
4,000
6,000
8,000
10,000
12,000
SpC
(uS/
cm)
199-N-140 Sr-90Total beta radiostrontiumSr-90 from Gross BetaBaseline Min/Max Sr-90InjectionsAdjacent InjectionsSpecific Conductance
0
50
100
150
200
250
300
4/1/06 10/18/06 5/6/07 11/22/07 6/9/08 12/26/08 7/14/09
Ca
(mg/
L)
0
1,000
2,000
3,000
4,000
5,000
6,000
7,000
8,000
9,000
10,000
PO4
(mg/
L)
199-N-140 CalciumInjectionsAdjacent InjectionsPhosphate (mg/L)
Figure B.9. Performance Plots for Well 199-N-140

B.10
3114
280
1,000
2,000
3,000
4,000
5,000
6,000
7,000
8,000
9,000
10,000
4/1/06 10/18/06 5/6/07 11/22/07 6/9/08 12/26/08 7/14/09
Sr-9
0 (p
Ci/L
)
0
2,000
4,000
6,000
8,000
10,000
12,000
SpC
(uS/
cm)
199-N-141 Sr-90Total beta radiostrontiumSr-90 from Gross BetaBaseline Min/Max Sr-90InjectionsAdjacent InjectionsSpecific Conductance
0
50
100
150
200
250
300
4/1/06 10/18/06 5/6/07 11/22/07 6/9/08 12/26/08 7/14/09
Ca
(mg/
L)
0
1,000
2,000
3,000
4,000
5,000
6,000
7,000
8,000
9,000
10,000
PO4
(mg/
L)
199-N-141 CalciumInjectionsAdjacent InjectionsPhosphate (mg/L)
Figure B.10. Performance Plots for Well 199-N-141
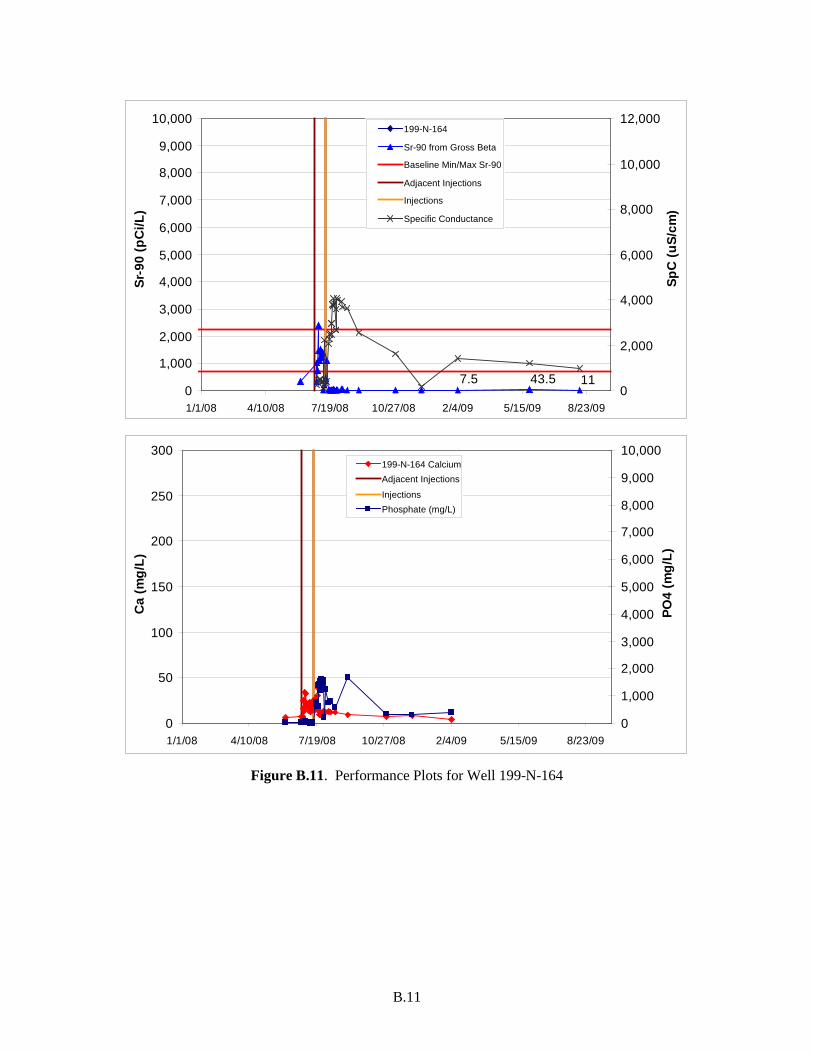
B.11
7.5 43.5 110
1,000
2,000
3,000
4,000
5,000
6,000
7,000
8,000
9,000
10,000
1/1/08 4/10/08 7/19/08 10/27/08 2/4/09 5/15/09 8/23/09
Sr-9
0 (p
Ci/L
)
0
2,000
4,000
6,000
8,000
10,000
12,000
SpC
(uS/
cm)
199-N-164
Sr-90 from Gross Beta
Baseline Min/Max Sr-90
Adjacent Injections
Injections
Specific Conductance
0
50
100
150
200
250
300
1/1/08 4/10/08 7/19/08 10/27/08 2/4/09 5/15/09 8/23/09
Ca
(mg/
L)
0
1,000
2,000
3,000
4,000
5,000
6,000
7,000
8,000
9,000
10,000
PO4
(mg/
L)
199-N-164 CalciumAdjacent InjectionsInjectionsPhosphate (mg/L)
Figure B.11. Performance Plots for Well 199-N-164
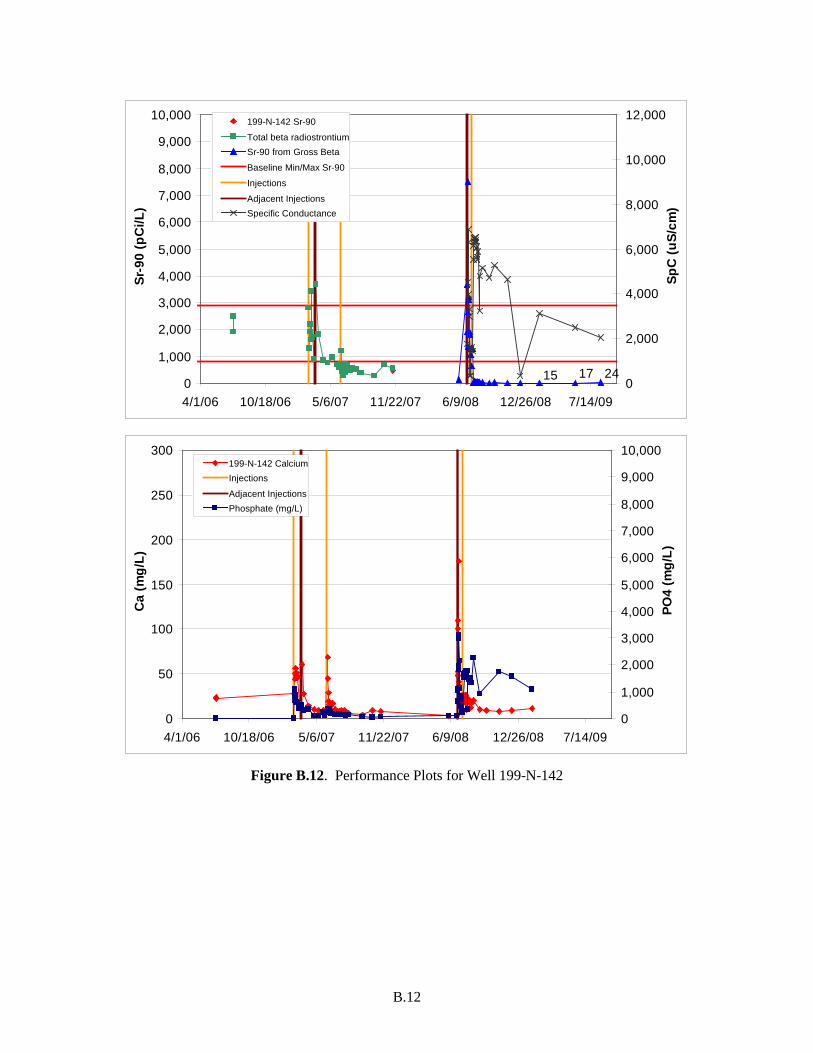
B.12
15 17 240
1,000
2,000
3,000
4,000
5,000
6,000
7,000
8,000
9,000
10,000
4/1/06 10/18/06 5/6/07 11/22/07 6/9/08 12/26/08 7/14/09
Sr-9
0 (p
Ci/L
)
0
2,000
4,000
6,000
8,000
10,000
12,000
SpC
(uS/
cm)
199-N-142 Sr-90Total beta radiostrontiumSr-90 from Gross BetaBaseline Min/Max Sr-90InjectionsAdjacent InjectionsSpecific Conductance
0
50
100
150
200
250
300
4/1/06 10/18/06 5/6/07 11/22/07 6/9/08 12/26/08 7/14/09
Ca
(mg/
L)
0
1,000
2,000
3,000
4,000
5,000
6,000
7,000
8,000
9,000
10,000
PO4
(mg/
L)
199-N-142 CalciumInjectionsAdjacent InjectionsPhosphate (mg/L)
Figure B.12. Performance Plots for Well 199-N-142

B.13
19.9 8 14.50
1,000
2,000
3,000
4,000
5,000
6,000
7,000
8,000
9,000
10,000
1/1/08 4/10/08 7/19/08 10/27/08 2/4/09 5/15/09 8/23/09
Sr-9
0 (p
Ci/L
)
0
2,000
4,000
6,000
8,000
10,000
12,000
SpC
(uS/
cm)
199-N-163 Total beta radiostrontiumSr-90 from Gross BetaBaseline Min/Max Sr-90Adjacent InjectionsInjectionsSpecific Conductance
0
50
100
150
200
250
300
1/1/08 4/10/08 7/19/08 10/27/08 2/4/09 5/15/09 8/23/09
Ca
(mg/
L)
0
1,000
2,000
3,000
4,000
5,000
6,000
7,000
8,000
9,000
10,000
PO4
(mg/
L)
199-N-163 CalciumAdjacent InjectionsInjectionsPhosphate (mg/L)
Figure B.13. Performance Plots for Well 199-N-163

B.14
0.711.9
130
1,000
2,000
3,000
4,000
5,000
6,000
7,000
8,000
9,000
10,000
4/1/06 10/18/06 5/6/07 11/22/07 6/9/08 12/26/08 7/14/09
Sr-9
0 (p
Ci/L
)
0
2,000
4,000
6,000
8,000
10,000
12,000
SpC
(uS/
cm)
199-N-143 Sr-90Total beta radiostrontiumSr-90 from Gross BetaBaseline Min/Max Sr-90InjectionsAdjacent InjectionsSpecific Conductance
0
50
100
150
200
250
300
4/1/06 10/18/06 5/6/07 11/22/07 6/9/08 12/26/08 7/14/09
Ca
(mg/
L)
0
1,000
2,000
3,000
4,000
5,000
6,000
7,000
8,000
9,000
10,000
PO4
(mg/
L)
199-N-143 CalciumInjectionsAdjacent InjectionsPhosphate (mg/L)
Figure B.14. Performance Plots for Well 199-N-143

B.15
64 48 480
5,000
10,000
15,000
20,000
25,000
30,000
1/1/08 4/10/08 7/19/08 10/27/08 2/4/09 5/15/09 8/23/09
Sr-9
0 (p
Ci/L
)
0
2,000
4,000
6,000
8,000
10,000
12,000
SpC
(uS/
cm)
199-N-162
Sr-90 from Gross BetaBaseline Min/Max Sr-90Adjacent InjectionsInjectionsSpecific Conductance
Note: increased Sr-90 Scale
0
50
100
150
200
250
300
1/1/08 4/10/08 7/19/08 10/27/08 2/4/09 5/15/09 8/23/09
Ca
(mg/
L)
0
1,000
2,000
3,000
4,000
5,000
6,000
7,000
8,000
9,000
10,000
PO4
(mg/
L)
199-N-162 CalciumAdjacent InjectionsInjectionsPhosphate (mg/L)
Figure B.15. Performance Plots for Well 199-N-162

B.16
33 23240
1,000
2,000
3,000
4,000
5,000
6,000
7,000
8,000
9,000
10,000
4/1/06 10/18/06 5/6/07 11/22/07 6/9/08 12/26/08 7/14/09
Sr-9
0 (p
Ci/L
)
0
2,000
4,000
6,000
8,000
10,000
12,000
SpC
(uS/
cm)
199-N-144 Sr-90Total beta radiostrontiumSr-90 from Gross BetaBaseline Min/Max Sr-90InjectionsAdjacent InjectionsSpecific Conductance
0
50
100
150
200
250
300
4/1/06 10/18/06 5/6/07 11/22/07 6/9/08 12/26/08 7/14/09
Ca
(mg/
L)
0
1,000
2,000
3,000
4,000
5,000
6,000
7,000
8,000
9,000
10,000
PO4
(mg/
L)
199-N-144 CalciumInjectionsAdjacent InjectionsPhosphate (mg/L)
Figure B.16. Performance Plots for Well 199-N-144

B.17
326 280750
1,000
2,000
3,000
4,000
5,000
6,000
7,000
8,000
9,000
10,000
1/1/08 4/10/08 7/19/08 10/27/08 2/4/09 5/15/09 8/23/09
Sr-9
0 (p
Ci/L
)
0
2,000
4,000
6,000
8,000
10,000
12,000
SpC
(uS/
cm)
199-N-161 Total beta radiostrontiumSr-90 from Gross BetaBaseline Min/Max Sr-90Adjacent InjectionsInjectionsSpecific Conductance
0
50
100
150
200
250
300
1/1/08 4/10/08 7/19/08 10/27/08 2/4/09 5/15/09 8/23/09
Ca
(mg/
L)
0
1,000
2,000
3,000
4,000
5,000
6,000
7,000
8,000
9,000
10,000
PO4
(mg/
L)
199-N-161 CalciumAdjacent InjectionsInjectionsPhosphate (mg/L)
Figure B.17. Performance Plots for Well 199-N-161

B.18
29 33 210
1,000
2,000
3,000
4,000
5,000
6,000
7,000
8,000
9,000
10,000
4/1/06 10/18/06 5/6/07 11/22/07 6/9/08 12/26/08 7/14/09
Sr-9
0 (p
Ci/L
)
0
2,000
4,000
6,000
8,000
10,000
12,000
SpC
(uS/
cm)
199-N-145 Sr-90Total beta radiostrontiumSr-90 from Gross BetaBaseline Min/Max Sr-90InjectionsAdjacent InjectionsSpecific Conductance
0
50
100
150
200
250
300
4/1/06 10/18/06 5/6/07 11/22/07 6/9/08 12/26/08 7/14/09
Ca
(mg/
L)
0
1,000
2,000
3,000
4,000
5,000
6,000
7,000
8,000
9,000
10,000
PO4
(mg/
L)
199-N-145 CalciumInjectionsAdjacent InjectionsPhosphate (mg/L)
Figure B.18. Performance Plots for Well 199-N-145

B.19
125 90 500
1,000
2,000
3,000
4,000
5,000
6,000
7,000
8,000
9,000
10,000
1/1/08 4/10/08 7/19/08 10/27/08 2/4/09 5/15/09 8/23/09
Sr-9
0 (p
Ci/L
)
0
2,000
4,000
6,000
8,000
10,000
12,000
SpC
(uS/
cm)
199-N-160 Total beta radiostrontiumSr-90 from Gross BetaBaseline Min/Max Sr-90Adjacent InjectionsInjectionsSpecific Conductance
0
50
100
150
200
250
300
1/1/08 4/10/08 7/19/08 10/27/08 2/4/09 5/15/09 8/23/09
Ca
(mg/
L)
0
1,000
2,000
3,000
4,000
5,000
6,000
7,000
8,000
9,000
10,000
PO4
(mg/
L)
199-N-160 CalciumAdjacent InjectionsInjectionsPhosphate (mg/L)
Figure B.19. Performance Plots for Well 199-N-160

B.20
189.5
380
1,000
2,000
3,000
4,000
5,000
6,000
7,000
8,000
9,000
10,000
4/1/06 10/18/06 5/6/07 11/22/07 6/9/08 12/26/08 7/14/09
Sr-9
0 (p
Ci/L
)
0
2,000
4,000
6,000
8,000
10,000
12,000
SpC
(uS/
cm)
199-N-136 Sr-90Total beta radiostrontiumSr-90 from Gross BetaBaseline Min/Max Sr-90InjectionsAdjacent InjectionsSpecific Conductance
0
50
100
150
200
250
300
4/1/06 10/18/06 5/6/07 11/22/07 6/9/08 12/26/08 7/14/09
Ca
(mg/
L)
0
1,000
2,000
3,000
4,000
5,000
6,000
7,000
8,000
9,000
10,000
PO4
(mg/
L)
199-N-136 CalciumInjectionsAdjacent InjectionsPhosphate (mg/L)
Figure B.20. Performance Plots for Well 199-N-136

B.21
1905
405225
0
1,000
2,000
3,000
4,000
5,000
6,000
7,000
8,000
9,000
10,000
1/1/08 4/10/08 7/19/08 10/27/08 2/4/09 5/15/09 8/23/09
Sr-9
0 (p
Ci/L
)
0
2,000
4,000
6,000
8,000
10,000
12,000
SpC
(uS/
cm)
199-N-159 Total beta radiostrontiumSr-90 from Gross BetaBaseline Min/Max Sr-90Adjacent InjectionsInjectionsSpecific Conductance
0
50
100
150
200
250
300
1/1/08 4/10/08 7/19/08 10/27/08 2/4/09 5/15/09 8/23/09
Ca
(mg/
L)
0
1,000
2,000
3,000
4,000
5,000
6,000
7,000
8,000
9,000
10,000
PO4
(mg/
L)
199-N-159 CalciumAdjacent InjectionsInjectionsPhosphate (mg/L)
Figure B.21. Performance Plots for Well 199-N-159

B.22
218140
1100
1,000
2,000
3,000
4,000
5,000
6,000
7,000
8,000
9,000
10,000
4/1/06 10/18/06 5/6/07 11/22/07 6/9/08 12/26/08 7/14/09
Sr-9
0 (p
Ci/L
)
0
2,000
4,000
6,000
8,000
10,000
12,000
SpC
(uS/
cm)
199-N-137 Sr-90Total beta radiostrontiumSr-90 from Gross BetaBaseline Min/Max Sr-90InjectionsAdjacent InjectionsSpecific Conductance
0
50
100
150
200
250
300
4/1/06 10/18/06 5/6/07 11/22/07 6/9/08 12/26/08 7/14/09
Ca
(mg/
L)
0
1,000
2,000
3,000
4,000
5,000
6,000
7,000
8,000
9,000
10,000
PO4
(mg/
L)
199-N-137 CalciumInjectionsAdjacent InjectionsPhosphate (mg/L)
Figure B.22. Performance Plots for Well 199-N-137

B.23
B.3 Pilot Test Site 1
Figure B.23. Map of Pilot Test Site 1

B.24
0
2,000
4,000
6,000
8,000
10,000
12,000
4/1/06 10/18/06 5/6/07 11/22/07 6/9/08 12/26/08 7/14/09
Sr-9
0 (p
Ci/L
)
0
2,000
4,000
6,000
8,000
10,000
12,000
SpC
(uS/
cm)
199-N-126 Strontium-90Total beta radiostrontiumSr-90 from Gross BetaBaseline Min/Max Sr-90InjectionsAdjacent InjectionsSpecific Conductance
P-1-R
0
50
100
150
200
250
300
350
4/1/06 10/18/06 5/6/07 11/22/07 6/9/08 12/26/08 7/14/09
Ca (m
g/L)
0
500
1,000
1,500
2,000
2,500
3,000
3,500
4,000
4,500
5,000
PO4
(mg/
L)
199-N-126 CalciumInjectionsAdjacent InjectionsPhosphate (mg/L)
P-1-R
Figure B.24. Performance Plots for Well 199-N-126 (P-1-R)

B.25
0
2,000
4,000
6,000
8,000
10,000
12,000
4/1/06 10/18/06 5/6/07 11/22/07 6/9/08 12/26/08 7/14/09
Sr-9
0 (p
Ci/L
)
0
2,000
4,000
6,000
8,000
10,000
12,000
SpC
(uS/
cm)
199-N-127 Strontium-90Total beta radiostrontiumSr-90 from Gross BetaBaseline Min/Max Sr-90InjectionsAdjacent InjectionsSpecific Conductance
P-2-H
0
50
100
150
200
250
300
350
4/1/06 10/18/06 5/6/07 11/22/07 6/9/08 12/26/08 7/14/09
Ca
(mg/
L)
0
500
1,000
1,500
2,000
2,500
3,000
3,500
4,000
4,500
5,000
PO4
(mg/
L)
199-N-127 CalciumInjectionsAdjacent InjectionsPhosphate (mg/L)
P-2-H
Figure B.25. Performance Plots for Well 199-N-127 (P-2-H)
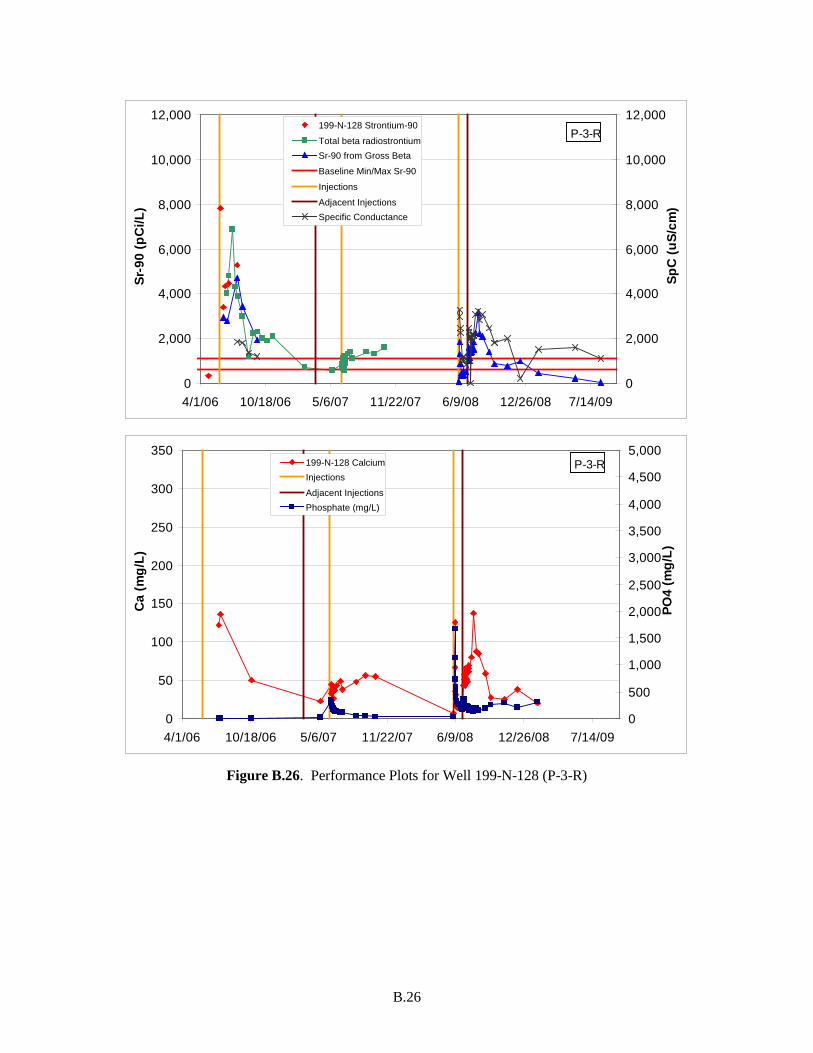
B.26
0
2,000
4,000
6,000
8,000
10,000
12,000
4/1/06 10/18/06 5/6/07 11/22/07 6/9/08 12/26/08 7/14/09
Sr-9
0 (p
Ci/L
)
0
2,000
4,000
6,000
8,000
10,000
12,000
SpC
(uS/
cm)
199-N-128 Strontium-90Total beta radiostrontiumSr-90 from Gross BetaBaseline Min/Max Sr-90InjectionsAdjacent InjectionsSpecific Conductance
P-3-R
0
50
100
150
200
250
300
350
4/1/06 10/18/06 5/6/07 11/22/07 6/9/08 12/26/08 7/14/09
Ca
(mg/
L)
0
500
1,000
1,500
2,000
2,500
3,000
3,500
4,000
4,500
5,000
PO4
(mg/
L)
199-N-128 CalciumInjectionsAdjacent InjectionsPhosphate (mg/L)
P-3-R
Figure B.26. Performance Plots for Well 199-N-128 (P-3-R)

B.27
0
2,000
4,000
6,000
8,000
10,000
12,000
4/1/06 10/18/06 5/6/07 11/22/07 6/9/08 12/26/08 7/14/09
Sr-9
0 (p
Ci/L
)
0
2,000
4,000
6,000
8,000
10,000
12,000
SpC
(uS/
cm)
199-N-129 Strontium-90Total beta radiostrontiumSr-90 from Gross BetaBaseline Min/Max Sr-90InjectionsAdjacent InjectionsSpecific Conductance
P-4-H
0
50
100
150
200
250
300
350
4/1/06 10/18/06 5/6/07 11/22/07 6/9/08 12/26/08 7/14/09
Ca
(mg/
L)
0
500
1,000
1,500
2,000
2,500
3,000
3,500
4,000
4,500
5,000
PO4
(mg/
L)
199-N-129 CalciumInjectionsAdjacent InjectionsPhosphate (mg/L)
P-4-H
Figure B.27. Performance Plots for Well 199-N-129 (P-4-H)

B.28
0
2,000
4,000
6,000
8,000
10,000
12,000
4/1/06 10/18/06 5/6/07 11/22/07 6/9/08 12/26/08 7/14/09
Sr-9
0 (p
Ci/L
)
0
2,000
4,000
6,000
8,000
10,000
12,000
SpC
(uS/
cm)
199-N-130 Sr-90Total beta radiostrontiumSr-90 from Gross BetaBaseline Min/Max Sr-90InjectionsAdjacent InjectionsSpecific Conductance
P-5-R
0
50
100
150
200
250
300
350
4/1/06 10/18/06 5/6/07 11/22/07 6/9/08 12/26/08 7/14/09
Ca
(mg/
L)
0
500
1,000
1,500
2,000
2,500
3,000
3,500
4,000
4,500
5,000
PO4
(mg/
L)
199-N-130 CalciumInjectionsAdjacent InjectionsPhosphate (mg/L)
P-5-R
Figure B.28. Performance Plots for Well 199-N-130 (P-5-R)
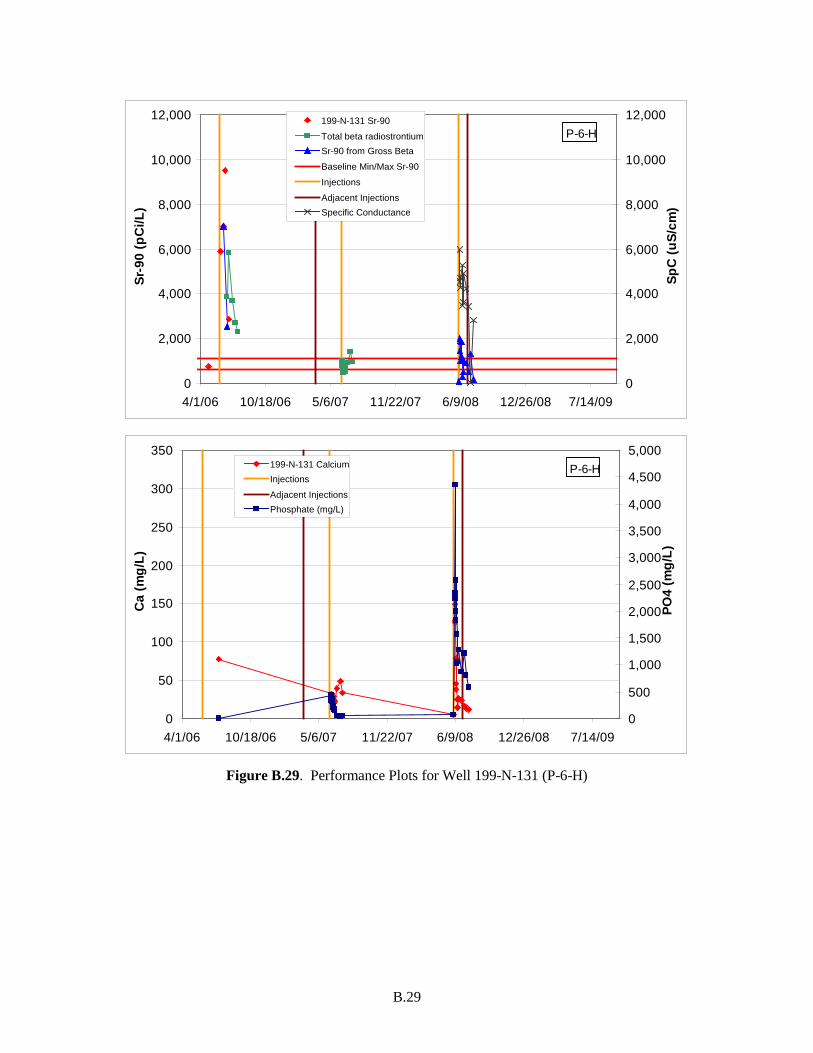
B.29
0
2,000
4,000
6,000
8,000
10,000
12,000
4/1/06 10/18/06 5/6/07 11/22/07 6/9/08 12/26/08 7/14/09
Sr-9
0 (p
Ci/L
)
0
2,000
4,000
6,000
8,000
10,000
12,000
SpC
(uS/
cm)
199-N-131 Sr-90Total beta radiostrontiumSr-90 from Gross BetaBaseline Min/Max Sr-90InjectionsAdjacent InjectionsSpecific Conductance
P-6-H
0
50
100
150
200
250
300
350
4/1/06 10/18/06 5/6/07 11/22/07 6/9/08 12/26/08 7/14/09
Ca
(mg/
L)
0
500
1,000
1,500
2,000
2,500
3,000
3,500
4,000
4,500
5,000
PO4
(mg/
L)
199-N-131 CalciumInjectionsAdjacent InjectionsPhosphate (mg/L)
P-6-H
Figure B.29. Performance Plots for Well 199-N-131 (P-6-H)
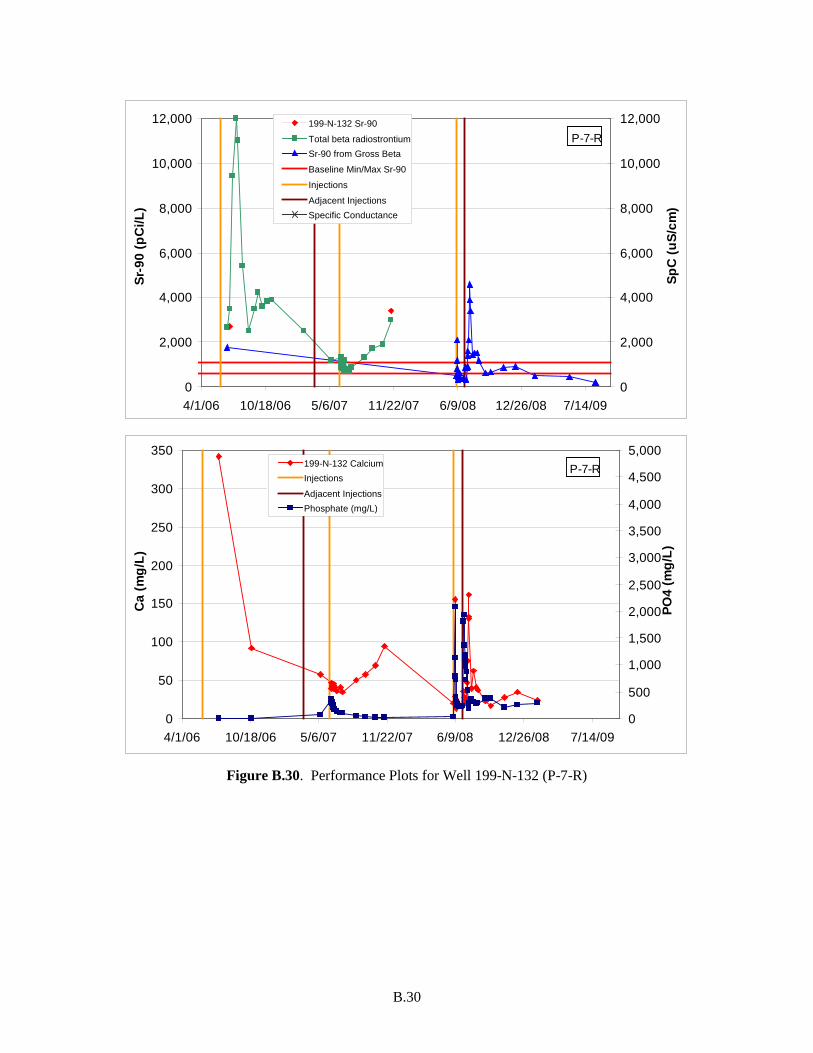
B.30
0
2,000
4,000
6,000
8,000
10,000
12,000
4/1/06 10/18/06 5/6/07 11/22/07 6/9/08 12/26/08 7/14/09
Sr-9
0 (p
Ci/L
)
0
2,000
4,000
6,000
8,000
10,000
12,000
SpC
(uS/
cm)
199-N-132 Sr-90Total beta radiostrontiumSr-90 from Gross BetaBaseline Min/Max Sr-90InjectionsAdjacent InjectionsSpecific Conductance
P-7-R
0
50
100
150
200
250
300
350
4/1/06 10/18/06 5/6/07 11/22/07 6/9/08 12/26/08 7/14/09
Ca
(mg/
L)
0
500
1,000
1,500
2,000
2,500
3,000
3,500
4,000
4,500
5,000
PO4
(mg/
L)
199-N-132 CalciumInjectionsAdjacent InjectionsPhosphate (mg/L)
P-7-R
Figure B.30. Performance Plots for Well 199-N-132 (P-7-R)

B.31
0
2,000
4,000
6,000
8,000
10,000
12,000
4/1/06 10/18/06 5/6/07 11/22/07 6/9/08 12/26/08 7/14/09
Sr-9
0 (p
Ci/L
)
0
2,000
4,000
6,000
8,000
10,000
12,000
SpC
(uS/
cm)
199-N-133 Sr-90Total beta radiostrontiumSr-90 from Gross BetaBaseline Min/Max Sr-90InjectionsAdjacent InjectionsSpecific Conductance
P-8-H
0
50
100
150
200
250
300
350
4/1/06 10/18/06 5/6/07 11/22/07 6/9/08 12/26/08 7/14/09
Ca
(mg/
L)
0
500
1,000
1,500
2,000
2,500
3,000
3,500
4,000
4,500
5,000
PO4
(mg/
L)
199-N-133 CalciumInjectionsAdjacent InjectionsPhosphate (mg/L)
P-8-H
Figure B.31. Performance Plots for Well 199-N-133 (P-8-H)
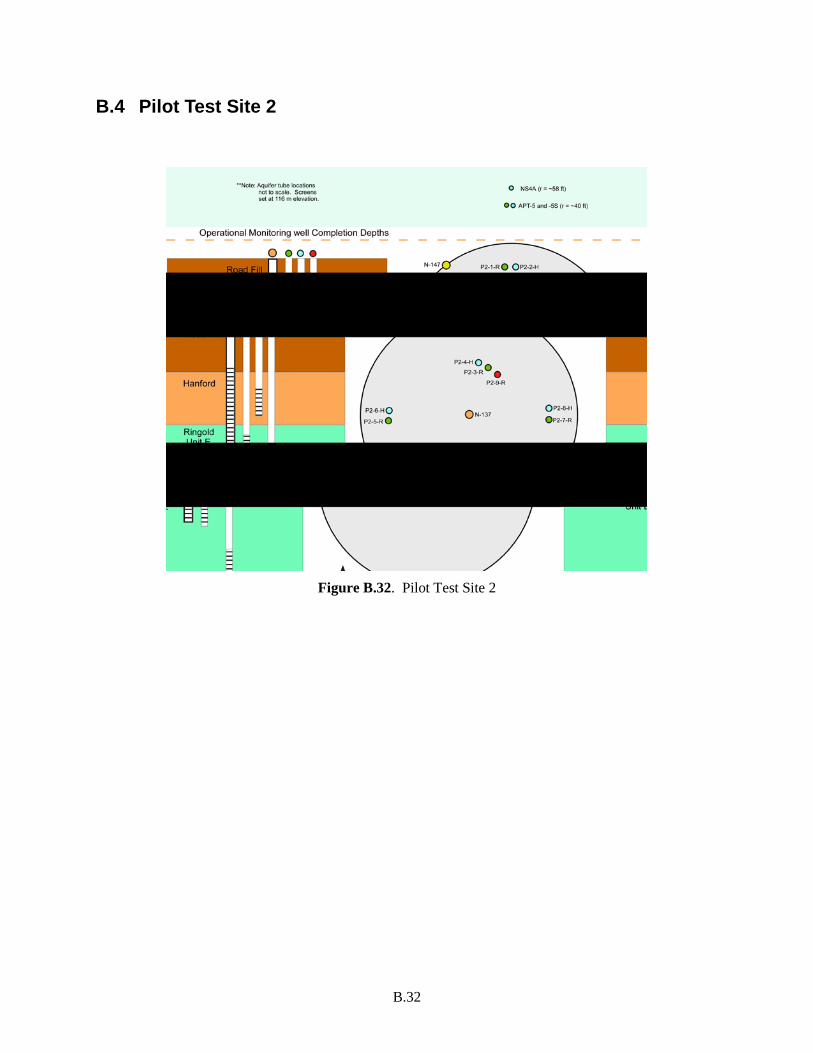
B.32
B.4 Pilot Test Site 2
Figure B.32. Pilot Test Site 2

B.33
0
2,000
4,000
6,000
8,000
10,000
12,000
4/1/06 10/18/06 5/6/07 11/22/07 6/9/08 12/26/08 7/14/09
Sr-9
0 (p
Ci/L
)
0
1,000
2,000
3,000
4,000
5,000
6,000
7,000
8,000
9,000
SpC
(uS/
cm)
199-N-148 Sr-90Total beta radiostrontiumSr-90 from Gross BetaBaseline Min/Max Sr-90InjectionsAdjacent InjectionsSpecific Conductance
P2-1-R
0
50
100
150
200
250
300
4/1/06 10/18/06 5/6/07 11/22/07 6/9/08 12/26/08 7/14/09
Ca
(mg/
L)
0
1,000
2,000
3,000
4,000
5,000
6,000
7,000
8,000
9,000
PO4
(mg/
L)
199-N-148 CalciumInjectionsAdjacent InjectionsPhosphate (mg/L)
P2-1-R
Figure B.33. Performance Plots for Well 199-N-148 (P2-1-R)

B.34
0
2,000
4,000
6,000
8,000
10,000
12,000
4/1/06 10/18/06 5/6/07 11/22/07 6/9/08 12/26/08 7/14/09
Sr-9
0 (p
Ci/L
)
0
1,000
2,000
3,000
4,000
5,000
6,000
7,000
8,000
9,000
SpC
(uS/
cm)
199-N-149 Sr-90
Sr-90 from Gross Beta
Baseline Min/Max Sr-90
Injections
Adjacent Injections
Specific Conductance
P2-2-H
0
50
100
150
200
250
300
4/1/06 10/18/06 5/6/07 11/22/07 6/9/08 12/26/08 7/14/09
Ca
(mg/
L)
0
1,000
2,000
3,000
4,000
5,000
6,000
7,000
8,000
9,000
PO4
(mg/
L)
199-N-149 CalciumInjectionsAdjacent InjectionsPhosphate (mg/L)
P2-2-H
Figure B.34. Performance Plots for Well 199-N-149 (P2-2-H)
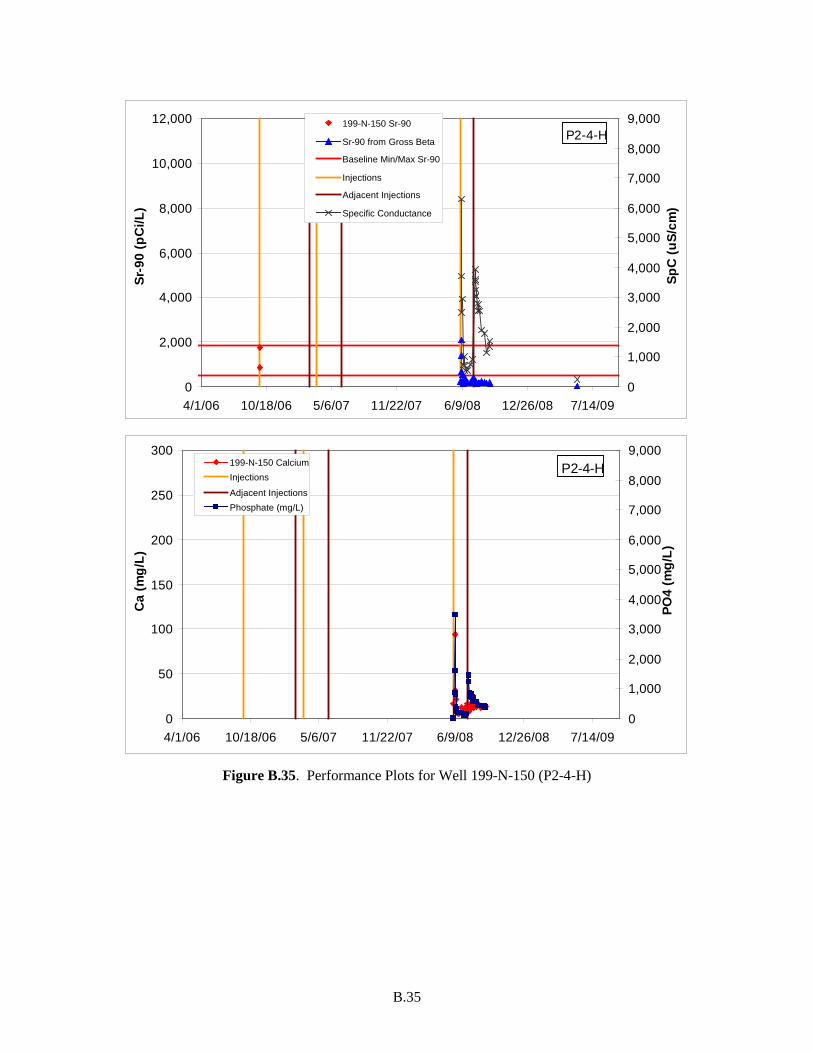
B.35
0
2,000
4,000
6,000
8,000
10,000
12,000
4/1/06 10/18/06 5/6/07 11/22/07 6/9/08 12/26/08 7/14/09
Sr-9
0 (p
Ci/L
)
0
1,000
2,000
3,000
4,000
5,000
6,000
7,000
8,000
9,000
SpC
(uS/
cm)
199-N-150 Sr-90
Sr-90 from Gross Beta
Baseline Min/Max Sr-90
Injections
Adjacent Injections
Specific Conductance
P2-4-H
0
50
100
150
200
250
300
4/1/06 10/18/06 5/6/07 11/22/07 6/9/08 12/26/08 7/14/09
Ca
(mg/
L)
0
1,000
2,000
3,000
4,000
5,000
6,000
7,000
8,000
9,000
PO4
(mg/
L)
199-N-150 CalciumInjectionsAdjacent InjectionsPhosphate (mg/L)
P2-4-H
Figure B.35. Performance Plots for Well 199-N-150 (P2-4-H)

B.36
0
2,000
4,000
6,000
8,000
10,000
12,000
4/1/06 10/18/06 5/6/07 11/22/07 6/9/08 12/26/08 7/14/09
Sr-9
0 (p
Ci/L
)
0
1,000
2,000
3,000
4,000
5,000
6,000
7,000
8,000
9,000
SpC
(uS/
cm)
199-N-151 Sr-90Total beta radiostrontiumSr-90 from Gross BetaBaseline Min/Max Sr-90InjectionsAdjacent InjectionsSpecific Conductance
P2-3-R
0
50
100
150
200
250
300
4/1/06 10/18/06 5/6/07 11/22/07 6/9/08 12/26/08 7/14/09
Ca
(mg/
L)
0
1,000
2,000
3,000
4,000
5,000
6,000
7,000
8,000
9,000
PO4
(mg/
L)
199-N-151 CalciumInjectionsAdjacent InjectionsPhosphate (mg/L)
P2-3-R
Figure B.36. Performance Plots for Well 199-N-151 (P2-3-R)
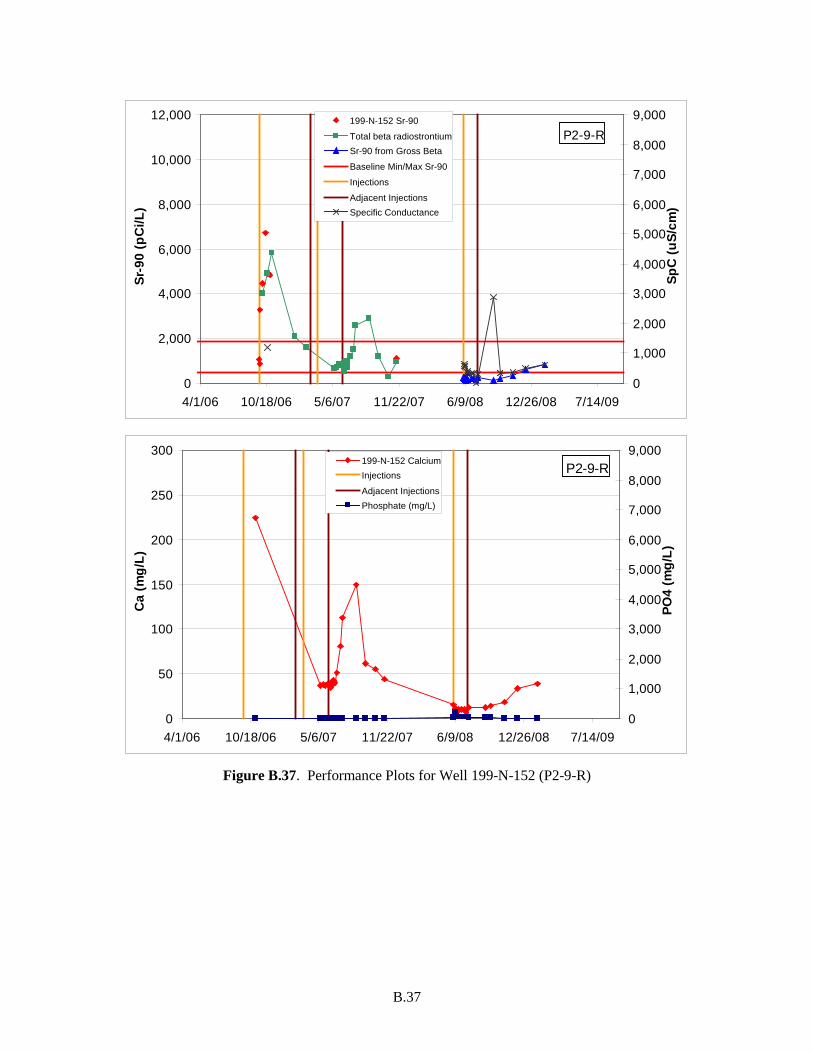
B.37
0
2,000
4,000
6,000
8,000
10,000
12,000
4/1/06 10/18/06 5/6/07 11/22/07 6/9/08 12/26/08 7/14/09
Sr-9
0 (p
Ci/L
)
0
1,000
2,000
3,000
4,000
5,000
6,000
7,000
8,000
9,000
SpC
(uS/
cm)
199-N-152 Sr-90Total beta radiostrontiumSr-90 from Gross BetaBaseline Min/Max Sr-90InjectionsAdjacent InjectionsSpecific Conductance
P2-9-R
0
50
100
150
200
250
300
4/1/06 10/18/06 5/6/07 11/22/07 6/9/08 12/26/08 7/14/09
Ca
(mg/
L)
0
1,000
2,000
3,000
4,000
5,000
6,000
7,000
8,000
9,000
PO4
(mg/
L)
199-N-152 CalciumInjectionsAdjacent InjectionsPhosphate (mg/L)
P2-9-R
Figure B.37. Performance Plots for Well 199-N-152 (P2-9-R)

B.38
0
2,000
4,000
6,000
8,000
10,000
12,000
4/1/06 10/18/06 5/6/07 11/22/07 6/9/08 12/26/08 7/14/09
Sr-9
0 (p
Ci/L
)
0
1,000
2,000
3,000
4,000
5,000
6,000
7,000
8,000
9,000
SpC
(uS/
cm)
199-N-153 Sr-90
Sr-90 from Gross Beta
Baseline Min/Max Sr-90
Injections
Adjacent Injections
Specific Conductance
P2-8-H
0
50
100
150
200
250
300
4/1/06 10/18/06 5/6/07 11/22/07 6/9/08 12/26/08 7/14/09
Ca
(mg/
L)
0
1,000
2,000
3,000
4,000
5,000
6,000
7,000
8,000
9,000
PO4
(mg/
L)
199-N-153 CalciumInjectionsAdjacent InjectionsPhosphate (mg/L)
P2-8-H
Figure B.38. Performance Plots for Well 199-N-153 (P2-8-H)

B.39
0
2,000
4,000
6,000
8,000
10,000
12,000
4/1/06 10/18/06 5/6/07 11/22/07 6/9/08 12/26/08 7/14/09
Sr-9
0 (p
Ci/L
)
0
1,000
2,000
3,000
4,000
5,000
6,000
7,000
8,000
9,000
SpC
(uS/
cm)
199-N-154 Sr-90Total beta radiostrontiumSr-90 from Gross BetaBaseline Min/Max Sr-90InjectionsAdjacent InjectionsSpecific Conductance
P2-7-R
0
50
100
150
200
250
300
4/1/06 10/18/06 5/6/07 11/22/07 6/9/08 12/26/08 7/14/09
Ca
(mg/
L)
0
1,000
2,000
3,000
4,000
5,000
6,000
7,000
8,000
9,000
PO4
(mg/
L)
199-N-154 CalciumInjectionsAdjacent InjectionsPhosphate (mg/L)
P2-7-R
Figure B.39. Performance Plots for Well 199-N-154 (P-7-R)

B.40
0
2,000
4,000
6,000
8,000
10,000
12,000
4/1/06 10/18/06 5/6/07 11/22/07 6/9/08 12/26/08 7/14/09
Sr-9
0 (p
Ci/L
)
0
1,000
2,000
3,000
4,000
5,000
6,000
7,000
8,000
9,000
SpC
(uS/
cm)
199-N-155 Sr-90
Sr-90 from Gross Beta
Baseline Min/Max Sr-90
Injections
Adjacent Injections
Specific Conductance
P2-6-H
0
50
100
150
200
250
300
4/1/06 10/18/06 5/6/07 11/22/07 6/9/08 12/26/08 7/14/09
Ca
(mg/
L)
0
1,000
2,000
3,000
4,000
5,000
6,000
7,000
8,000
9,000
PO4
(mg/
L)
199-N-155 CalciumInjectionsAdjacent InjectionsPhosphate (mg/L)
P2-6-H
Figure B.40. Performance Plots for Well 199-N-155 (P-6-H)
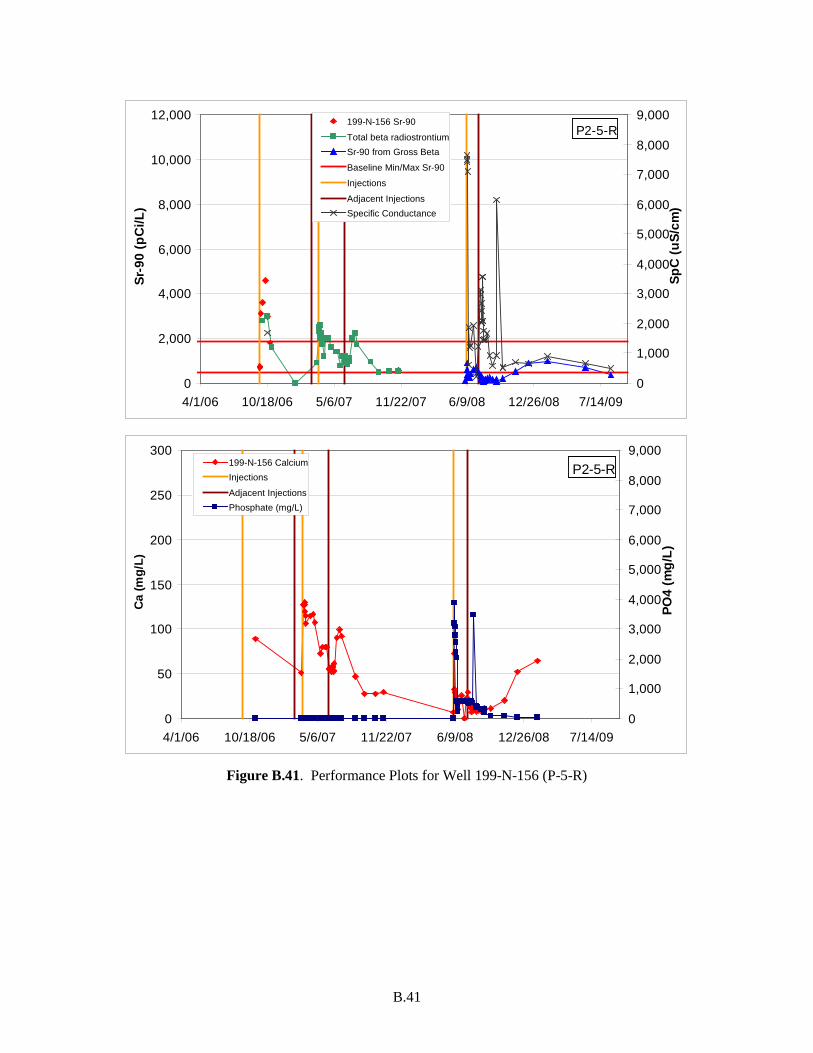
B.41
0
2,000
4,000
6,000
8,000
10,000
12,000
4/1/06 10/18/06 5/6/07 11/22/07 6/9/08 12/26/08 7/14/09
Sr-9
0 (p
Ci/L
)
0
1,000
2,000
3,000
4,000
5,000
6,000
7,000
8,000
9,000
SpC
(uS/
cm)
199-N-156 Sr-90Total beta radiostrontiumSr-90 from Gross BetaBaseline Min/Max Sr-90InjectionsAdjacent InjectionsSpecific Conductance
P2-5-R
0
50
100
150
200
250
300
4/1/06 10/18/06 5/6/07 11/22/07 6/9/08 12/26/08 7/14/09
Ca (m
g/L)
0
1,000
2,000
3,000
4,000
5,000
6,000
7,000
8,000
9,000
PO4
(mg/
L)
199-N-156 CalciumInjectionsAdjacent InjectionsPhosphate (mg/L)
P2-5-R
Figure B.41. Performance Plots for Well 199-N-156 (P-5-R)

B.42
B.5 Aquifer Tubes
Figure B.42. Map of Aquifer Tube Locations

B.43
0
1,000
2,000
3,000
4,000
5,000
6,000
7,000
6/1/05 12/18/05 7/6/06 1/22/07 8/10/07 2/26/08 9/13/08 4/1/09
Sr-9
0 (p
Ci/L
)
0
1,000
2,000
3,000
4,000
5,000
6,000
SpC
(uS/
cm)
N116mArray-2A Strontium-90Total beta radiostrontium
Sr-90 from Gross Beta
Baseline Min/Max Sr-90
Nearby Injections
Specif ic Conductance
0
50
100
150
200
250
300
6/1/05 12/18/05 7/6/06 1/22/07 8/10/07 2/26/08 9/13/08 4/1/09
Ca
(mg/
L)
0
50
100
150
200
250
300
350
PO4
(mg/
L)
N116mArray-2A CalciumNearby InjectionsPhosphate (mg/L)
Figure B.43. Performance Plots for Tube 2A

B.44
0
1,000
2,000
3,000
4,000
5,000
6,000
7,000
6/1/05 12/18/05 7/6/06 1/22/07 8/10/07 2/26/08 9/13/08 4/1/09
Sr-9
0 (p
Ci/L
)
0
1,000
2,000
3,000
4,000
5,000
6,000
SpC
(uS/
cm)
N116mArray-3A Strontium-90Total beta radiostrontium
Sr-90 from Gross Beta
Baseline Min/Max Sr-90
Nearby Injections
Specif ic Conductance
0
50
100
150
200
250
300
6/1/05 12/18/05 7/6/06 1/22/07 8/10/07 2/26/08 9/13/08 4/1/09
Ca
(mg/
L)
0
50
100
150
200
250
300
350
PO4
(mg/
L)
N116mArray-3ACalciumNearby Injections
Ph h t ( /L)
Figure B.44. Performance Plots for Tube 3A
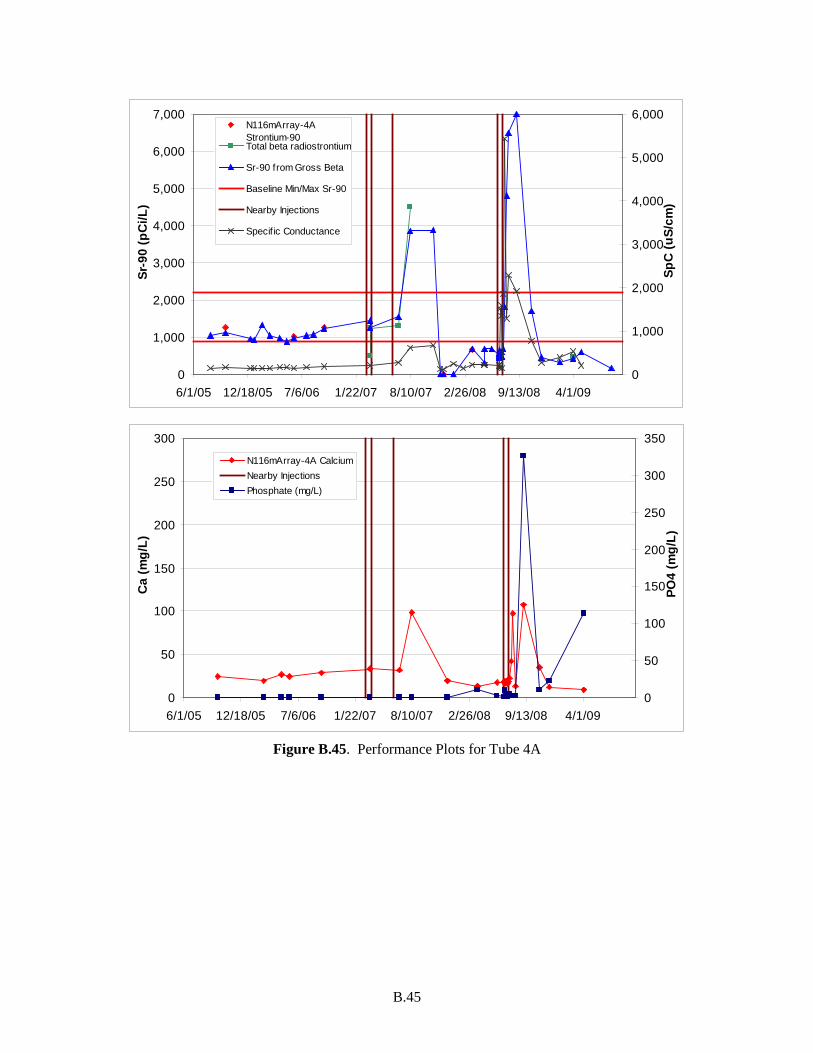
B.45
0
1,000
2,000
3,000
4,000
5,000
6,000
7,000
6/1/05 12/18/05 7/6/06 1/22/07 8/10/07 2/26/08 9/13/08 4/1/09
Sr-9
0 (p
Ci/L
)
0
1,000
2,000
3,000
4,000
5,000
6,000
SpC
(uS/
cm)
N116mArray-4AStrontium-90Total beta radiostrontium
Sr-90 from Gross Beta
Baseline Min/Max Sr-90
Nearby Injections
Specif ic Conductance
0
50
100
150
200
250
300
6/1/05 12/18/05 7/6/06 1/22/07 8/10/07 2/26/08 9/13/08 4/1/09
Ca
(mg/
L)
0
50
100
150
200
250
300
350
PO4
(mg/
L)
N116mArray-4A CalciumNearby InjectionsPhosphate (mg/L)
Figure B.45. Performance Plots for Tube 4A

B.46
0
10,000
20,000
30,000
40,000
50,000
60,000
70,000
80,000
6/1/05 12/18/05
7/6/06 1/22/07 8/10/07 2/26/08 9/13/08 4/1/09
Sr-9
0 (p
Ci/L
)
0
1,000
2,000
3,000
4,000
5,000
6,000
SpC
(uS/
cm)
NVP2-116.0 Strontium-90Total beta radiostrontiumSr-90 from Gross BetaBaseline Min/Max Sr-90Nearby InjectionsSpecific Conductance
Note: Increased Sr-90 Scale
0
100
200
300
400
500
600
6/1/05 12/18/05 7/6/06 1/22/07 8/10/07 2/26/08 9/13/08 4/1/09
Ca
(mg/
L)
0
100
200
300
400
500
600
700
800
900
PO4
(mg/
L)
NVP2-116.0 CalciumNearby InjectionsPhosphate (mg/L)
Note: Increased Ca and PO4 Scale
Figure B.46. Performance Plots for Tube NVP2
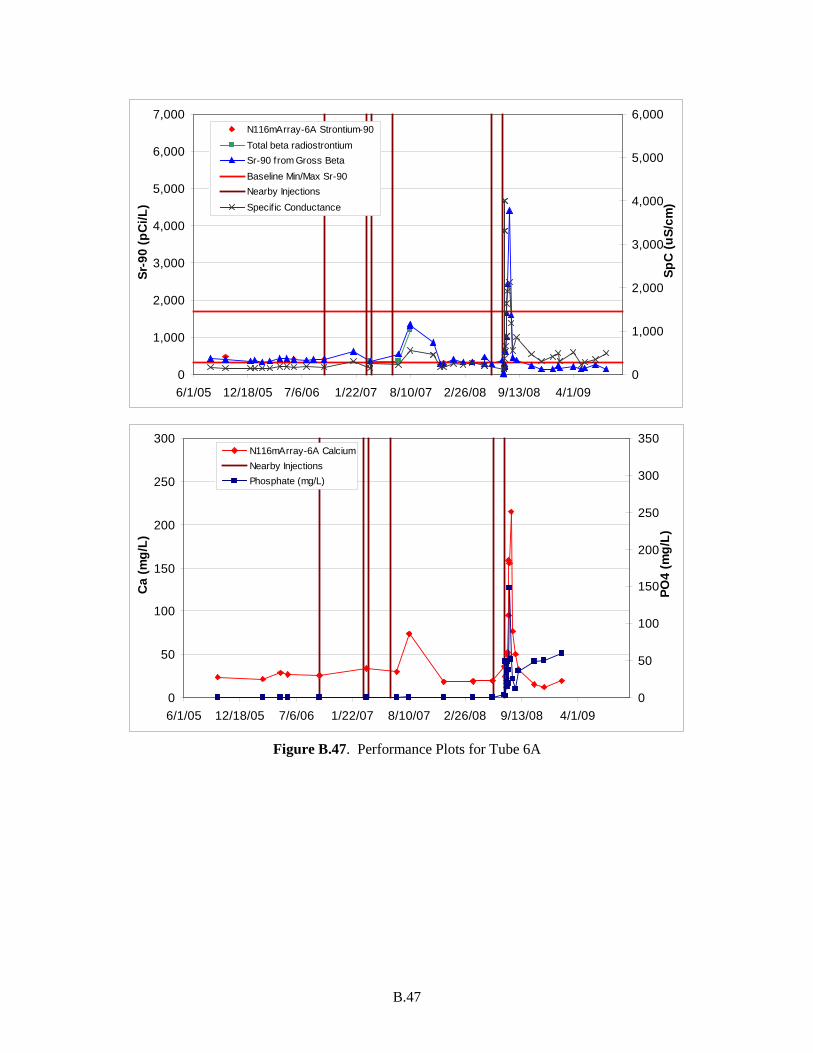
B.47
0
1,000
2,000
3,000
4,000
5,000
6,000
7,000
6/1/05 12/18/05 7/6/06 1/22/07 8/10/07 2/26/08 9/13/08 4/1/09
Sr-9
0 (p
Ci/L
)
0
1,000
2,000
3,000
4,000
5,000
6,000
SpC
(uS/
cm)
N116mArray-6A Strontium-90Total beta radiostrontiumSr-90 from Gross BetaBaseline Min/Max Sr-90Nearby InjectionsSpecif ic Conductance
0
50
100
150
200
250
300
6/1/05 12/18/05 7/6/06 1/22/07 8/10/07 2/26/08 9/13/08 4/1/09
Ca
(mg/
L)
0
50
100
150
200
250
300
350
PO4
(mg/
L)
N116mArray-6A CalciumNearby InjectionsPhosphate (mg/L)
Figure B.47. Performance Plots for Tube 6A
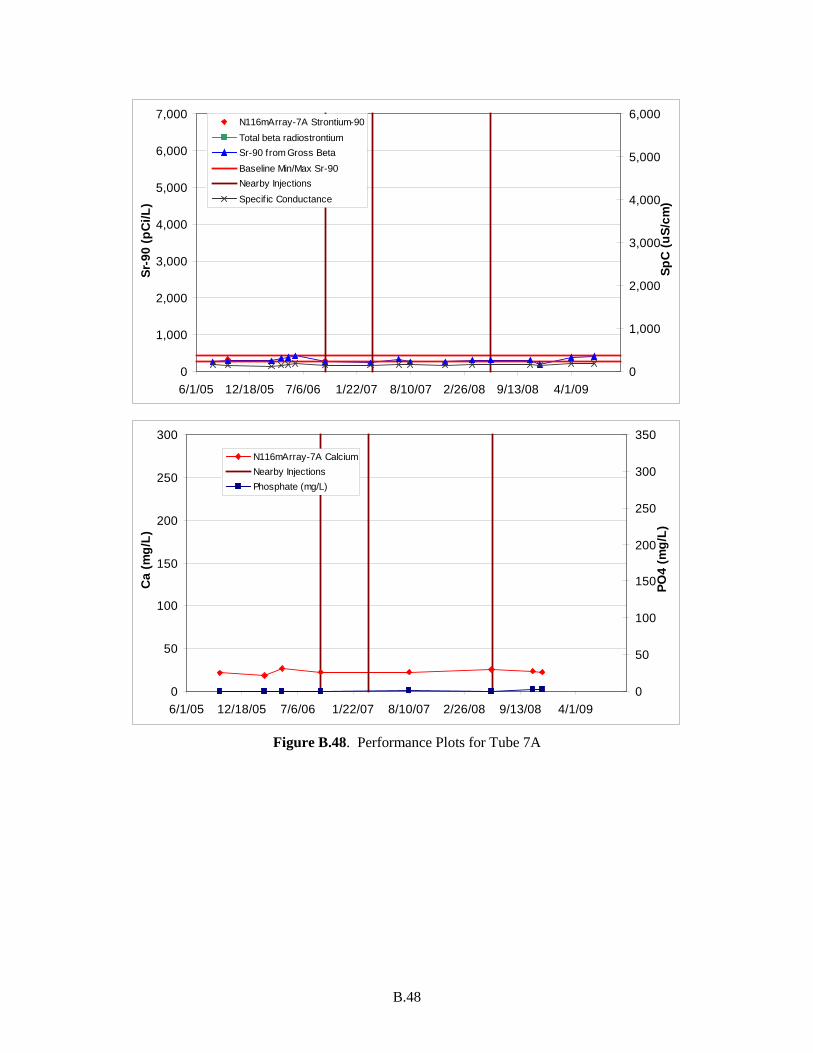
B.48
0
1,000
2,000
3,000
4,000
5,000
6,000
7,000
6/1/05 12/18/05 7/6/06 1/22/07 8/10/07 2/26/08 9/13/08 4/1/09
Sr-9
0 (p
Ci/L
)
0
1,000
2,000
3,000
4,000
5,000
6,000
SpC
(uS/
cm)
N116mArray-7A Strontium-90Total beta radiostrontiumSr-90 from Gross BetaBaseline Min/Max Sr-90Nearby InjectionsSpecif ic Conductance
0
50
100
150
200
250
300
6/1/05 12/18/05 7/6/06 1/22/07 8/10/07 2/26/08 9/13/08 4/1/09
Ca
(mg/
L)
0
50
100
150
200
250
300
350
PO4
(mg/
L)
N116mArray-7A CalciumNearby InjectionsPhosphate (mg/L)
Figure B.48. Performance Plots for Tube 7A
PNNL-19572
Distribution
No. of No. of Copies Copies
Distr.1
6 U.S. Department of Energy JP Hanson A5-11 M Thompson (5) A6-38
5 CH2M Hill Plateau Remediation Company NA Bowles (5) R3-60
12 Pacific Northwest National Laboratory
BG Fritz K6-75 JS Fruchter K6-96 TJ Gilmore K6-96 JE Szecsody K3-61 VR Vermeul (5) K6-96 MD Williams K6-96 Hanford Technical Library (2) P8-55