10 years after: Implications of the current financial ... · of the current financial market...
28
10 years after: Implications of the current financial market turmoil 9th OECD-ADBI Roundtable on Capital Market Reform in Asia Tokyo, 26-27 February 2008 This report is solely for the use of client personnel. No part of it may be circulated, quoted, or reproduced for distribution outside the client organisation without prior written approval from McKinsey & Company. This material was used by McKinsey & Company during an oral presentation; it is not a complete record of the discussion.
-
Upload
truongkien -
Category
Documents
-
view
216 -
download
0
Transcript of 10 years after: Implications of the current financial ... · of the current financial market...

10 years after: Implications
of the current financial
market turmoil
9th OECD-ADBI Roundtable on Capital Market Reform
in Asia
Tokyo, 26-27 February 2008This report is solely for the use of client personnel. No part of it may be
circulated, quoted, or reproduced for distribution outside the client
organisation without prior written approval from McKinsey & Company.
This material was used by McKinsey & Company during an oral
presentation; it is not a complete record of the discussion.

1
AGENDA
• 10 years after: Positive diagnostic on Asia’s financial
markets health
• US subprime crisis: Visible but limited direct impact to date
• The next 10 years: Opportunities outweigh challenges
• The road ahead: Shift from hardware to software
2
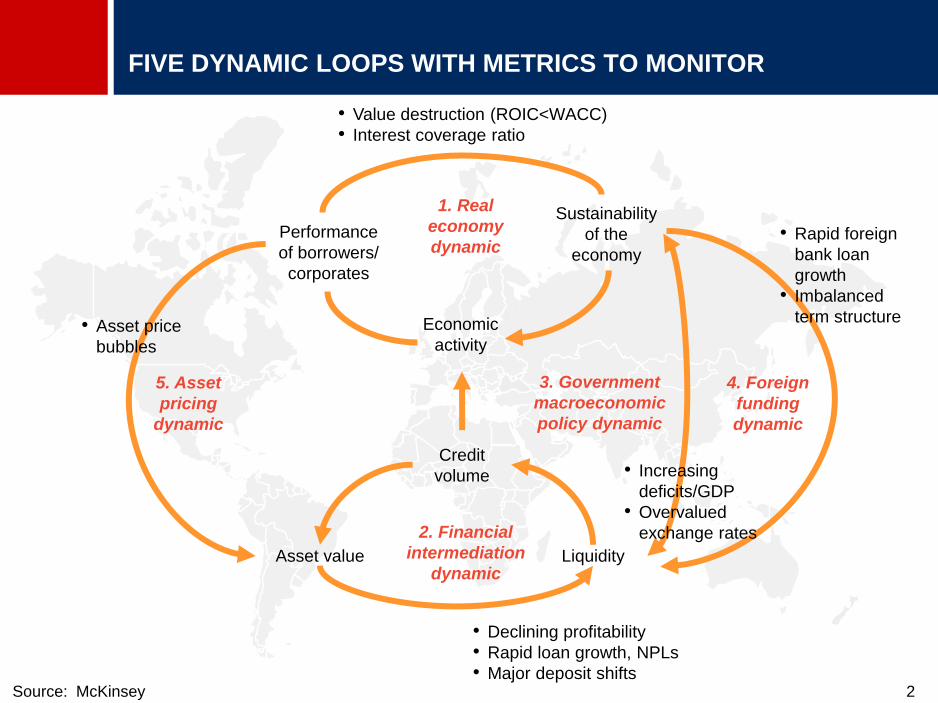
FIVE DYNAMIC LOOPS WITH METRICS TO MONITOR
Source: McKinsey
5. Asset
pricing
dynamic
4. Foreign
funding
dynamic
3. Government
macroeconomic
policy dynamic
2. Financial
intermediation
dynamicAsset value Liquidity
Credit
volume
1. Real
economy
dynamicPerformance
of borrowers/
corporates
Economic
activity
Sustainability
of the
economy
• Value destruction (ROIC<WACC)
• Interest coverage ratio
• Declining profitability
• Rapid loan growth, NPLs
• Major deposit shifts
• Rapid foreign
bank loan
growth
• Imbalanced
term structure
• Increasing
deficits/GDP
• Overvalued
exchange rates
• Asset price
bubbles

3
TWO MACRO FACTORS AND SEVEN MICRO FACTORS POINT TO
SIGNIFICANT IMPROVEMENTS
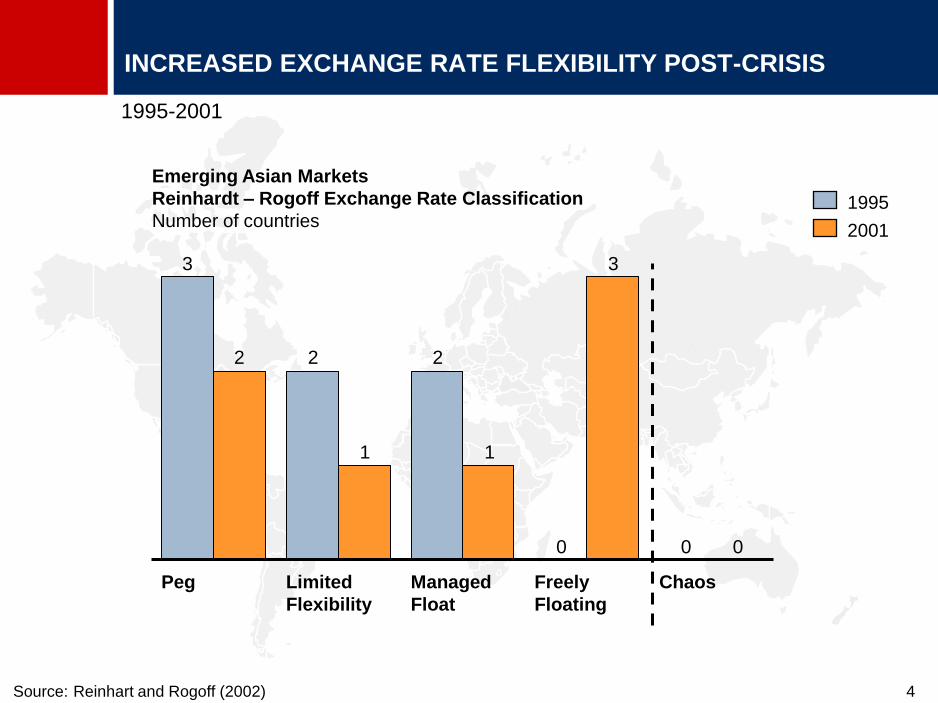
1. Foreign funding and exchange rates: Since
the late 1990s, most exchange rates in Asia
have moved from being fixed to flexible, and
even floating
2. Economic growth, government budget
deficits, inflation and unemployment: There
has been broad improvement in most
government macro indicators across Asia
2 macro factors: Clear improvements
1. Banking systems strength: Underlying strength
and capabilities of banks across Asia significantly
improved over last 10 years
2. Underlying credit and risk skills: Credit
capabilities improved, albeit from a relatively low
base
3. Strength and consistency of regulation and
supervisory approach: Efforts required but
supervisors’ capabilities substantially improved
4. Breadth and depth of financing options: Still
bank dominated but capital markets (particularly
equities) beginning to play a large role
5. Underlying infrastructure efficiency: Payments
systems (e.g., RTGS) improving; exchange
governance and operations overhauled
6. Corporate sector vitality: The majority of listed
Asian companies are now achieving ROIC greater
than their WACC
7. Asset bubbles: Strong contributors and triggers of
past crises (e.g., Thailand in 1997, Sweden in
1992), they remain a concern today
7 micro factors: Solid momentum
Source: McKinsey
4
INCREASED EXCHANGE RATE FLEXIBILITY POST-CRISIS
Source: Reinhart and Rogoff (2002)
00
22
3
0
3
11
2
Managed
Float
Limited
Flexibility
Peg ChaosFreely
Floating
Emerging Asian Markets
Reinhardt – Rogoff Exchange Rate Classification
Number of countries
1995-2001
1995
2001

5
420
774
854
951
1,0511,148
1,2501,354
1,458
284
331
330
320
298276
168355
2008E
1,687
1,105
4,238
2009E
1,812
1,189
4,527
2010E
242
1,921
1,2711,019
1,533
2007E
945
1,317
2006
3,126
3,543
1,066
2005
2,727
843 875
826121
2000
1,064
3,924
2011E
207
2,030
1,357
5,052
2012E
Other
Asia*
Other
major
Asia**
China
Japan
4,788
* Bangladesh, Cambodia, India, Indonesia, Lao PDR, Nepal, Pakistan, Philippines, Sri Lanka, Thailand, Vietnam.
** Hong Kong, Korea, Malaysia, Singapore, Taiwan.
Source: IMF; Ministry of Economic Affairs, Taiwan; Global Insight; UBS Asian Economic Monitor; MGI Cross-border
Holdings Database; McKinsey Global Institute analysis
53
21
32
50
20
41
618
Asian holdings of foreign reserve assets
$ billion
% of nominal GDP
2006 2012
ASIAN FOREIGN EXCHANGE RESERVES TO REACH $5.1
TRILLION
6
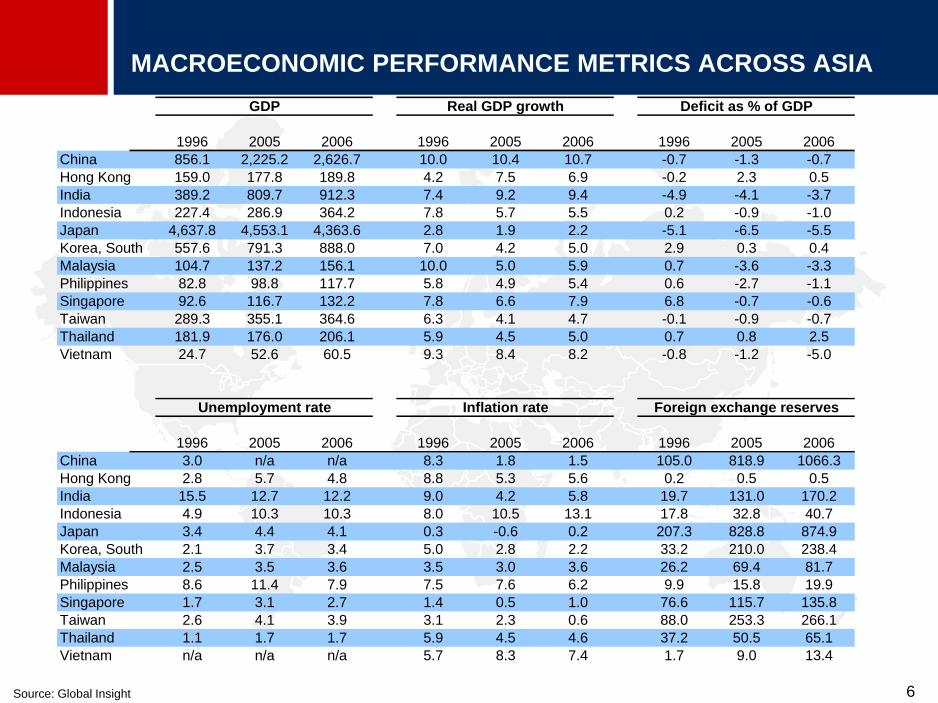
1996 2005 2006 1996 2005 2006 1996 2005 2006
China 856.1 2,225.2 2,626.7 10.0 10.4 10.7 -0.7 -1.3 -0.7
Hong Kong 159.0 177.8 189.8 4.2 7.5 6.9 -0.2 2.3 0.5
India 389.2 809.7 912.3 7.4 9.2 9.4 -4.9 -4.1 -3.7
Indonesia 227.4 286.9 364.2 7.8 5.7 5.5 0.2 -0.9 -1.0
Japan 4,637.8 4,553.1 4,363.6 2.8 1.9 2.2 -5.1 -6.5 -5.5
Korea, South 557.6 791.3 888.0 7.0 4.2 5.0 2.9 0.3 0.4
Malaysia 104.7 137.2 156.1 10.0 5.0 5.9 0.7 -3.6 -3.3
Philippines 82.8 98.8 117.7 5.8 4.9 5.4 0.6 -2.7 -1.1
Singapore 92.6 116.7 132.2 7.8 6.6 7.9 6.8 -0.7 -0.6
Taiwan 289.3 355.1 364.6 6.3 4.1 4.7 -0.1 -0.9 -0.7
Thailand 181.9 176.0 206.1 5.9 4.5 5.0 0.7 0.8 2.5
Vietnam 24.7 52.6 60.5 9.3 8.4 8.2 -0.8 -1.2 -5.0
1996 2005 2006 1996 2005 2006 1996 2005 2006
China 3.0 n/a n/a 8.3 1.8 1.5 105.0 818.9 1066.3
Hong Kong 2.8 5.7 4.8 8.8 5.3 5.6 0.2 0.5 0.5
India 15.5 12.7 12.2 9.0 4.2 5.8 19.7 131.0 170.2
Indonesia 4.9 10.3 10.3 8.0 10.5 13.1 17.8 32.8 40.7
Japan 3.4 4.4 4.1 0.3 -0.6 0.2 207.3 828.8 874.9
Korea, South 2.1 3.7 3.4 5.0 2.8 2.2 33.2 210.0 238.4
Malaysia 2.5 3.5 3.6 3.5 3.0 3.6 26.2 69.4 81.7
Philippines 8.6 11.4 7.9 7.5 7.6 6.2 9.9 15.8 19.9
Singapore 1.7 3.1 2.7 1.4 0.5 1.0 76.6 115.7 135.8
Taiwan 2.6 4.1 3.9 3.1 2.3 0.6 88.0 253.3 266.1
Thailand 1.1 1.7 1.7 5.9 4.5 4.6 37.2 50.5 65.1
Vietnam n/a n/a n/a 5.7 8.3 7.4 1.7 9.0 13.4
GDP Real GDP growth Deficit as % of GDP
Foreign exchange reservesInflation rateUnemployment rate
MACROECONOMIC PERFORMANCE METRICS ACROSS ASIA
Source: Global Insight

7
HIGH DEGREE OF DIRECT STATE INFLUENCE ON THE BANKING
SYSTEM
* Calculated by multiplying government’s equity share of SOE banks by assets under SOE banks
Source: Bankscope; annual reports; Central Banks; BI; team analysis
Banking assets under state-owned banks
Percent, 2005
Banking assets under direct government control*
Percent, 2005
0
0
8
20
22
25
31
47
49
62
Hong Kong
Czech Republic
Indonesia
Philippines
Poland
Taiwan
Thailand
Hungary
Malaysia
Korea
0
0
6
11
12
13
13
15
16
31
Hong Kong
Czech Republic
Malaysia
Thailand
Taiwan
Korea
Poland
Hungary
Indonesia
Philippines
• State-owned banks (i.e. banks in which the government
owns some % of equity) have a larger share of banking
assets in Malaysia and Taiwan, compared to Indonesia
• However, the government in Indonesia directly controls a
much higher share of banking assets
• This is because the Indonesian government owns a
relatively high % of equity in state-owned banks
Indicative sample of
Asian and Eastern
European countries
Indicative sample of
Asian and Eastern
European countries
8
42
48
3
10
13
13
12
15
32
15
26
23
12
57
47
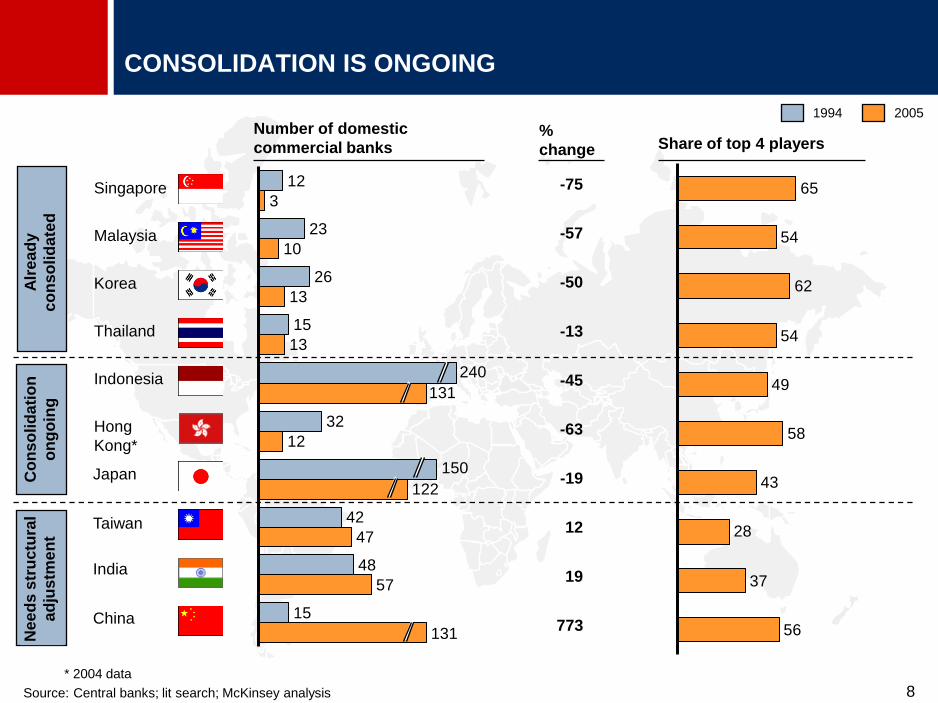
CONSOLIDATION IS ONGOING
Share of top 4 players%
change
Number of domestic
commercial banks
Alr
ea
dy
co
nso
lid
ate
d
Singapore
Korea
Thailand
* 2004 data
Source: Central banks; lit search; McKinsey analysis
Co
ns
olid
ati
on
on
go
ing
Indonesia
Malaysia
Hong
Kong*
China
Japan
Ne
ed
s s
tru
ctu
ral
ad
justm
en
t
India
-75
-57
-50
-13
-45
-63
-19
12
773
19
122
150
240
131
1994 2005
Taiwan
131
65
54
62
54
58
56
37
28
43
49

9
FINANCIAL SECTOR CONCENTRATION INCREASES FINANCIAL
SECTOR STABILITY
Source: Policy Research Working Paper #3041, World Bank, ―Bank concentration and crisis‖, Thorsten Beck, Aslh
Demirguc-Kunt, Ross Levine
Rationale for improved stability
A World Bank
report has found
empirical
evidence linking
concentration and
financial stability
Profit buffer• Concentrated banking systems enhance
profits and therefore lower bank fragility, which
provides a "buffer" against adverse shocks and
increase the franchise value of the bank,
reducing incentives for bank owners to take
excessive risk.
Better
supervision
• A few large banks are easier to monitor than
many small banks, so control of banks will be
more effective and the risks of contagion less
pronounced in a concentrated banking system
Diversification• There is some empirical evidence that large
banks can diversify better so banking systems
with a few large banks will be less fragile than
banking systems with many small banks

10Source: IMF; McKinsey analysis
CAPITAL MARKET DEPTH DECREASES THE
COST OF FINANCIAL CRISIS
0
5
10
15
20
25
30
35
40
0 50 100 150 200
South Korea 97–99
Thailand 97–00
Indonesia 98–00
Chile 82–85
Spain 77–85Mexico 95–97
Finland 90–93
Japan 98–03
US S&L 80–91Sweden 91–93
Brazil 95–96
Argentina 95–96Norway 88–92
Co
st
of
cri
sis
Depth of capital markets at time of crisis
(% of GDP)
Percent
of GDPArgentina 81–90
11
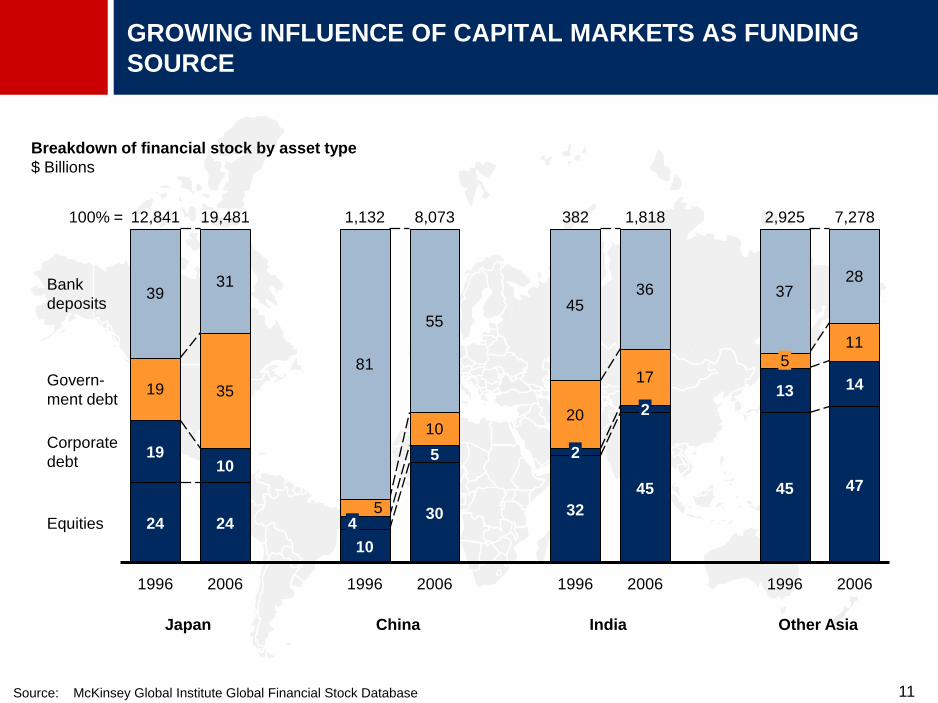
GROWING INFLUENCE OF CAPITAL MARKETS AS FUNDING
SOURCE
19 35
1020
17
11
3931
81
5545
36 3728
524
45
1,81812,841
1996 2006
10
24
19,481
2006
5
13
4
10
45
2,9251,132
1996 1996
5
30
8,073
2006
19 2
32
47
7,278382
1996
14
Bank
deposits
Govern-
ment debt
Corporate
debt
Equities
100% =
2
2006
Japan China India Other Asia
Breakdown of financial stock by asset type
$ Billions
Source: McKinsey Global Institute Global Financial Stock Database
12
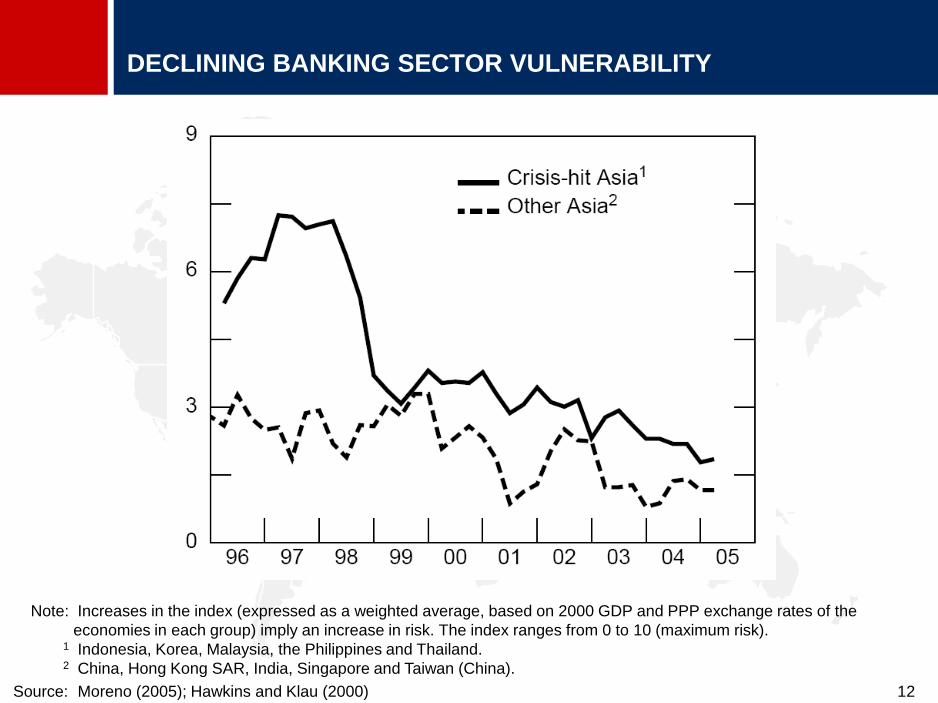
DECLINING BANKING SECTOR VULNERABILITY
Note: Increases in the index (expressed as a weighted average, based on 2000 GDP and PPP exchange rates of the
economies in each group) imply an increase in risk. The index ranges from 0 to 10 (maximum risk).1 Indonesia, Korea, Malaysia, the Philippines and Thailand. 2 China, Hong Kong SAR, India, Singapore and Taiwan (China).
Source: Moreno (2005); Hawkins and Klau (2000)
13
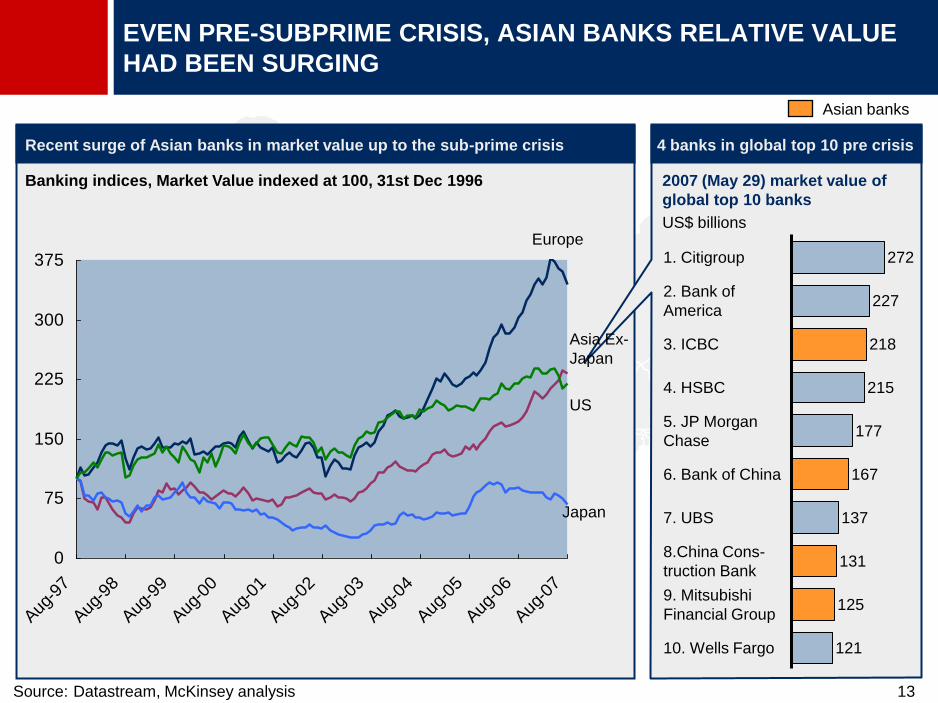
Banking indices, Market Value indexed at 100, 31st Dec 1996
Recent surge of Asian banks in market value up to the sub-prime crisis 4 banks in global top 10 pre crisis
EVEN PRE-SUBPRIME CRISIS, ASIAN BANKS RELATIVE VALUE
HAD BEEN SURGING
2007 (May 29) market value of
global top 10 banks
US$ billions
Asian banks
Source: Datastream, McKinsey analysis
0
75
150
225
300
375
Aug
-97
Aug
-98
Aug
-99
Aug
-00
Aug
-01
Aug
-02
Aug
-03
Aug
-04
Aug
-05
Aug
-06
Aug
-07
Asia Ex-
Japan
Japan
US
Europe 2721. Citigroup
2272. Bank of
America
2183. ICBC
2154. HSBC
1775. JP Morgan
Chase
1676. Bank of China
1377. UBS
1318.China Cons-
truction Bank
1259. Mitsubishi
Financial Group
12110. Wells Fargo

14
AGENDA
• 10 years after: Positive diagnostic on Asia’s financial
markets health
• US subprime crisis: Visible but limited direct impact to
date
• The next 10 years: Opportunities outweigh challenges
• The road ahead: Shift from hardware to software
15
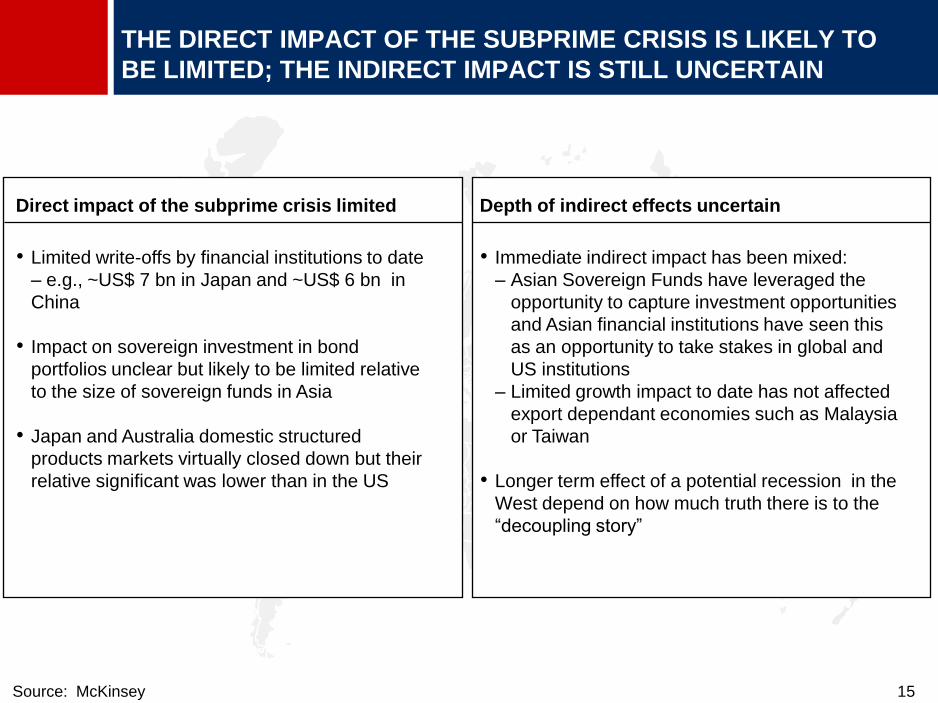
THE DIRECT IMPACT OF THE SUBPRIME CRISIS IS LIKELY TO
BE LIMITED; THE INDIRECT IMPACT IS STILL UNCERTAIN
Direct impact of the subprime crisis limited Depth of indirect effects uncertain
Source: McKinsey
• Limited write-offs by financial institutions to date
– e.g., ~US$ 7 bn in Japan and ~US$ 6 bn in
China
• Impact on sovereign investment in bond
portfolios unclear but likely to be limited relative
to the size of sovereign funds in Asia
• Japan and Australia domestic structured
products markets virtually closed down but their
relative significant was lower than in the US
• Immediate indirect impact has been mixed:
– Asian Sovereign Funds have leveraged the
opportunity to capture investment opportunities
and Asian financial institutions have seen this
as an opportunity to take stakes in global and
US institutions
– Limited growth impact to date has not affected
export dependant economies such as Malaysia
or Taiwan
• Longer term effect of a potential recession in the
West depend on how much truth there is to the
―decoupling story‖
16
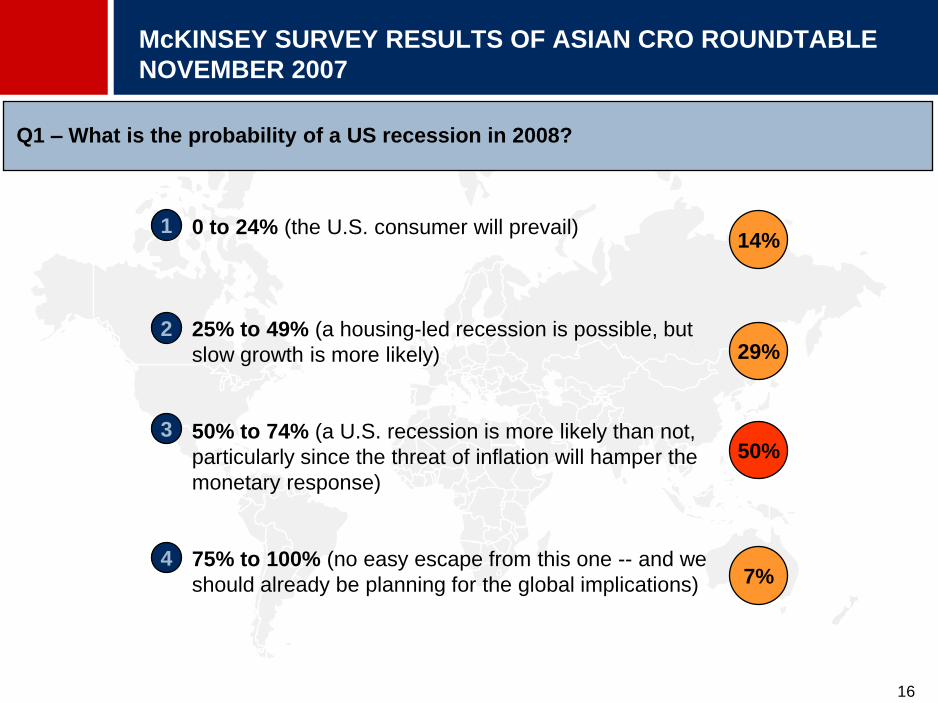
0 to 24% (the U.S. consumer will prevail)
25% to 49% (a housing-led recession is possible, but
slow growth is more likely)
50% to 74% (a U.S. recession is more likely than not,
particularly since the threat of inflation will hamper the
monetary response)
75% to 100% (no easy escape from this one -- and we
should already be planning for the global implications)
1
2
3
4
14%
29%
50%
7%
Q1 – What is the probability of a US recession in 2008?
McKINSEY SURVEY RESULTS OF ASIAN CRO ROUNDTABLE
NOVEMBER 2007

17
By January 2008, this will be behind us (we are 75% of
the way through this)
By mid 2008, credit and liquidity markets will return to
normal (e.g., with spreads returning to 2004 or 2005 levels)
Through late 2008 or early 2009 (we are only 25% through
this)
It will be years before markets fully return to the loose
credit conditions that prevailed over the past 5 years (in
particular, subprime lending, complex CDO structures and
business models heavily reliant on securitization will not
return for several years, if at all).
1
2
3
4
0%
36
%
36%
28%
Q2 – How much longer will the credit and liquidity events experienced since July
continue?
McKINSEY SURVEY RESULTS OF ASIAN CRO ROUNDTABLE
NOVEMBER 2007
18
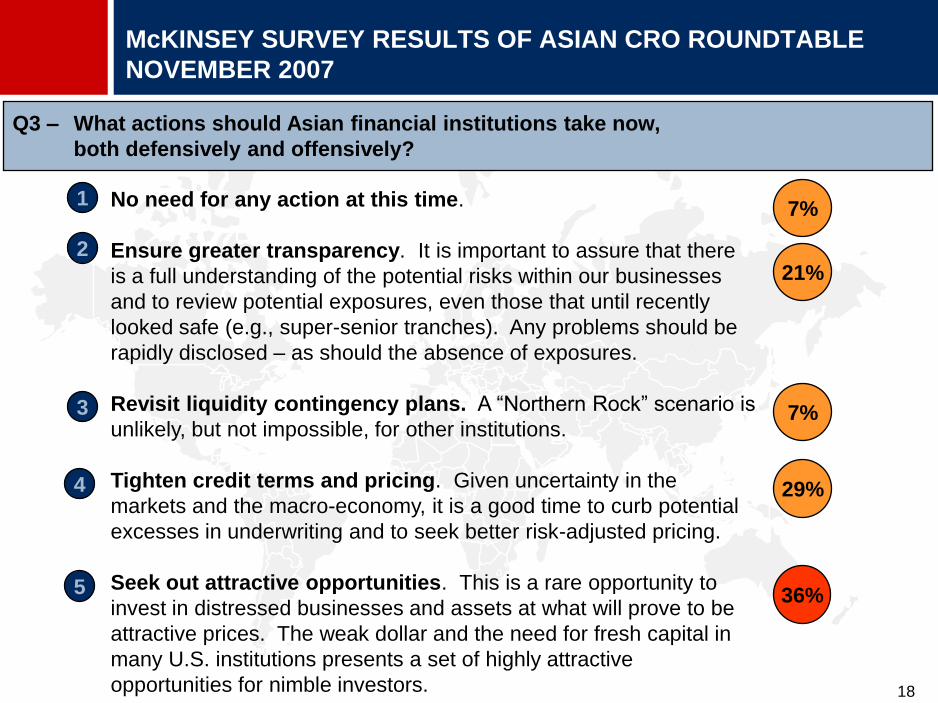
No need for any action at this time.
Ensure greater transparency. It is important to assure that there
is a full understanding of the potential risks within our businesses
and to review potential exposures, even those that until recently
looked safe (e.g., super-senior tranches). Any problems should be
rapidly disclosed – as should the absence of exposures.
Revisit liquidity contingency plans. A ―Northern Rock‖ scenario is
unlikely, but not impossible, for other institutions.
Tighten credit terms and pricing. Given uncertainty in the
markets and the macro-economy, it is a good time to curb potential
excesses in underwriting and to seek better risk-adjusted pricing.
Seek out attractive opportunities. This is a rare opportunity to
invest in distressed businesses and assets at what will prove to be
attractive prices. The weak dollar and the need for fresh capital in
many U.S. institutions presents a set of highly attractive
opportunities for nimble investors.
1
2
3
4
5
7%
21%
7%
29%
36%
Q3 – What actions should Asian financial institutions take now,
both defensively and offensively?
McKINSEY SURVEY RESULTS OF ASIAN CRO ROUNDTABLE
NOVEMBER 2007

19
AGENDA
• 10 years after: Positive diagnostic on Asia’s financial
markets health
• US subprime crisis: Visible but limited direct impact to date
• The next 10 years: Opportunities outweigh challenges
• The road ahead: Shift from hardware to software

20
OPPORTUNITIES AND CHALLENGES FOR THE NEXT 10 YEARS
1. India and China rise: By 2015, 800 million
people in China and India will join the middle
class
2. The return of Japan: Japan has been on the
sidelines for much of the past 16 years and is
emerging stronger from its long reform
3. Infrastructure spending: Annual infrastructure
spending from US$1.1 trillion today to US$2.1
trillion in 2010, increasingly from private sector
4. The rise of Asian champions: By 2010, Asia
could account for 30 percent of the top 1,000
from 18% in 2004
5. Intra-Asia trade: Trade among Asian countries
outgrowing that with the rest of the world with
China an increasingly important trading partner
6. Innovation: Asia becoming a major center of
innovation with need to serve large populations
with low-cost products a driving force
7. Asia’s growing financial power: Asia shifting
from investment destination to home of some of
the most powerful global markets investors
Opportunities
1. Ensure that compliance and risk-management
capabilities can keep up with extraordinary
growth, especially in China and India
2. Win “The War for Talent”: Most significant
constraint to sustained growth is insufficient
leadership and management talent
3. Build regulation, supervision capability: Rapid
changes in all aspects of the financial-services
industry; budgets inadequate in many cases
4. Improve information-sharing, regulatory
coordination: Limited availability, low consistency
(off-balance-sheet activities, int’l flows within Asia)
5. Asset bubbles: There are increasing concerns
about rapidly rising real-estate prices in several
Asian countries
6. Political disruptions or natural disasters:
Growing rich-poor divide fueling social and political
tensions; health care; natural resource constraints
7. Beware of arrogance: Arrogance or over-
confidence – behaviors directly linked to
extraordinary success – were evident in early 1997
Challenges
Source: McKinsey
21
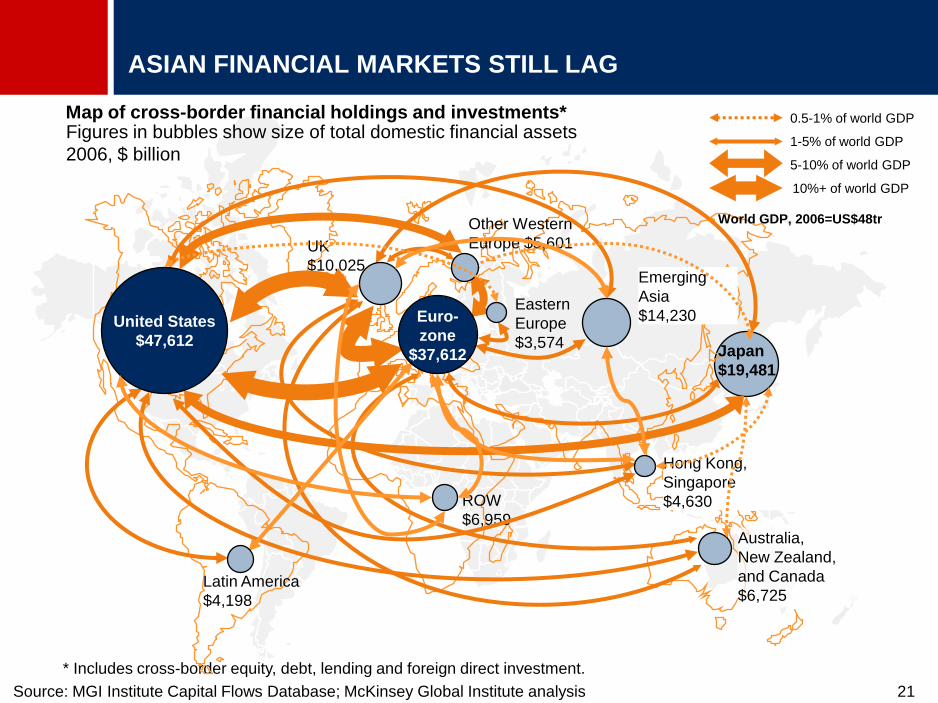
Map of cross-border financial holdings and investments*
* Includes cross-border equity, debt, lending and foreign direct investment.
Source: MGI Institute Capital Flows Database; McKinsey Global Institute analysis
Australia,
New Zealand,
and Canada
$6,725
Eastern
Europe
$3,574
ROW
$6,959
Latin America
$4,198
Other Western
Europe $5,601UK
$10,025
Hong Kong,
Singapore
$4,630
Emerging
Asia
$14,230
Japan
$19,481
Figures in bubbles show size of total domestic financial assets
2006, $ billion
0.5-1% of world GDP
1-5% of world GDP
5-10% of world GDP
10%+ of world GDP
ASIAN FINANCIAL MARKETS STILL LAG
World GDP, 2006=US$48tr
Euro-
zone
$37,612
United States
$47,612

22
* The figures reported for global capital inflows exceed outflows by $150 billion per year due to errors in reporting.
** Includes Russia
Source: McKinsey Global Institute Capital Flows Database
THE U.S., UK, AND EUROPE STILL ACCOUNT FOR 80% OF
CAPITAL FLOWS
Intra-Euro Area flows
Japan
Latin America
Rest of world
U.S.
India
4048
192 300
32 152
2223
82 154
China
106 103721 688
U.K.Eastern
Europe**
Average annual cross-border capital flows*, 2001-05
$ Billions
1,576 1,636
Euro Area
1,022
460
Inflows
Outflows
23
AGENDA
• 10 years after: Positive diagnostic on Asia’s financial
markets health
• US subprime crisis: Visible but limited direct impact to date
• The next 10 years: Opportunities outweigh challenges
• The road ahead: Shift from hardware to software
24
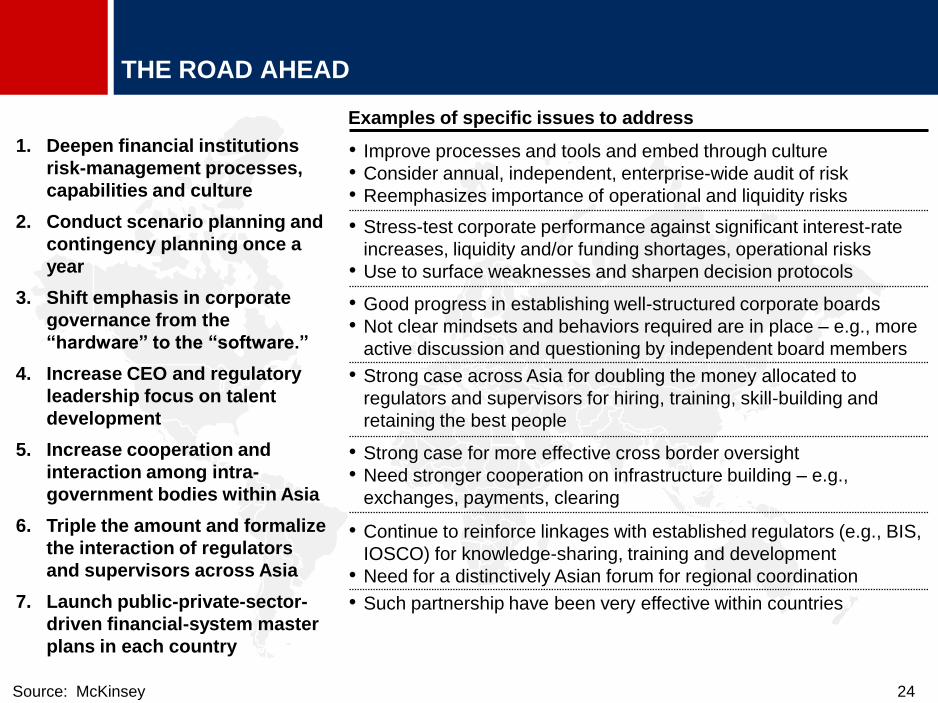
THE ROAD AHEAD
Source: McKinsey
1. Deepen financial institutions
risk-management processes,
capabilities and culture
2. Conduct scenario planning and
contingency planning once a
year
3. Shift emphasis in corporate
governance from the
“hardware” to the “software.”
4. Increase CEO and regulatory
leadership focus on talent
development
5. Increase cooperation and
interaction among intra-
government bodies within Asia
6. Triple the amount and formalize
the interaction of regulators
and supervisors across Asia
7. Launch public-private-sector-
driven financial-system master
plans in each country
• Improve processes and tools and embed through culture
• Consider annual, independent, enterprise-wide audit of risk
• Reemphasizes importance of operational and liquidity risks
Examples of specific issues to address
• Stress-test corporate performance against significant interest-rate
increases, liquidity and/or funding shortages, operational risks
• Use to surface weaknesses and sharpen decision protocols
• Good progress in establishing well-structured corporate boards
• Not clear mindsets and behaviors required are in place – e.g., more
active discussion and questioning by independent board members
• Strong case across Asia for doubling the money allocated to
regulators and supervisors for hiring, training, skill-building and
retaining the best people
• Strong case for more effective cross border oversight
• Need stronger cooperation on infrastructure building – e.g.,
exchanges, payments, clearing
• Continue to reinforce linkages with established regulators (e.g., BIS,
IOSCO) for knowledge-sharing, training and development
• Need for a distinctively Asian forum for regional coordination
• Such partnership have been very effective within countries
25
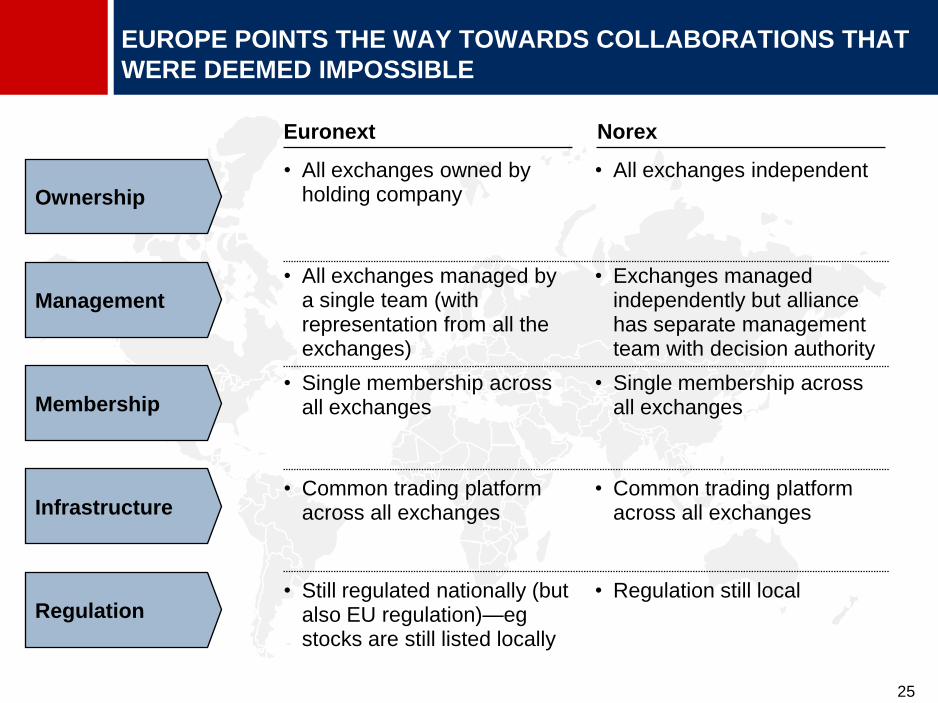
EUROPE POINTS THE WAY TOWARDS COLLABORATIONS THAT
WERE DEEMED IMPOSSIBLE
Euronext Norex
Ownership
Membership
Infrastructure
Regulation
Management
• All exchanges owned by holding company
• All exchanges managed by a single team (with representation from all the exchanges)
• Single membership across all exchanges
• Common trading platform across all exchanges
• Still regulated nationally (but also EU regulation)—eg stocks are still listed locally
• All exchanges independent
• Exchanges managed independently but alliance has separate management team with decision authority
• Single membership across all exchanges
• Common trading platform across all exchanges
• Regulation still local
26
IN CONCLUSION …
•10 years after: Positive diagnostic on
Asia’s financial markets health
•US subprime crisis: Visible but limited
direct impact to date
•The next 10 years: Opportunities
outweigh challenges
•The road ahead: Shift from hardware to
software

10 years after: Implications
of the current financial
market turmoil
9th OECD-ADBI Roundtable on Capital Market Reform
in Asia
Tokyo, 26-27 February 2008This report is solely for the use of client personnel. No part of it may be
circulated, quoted, or reproduced for distribution outside the client
organisation without prior written approval from McKinsey & Company.
This material was used by McKinsey & Company during an oral
presentation; it is not a complete record of the discussion.