10 strategic levers for lcd sourcing
19
10 strategic levers for LCD sourcing 1
-
Upload
ian-hendy -
Category
Technology
-
view
7 -
download
0
Transcript of 10 strategic levers for lcd sourcing
10 strategic levers for LCD sourcing
1

2
Context and agenda
LCDs represent up to 85% of cost of product in some electrical goods and corporates have begun to wake up to the fact strategic responses need to be made to ensure a source of competitive advantage
– Having supply agreements with 2-3 of the major firms is no longer a position of competitive advantage and one could argue could be a risky strategy, since the LCD majors have the highest prices. For a smaller firm that is not critically important to the display industry in mind-share, then relying on the majors will likely be sub-optimal. Sourcing “business as usual” may not be enough
It is also clear that the display industry is one of complexity and uncertainty, with large fluctuations in pricing and apparent shifts in technology directions. LTPS and AMOLED are currently emphasised
For now, strategic responses to sourcing are in vogue, where the investment stakes are higher but in return for real competitive advantage. Apple has certainly used its position and a carefully created strategic supply strategy to lock up its future business in small medium and wrong-foot competitors at the same time
– How should others seek to respond?
– What are the options and upside from strategic sourcing of displays?
We assume that players know about conventional purchasing choices and the use of e-tools (e.g. electronic bidding, sealed bids) and this presentation focuses on more strategic levers but also on display specific levers
Recent display sourcing announcements
• Recent Apple announcement that it will invest $3.9bn in new sourcing contracts for prepaid inventory and capital expenditures. Looks like prepayments for capex into LGD, TMD, Sharp. In small panel, begins to organise the industry into 2 major camps: Samsung vs Apple
• Also a claim that Apple has locked up 60% of the industry projected capacitive touch capacity
• Where does this leave others?
• This demonstrates the competitive advantage of a carefully structured strategic supply contract – can lead to improved economics and ability to out maneuver competitors
C M I
T M D
Sh a r p
L G D
T o u c h

3
It is worth pointing out that the economics of small panel and large panel LCD do differ:
Economics of the two markets differ
– Flex circuits and driver IC play a much greater role in small panel cost structure; lighting architectures different with greater emphasis on optical films in small panel
– Labour might be considered to be similar, but only for small panel players with back-end module assembly in low cost areas. China these days is beginning to get expensive
Key success factors also very different
– For the small panel space is the ability to manage immense complexity given it is a multi-technology, multi-application market space. Capex and factory planning has not been an important decision for a number of years but may be so again since LTPS capacity used up in spring 2011. Look for a change in the small panel space in 2012+
– Large panel decisions are predominantly substrate size and capacity decisions, and more recently coupled to ventures and co-location decisions with customers to try to win long term roadmap alignment
As a result, commodity strategies need to differ for the two markets
Stacked bar chart of cost structures in small vs large panel display making
4
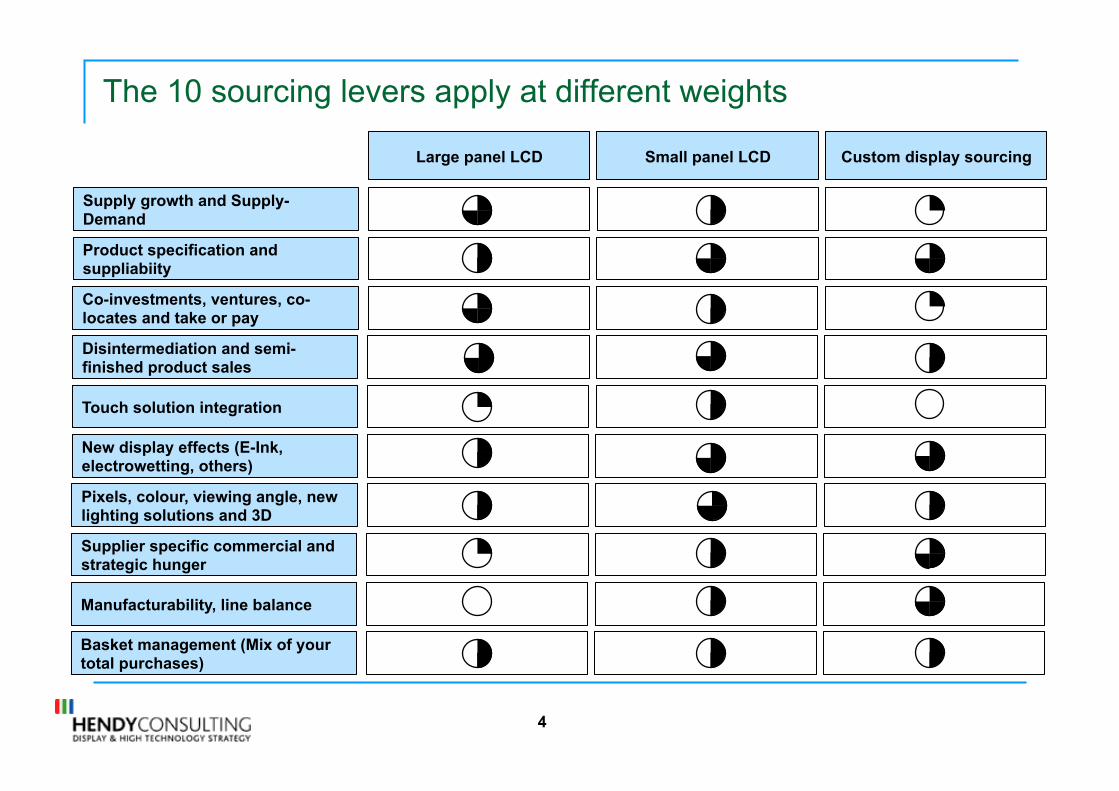
The 10 sourcing levers apply at different weights
Large panel LCD Small panel LCD Custom display sourcing
Supply growth and Supply-Demand
Product specification and suppliabiity
Co-investments, ventures, co-locates and take or pay
Disintermediation and semi-finished product sales
Touch solution integration
New display effects (E-Ink, electrowetting, others)
Pixels, colour, viewing angle, new lighting solutions and 3D
Supplier specific commercial and strategic hunger
Manufacturability, line balance
Basket management (Mix of your total purchases)
5
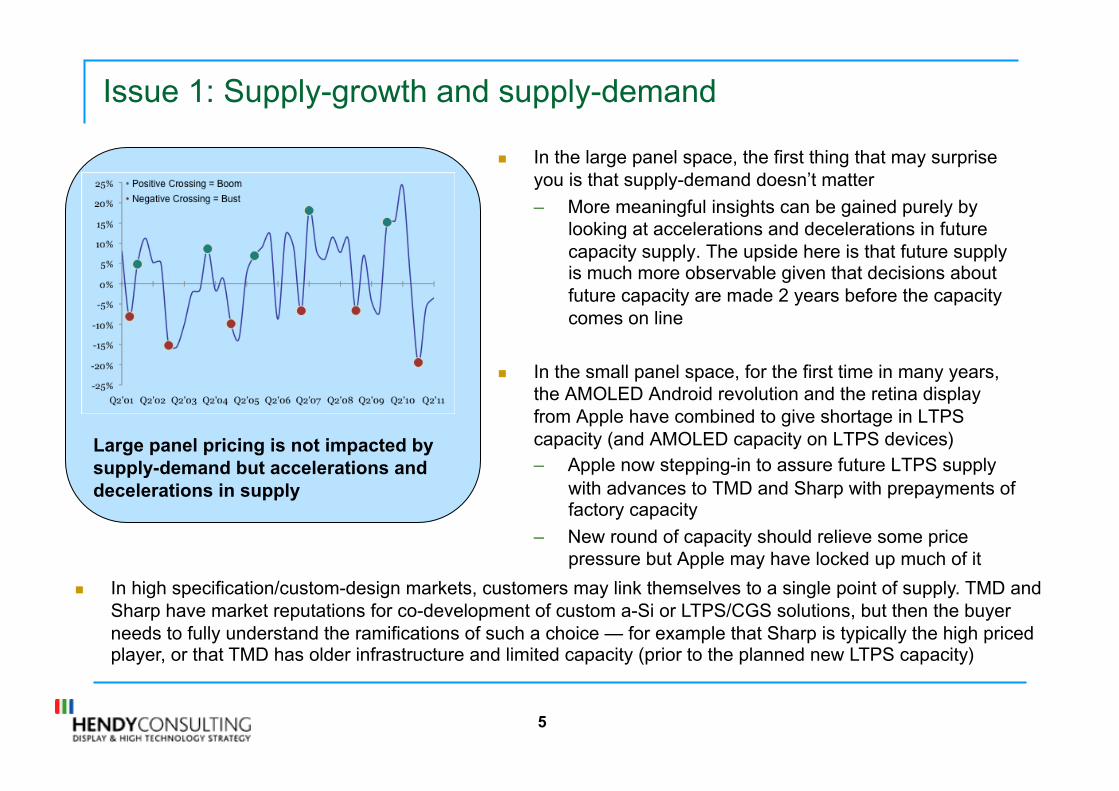
Issue 1: Supply-growth and supply-demand
In the large panel space, the first thing that may surprise you is that supply-demand doesn’t matter
– More meaningful insights can be gained purely by looking at accelerations and decelerations in future capacity supply. The upside here is that future supply is much more observable given that decisions about future capacity are made 2 years before the capacity comes on line
In the small panel space, for the first time in many years, the AMOLED Android revolution and the retina display from Apple have combined to give shortage in LTPS capacity (and AMOLED capacity on LTPS devices) – Apple now stepping-in to assure future LTPS supply
with advances to TMD and Sharp with prepayments of factory capacity
– New round of capacity should relieve some price pressure but Apple may have locked up much of it
Large panel pricing is not impacted by supply-demand but accelerations and decelerations in supply
In high specification/custom-design markets, customers may link themselves to a single point of supply. TMD and Sharp have market reputations for co-development of custom a-Si or LTPS/CGS solutions, but then the buyer needs to fully understand the ramifications of such a choice — for example that Sharp is typically the high priced player, or that TMD has older infrastructure and limited capacity (prior to the planned new LTPS capacity)
6
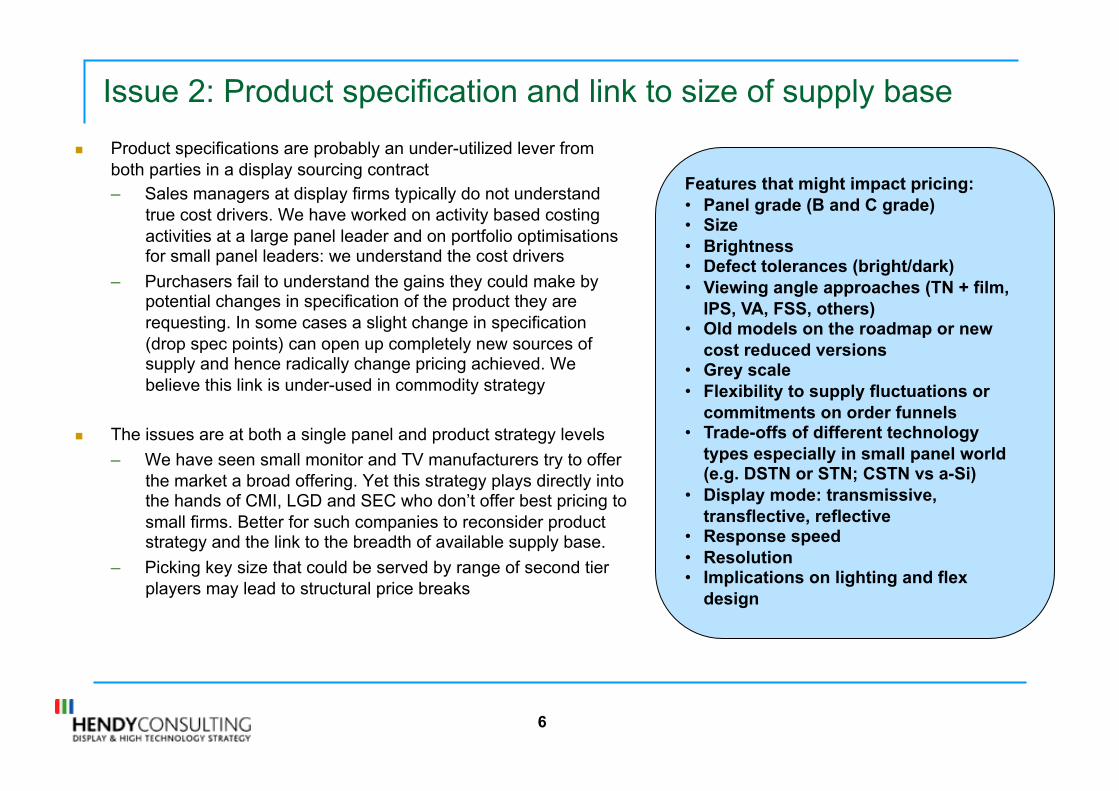
Issue 2: Product specification and link to size of supply base
Product specifications are probably an under-utilized lever from both parties in a display sourcing contract – Sales managers at display firms typically do not understand
true cost drivers. We have worked on activity based costing activities at a large panel leader and on portfolio optimisations for small panel leaders: we understand the cost drivers
– Purchasers fail to understand the gains they could make by potential changes in specification of the product they are requesting. In some cases a slight change in specification (drop spec points) can open up completely new sources of supply and hence radically change pricing achieved. We believe this link is under-used in commodity strategy
The issues are at both a single panel and product strategy levels
– We have seen small monitor and TV manufacturers try to offer the market a broad offering. Yet this strategy plays directly into the hands of CMI, LGD and SEC who don’t offer best pricing to small firms. Better for such companies to reconsider product strategy and the link to the breadth of available supply base.
– Picking key size that could be served by range of second tier players may lead to structural price breaks
Features that might impact pricing: • Panel grade (B and C grade) • Size • Brightness • Defect tolerances (bright/dark) • Viewing angle approaches (TN + film,
IPS, VA, FSS, others) • Old models on the roadmap or new
cost reduced versions • Grey scale • Flexibility to supply fluctuations or
commitments on order funnels • Trade-offs of different technology
types especially in small panel world (e.g. DSTN or STN; CSTN vs a-Si)
• Display mode: transmissive, transflective, reflective
• Response speed • Resolution • Implications on lighting and flex
design
7
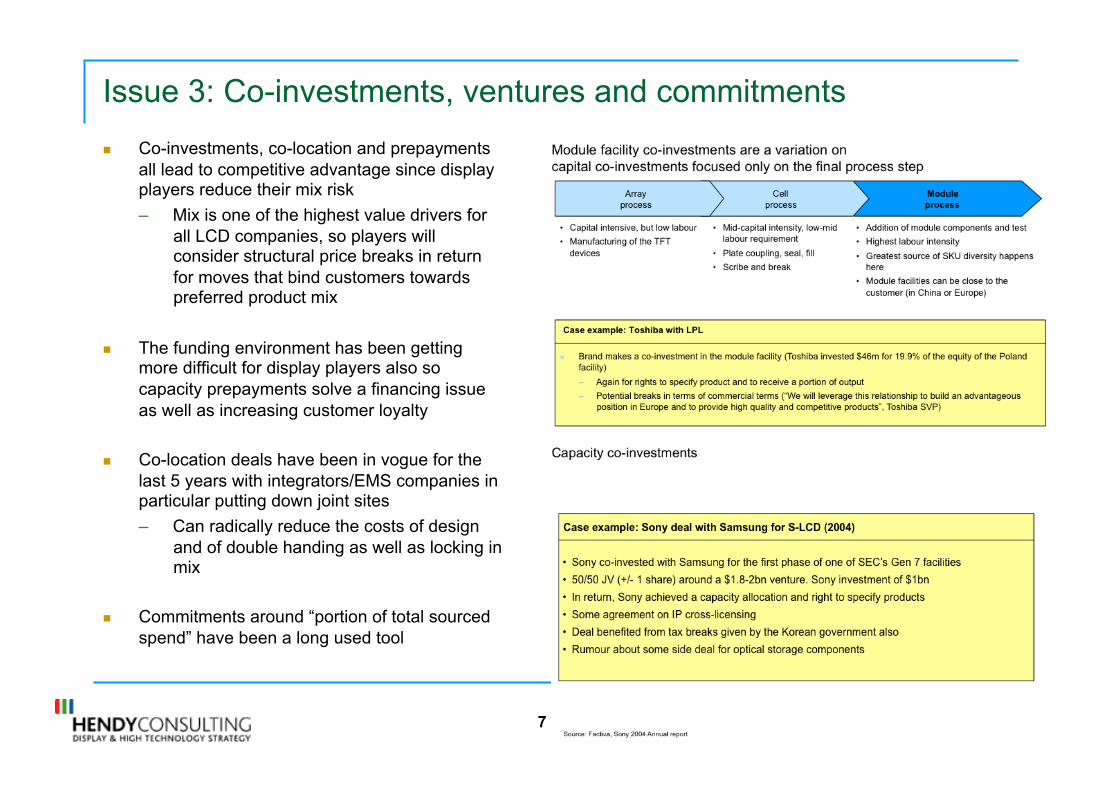
Issue 3: Co-investments, ventures and commitments
Co-investments, co-location and prepayments all lead to competitive advantage since display players reduce their mix risk
– Mix is one of the highest value drivers for all LCD companies, so players will consider structural price breaks in return for moves that bind customers towards preferred product mix
The funding environment has been getting more difficult for display players also so capacity prepayments solve a financing issue as well as increasing customer loyalty
Co-location deals have been in vogue for the last 5 years with integrators/EMS companies in particular putting down joint sites
– Can radically reduce the costs of design and of double handing as well as locking in mix
Commitments around “portion of total sourced spend” have been a long used tool

8
Issue 4: Disintermediation and semi-finished product
Disintermediation and the purchase of semi-finished product is the higher risk, potentially higher reward strategy used heavily in China
– Allows the customer to develop supply chains of their own and control design trade-offs in a much more direct fashion (though at potentially lower scale than an LCD major)
Sales of semi-finished products among display players is a valid model that has been used from time to time
- Allows for portfolio breadth or increased point supply of specific models
- Buyers that know this can add it as a strategic option to work with the display partner of their choice on outside technology
CMI has a major semi-finished product business, which is not good economics for them but ensures strong customer following. Moreover this model common in co-location models also where boundaries blur on where products leave display company and enter integration
9
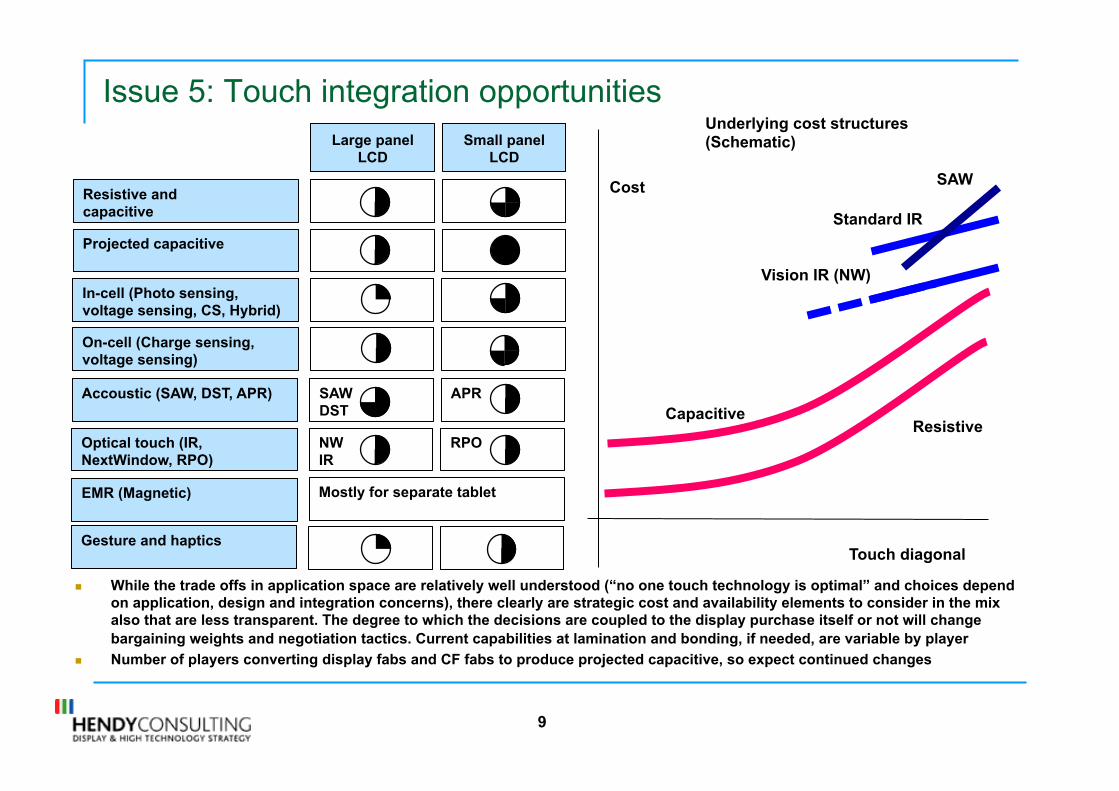
Issue 5: Touch integration opportunities
While the trade offs in application space are relatively well understood (“no one touch technology is optimal” and choices depend on application, design and integration concerns), there clearly are strategic cost and availability elements to consider in the mix also that are less transparent. The degree to which the decisions are coupled to the display purchase itself or not will change bargaining weights and negotiation tactics. Current capabilities at lamination and bonding, if needed, are variable by player
Number of players converting display fabs and CF fabs to produce projected capacitive, so expect continued changes
Large panel LCD
Small panel LCD
Resistive and capacitive
Projected capacitive
In-cell (Photo sensing, voltage sensing, CS, Hybrid)
On-cell (Charge sensing, voltage sensing)
SAW DST
APR Accoustic (SAW, DST, APR)
NW IR
RPO Optical touch (IR, NextWindow, RPO)
Mostly for separate tablet EMR (Magnetic)
Gesture and haptics
Underlying cost structures (Schematic)
Standard IR
Vision IR (NW)
SAW
Resistive Capacitive
Cost
Touch diagonal
10
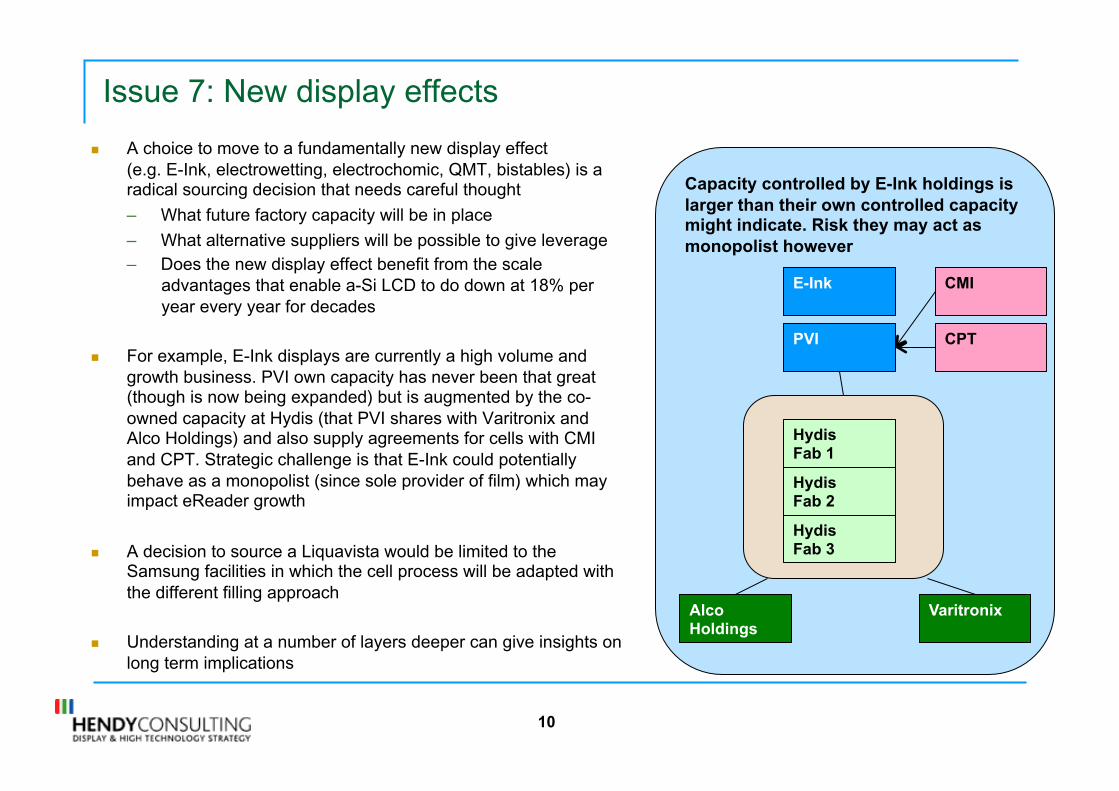
Capacity controlled by E-Ink holdings is larger than their own controlled capacity might indicate. Risk they may act as monopolist however
Issue 7: New display effects
A choice to move to a fundamentally new display effect (e.g. E-Ink, electrowetting, electrochomic, QMT, bistables) is a radical sourcing decision that needs careful thought
– What future factory capacity will be in place
– What alternative suppliers will be possible to give leverage – Does the new display effect benefit from the scale
advantages that enable a-Si LCD to do down at 18% per year every year for decades
For example, E-Ink displays are currently a high volume and growth business. PVI own capacity has never been that great (though is now being expanded) but is augmented by the co-owned capacity at Hydis (that PVI shares with Varitronix and Alco Holdings) and also supply agreements for cells with CMI and CPT. Strategic challenge is that E-Ink could potentially behave as a monopolist (since sole provider of film) which may impact eReader growth
A decision to source a Liquavista would be limited to the Samsung facilities in which the cell process will be adapted with the different filling approach
Understanding at a number of layers deeper can give insights on long term implications
E-Ink
PVI
Hydis Fab 1
Hydis Fab 2
Hydis Fab 3
Varitronix Alco Holdings
CMI
CPT

11
Technology push: Given leading display players have need to find a differentiated story to distinguish them from Chinese new fabs, then we might also expect to see some technology push that involves more pixels and more complex optics. This is an outlook for TV
Feature value: Display players always seeking premia for features. Mostly these are arbitraged away in 18-24 months, but full HD has been a long term valued feature (30% premium)
Issue 8: Pixel level innovation and feature value. Colour and lighting solutions
The move to LED back- and side-lighting was an incremental product change with only really massive implications for complete new supply chains around packaged LEDs and new optical films
– We expect supply chains to settle and for optics to improve. Fewer LEDs will then be needed
Most features (such as wide, or 100 Hz) have price premia that are arbitraged away over 18-24 months. Only a few features have long term value, such as Full HD
Mainstream LCD leaders need to tell capital markets a new story on how they differentiate with Chinese technology recipients. A move to AMOLED or other new technologies is one response, but so will be the application of higher pixel count to serve 3D or increases in colour space with new pixel experiments like RGBY and RGBCY
We have gathered information on previous panel launches to understand feature value and cost plus pricing and can help you understand how to manage conversations about price adders

12
Manufacturing line balance and specification details as well as overall strategic attractiveness of the deal influence custom display costs
Issue 9: Strategic and commercial eagerness as well as manufacturability and line balance issues can be critical
The value of negotiating with a party who really wants your business is a key lever for custom displays
– Moreover understanding the current commercial hunger, by fab if necessary and/or by analysis of public financial information allows you to understand how your deal might be received
– Commercial appetite often outweighs underlying cost competitiveness: given the fixed costs in display making, discounts are available if suppliers want to give them
On a separate note, do not underestimate the implications of manufacturability, of line conversion costs and opportunity costs and line balance issues in quotes for displays
– For years, the costs and opportunity costs of the conversion to transflective display formats kept many of the AMLCD majors out of the mobile display space
– For companies looking to source novel and custom display types then the detailed implications on each process in the display process is critical information that will determine acceptance
Product specification and suppliabiity
Supplier specific commercial and strategic hunger
Manufacturability, line balance
Basket management (Mix of your total purchases)
Custom display sourcing

13
Issue 10: Total basket management
We believe that there is value for each company thinking at a high level of the value of their total basket of LCD purchases – Often the structure of commodity purchasing
organisations does not allow for this high level thinking, given an organisation of several strategic purchasers
– What ways can the total basket be rebid, under a number of different mechanisms to one or more suppliers in a way which might open up new options
We re-iterate some of the more structural solutions here, as they seem to be more and more common solutions for key multinationals
– Also the more that others deploy strategic responses, the riskier that business as standard sourcing relationships become
Take or pay agreements Reduction in flexibility Potential penalties
Capacity co-investments
$300m+
Module co-investment
$50m+
Business model disintermediation
$50m++ & build material sourcing strengths
Co-design, co-locate
Investment to co-locate with LCD factory
Buy/build your own capacity, prepay others
$100m+
Key strategic levers (total basket) with indication of economic upside
Examples: Co-locate JVs with integrators up to Q1 2010

14
Summary
10 levers determine long term cost and “suppliability” across all types of displays
Small panel and large panel economics and strategic issues are very different
Increasing use of strategic relationships by some pushes the whole industry to up its game or be locked out
Stacked bar chart of cost structures in small vs large
panel display making

15
Our case studies in this area: Small panel semi-finished product
Working for a leading small panel company, we used reverse costing techniques (“It costs our client this much to make this finished display and this other supplier is different to us in 5 different ways, so we estimate their costs to be this much”) to determine underlying full and marginal costs of semi-finished filled cells
– At this time differences in fab generation and location led to fairly large differences in underlying cost
When actual price quotes came in, was clear that marginal cost and corporate interest in the business were the more important drivers of price quotes
– However, through a crystal cycle suppliability and technical uniqueness of specific displays became important considerations
Clear though that understanding costs of a supplier at a detailed level can lead to better design-for-cost trade-offs

16
Our case studies in this area: Large panel sourcing, joint venture model
In 1999, Philips made a $1.6bn investment into LG’s displays business in return for a 50% equity stake and a supply agreement against the expanding capacity – We were involved in negotiating this deal
Fundamentally the deal was a market minus supply deal backed by the equity investment
– Ramping share of the total capacity based on a output panels metric adjusted for differential panel size and differential panel yield
Large panel sourcing deal
• Deal between Philips and LPL (now LGD) as part of the investment made by Philips into LPL
• Capacity claim agreement based on areal output effectively adjusted for yield differences (equivalent to input start basis)
Models like this can work but need a fair amount of corporate “give and take”: contact will get you only so far and we have seen some of the pressure areas. These move through the crystal cycle
Market minus constructions are possible but need to be defined clearly against available data sources
Given arbitrage of display pricing (broadly most large panel displays move to a fairly narrow band of pricing on a m2 basis) we expect to see more examples appearing of area based purchasing based on input sheets

17
Our case studies in this area: Custom sourcing
Client was a novel electronics solutions provider looking to source modified STN panels
Complete profiles of all 50 potential players against a carefully selected filter, then reduced the pack to the top 18, and in fact a short list. In this short list key discussion in 3 areas: (1) Technology capabilities and yield risk vs underlying cost structure (2) level of strategic interest in bistability and (3) manufacturing line structure and balance

18
Beyond these we have a range of other ideas:
“Manage down the price decline line” “Market hand” long term
influencing of supply opportunities
• Pricing in the display industry oscillates around a long term 21% per year price decline trend
• However the peaks and troughs are material
• The opportunity that is clearly there is to negotiate a deal where pricing follows the strict average trend line
• The challenge will be in maintaining discipline during the peaks and troughs (Prisoner’s dilemna)
• We would like to see whether the complete supply chain savings from such a move (that would eliminate fluctations) would be large enough to consider this
• Weaker players in the industry (with narrower product portfolios always offer lower pricing)
• You would need to work out whether the effort of splitting demand into many separate buckets and then playing these off against the weaker players in the industry would be a valuable strategy
• On a longer term basis, you could also seek to influence how many new firms enter the LCD industry (with for example giving some commitments on purchase for example) to destroy the power of the Big 5
19
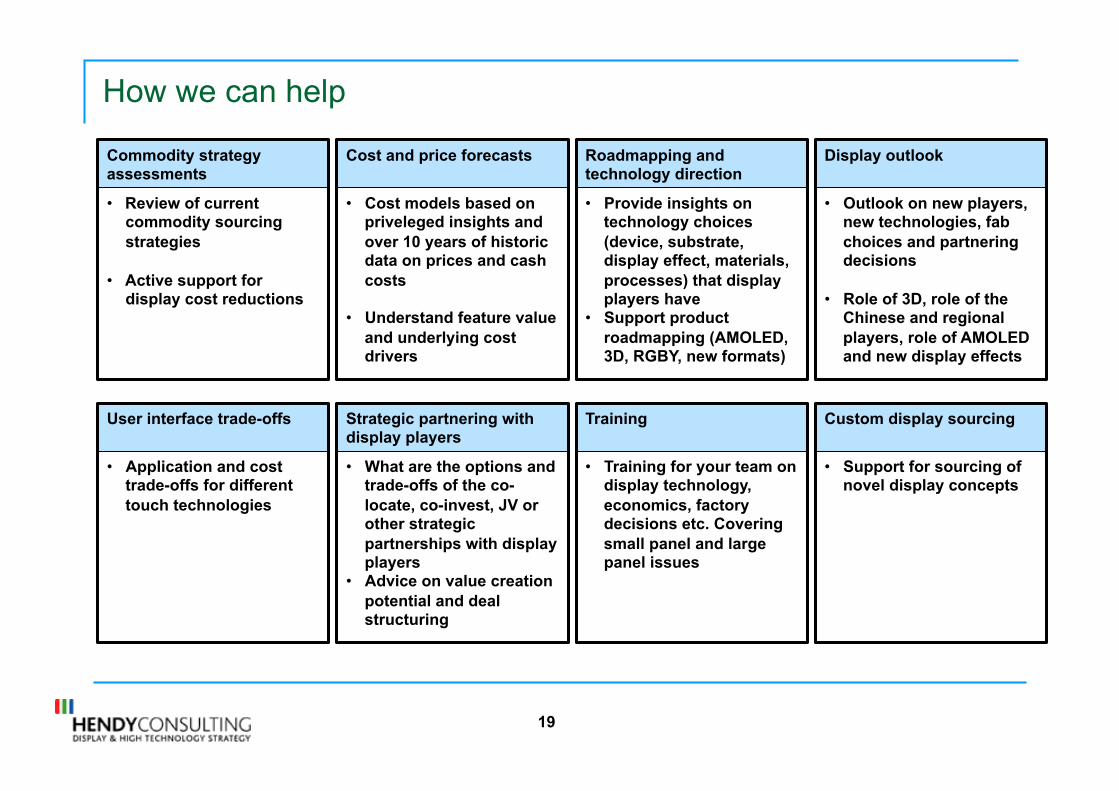
How we can help
Commodity strategy assessments
• Review of current commodity sourcing strategies
• Active support for display cost reductions
Cost and price forecasts
• Cost models based on priveleged insights and over 10 years of historic data on prices and cash costs
• Understand feature value and underlying cost drivers
Roadmapping and technology direction
• Provide insights on technology choices (device, substrate, display effect, materials, processes) that display players have
• Support product roadmapping (AMOLED, 3D, RGBY, new formats)
Display outlook
• Outlook on new players, new technologies, fab choices and partnering decisions
• Role of 3D, role of the Chinese and regional players, role of AMOLED and new display effects
User interface trade-offs
• Application and cost trade-offs for different touch technologies
Strategic partnering with display players
• What are the options and trade-offs of the co-locate, co-invest, JV or other strategic partnerships with display players
• Advice on value creation potential and deal structuring
Training
• Training for your team on display technology, economics, factory decisions etc. Covering small panel and large panel issues
Custom display sourcing
• Support for sourcing of novel display concepts