1.0 Pharmaceutical Market
41
1.1 Pharmaceutical Sales
-
Upload
ilukicscribd -
Category
Documents
-
view
21 -
download
0
description
market
Transcript of 1.0 Pharmaceutical Market

1.1 Pharmaceutical Sales

1.1 Pharmaceutical Sales
3 Internal usage only
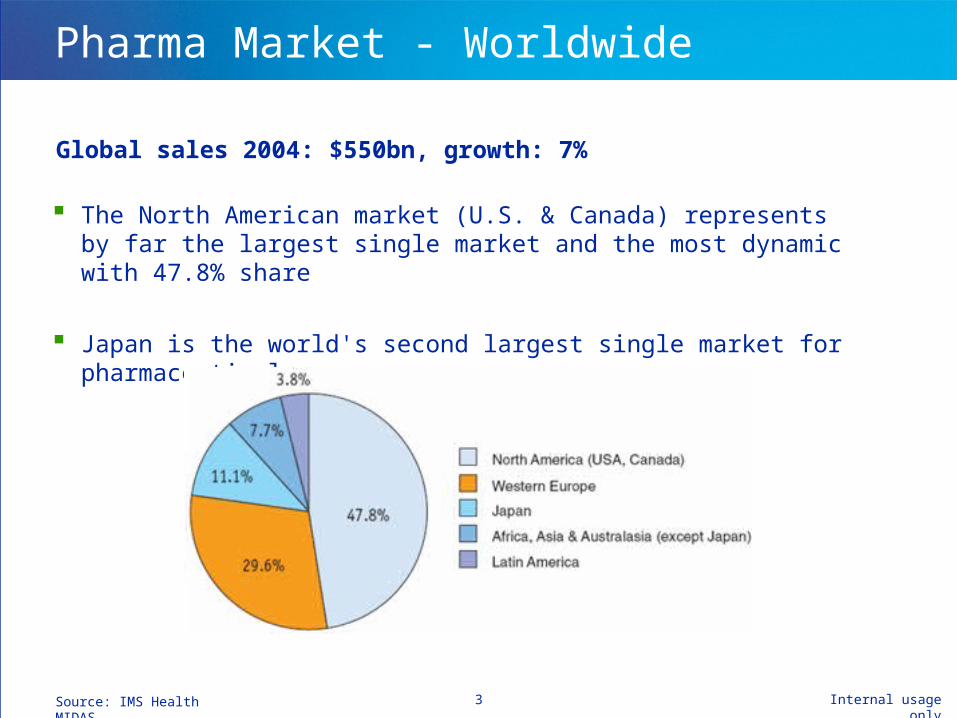
Pharma Market - Worldwide
Global sales 2004: $550bn, growth: 7%
The North American market (U.S. & Canada) represents by far the largest single market and the most dynamic with 47.8% share
Japan is the world's second largest single market for pharmaceuticals
Source: IMS Health MIDAS

Internal usage only4
Pharma Market - Typology
BIOGENERICS are foreseen to share soon the same market
Source: IMS Health
Presence of the different types of drugs on the pharma market
The pharmaceutical market includes three types of medicines:
In 2004, the market of biopharmaceuticals was worth $55bn, a growth of ~17% with respect to 2003
The global sales for generics reached $35bn in 2004, growing about 10%
Pharmaceuticals:
New drugs developed by using chemical synthesis
Biopharmaceuticals:
New drugs developed by using biotechnologies
Generics:
Unbranded version of off-patent drugs

5 Internal usage only
Pharma Market - Insight US
Growth in 2004
Source: Pharmaceutical Engineering, Jul/Aug 2005, 25 (4) 5 Internal usage only
Biopharmaceutical market grows faster
The new blockbusters are more and more bio products (13 out of 67 in total)
Biotech companies such as Amgen, Genentech, Serono and Genzyme are within the top 50 companies
Despite increasing sales in 2004, the US with 7% is experiencing the first drop below double-digit growth since 1995. However, the potential to grow for the market is still high and the growth is foreseen at 8-9% pace in 2006
Generics are promoted by the governmental policy to reduce healthcare costs
In 2004, generics accounted for more than 30% of volume consumption. However, due to low prices they account only for 8% of drug sales by value
Generics market is predicted to grow at rate of 14% annually

6 Internal usage only
Pharma Market - Insight Canada
A bright future in biotech
About 500 diversified companies leading in biotech research
50% of product approvals are expected to be biological products by 2010
A key role of generics
In 2004, 40% of annual prescriptions were generics, even if they accounted for only 15% of the annual expenses
6 Internal usage only
Stable growth of pharmaceuticals and Biotech on the upspring
Source: Pharmaceutical Engineering, Mar/Apr 2004, 25 (2)

7 Internal usage only
Pharma Market - Insight Japan
Japanese market will suffer with a limited 3% growth through 2008 due to the governmental policy to contain costs
In 2004 Japan’s market is worth $60bn - growth: 3%
Pharmaceutical market features particular large share of foreign companies of about 44 %
Dramatic increase in national medical costs forecast due to rising life expectancy and improved medical technology will trigger severe drop of pharmaceutical prize index
Source: Pharmaceutical Engineering, Mar/Apr 2003, 23 (2) 7 Internal usage only

8 Internal usage only
Pharma Market - Insight Western Europe
Source: EFPIA members associations
5 main protagonists:
Germany
France
UK
Italy
Spain
Sales 2004: ~ $163bn Growth rate: 4-5%
8 Internal usage only
In 2006 growth is expected to stay constant at a rate of 4-5%

Internal usage only9
Generics Market - Insight Western Europe
The recent politics of cost containment are promoting the use of generics in all the main European markets. An exceptions is France where the low penetration of generics is probably related to the low level of prices, also for branded medicines
9 Internal usage onlySource: EFPIA members associations
Share in % accounted for by generics in pharmacy market - sales value 2003

Internal usage only10
Pharma Market - Insight Latin America
Latin America (LA) pharma sales in 2003: $21.8bn
Source: IMS Health
Generics
Governmental policy of cost reduction is promoting the use of unbranded drugs
However, generics must fight with cheap copy products, which are not tested for bioequivalence
Latin America’s demand for pharmaceuticals is highly growing
Increasing demand of prescription drugs related to the increased welfare
Mexico and Brazil are the most stable markets in LA

Internal usage only11
Main Markets - Future Trends
The global market size will continue to grow, even if at a contained rate of 6-7%, reaching $640-650bn by 2006
However, there are new elements in the global pharmaceutical markets that need to be taken into consideration. These are:
Source: IMS Health
The presence of new markets such as CEE, China, and India
growing demand for pharmaceuticals
increasing outsourcing and partnerships with local companies
Higher profitability in niche markets
a number of companies move away from the blockbuster model to target at specific patients, i.e. therapies for rare cancer

12 Internal usage only
Audited drug sales in the 8 new members in 2004: $9.2bn - growth: 16%
Market is expected to be worth $13-14 billion by 2010
Generics
In 2002, generics accounted for about 70% of all prescriptions issued in Poland, Hungary and the Czech Republic. They also accounted for more than 40% of the value of the retail market in Poland and the Czech Republic, and about 35% of the value of the retail market in Slovakia and Slovenia
New Markets - Insight CEE
The EU expansion to the Central & Eastern European (CEE) countries with the free circulation of goods generated a new emerging market
Source: IMS Health 12 Internal usage only

Internal usage only13
New Markets - Insight China
Source: IMS MIDAS Quantum
China is world‘s industrial powerhouse - the increasing welfare of its population spurs the demand for pharmaceutical products
13 Internal usage only
China’s highest growth in 2004
China has been recording an impressive double-digit growth of 30% with a market size of ~ $8.5bn. In 2006 the Market will reach $13–14bn with growth of 17-18%. China is expected to become the fifth largest drug market in the world by 2010

Internal usage only14
New Markets - Insight India
Source: IMS MIDAS Quantum
India’s market worth in 2004: $4.6bn
India market ranks thirteenth world wide, but it is expected to have a 80% increase reaching $8.3bn by 2009
A competitive generics market
Ranbaxy or Dr. Reddy’s are top generics producers also outside India
India has enormous market potential due to the increasing welfare of a huge part of the population!
14 Internal usage only
Top 10 Pharma companies in India in 2004

1.2 Pharmaceutical Companies

Internal usage only16
Top 20 Pharmaceutical Companies
Source: http://www.contractpharma.com/top_comp.php#pharma
Rank Company Sales Country1 Pfizer $46.133 US2 GlaxoSmithKline $31.417 UK3 Sanofi-Aventis $29.596 France4 J&J $22.128 US5 Merck $21.494 US6 AstraZeneca $21.426 UK7 Novartis $18.497 CH8 Bristol-Myers Squibb $15.482 US9 Roche $13.840 CH
10 Lilly $13.059 US
11 Wyeth $13.021 US
12 Abbott $11.462 US
13 Takeda $8.538 Japan
14 Boehringer-Ingelheim $7.667 Ger
15 Schering-Plough $6.417 US
16 Bayer $5.529 Ger
17 Novo Nordisk $4.848 DK
18 Schering AG $4.171 Ger
19 Sankyo $4.152 Japan
20 Merck KgA $3.907 Ger
Based on pharmaceutical revenues in 2004 (in millions)

Internal usage only17
Top 10 Generics Companies
Generics sales - 2Q 2005 (in millions)
Source: www.leaddiscovery.co.uk/reports/The_World_Top_Ten_Generic_Companies.html
Rank Company Sales Country
1 Teva Pharmac. Industry $1,230 Israel
2 Sandoz $832 CH / Ger
3 Merck Generics $435 Ger
4 Watson Pharmaceuticals $313 US
5 Mylan Laboratories $253 US
6 Schwarz Pharma $238 Ger
7 Pliva $191 Croatia
8 Barr Pharmaceuticals $188 US
9 Alpharma $103 Norway
10 Actavis $90 Iceland

Internal usage only18
Top 10 Biopharmaceutical Companies
Based on biopharmaceutical revenues in 2004 (in millions)
Source: http://www.contractpharma.com/top_comp.php#pharma
Rank Company Sales Country
1 Amgen $9.977 US
2 Genentech $3.749 US
3 Serono $2.178 CH
4 Biogen Idec $2.112 CH/US
5 Genzyme $1.479 US
6 Gilead $1.242 US
7 MedImmune $1.124 US
8 Chiron $990 US
9 Millennium $349 US
10 Intermune $147 US

1.3 Pharmaceutical Drugs and Compounds

Internal usage only20
Top 10 Pharmaceutical Products
Source: IMS MIDAS Quantum
NOTE: Sales are in U.S. dollars for the 12 months ending June 2005. The figures cover pharmaceutical channel purchases from pharmaceutical wholesalers and manufacturers; they include prescription and certain over-the-counter data and current manufacturer prices.
Pfizer’s Lipitor is number-one drug with annual sales exceeding $10 billion
The top 10 therapies classes account for 30% of the total world market with global sales in excess of $50 billion

Internal usage only21
Forecast for the leading Therapy Classes
A market growth is expected as the population ages!
Source: IMS Health
By 2005 more than 20% of the developed countries population will be over 60 years old (source: UN)
Demand for treating conditions such as hypertension, diabetes, high cholesterol levels, osteoarthritis, menopause symptoms, and prostrate problems will increase
Oncology will have the highest global growth rate of 17–18% in 2006 with a market reaching more than $40 billion by 2008
This is due to better diagnostics, the introduction of further innovative products and the increased patient access to these innovative treatments. Moreover, cancer drugs cannot be impacted by over-the-counter switching

Internal usage only22
New Medicines Launch
70% of sales of new medicines* marketed since 1999 are generated on the US market
Source: IMS Health, 2004
* New medicines cover all new active ingredients marketed for the first time on the world market during the period 1999-2003
Between 1990-2004, R&D investment in US grew 4.5 vs. only the 2.7 times in Europe
Compared to the US, Europe is seen as a less attractive R&D investment location in terms of market conditions and incentives for the creation of new centers

Internal usage only23
Pharma R&D - The Drug Approval Process
Source: EFPIA members associations (official figures)
* Di Masi J., Tufts University, Centre for the Study of Drug Development, November 2001
Startinginvestigation:10,000 entities
Preclinical test: in vitro and in vivo tests
4-5 years
1 goes to commerciali-sation8 years
Phase II Phase III Phase IV
9 year 10 year
Phase I
Safety & tolerability testson 20-80 healthy
volunteers
N D A
FDA approval
12-13 year
Clinical efficacy on 100-300 volunteers
Definitive assessment on 1000-3000 volunteers
Safety surveillance
Clinical Trials on human beings
NDA: New Drug Application
Long: It takes an average of 12-13 years for a new drug from synthesis to medicines basket
Costly: R&D of a chemical or biological entity costs > $1bn*
Of a high risk nature: only 1 out of 10,000 synthesized substances becomes a marketable medicine

1.4 Pharmaceutical Production: Status & Trends

Internal usage only25
Insight US – I
The United States: biggest market and strong producer
Highlights:
National production:US pharmaceutical manufacturing is a dynamic industry answering global economic growth, demographics of an aging population and the production of newer, specialized therapeutics
Strong location:19 out of the top 50 global pharmaceutical companies have corporate headquarters in the US
Not only Blockbusters:Lower costs are needed to allow for better-targeted medicines aimed at smaller patient groups
Contract manufacturing is $30bn market and will grow to $48bn by 2008
Source: Pharmaceutical Engineering, Jul/Aug 2005, 25 (4) 25 Internal usage only

Internal usage only26
Insight US – II
Increase efficiency and reduce cost!
Challenges:
Government and public pressure to reduce overall healthcare costs
Regulatory agencies require compliance with tougher cGMP standards
Contract manufacturing shifts to countries with lower production costs but still complying with high manufacturing standards (e.g. India)
Strategies:
Larger companies seek to integrate previously separate functions, such as development and manufacturing operations
Large scale improvements of productivity and efficiency in pharmaceutical production (i.e. by introducing FormWeigh.Net)
Source: Pharmaceutical Engineering, Jul/Aug 2005, 25 (4) 26 Internal usage only

Internal usage only27
Insight Canada – I
Advantage on pharmaceutical production costs
Highlights:
Favorable environment:stable governments, diversified society and being US neighbor are major advantages for potential Canadian investments
Big economic factor:over 50 pharmaceutical companies employ more than 24 000 people all over Canada
Advantage Canada:KPMG estimated Canada’s pharmaceutical production to have lowest costs worldwide and a 6% cost advantage vs. the US in 2004
Continuous investments:several companies have upgraded plant facilities and installed new equipment to increase production efficiency
Source: Pharmaceutical Engineering, Mar/Apr 2004, 25 (2) 27 Internal usage only

Internal usage only28
Insight Canada – II
Challenges:
Governmental cost-cutting measures will impact on pharmaceutical companies and their production sites
Patent protection lags behind other major western countries
Strategies:
Maximize production by increasing manufacturing efficiency
Improvements to patent legislation and further tax incentives to stimulate future investments
Source: Pharmaceutical Engineering, Mar/Apr 2004, 25 (2)
Facing the future with higher production efficiency and improved legislation
28 Internal usage only

Internal usage only29
Insight Japan – I
Many players at high technological level
Highlights:
Big numbers:Japan’s pharmaceutical industry features a very large number of small national producers (~1400 in total)
Crossing the gap:Japanese chemical companies are developing their own pharmaceutical production technologies
High technological level in manufacturing:since the mid 1990‘s, export dominates the pharmaceutical trade, demonstrating Japan‘s cutting-edge production technology
Source: Pharmaceutical Engineering, Mar/Apr 2003, 23 (2) 29 Internal usage only

Internal usage only30
Insight Japan – II
New regulations are challenging for national producers
Challenges:
The Pharmaceutical Affairs Law (PAL) will encourage the presence of foreign pharmaceutical products, thus challenging local manufacturers
Little growth in pharmaceutical production due to biennial governmental drug price schedule
Strategies:
Higher industrial productivity and fast adoption of global unified rules and standards to increase competitiveness
Intensifying national Merger & Acquisitions to face international competitors
Source: IMS Health, Pharmaceutical Engineering, Mar/Apr 2003, 23 (2) 30 Internal usage only
Internal usage only31
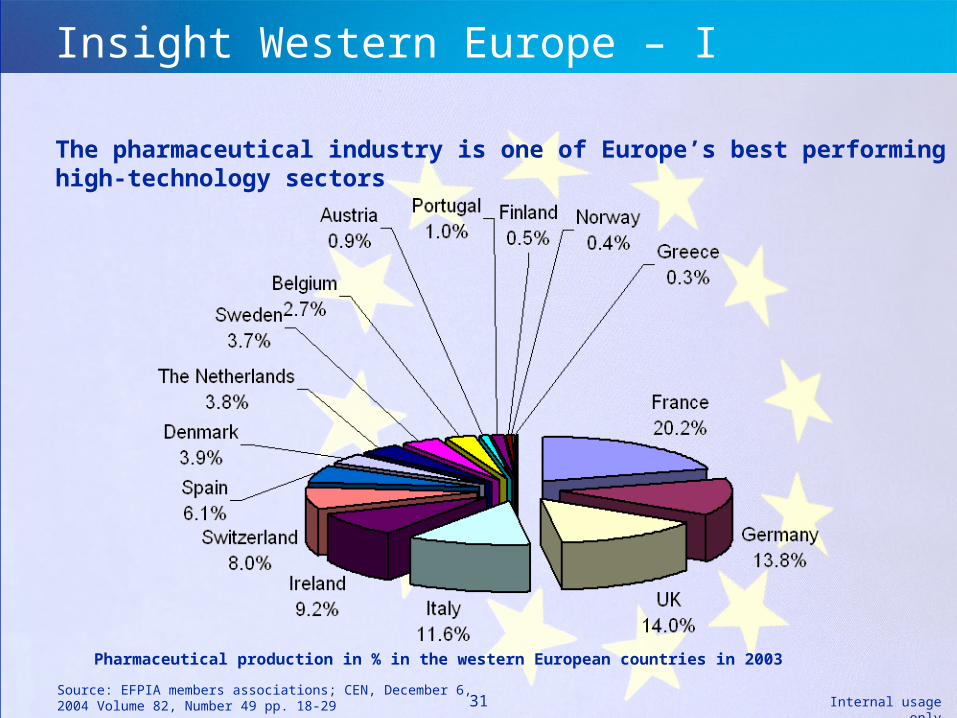
Insight Western Europe – I
The pharmaceutical industry is one of Europe’s best performing high-technology sectors
Source: EFPIA members associations; CEN, December 6, 2004 Volume 82, Number 49 pp. 18-29 31 Internal usage only
Pharmaceutical production in % in the western European countries in 2003
Internal usage only32
Insight Western Europe – II
A thriving pharmaceutical manufacturing with strong technical competence and expertise
Highlights:
Innovation, excellent education system and highly skilled workforce are the strong points to achieve exemplary compliance of facilities for top quality products
Switzerland is still a big protagonist within the world wide drugs manufacturers
Both, UK and France count more than 500 licenses to manufacture drugs
Germany is still one of the top manufacturers in Europe, even if the governmental cost containment politics in 2004 led to lower local investments by big pharma companies
Source: Pharmaceutical Engineering, Jan/Feb 2004, 24 (1) & Nov/Dec 2004, 24 (6); 32 Internal usage only

Internal usage only33
Insight Western Europe – III
The main producers have to face the global rationalization of manufacturing activities
Challenges
An increasingly competitive global marketplace for investment in manufacturing capability, e.g. CEE, China, and India
Strategies
Patient-specific drugs will dominate future markets requiring high flexibility concerning frequent changes in demand and capacity-planning The “make to order” manufacturing facility of the future will require high innovation and excellent engineering skills
Source: Pharmaceutical Engineering, Mar/Apr 2003, 23 (2) 33 Internal usage only

Internal usage only34
Insight CEE – I
Favorable tax regimes and incentives for foreign companies will encourage drug makers to invest in facilities in CEE
Highlights
350 pharmaceutical manufacturers only in the polish market registering more than 8,000 medicinal products
A big opportunity for generic drug manufacturers: profit from low labor, set-up, production costs, and raising demand
Top five pharmaceutical players are already present on the territory and many others start to expand
Source: Pharmaceutical Engineering, May/Jun 2004, 24 (3); PriceWaterHouseCoopers; IMS Health 34 Internal usage only

Internal usage only35
Insight CEE – II
However, the unstable and unpredictable legal environment can still limit investments and development
Challenges
Few experienced GMP professionals
Poor or absence of data exclusivity and protection of intellectual property
Strategies
Huge investment in the pharmaceutical sector to improve know-how and seek for external support or guidance
Reorganization of the local manufacturing: e.g. most of the Polish pharmaceuticals sector has already been privatized or sold to foreign investors
Source: Pharmaceutical Engineering, May/Jun 2004, 24 (3); PriceWaterHouseCoopers; IMS Health 35 Internal usage only

Internal usage only36
Insight China – I
Multinationals consider China as biggest potential future market
Highlights
According to IMS, there are already 1,700 Sino-foreign joint ventures
Roche, Novartis, GSK, and Pfizer rank among the top 10 companies which plan to set local manufacturing facilities
A great opportunity for biopharmaceutical manufacturing sites: low costs and high expertise in biology and biotechnology
Attractive tax incentive for foreign investors in the manufacturing
6,000 domestic producers with 97% of their production being copies of foreign products
Source: PriceWaterHouseCoopers & IMS Health 36 Internal usage only

Internal usage only37
Insight China – II
However, major regulatory improvements are still needed
Challenges
China’s poor record of protecting intellectual property can deter both indigenous and foreign companies from launching new products
Counterfeit drugs are supposed to kill 192,000 Chinese every year!
A complex regulatory processes to obtain drug recognition and start production
Strategies
A State Food & Drug administration (SFDA) has been specifically set up to streamline processes and ensuring compliance with GMP
Source: PriceWaterHouseCoopers & IMS Health 37 Internal usage only

Internal usage only38
Insight India – I
India is becoming a key manufacturing destination for the multinationals: costs to set-up and run a production facility are 80% lower than in the West
Highlights
70% of a total of 60,000 manufactured formulations are managed by 10,000 domestic firms
Multinational companies, such as Teva, Sandoz, and Ratiopharma, are starting production in India to increase market share
Tax break for foreign investors in the local manufacturing facilities
A thriving biopharmaceutical industry: six of the most important biopharmaceutical products are manufactured in India
Source: Pharmaceutical Engineering, Nov/Dec 2005 38 Internal usage only

Internal usage only39
Insight India – II
And the regulatory apparatus is evolving with the Industry
Challenges
Despite the Patents Act, ratified in April 2005, full intellectual protection is not yet reached
Counterfeit or substandard manufactured drugs are still an issue!
Partly poor infrastructure: shortages on water supply, electric power, paved roads and rail transportation continue to hamper growth
Strategies
Hi-tech industry and hi-GMP with 60% of the manufacturing sites already approved by US FDA
High quality ancillary industry: all needed equipment is locally produced (glass bottles, vials, capsules, blisters, packaging,…)
Source: Pharmaceutical Engineering, Nov/Dec 2005 39 Internal usage only

Internal usage only40
Insight Latin America – I
Strong multinational manufacturing presence
Source: Pharmaceutical Engineering, Jan/Feb 2005, 25 (1)
Highlights
Major multinationals, e.g. Pfizer, Novartis, Roche, GSK, Aventis, Bristol-Myers Squibb, Schering Plough, have local production facilities or partnership with local contractors
Huge investments in the production have been realized to increase scale and productivity of top products
The Bioindustry park: a very promising source of new medicines and genetic discovery which will attract new companies, enterprises and business
Internal usage only41
Insight Latin America – II
Still unfavorable tax regimes and no incentives for foreign investors
Source: Pharmaceutical Engineering, Jan/Feb 2005, 25 (1)
Challenges
FDA has identified several issues dealing with unmatched GMP requirements
Counterfeit medicines and lack of patent protection are still an issue
Strategies
Know-who rather than know-how: understanding the culture diversity!
Alliance and partnership with local manufacturers to outsource most of the activities
Establish a base in the most stable regions, i.e. Brasil, Mexico and then expand to the other LA countries